The dimeric Golgi protein Gorab binds to Sas6 as a monomer to mediate centriole duplication
- Department of Genetics, University of Cambridge, United Kingdom
- Division of Biology and Biological Engineering, California Institute of Technology, United States
- Institute of Biochemistry and Biophysics, Polish Academy of Sciences, Poland
- Department of Medical Biochemistry, Max Perutz Labs, Medical University of Vienna, Austria
- Department of Structural and Computational Biology, Max Perutz Labs, University of Vienna, Austria
Figures
Figure 1 with 3 supplements
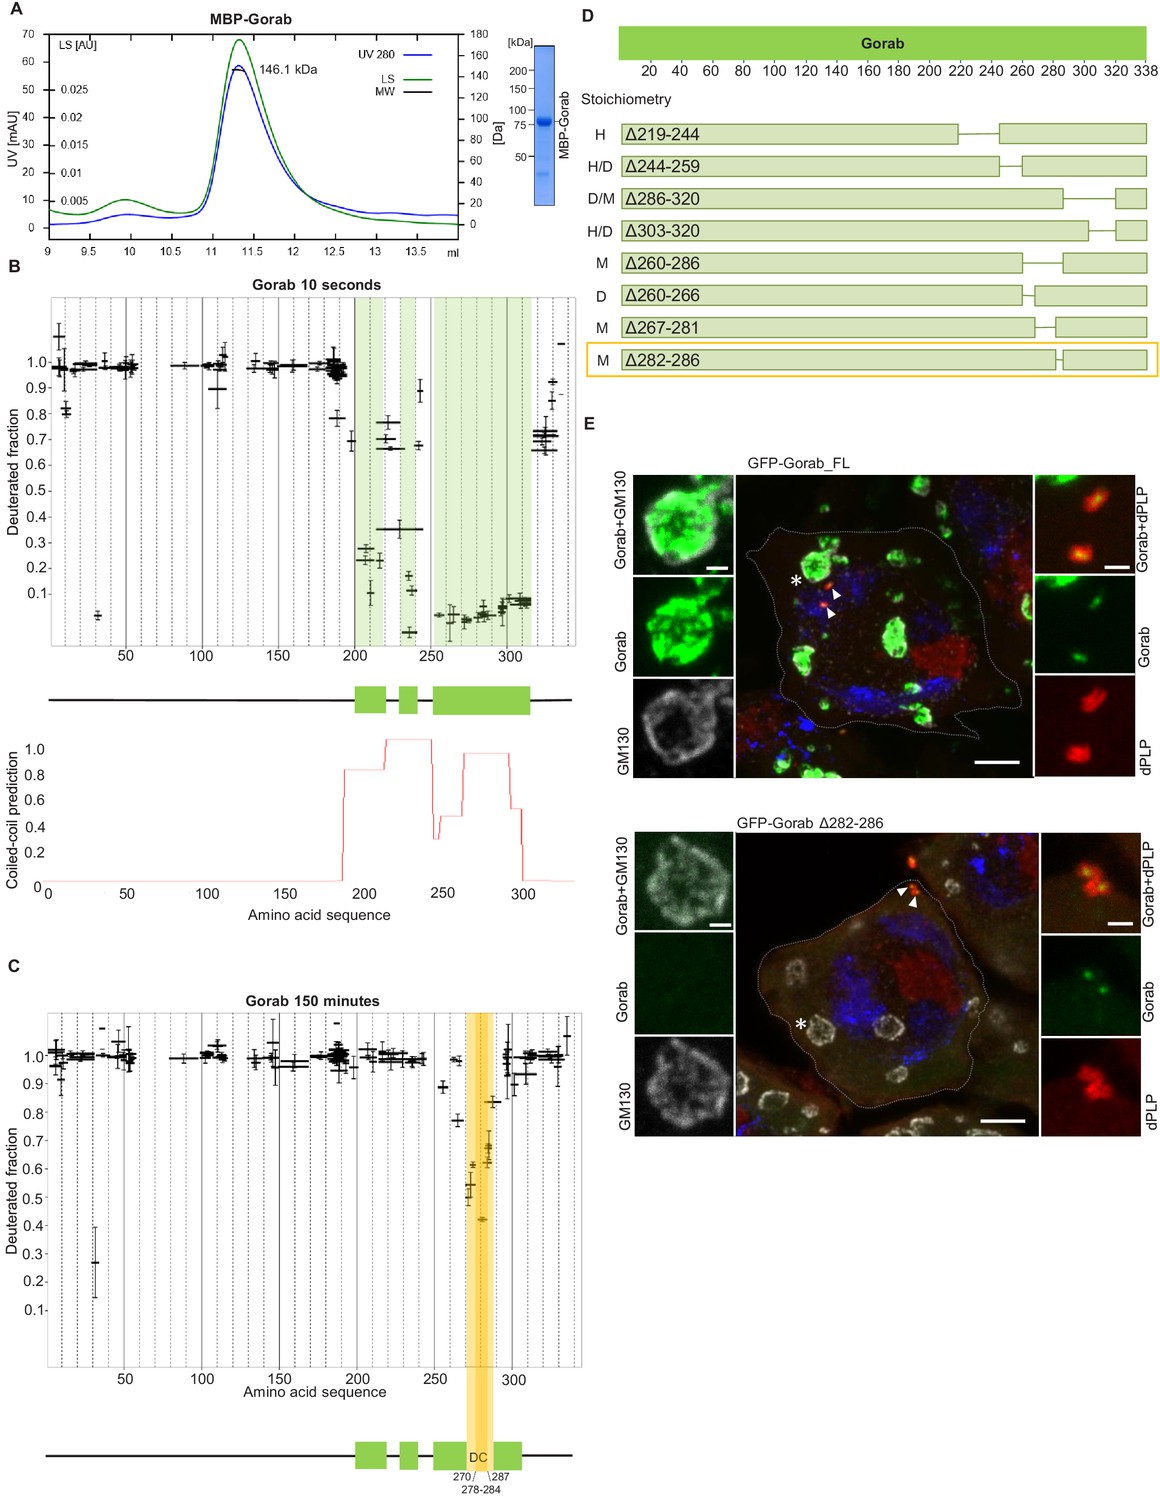
Gorab dimerizes through its C-terminal part to achieve Golgi localization.
(A) Size exclusion chromatography-multiple angle light scattering (SEC-MALS) of Gorab. Blue: absorbance at 280 nm; green: light scattering (LS); short black line: molecular mass (Mm) of MBP-Gorab. Mm of MBP-Gorab monomer, 79.4 kDa. SDS-PAGE showing full-length MBP-Gorab after SEC. (B) Pattern of hydrogen–deuterium exchange (HDX) in Gorab peptides following 10 s incubation with deuterium oxide (heavy water). Black bars on Woods plots represent proteolytic peptides identified by mass spectrometry (MS) and positioned in relation to the Gorab amino acid sequence. The Y-axis shows fraction of deuteration compared to maximum level of measured deuteration. Mean of three experiments is shown. Error bars represent standard deviations. The N-terminal part of Gorab is highly flexible, whereas its C-terminal part has three protected regions (green blocks) that align with coiled-coil regions predicted by COILS (Lupas et al., 1991) (C) HDX pattern after 150 min incubation with D2O. The region between aa 270–287 (highlighted in yellow) retains highly protected, and the region aa 278–284 with the highest protection is termed the dimerization core (DC). (D) Schematic showing outcome of SEC-MALS with Gorab having indicated deletions. H: higher-order structure; D: dimer; and M: monomer. Red box surrounds Gorab variant with shortest deletion (Δ282–286) that disrupts dimer formation corresponding to most protected region identified by HDX-MS (yellow). SEC-MALS data for each construct is presented in Figure 1—figure supplement 2 (E) Localization of full-length and Δ282–286 Gorab (green) in G2 phase primary spermatocytes of adult males. N-terminally GFP-tagged Gorab transgenes were inserted in the same genomic location to ensure comparable expression by a constitutive poly-ubiquitin promoter. Immunostainings were performed with anti-GM130 (cis-Golgi marker, gray) and anti-dPLP (centrosome marker, red) antibodies. DAPI staining (blue) identifies the characteristic three-lobed nucleus of primary spermatocytes prior to meiosis. The dashed line outlines the border of a single spermatocyte. Golgi, indicated by asterisks, and centrosomes, by arrowheads, are shown in insets. In total, 30 primary spermatocytes from four transgenic testes expressing full-length Gorab and 32 primary spermatocytes from four testes expressing Gorab Δ282–286 were imaged. All showed the same Gorab distribution. Scale bar: 5 µm; scale bar in insets: 1 µm.
Figure 1—figure supplement 1
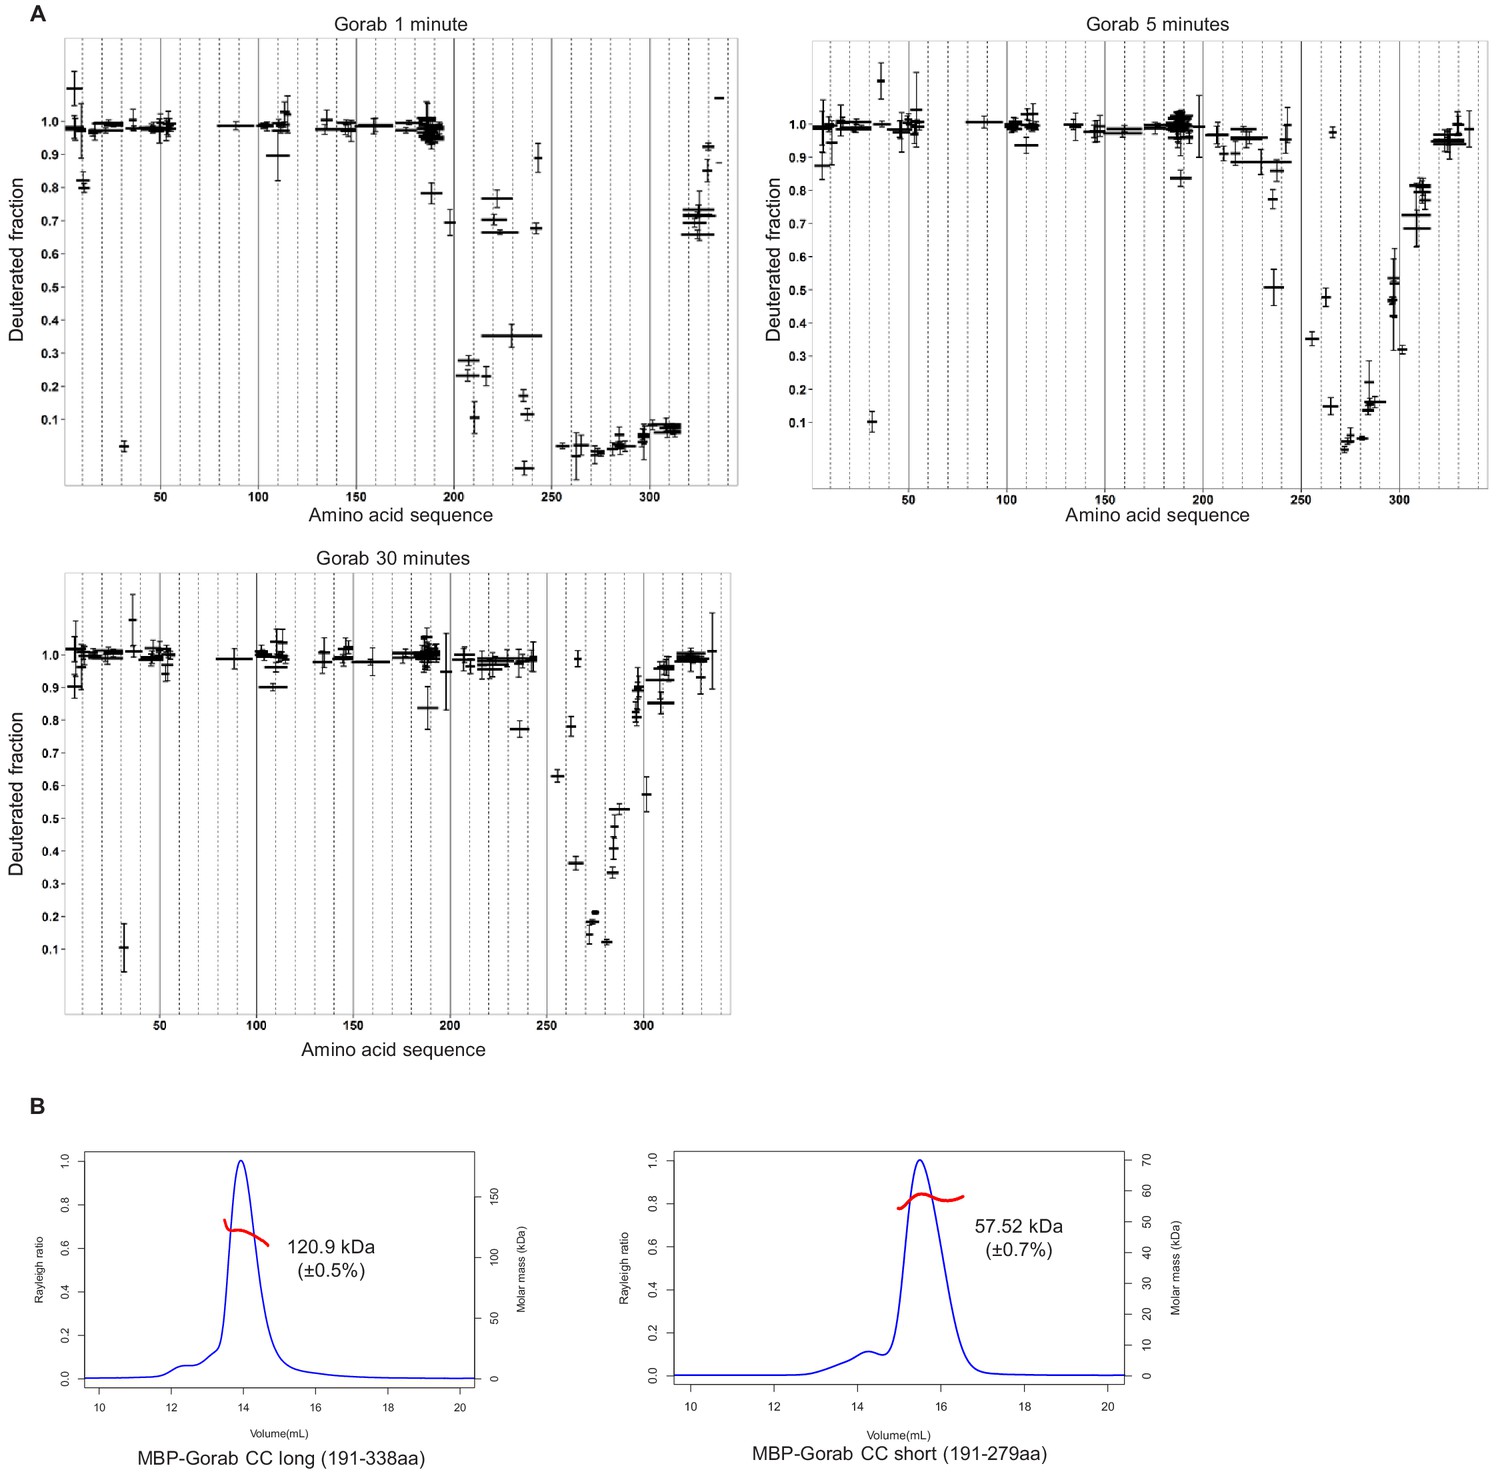
Dimerization of Gorab through interactions between the coiled-coil domains in its C-terminal region.
(A) Hydrogen–deuterium exchange pattern of Gorab following 1, 5, or 30 min incubations with D2O. Black bars represent proteolytic peptides identified by mass spectrometry and positioned in relation to the Gorab amino acid sequence. Y-axis indicates the fraction of deuteration compared to maximum level of measured deuteration. Mean of three experiments is shown. Error bars represent standard deviations. (B) Size exclusion chromatography coupled with multiangle light scattering analysis of C-terminal Gorab constructs. MBP-Gorab CC long (aa 191–338) and MBP-Gorab CC short (aa 191–279). Respective theoretical molar masses, 58.2 and 51.5 kDa. Blue line: Rayleigh ratio; red line: observed mass (Mw); Mw error shown in brackets.
Figure 1—figure supplement 2

Requirements of regions of the Gorab coiled-coil region for dimerization as revealed by size exclusion chromatography (SEC) coupled with multiangle light scattering of Gorab deletions.
Blue: absorbance at 280 nm; short black line: molecular mass (Mm) of MBP-Gorab. SDS-PAGE showing eluted fractions of MBP-Gorab after SEC.
Figure 1—figure supplement 3
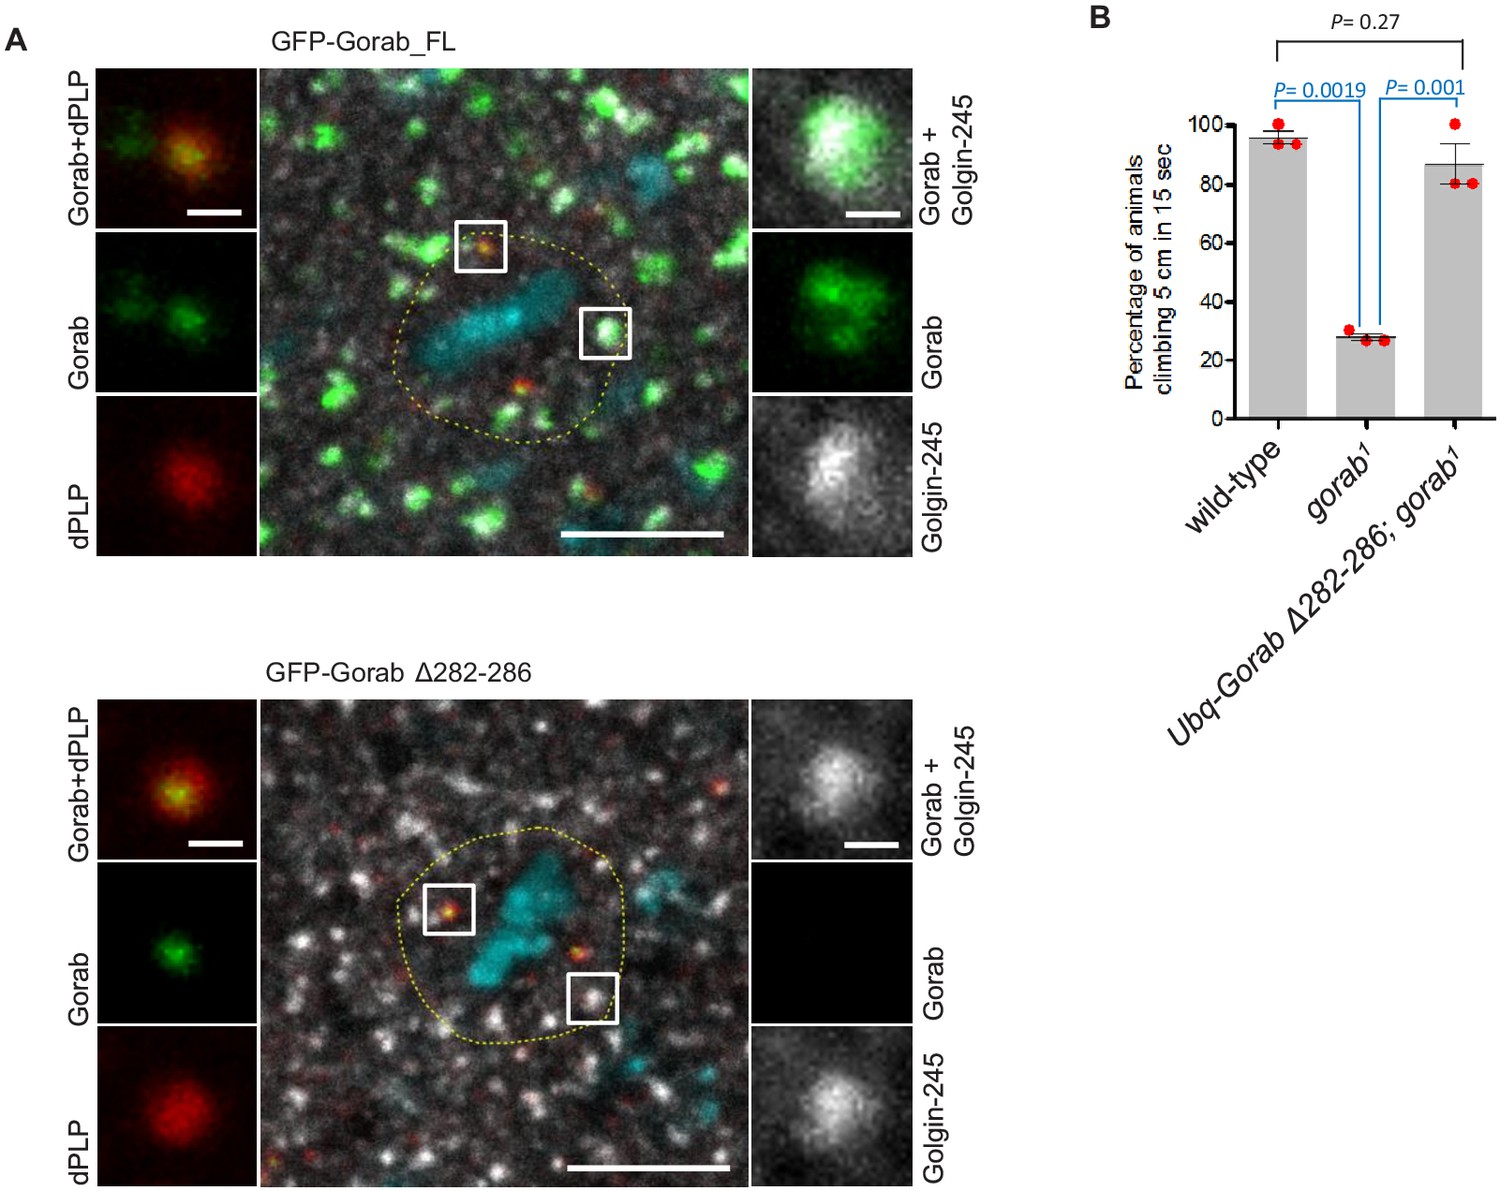
Gorab Δ282–286 localizes to centrioles but not to the Golgi in mitotic cells of imaginal discs.
(A) N-terminally GFP-tagged Gorab transgenes were inserted into the same genomic location to ensure comparable expression from a constitutive poly-ubiquitin promoter. Immunostainings were performed with anti-Golgin-245 (trans-Golgi marker, gray) and anti-dPLP (centrosome marker, red) antibodies. DAPI staining (blue) visualizes chromosomes. The dashed lines outline borders of single cells in metaphase. Scale bar: 5 µm; scale bar in insets: 0.5 µm. (B) Climbing assays of wild type (WT), gorab1 and gorab1; Gorab Δ282–286 flies. Cohorts of 15 flies raised at 25°C were scored for the number of individuals able to climb 5 cm in 15 s after being tapped down to bottom of vial. Means and standard errors are shown for N = 3 independent experiments per genotype; n = 15 flies investigated in each experiment. p-Values of two-tailed, unpaired t-tests are shown. p-Value in blue indicates significant difference (95% confidence interval).
-
Figure 1—figure supplement 3—source data 1
Percentage of flies climbing 5 cm in 15 s in three independent biological replicates of the indicated genotypes.
- https://cdn.elifesciences.org/articles/57241/elife-57241-fig1-figsupp3-data1-v4.xlsx
Figure 2 with 2 supplements
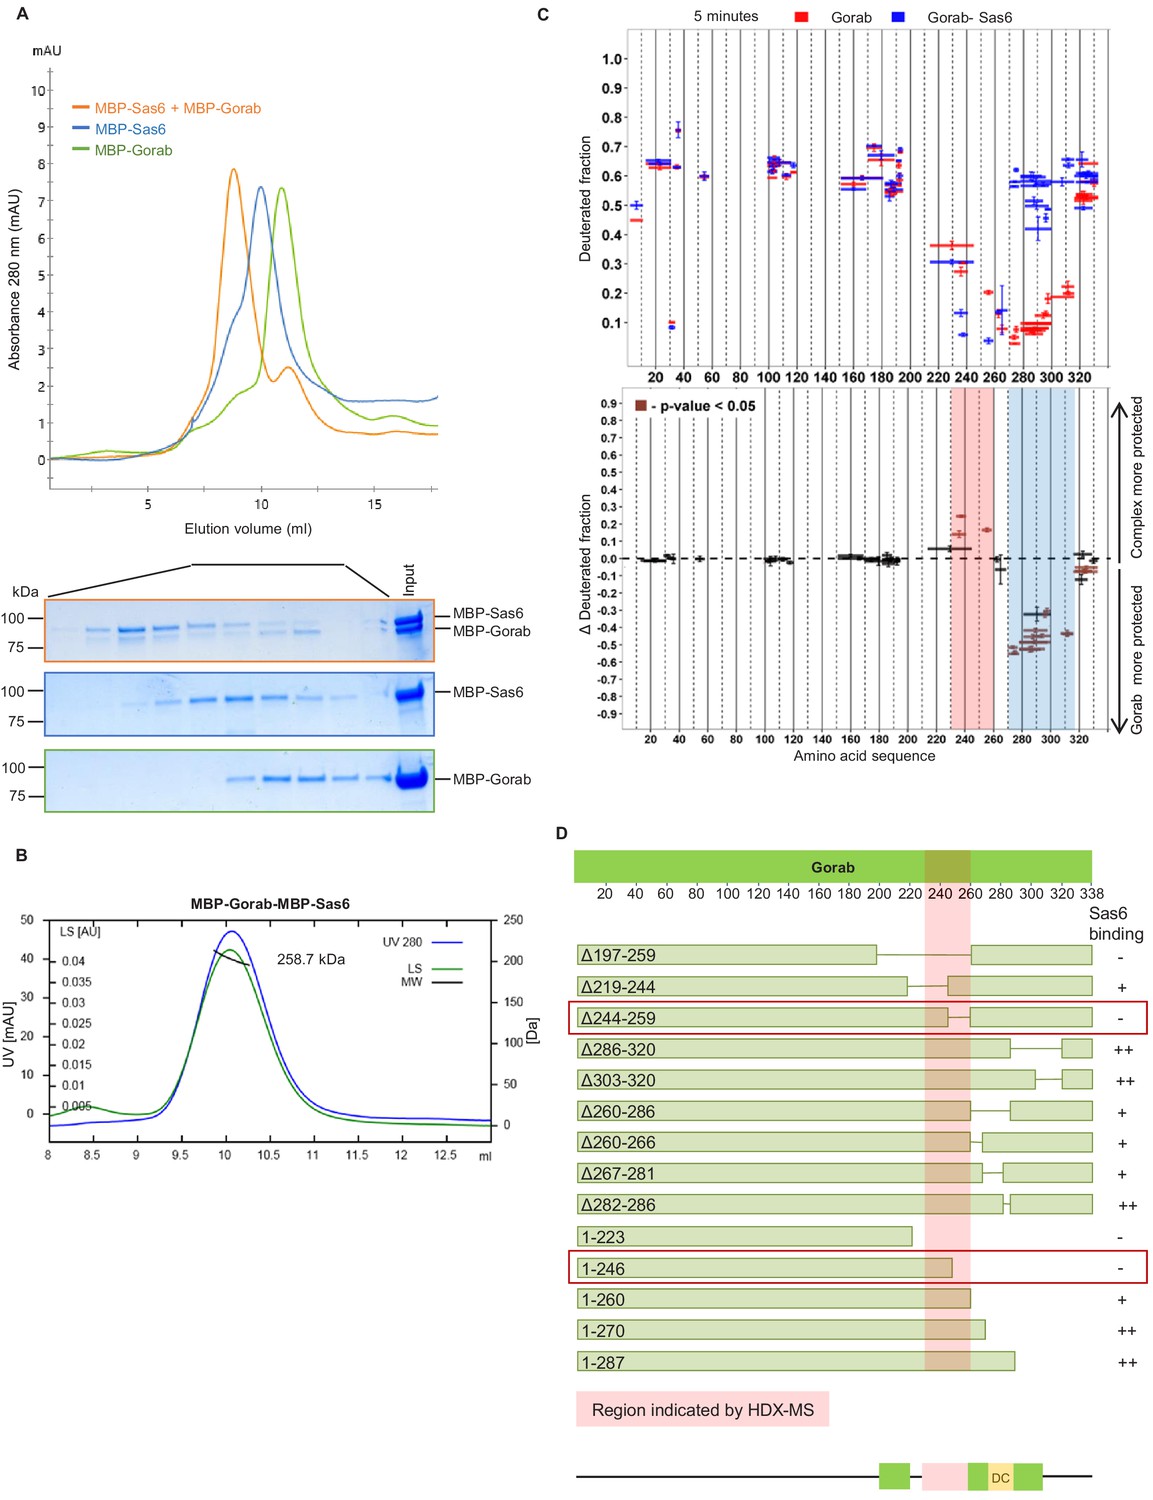
Gorab interacts with Sas6 through its C-terminal part and forms a heterotrimeric complex.
(A) Size exclusion chromatography (SEC) of Gorab, Sas6, and Gorab–Sas6 complex. Green: absorbance 280 nm of MBP-Gorab; blue: absorbance 280 nm of MBP-Sas6; yellow: absorbance at 280 nm of MBP-Gorab-MBP-Sas6 complex. Lower panel: SDS-PAGE of SEC fractions. (B) Size exclusion chromatography coupled with multiangle light scattering of Gorab–Sas6 complex. Blue: absorbance at 280 nm; green: light scattering; black: molecular mass (Mm) of MBP-Gorab-MBP-Sas6 complex. Mm of MBP-Sas6 monomer is 96.4 kDa; Mm of MBP-Gorab monomer, 79.4 kDa. (C) Upper panel: hydrogen–deuterium exchange (HDX) pattern of Gorab in complex with Sas6 following 5 min incubation with D2O. Gorab peptides alone (red bars) and when in complex with Sas6 (blue bars). X-axis: position of peptides in amino acid sequence; Y-axis: fraction of deuteration compared to maximum level of calculated deuteration. Mean of two experiments is shown. Error bars show both values measured. Lower panel: differences between deuteration of Gorab peptides alone and in complex with Sas6, derived by subtraction of deuteration levels shown in the upper panel. Brown bars indicate peptides for which the differences measured in repeated experiments satisfied the Welsh t-test with p<0.05. Blue region: peptides that are more protected from deuterium exchange when Gorab is not in the complex (aa 270–315); red region: peptides that are more protected when Gorab is in complex with Sas6 (aa 230–260). (D) Schematic of ability Gorab deletions/truncations to bind Sas6 in vitro; –: no binding; +: binding; ++: strong binding. Red highlighted box: region identified by HDX-MS (aa 230–260). Red boxes: region of Gorab essential for Sas6 binding (aa 244–260). Individual results for each construct are presented in Figure 2—figure supplement 2A, B.
-
Figure 2—source data 1
Uncropped SDS-PAGE corresponding to Figure 2A.
Cropped SDS-PAGE fragments taken to the figure panel are shown.
- https://cdn.elifesciences.org/articles/57241/elife-57241-fig2-data1-v4.pdf
Figure 2—figure supplement 1
Regions of Gorab required for Sas6 binding.
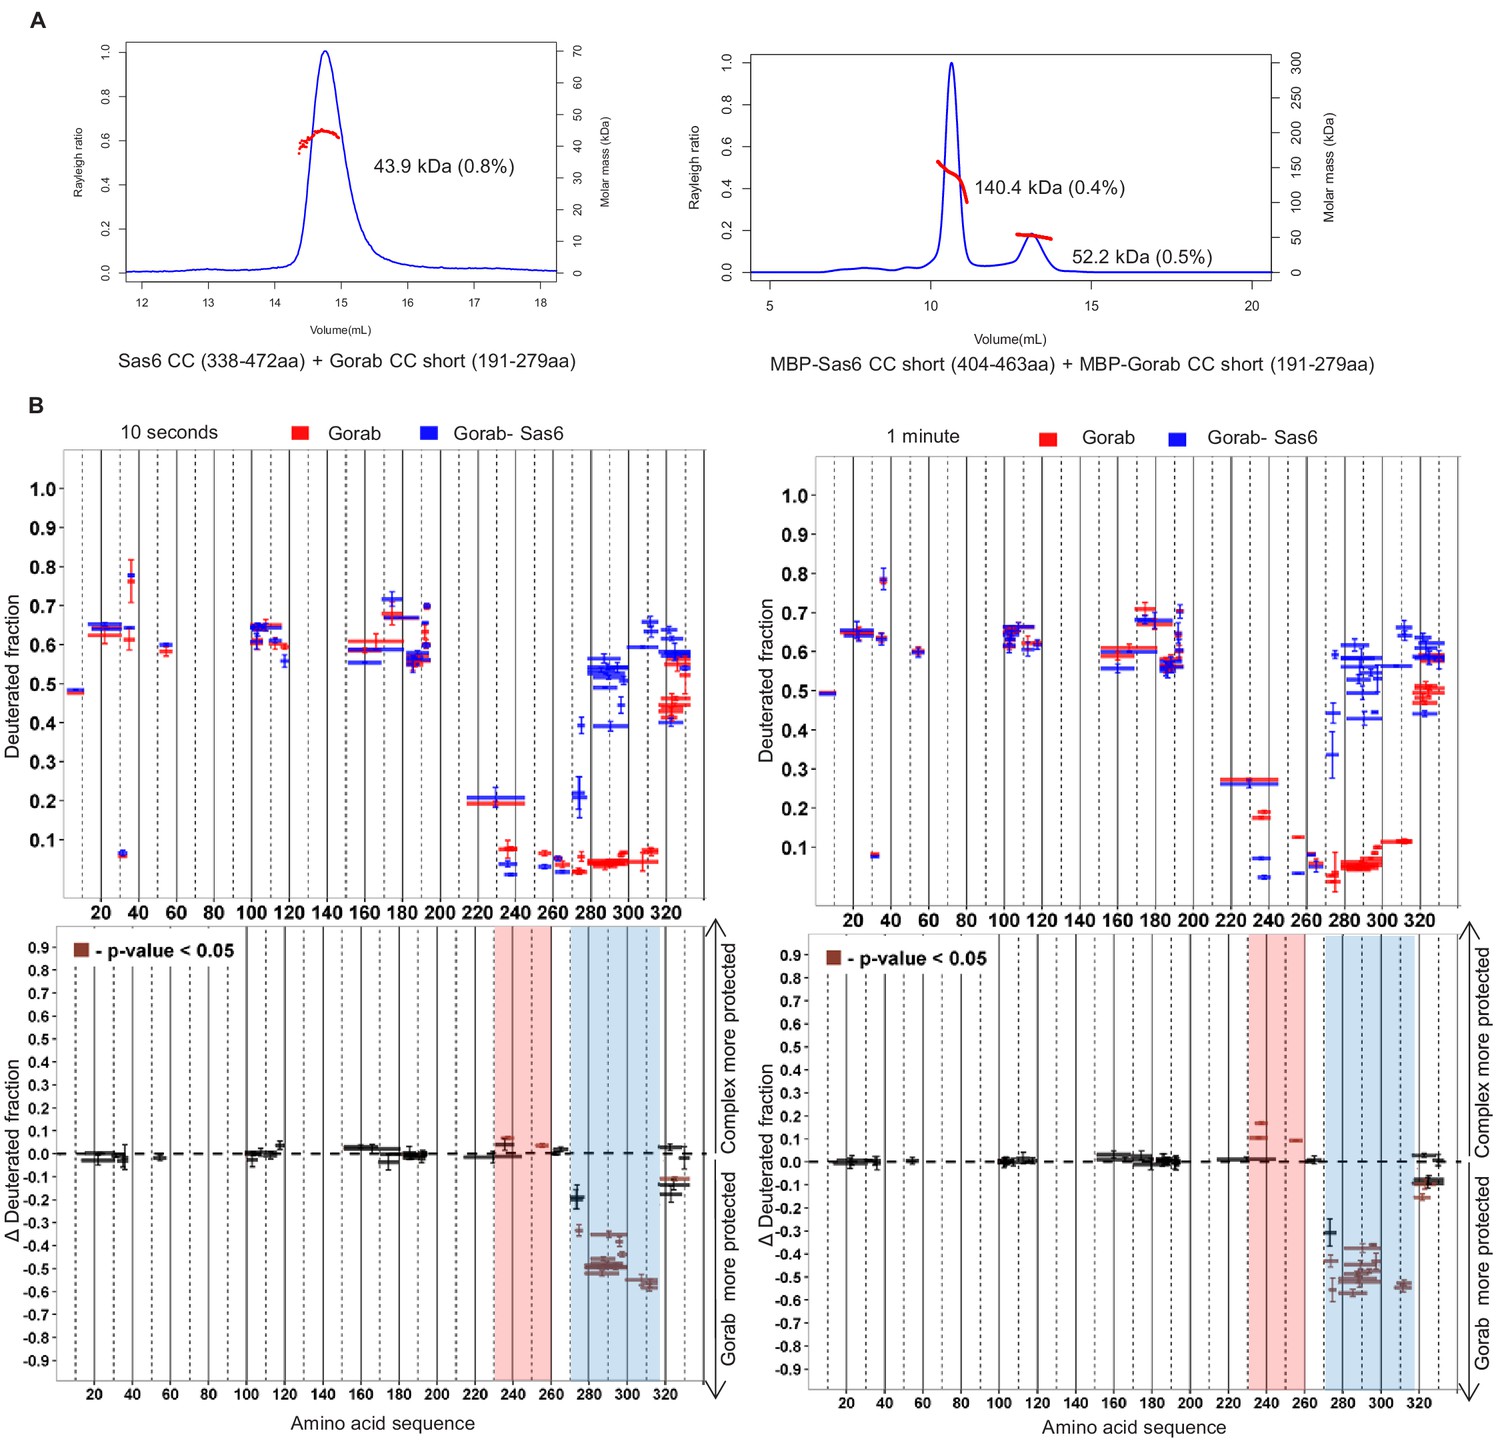
(A) Size exclusion chromatography coupled with multiangle light scattering analyses of Sas6–Gorab complex formed by truncated constructs. Left: Sas6 CC (aa 338–472) + Gorab CC short (aa 191–279), with theoretical molar mass of 16 and 10.5 kDa, respectively. Right: MBP-Sas6 CC short (aa 404–463) + MBP-Gorab CC short (aa 191–279), with theoretical molar mass of 48 and 51.5 kDa, respectively. Blue line: Rayleigh ratio; red line: observed mass (Mw); Mw error shown in brackets. (B) Hydrogen–deuterium exchange pattern of Gorab in complex with Sas6 following 10 s or 1 min incubation with D2O. Upper panel: Gorab peptides alone (red bars) and when in complex with Sas6 (blue bars). X-axis: position of peptides in amino acid sequence; Y-axis: fraction of deuteration compared to maximum level of calculated deuteration. Mean of two experiments is shown. Error bars show both values measured. Lower panel: differences between deuteration of Gorab peptides alone and in complex with Sas6, derived by subtraction of deuteration levels shown in the upper panel. Brown bars indicate peptides for which the differences measured in repeated experiments satisfied the Welsh t-test with p<0.05. Blue region: peptides that are more protected from deuterium exchange when Gorab is not in the complex (aa 270–315); red region: peptides that are more protected when Gorab is in complex with Sas6 (aa 230–260).
Figure 2—figure supplement 2
Consequences of deletion or truncation of Gorab for Sas6 binding.
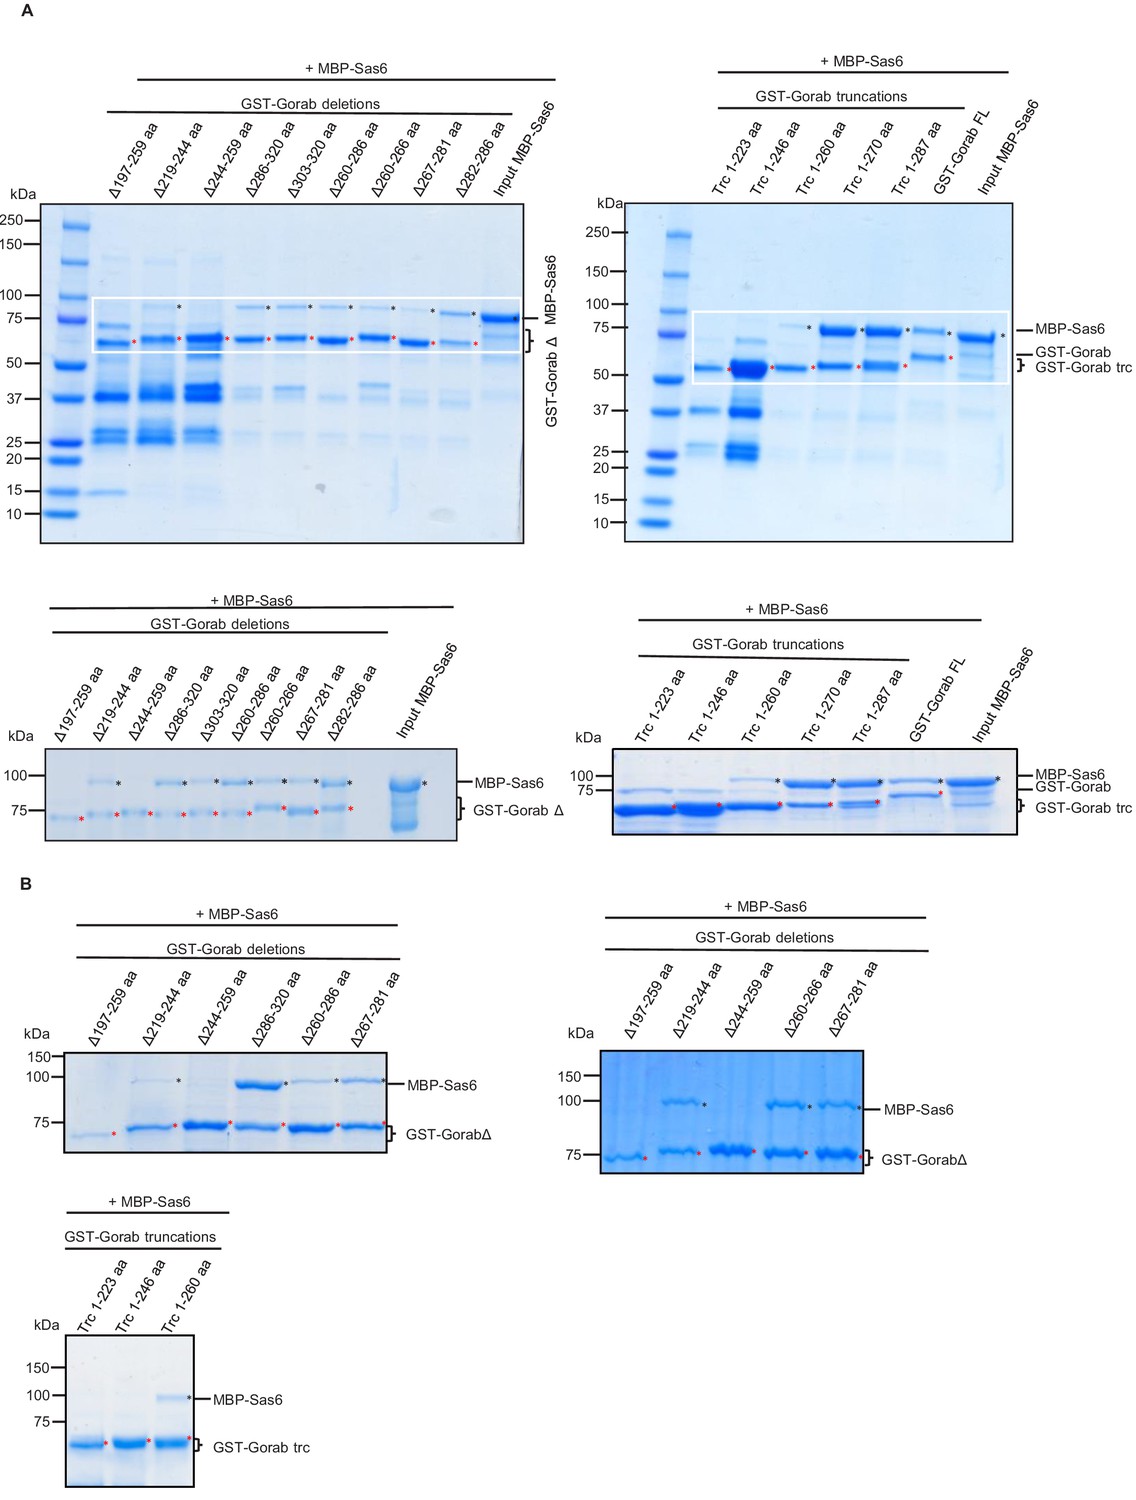
(A) SDS-PAGE of the in vitro binding assay between GST-Gorab deletions/truncations (bait) and MBP-Sas6 WT (prey). The aa 244–260 region in Gorab is essential for Sas6 binding. (B) Examples of SDS-PAGE of the in vitro binding assay between selected GST-Gorab deletions/truncations (bait) and MBP-Sas6 WT (prey).
Figure 3 with 4 supplements
Sas6 interacts with Gorab through its C-terminal region.
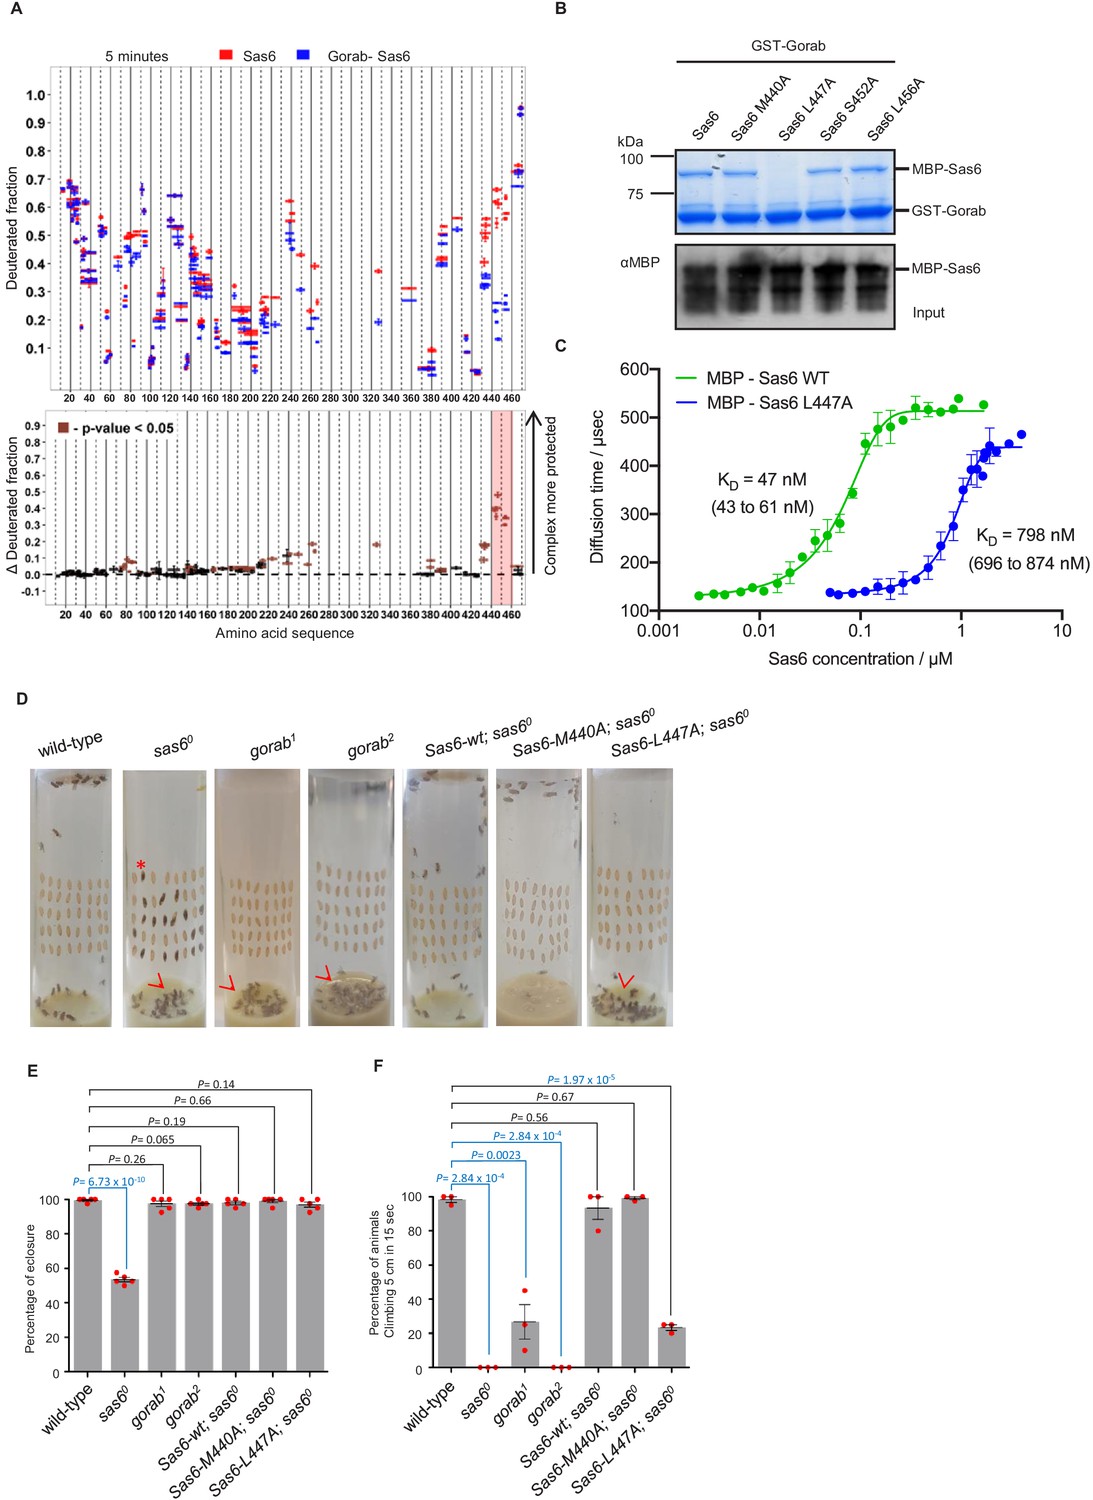
(A) Upper panel: hydrogen–deuterium exchange pattern of Sas6 in complex with Gorab following 5 min incubation with D2O. Sas6 peptides alone (red bars) and when in complex with Gorab (blue bars). X-axis: position of peptides in amino acid sequence; Y-axis: fraction of deuteration compared to maximum level of calculated deuteration. Mean of two experiments is shown. Error bars show both values measured. Lower panel: differences between deuteration of Sas6 peptides alone and in complex with Gorab, derived by subtraction of deuteration levels shown in the upper panel. Brown bars indicate peptides for which the differences measured in repeated experiments satisfied the Welsh t-test with p<0.05. Red box: peptides protected most from exchange when Sas6 is in complex with Gorab (aa 440–460). (B) Pull-down assay for wild type (WT) and point mutants of Sas6 with Gorab. Upper panel: SDS-PAGE of the binding assay in which Gorab is the bait and WT and point mutants of Sas6 are the prey. Lower panel: western blot showing input of WT and point mutants of Sas6. Leucine 447 in Sas6 is essential for Gorab binding. (C) Fluorescence correlation spectroscopy measurements of fluorescently labeled MBP-Gorab (aa 191–279) binding non-labeled MBP-Sas6 WT (green) or MBP-Sas6 L447A mutant (blue). Mean values of the dissociation constants for Gorab–Sas6 WT and Gorab–Sas6 L447A are 47 and 798 nM, respectively, with 95% confidence intervals (brackets). Error bars show standard deviation of three independent measurements. (D) Eclosion phenotype of indicated mutants and sas6o null flies expressing the indicated transgenes. Pupae (40/vial) were aligned on the side of the vial and left to eclose. Asterisk exemplifies an individual that died at the pharate adult stage within the pupal case. Arrowheads point to eclosed but uncoordinated adults stuck in media. Expression of Sas6-wild-type, Sas6-M440A, and Sas6-L447A constructs was induced in sas6o neurons by the elav-GAL4 driver. Flies were raised and the experiments were performed at 25°C. Ubiquitous expression of the constructs driven by Act5C-GAL4 gave similar eclosion rates (not shown) (E). Quantification of eclosion rate of flies. Datapoints represent percentage of eclosed adults from each replica. Means and standard errors are shown for N = 5 independent biological replicates per genotype; n = 40 flies investigated in each replica. p-Values of two-tailed, unpaired t-tests are shown. p-Value in blue indicates significant difference (95% confidence interval). (F) Climbing assays of indicated mutants and saso flies expressing the indicated transgenes. The expression of Sas6-WT, Sas6-M440A, and L447A rescue constructs was induced in sas6o null neurons by the elav-GAL4 driver. Ubiquitous expression from the Act5C-GAL4 driver gave similar eclosion rates (not shown). Cohorts of 15 flies raised at 25°C were scored for the number of individuals able to climb 5 cm in 15 s after being tapped down to bottom of vial. Means and standard errors are shown for N = 3 independent experiments per genotype; n = 15 flies investigated in each experiment. p-Values of two-tailed, unpaired t-tests are shown. p-Value in blue indicates significant difference (95% confidence interval).
-
Figure 3—source data 1
Table representing three independent fluorescence correlation spectroscopy (FCS) measurements for each of the complex formations: between Gorab and Sas6 wild type (WT); and Gorab and Sas6 L447A.
The diffusion times of fluorescently labeled MBP-Gorab CC (191–279 aa) were measured after mixing with various concentrations of unlabeled MBP-Sas6 WT or MBP-Sas6 L447A. Each entry in the table represents an average of 4–8 consecutive FCS measurements with an SD <8%. Value averages with an SD >8% were omitted from the analysis.
- https://cdn.elifesciences.org/articles/57241/elife-57241-fig3-data1-v4.xlsx
-
Figure 3—source data 2
Percentage of flies eclosed in five independent biological replicates of the indicated genotypes.
- https://cdn.elifesciences.org/articles/57241/elife-57241-fig3-data2-v4.xlsx
Figure 3—figure supplement 1
Regions of Sas6 interacting with Gorab.
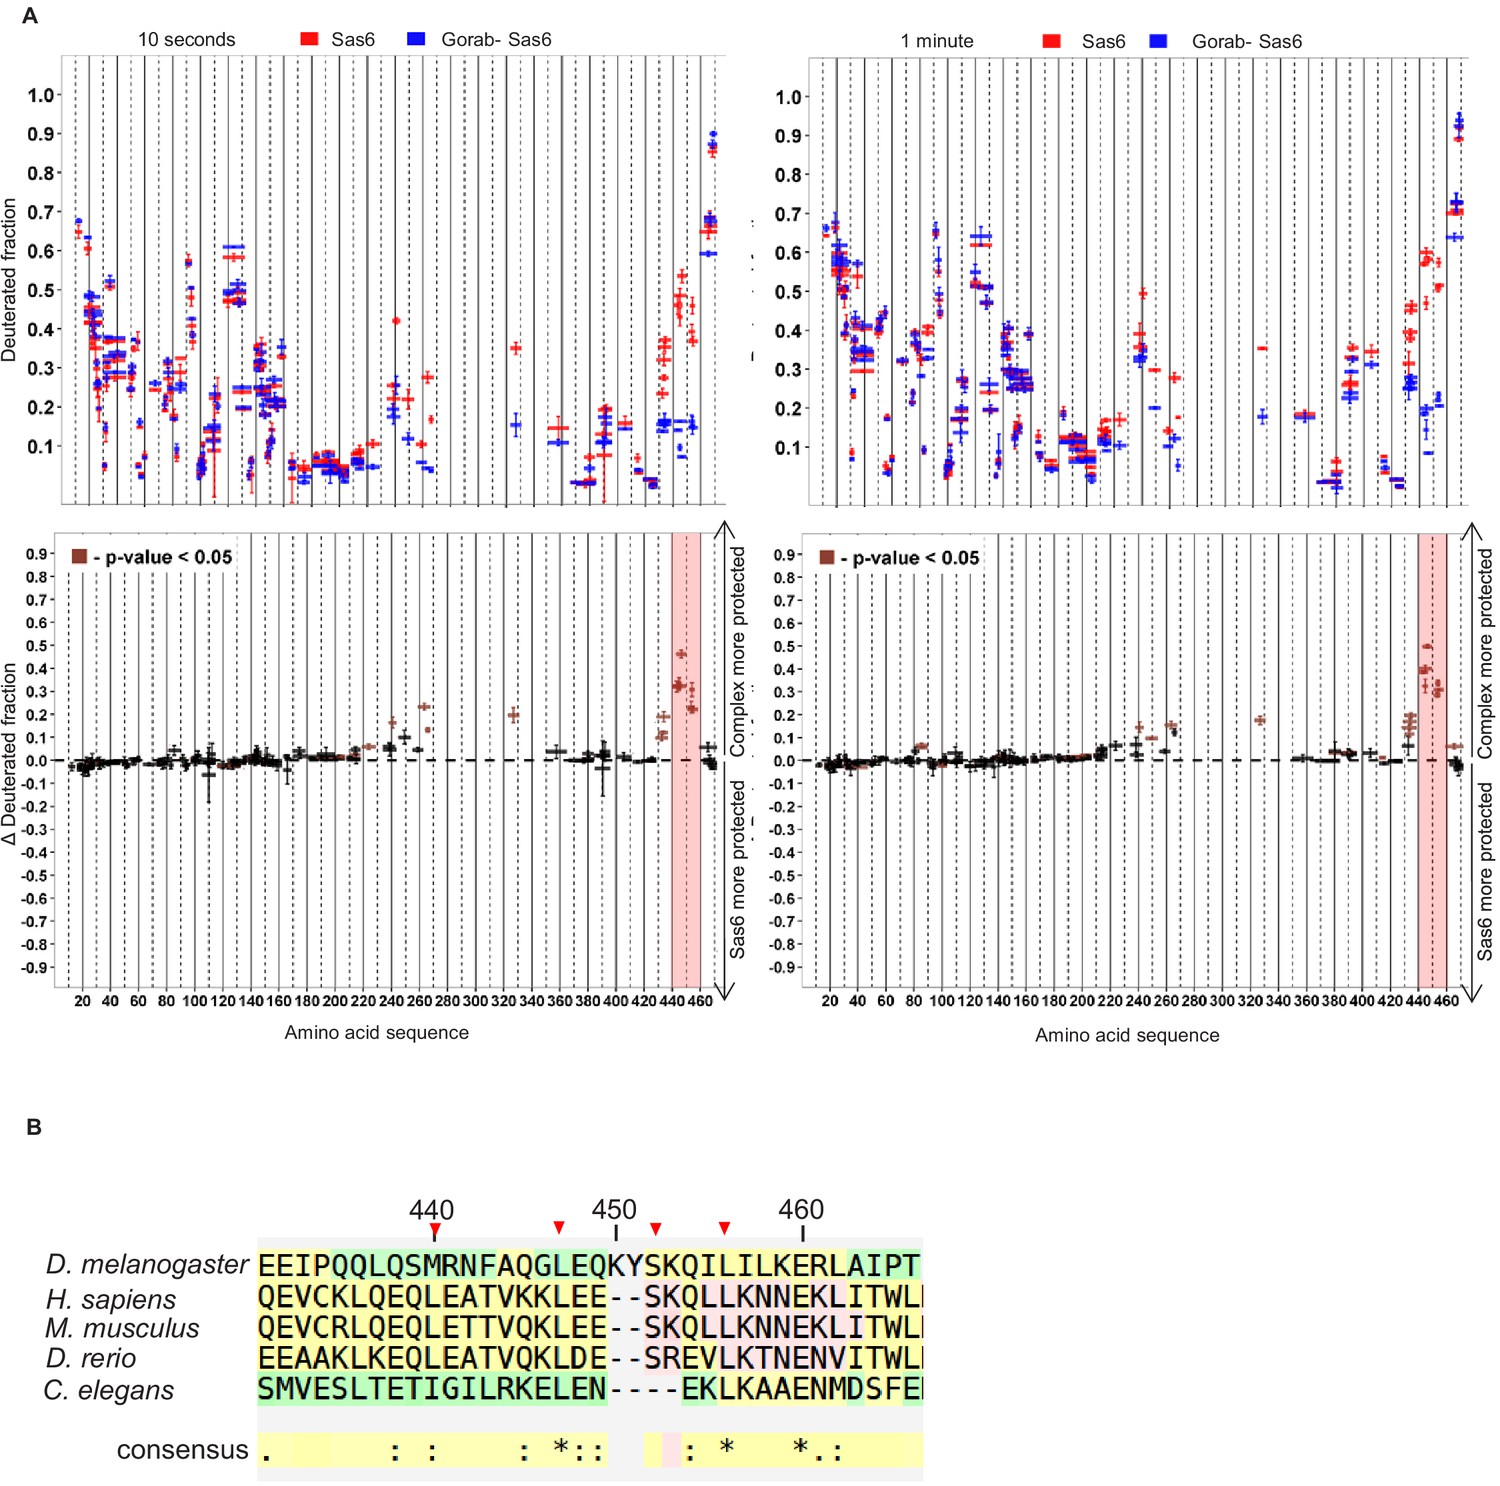
(A) Hydrogen–deuterium exchange pattern of Sas6 in complex with Gorab following 10 s or 1 min incubations with D2O. Upper panel: Sas6 peptides alone (red bars) and when in complex with Gorab (blue bars). X-axis: position of peptides in amino acid sequence. Y-axis: fraction of deuteration compared to maximum level of calculated deuteration. Mean of two experiments is shown. Error bars show both values measured. Lower panel: differences between deuteration of Sas6 peptides alone and in complex with Gorab, derived by subtraction of deuteration levels shown in the upper panel. Brown bars indicate peptides for which the differences measured in repeated experiments satisfied the Welsh t-test with p<0.05. Red box: peptides protected most from exchange when Sas6 is in complex with Gorab (aa 440–460). (B) Multiple sequence alignment (MSA) of Sas6 region among different species. Red triangles: residues selected for the mutagenesis. MSA was performed using T-Coffee Expresso (Armougom et al., 2006; Di Tommaso et al., 2011; Notredame et al., 2000; Poirot et al., 2004).
Figure 3—figure supplement 2
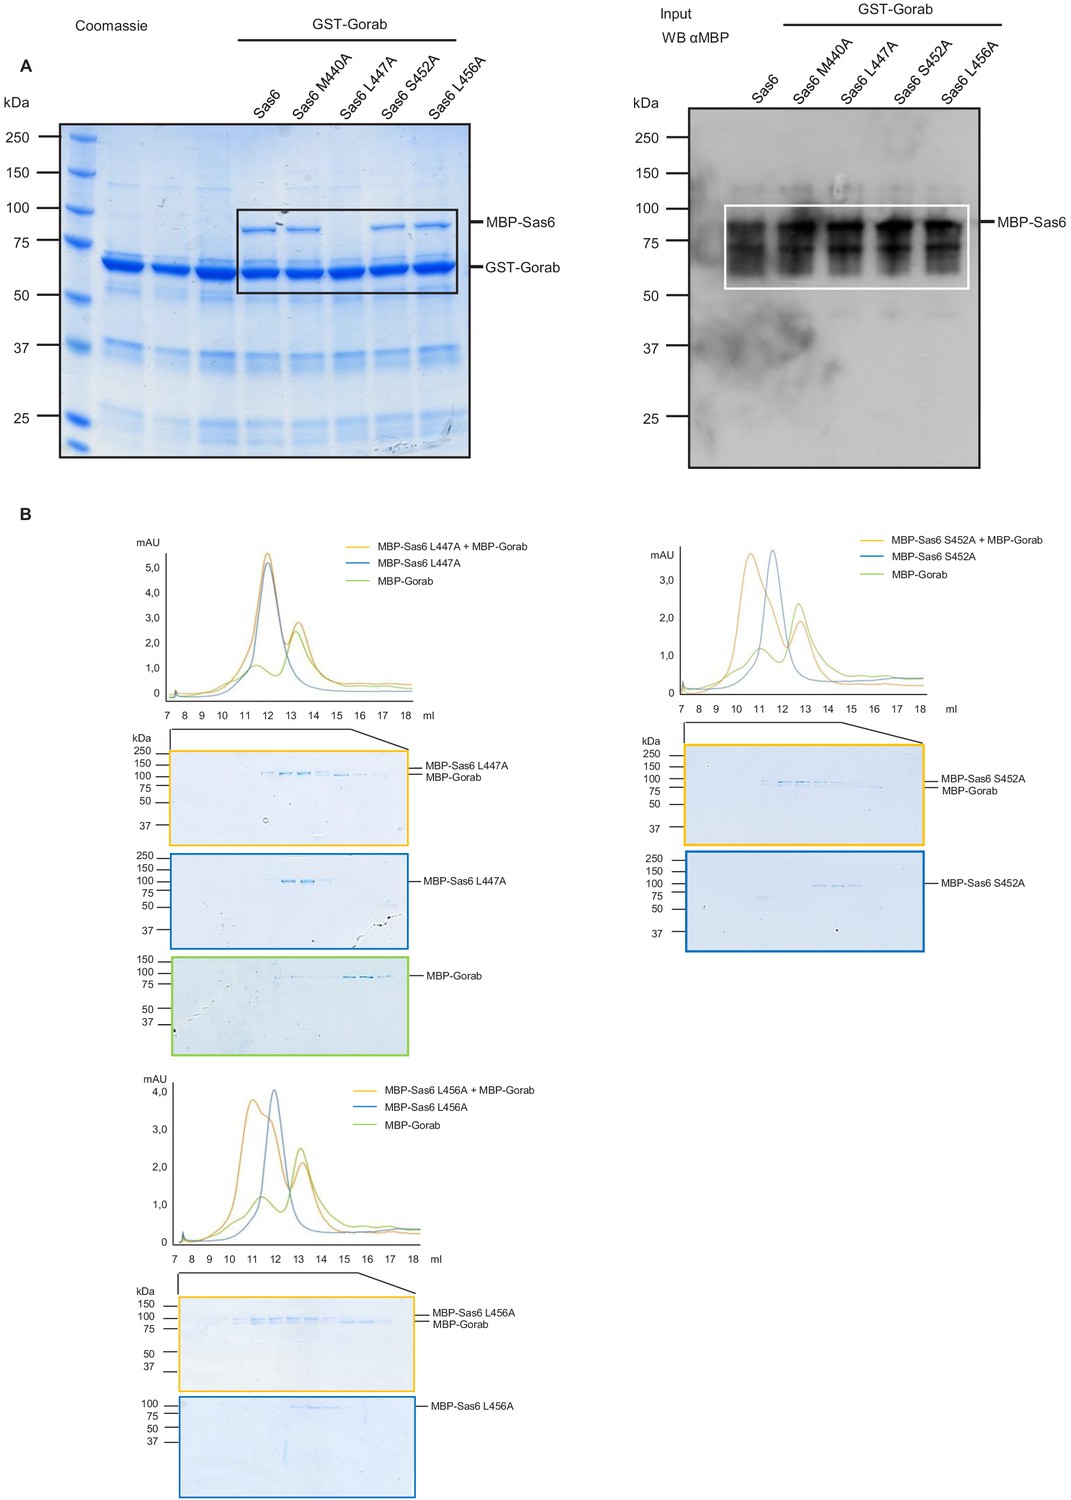
Consequences of point mutations in Sas6 for its interactions with Gorab.
(A) Uncropped SDS-PAGE and western blot of binding assay for wild type and point mutants of Sas6 with Gorab and corresponding to Figure 3B. Left panel: SDS-PAGE of the binding assay in which Gorab is the bait and wild type and point mutants of Sas6 are the prey. Right panel: western blot showing input of wild type and point mutants of Sas6. (B) Size exclusion chromatography (SEC) of selected point mutations of Sas6 (L456A, S452A, L447A) and Gorab. Blue line: absorbance at 280 nm of MBP-Sas6 point mutants; green line: absorbance at 280 nm of MBP-Gorab; yellow line: absorbance at 280 nm, of MBP-Gorab+MBP-Sas6 point mutants. Lower panel shows SDS-PAGE of SEC fractions.
-
Figure 3—figure supplement 2—source data 1
Uncropped SDS-PAGE corresponding to Figure 3—figure supplement 2B.
Cropped SDS-PAGE fragments taken to the figure panel are shown.
- https://cdn.elifesciences.org/articles/57241/elife-57241-fig3-figsupp2-data1-v4.pdf
Figure 3—figure supplement 3
Sas6–Gorab interactions.
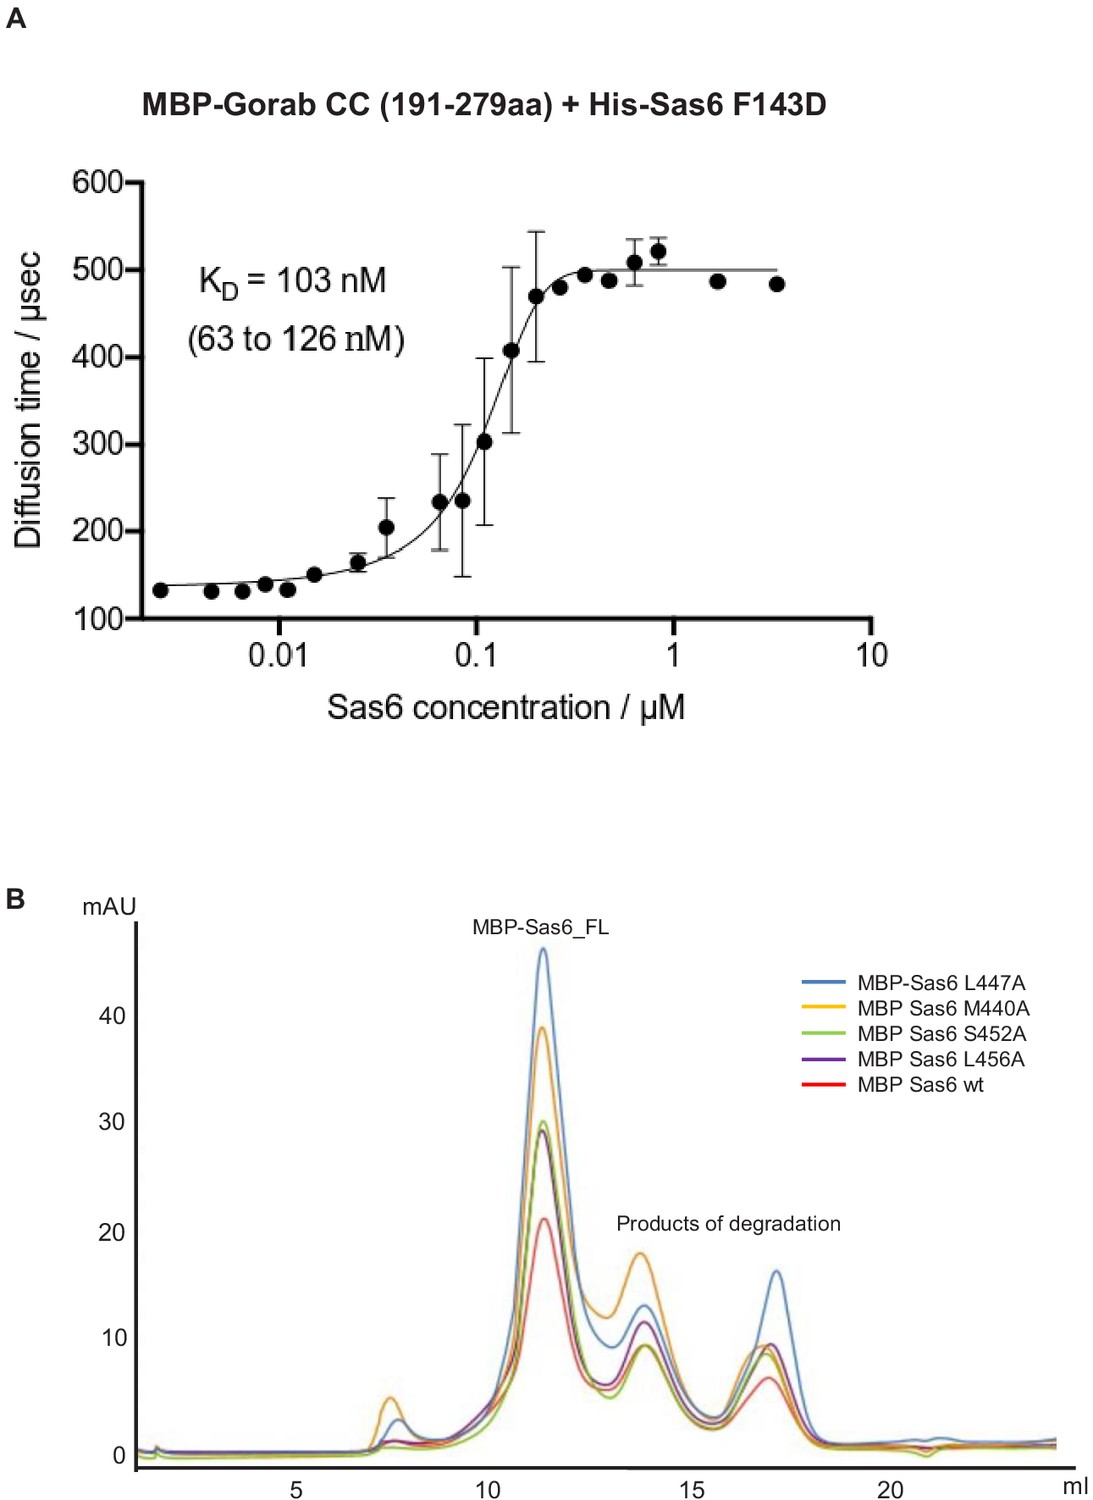
(A) Fluorescence correlation spectroscopy measurement of binding of fluorescently labeled MBP-Gorab (aa 191–279) to the non-labeled His-Sas6 F143D mutant that abolishes higher oligomerization of Sas6 dimers. Mean dissociation constant value (KD) is shown with 95% confidence intervals in brackets. Error bars show standard deviation of three independent measurements. (B) Size exclusion chromatography of Sas6 point mutants. Color lines are as follows: blue: absorbance at 280 nm of MBP-Sas6 L447A; orange: MBP Sas6 M440A ; green: MBP Sas6 S452A; violet: MBP Sas6 L456A; red: MBP Sas6 wt.
-
Figure 3—figure supplement 3—source data 1
Table representing three independent fluorescence correlation spectroscopy (FCS) measurements of complex formation between Gorab and Sas6 F143D.
The diffusion times of fluorescently labeled MBP-Gorab CC (191–279 aa) were measured after mixing with various concentrations of unlabeled His-Sas6 F143D. Each entry in the table represents an average of 4–8 consecutive FCS measurements with an SD <8%. Value averages with an SD >8% were omitted from the analysis.
- https://cdn.elifesciences.org/articles/57241/elife-57241-fig3-figsupp3-data1-v4.xlsx
Figure 3—figure supplement 4
Structural analyses of the coiled coil of Sas6.
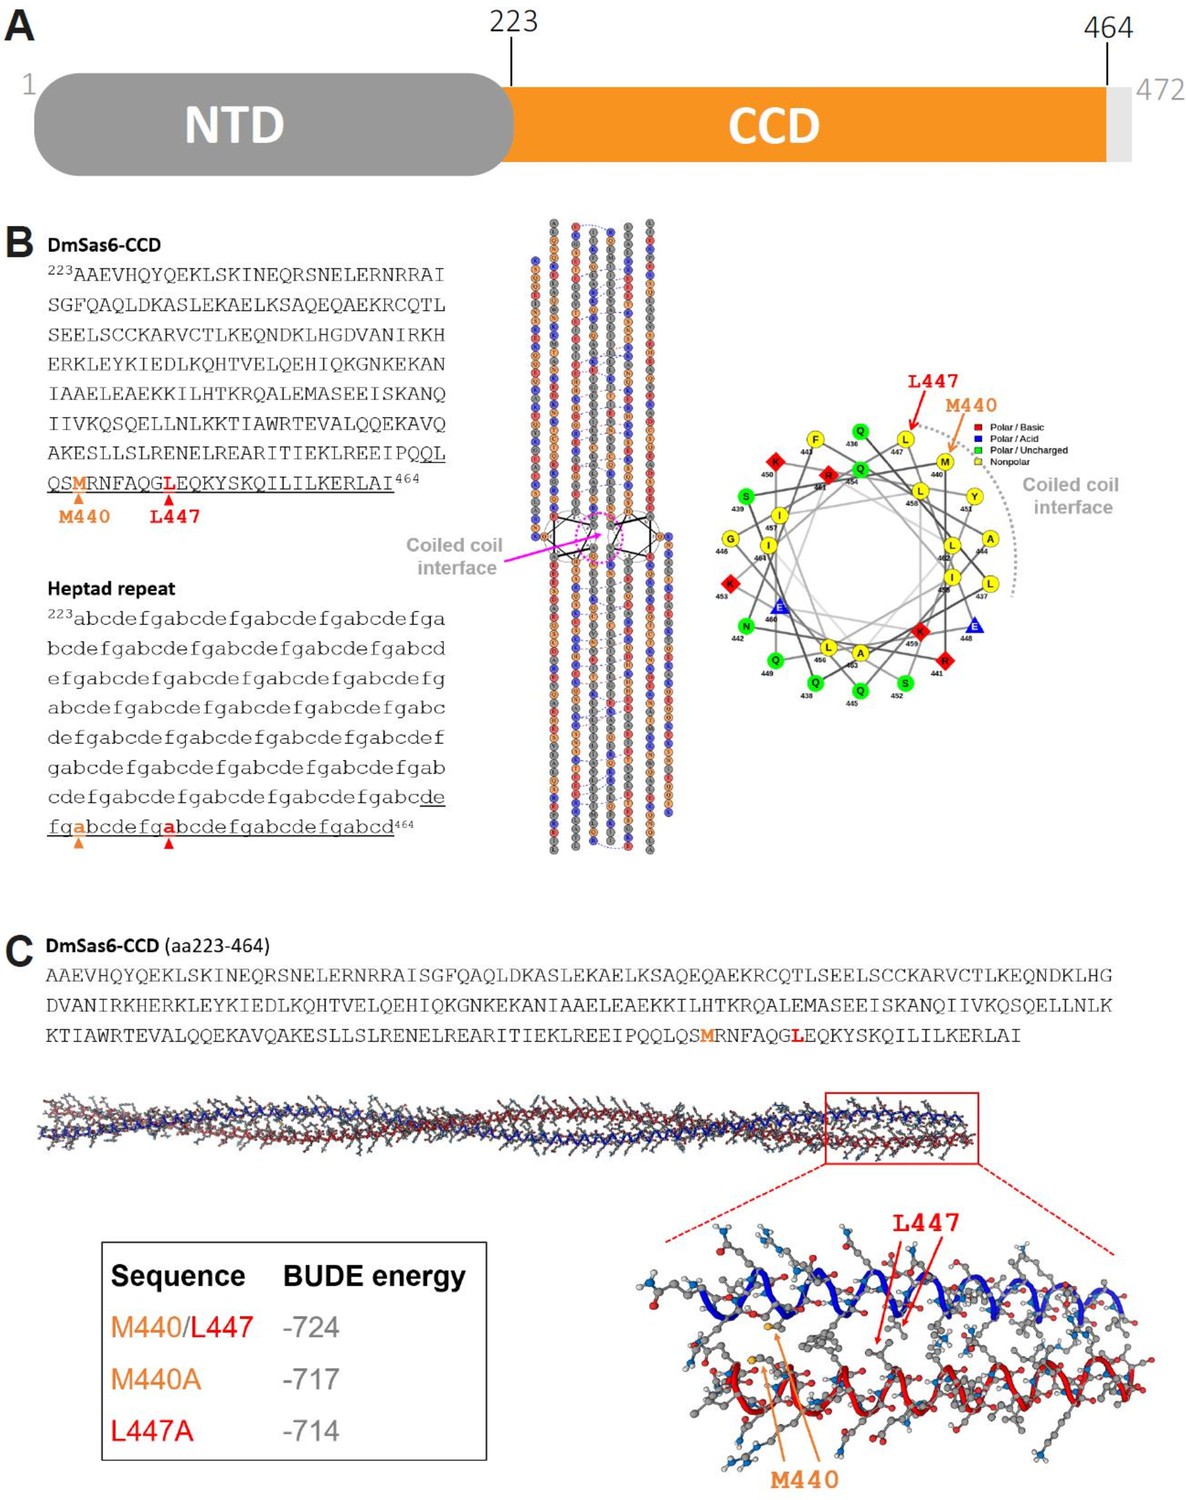
(A) Domain arrangement of Sas6. NTD: N-terminal domain; CCD: coiled-coil domain. Domain boundaries are marked. (B) Left: prediction of the heptad repeats by LOGICOIL (Wood and Woolfson, 2018). Center: helical wheel diagrams for the coiled coil dimer of Sas6 generated by DrawCoil 1.0 (https://grigoryanlab.org/drawcoil/). Right: helical wheel diagram of a local segment of the Sas6 coiled coil (underlined region in the sequence on the left). (C) 3D modeling of the Sas6 coiled coil by CCBuilder 2.0 (Wood and Woolfson, 2018).
Figure 4 with 1 supplement
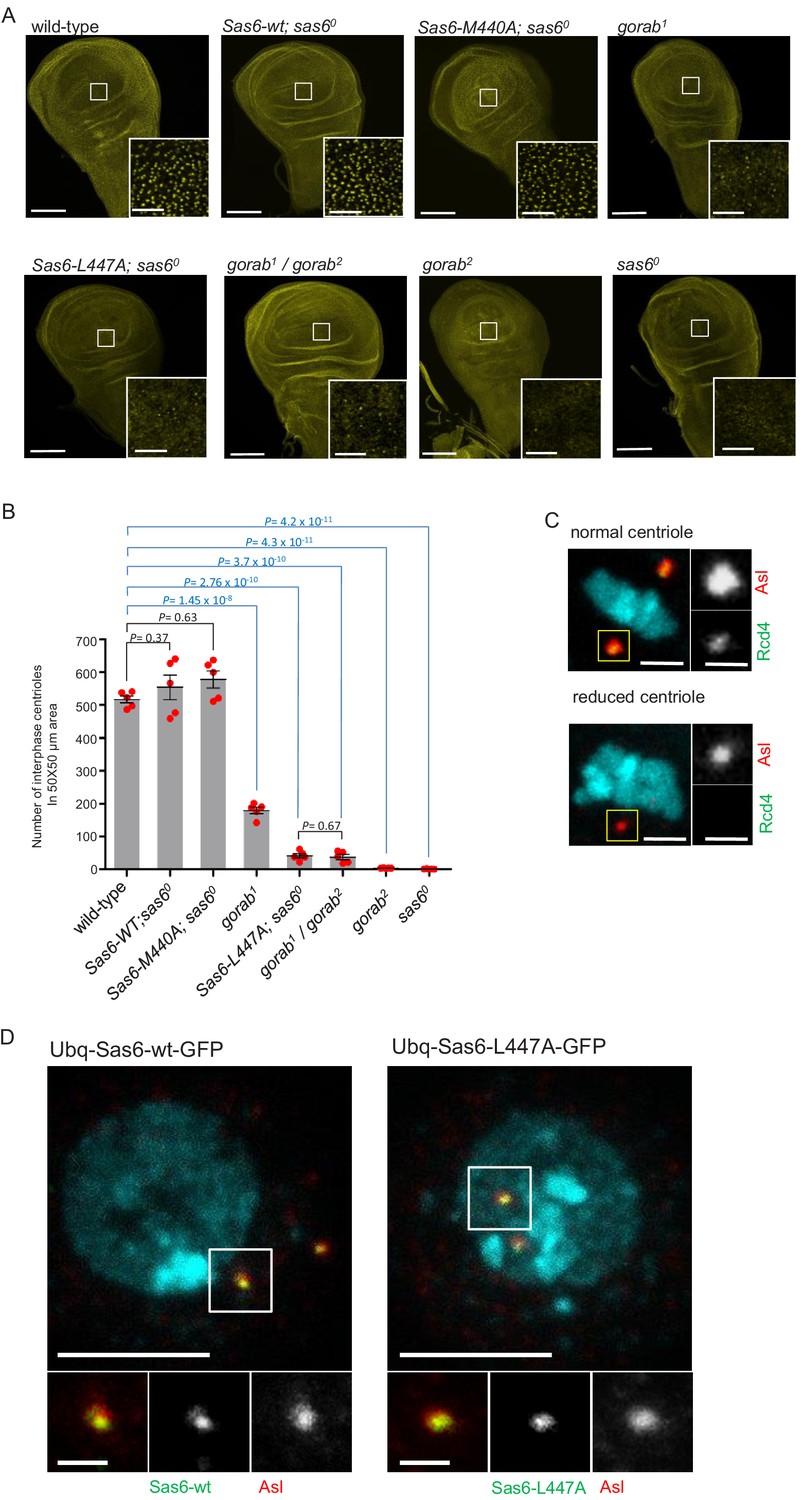
Consequences of Sas6 L447A upon Gorab recruitment.
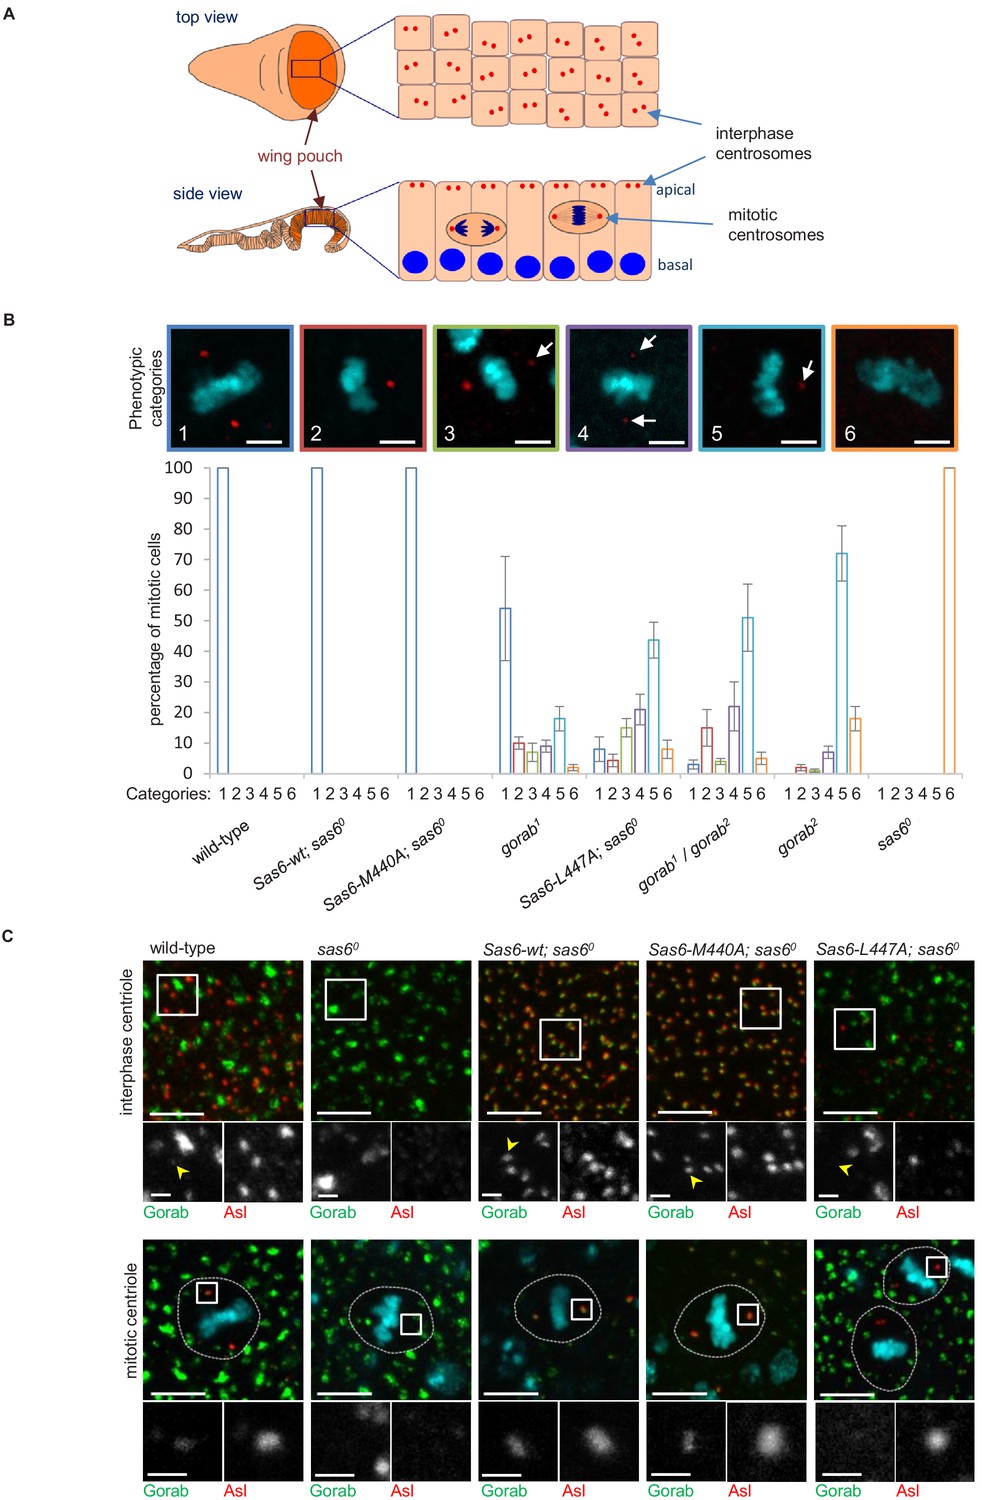
(A) Schematic showing the organization of centrosomes in columnar wing disc epithelia in wandering late third instar larvae. Centrosomes (red dots) localize to the apical surface of interphase cells, whereas nuclei (blue) have a basal localization. Mitotic cells round up and become localized between the apical and basal surfaces. Localization and quantification was performed on the middle part of the wing pouch (orange zone) of the disc. (B) Centriolar phenotype of the indicated sas6 and gorab mutants and sas6 mutants rescued with the indicated transgenes. The upper panel shows examples of the six phenotypic categories: 1: two normal centrioles; 2: one normal centriole; 3: one normal and one centriole showing diminished staining; 4: two centrioles with diminished staining; 5: one centriole with diminished staining; 6: no centrioles. Chromosomes are stained with DAPI (blue) and centrioles by anti-asterless (Asl) immunostaining (red). Arrows indicate centrioles with diminished Asl signal. Scale bar: 2.5 µm. The lower histograms show the quantification of phenotypic categories for the indicated genotypes. Colors correspond to phenotypic categories (also indicated numerically). Means and standard errors are indicated for three independent experiments, each assessing 100 mitotic cells from 12 wing discs from each genotype. (C) Localization of GFP-Gorab expressed from the constitutive poly-ubiqitin promoter in sas6 null mutant wing discs in the absence and presence of the indicated Sas6 variants. The Sas6-WT (wild type), Sas6-M440A, and Sas6-L447A transgenes were integrated into the same genomic locus to achieve comparable expression levels from the ubiquitous Act5C-GAL4 driver. Interphase centrioles from the apical zone (upper row) and mitotic centrioles of metaphase cells (lower row) were visualized by anti-Asl immunostaining (red). GFP-Gorab not associated with centrioles corresponds to the Golgi fraction (see also Figure 4—figure supplement 1D). A total of 100 interphase cells and 30 mitotic cells from five independent wing discs were imaged for each genotype, all of which showed similar Gorab distributions within the same genotype. Scale bar: 5 µm; scale bar in insets: 1 µm.
-
Figure 4—source data 1
Number of centrioles in different categories in wing imaginal disc of indicated genotypes.
Data from three biological replicates are shown. Centrioles were counted based on dPLP and asterless centriolar marker.
- https://cdn.elifesciences.org/articles/57241/elife-57241-fig4-data1-v4.xlsx
Figure 4—figure supplement 1
Centriolar phenotype in gorab, sas6, and sas6 expressing various Sas6 transgenes.
(A) Wing disc of indicated mutants and sas6o null flies expressing indicated transgenes and stained with anti-asterless (Asl) (yellow) antibodies to mark centrioles. The Sas6-wt, Sas6-M440A, and Sas6-L447A transgenes were integrated into the same genomic locus for comparable expression from the ubiquitously expressed Act5C-GAL4 driver. The indicated apical region of the wing pouch was imaged. Scale bar: 100 µm; scale bar in insets: 10 µm. (B) Quantification of the numbers of interphase centrioles in a 50 × 50 µm area imaged in the middle part of the wing pouch. Means and standard errors are shown for N = 5 independent wing discs per genotype; p-values of two-tailed, unpaired t-tests are shown. p-Value in blue indicates significant difference (95% confidence interval). (C) Representative image of a normal (upper) and diminished (lower) centriole. Centrioles were classified as showing diminished staining if the intensity of anti-Asl staining (red) was diminished and GFP-Rcd4 (green) was absent. The GFP-tagged core centriole component Rcd4 (Panda et al., 2020) was expressed from a constitutive poly-ubiquitin promoter. Scale bar: 1 µm; scale bar in insets: 0.5 µm. (D) Localization of C-terminally GFP-tagged Sas6-wt and Sas6-L447A transgenes expressed from a poly-ubiquitin promoter in transiently transfected D.Mel-2 cells. Nuclei stained by DAPI (blue) and centrioles stained by anti-Asl antibodies (red). A total of 35 Sas6-wt and 42 Sas6-L447A expressing cells were investigated, all showing similar centriolar localization of the transgenes. Cells showing no or extremely high expression were excluded. Scale bar: 5 µm; scale bar in insets: 0.5 µm.
-
Figure 4—figure supplement 1—source data 1
Number of centrioles counted in a 50 × 50 um wing disc area in indicated genotypes.
Data from five independent wing discs are shown.
- https://cdn.elifesciences.org/articles/57241/elife-57241-fig4-figsupp1-data1-v4.xlsx
Figure 5 with 1 supplement
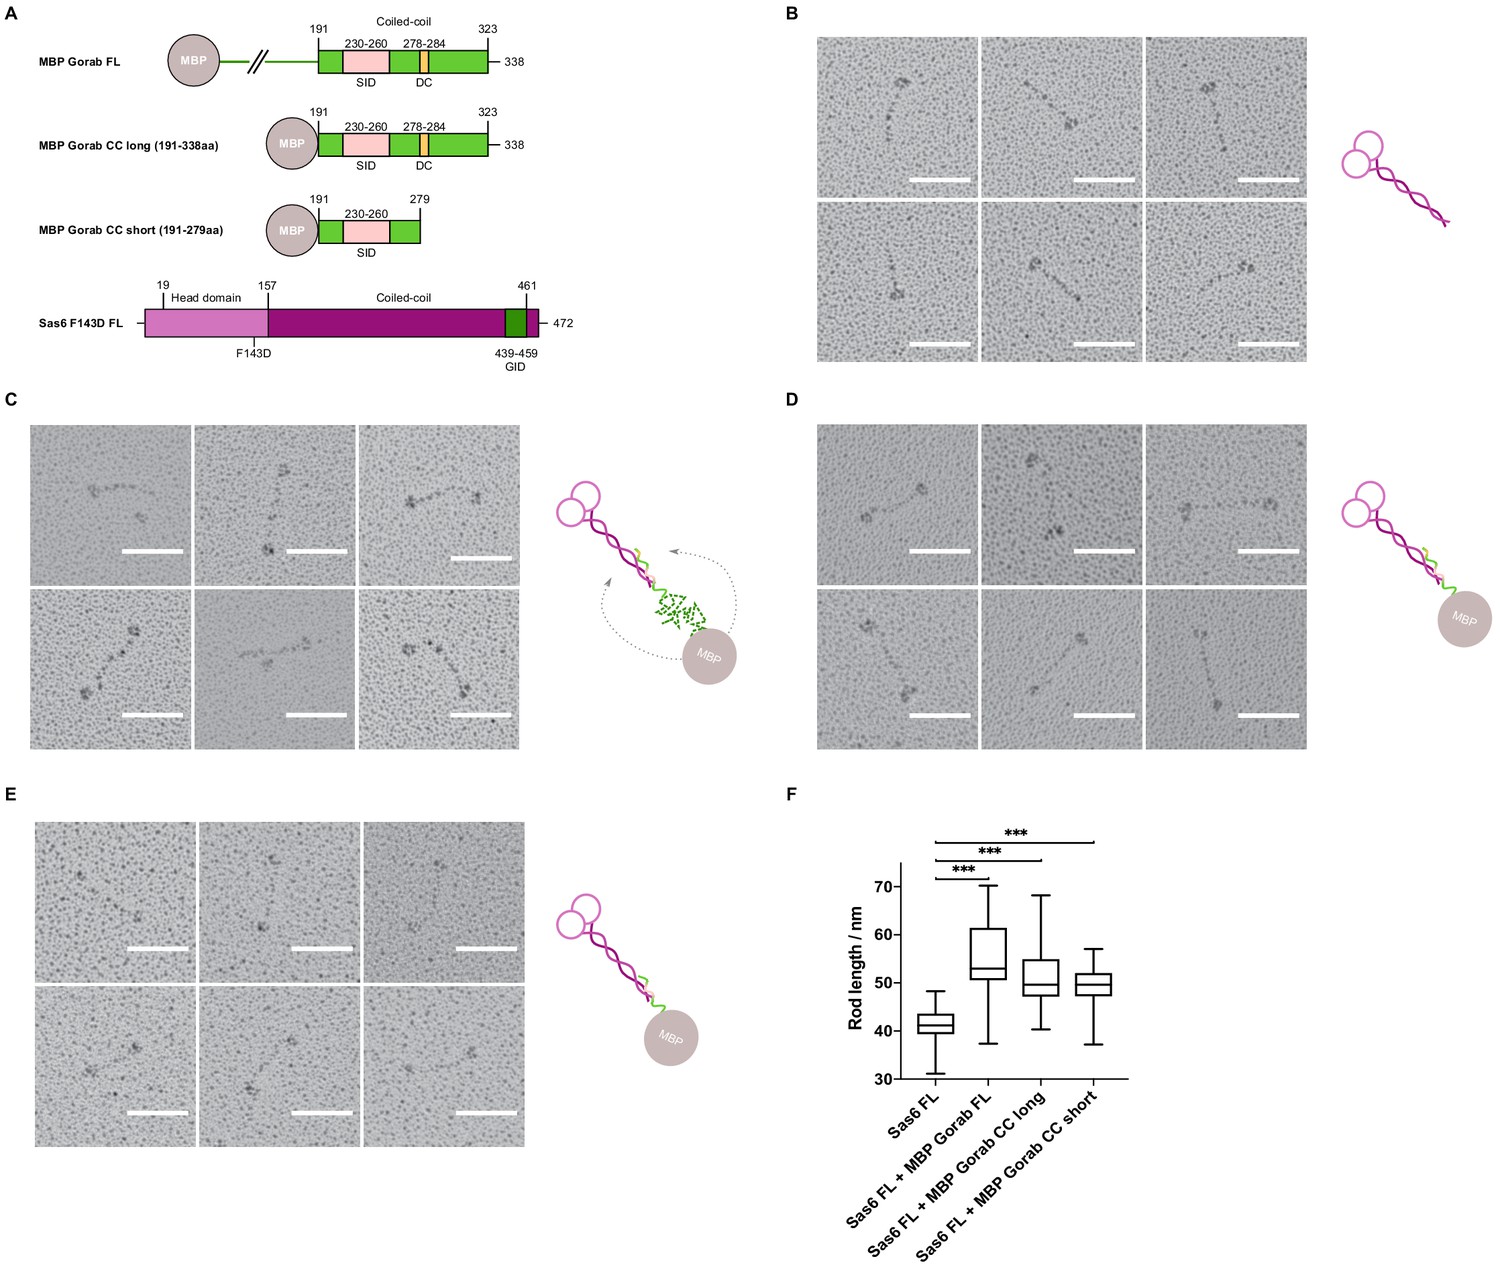
Gorab monomer makes an antiparallel interaction with the Sas6 dimer.
(A) Schematic depiction of Gorab and Sas6 constructs used for rotary shadowing electron microscopy in B–F. All Gorab constructs have an N-terminal MBP tag. Sas6 has an N-terminal His-tag. The Sas6 F143D mutation disables head-to-head interactions between Sas6 dimers and hence prevents formation of higher oligomeric structures of Sas6. SID: Sas6-interacting domain; DC: dimerization core; GID: Gorab-interacting domain as mapped by hydrogen–deuterium exchange in conjunction with mass spectrometry. (A) Selected electron micrographs of rotary shadowed Sas6. (C) Sas6 in complex with MBP-Gorab full-length (FL). (D) Sas6 in complex with MBP-Gorab ‘CC long’ (aa 191–338). (E) Sas6 in complex with MBP-Gorab ‘CC short’ (aa 191–279). Schematic interpretations of structures are shown on the right in each case. Scale bars: 50 nm. (F) Box-and-whisker plots depicting coiled-coil lengths for Sas6 (average length 41.06 nm, n = 106), Sas6 in complex with MBP-Gorab FL (54.85 nm, n = 87), Sas6 in complex with MBP-Gorab ‘CC long’ (51.51 nm, n = 118), and Sas6 in complex with MBP-Gorab ‘CC short’ (49.56 nm, n = 114).
-
Figure 5—source data 1
Table of rod lengths measured in rotary shadowing micrographs of each of the proteins mentioned.
Sas6 full-length (FL), Sas6 FL in complex with MBP-Gorab FL, Sas6 FL in complex with MBP-Gorab CC long (191–338 aa), and Sas6 FL in complex with MBP-Gorab CC short (191–279 aa). Measurements collected using FIJI software.
- https://cdn.elifesciences.org/articles/57241/elife-57241-fig5-data1-v4.xlsx
Figure 5—figure supplement 1
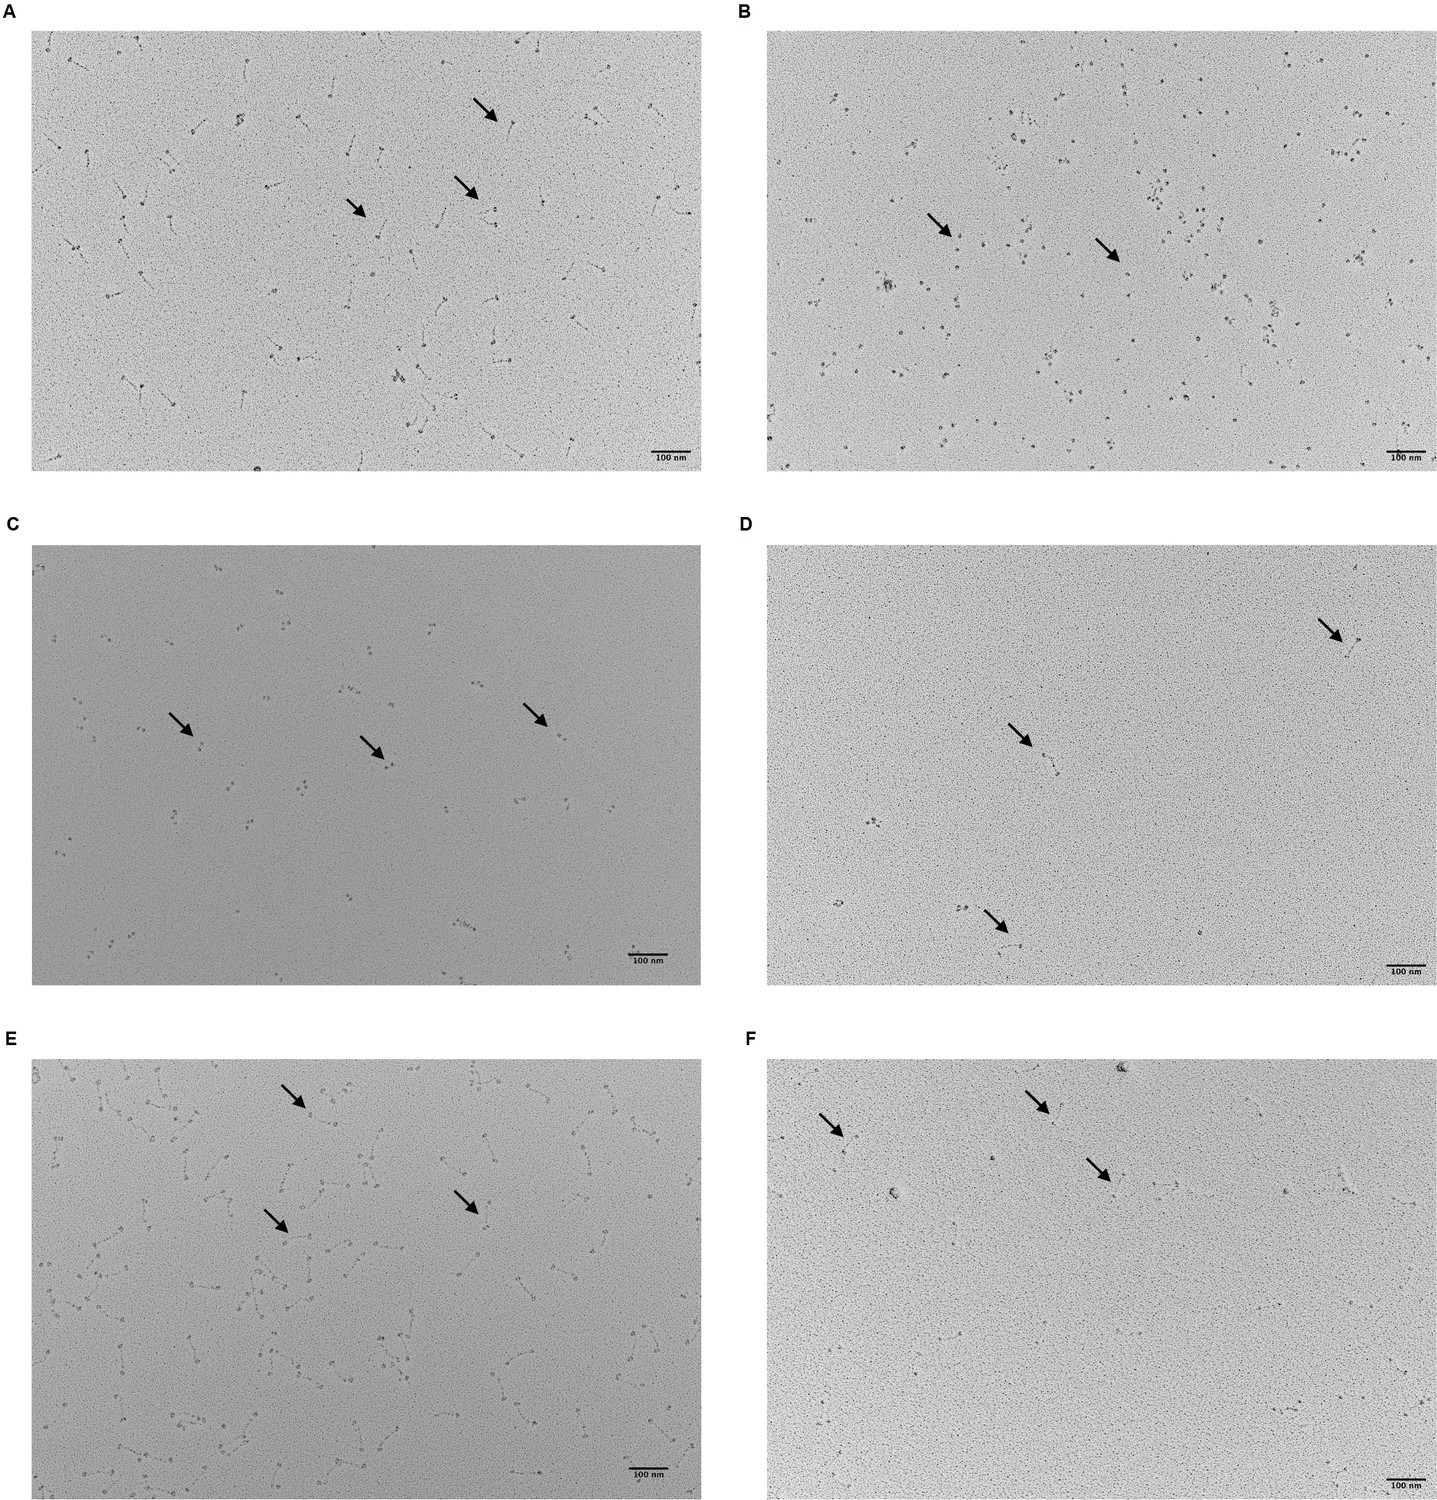
Representative electron micrographs of rotary shadowed molecules.
(A) Sas6-F143D full-length (FL). (B) MBP-Gorab FL. (C) MBP-Gorab ‘CC long’ (aa 191–338). (D) MBP-Gorab FL in complex with Sas6 F143D FL. (E) MBP-Gorab ‘CC long’ (aa 191–338) in complex with Sas6 F143D FL. (F) MBP-Gorab ‘CC short’ (aa 191–279) in complex with Sas6 F143D FL. Arrowheads indicate the visualized particles of Sas6, Gorab, or the Sas6–Gorab complex. In case of Gorab constructs, only the N-terminal MBP tag is visualized by rotary shadowing. Scale bar: 100 nm.
Figure 6 with 3 supplements
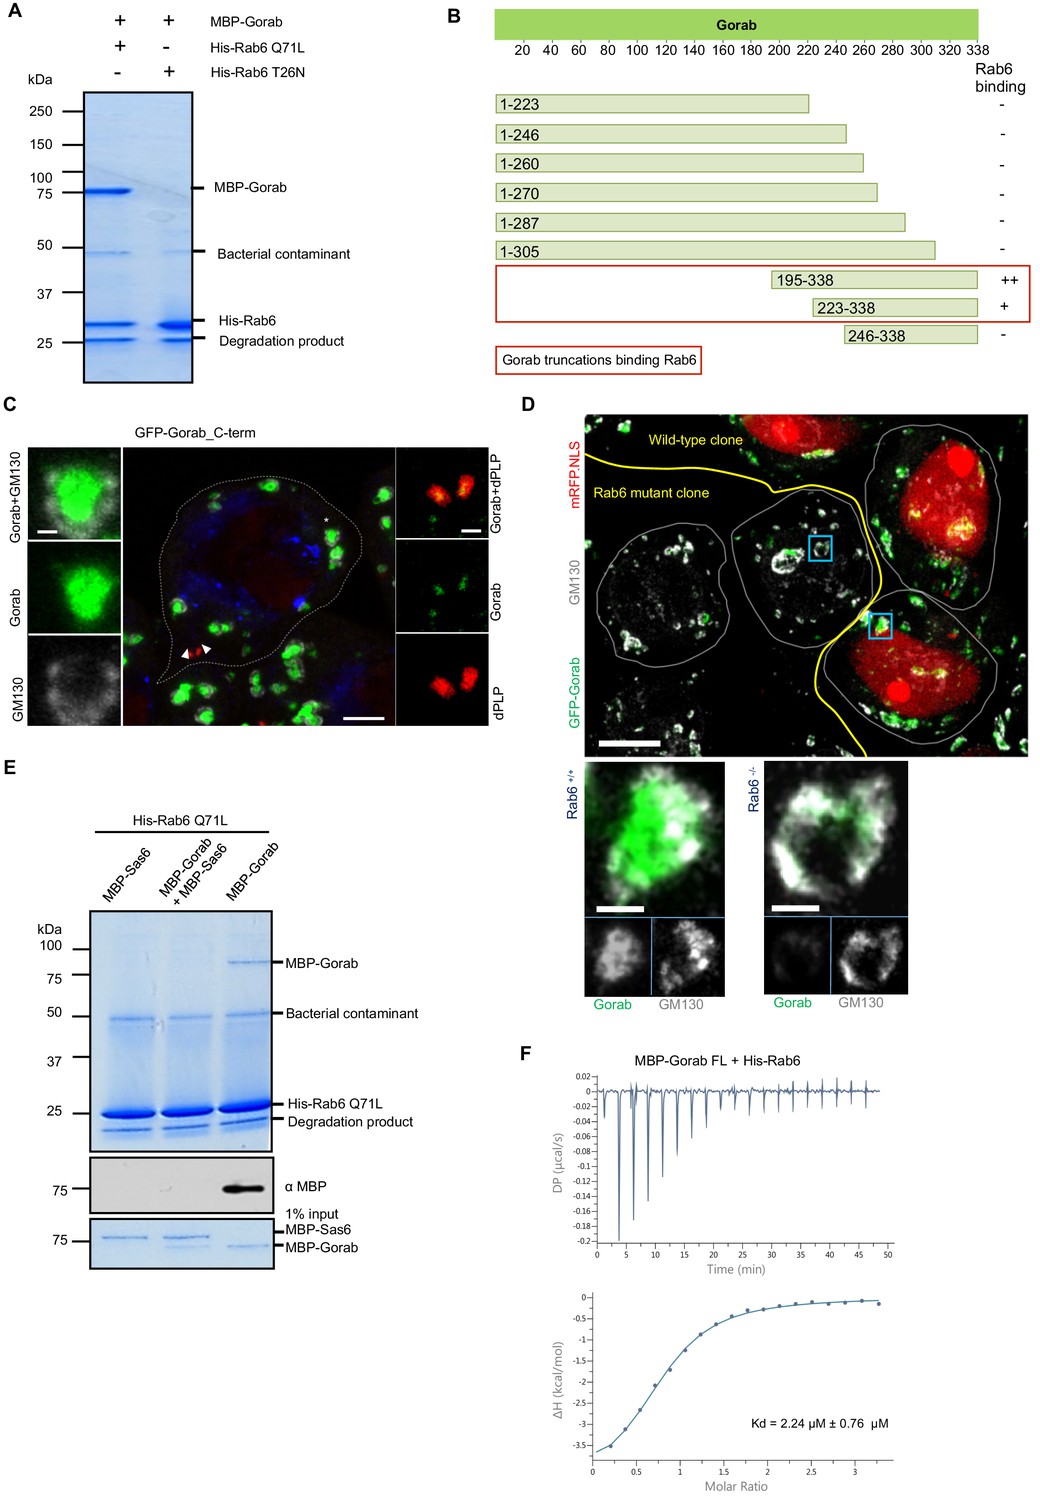
Gorab interacts with Rab6 via its C-terminal domain.
(A) Binding assay for His-Rab6 Q71L (GTP-locked) and His-Rab6 T26N (GDP-locked) with MBP-Gorab. SDS-PAGE shows Rab6 Q71L or Rab6 T26N as bait and Gorab as prey. Gorab binds only the active (GTP-locked) form of Rab6. (B) Schematic showing binding of Gorab truncations to Rab6 in vitro. –: no binding; +: binding; ++: strong binding. Red box: region of Gorab essential for Rab6 binding. Individual binding results for each construct are presented in Figure 6—figure supplement 1B. (C) Localization of C-terminal ‘half’ (CTH, aa 195–338) of Gorab in interphase primary spermatocytes of adult testes Primary spermatocytes expressing N-terminally GFP-tagged CTH-Gorab by a poly-ubiquitin promoter were stained to reveal GM130 (Golgi marker, white) and dPLP (centrosome marker, red). Asterisks: Golgi bodies; arrowheads: centrosomes shown in insets. In total, 30 primary spermatocyte were imaged, all showing similar localization. Scale bar: 5 µm; scale bar in insets: 1 µm. (D) Golgi localization of Gorab depends on Rab6. Confocal micrographs of mutant mosaic spermatocytes generated by FLP-FRT recombination in rab6 heterozygous males expressing GFP-Gorab, stained for Golgi marker GM130. Rab+/+ (red nuclei) and Rab6-/- (nuclei not labeled) cells are indicated. Scale bar: 10 µm; inset scale bar: 1 µm. (E) SDS-PAGE and western blot of in vitro binding assay for His-Rab6 (bait) with MBP-Gorab, MBP-Sas6, or complex MBP-Gorab-MBP-Sas6 (prey). Upper panel: SDS-PAGE showing His-Rab6 Q71L is not able to bind Gorab when Gorab is in the complex with Sas6. Central panel: western blot revealing Gorab; lower panel: SDS-PAGE of the Gorab, Sas6, and Gorab–Sas6 input. (F) ITC profile of His-Rab6 Q71L interacting with MBP-Gorab FL WT. Indicated Kd with standard deviation is the average value of the ITC experiment performed in triplicate.
Figure 6—figure supplement 1
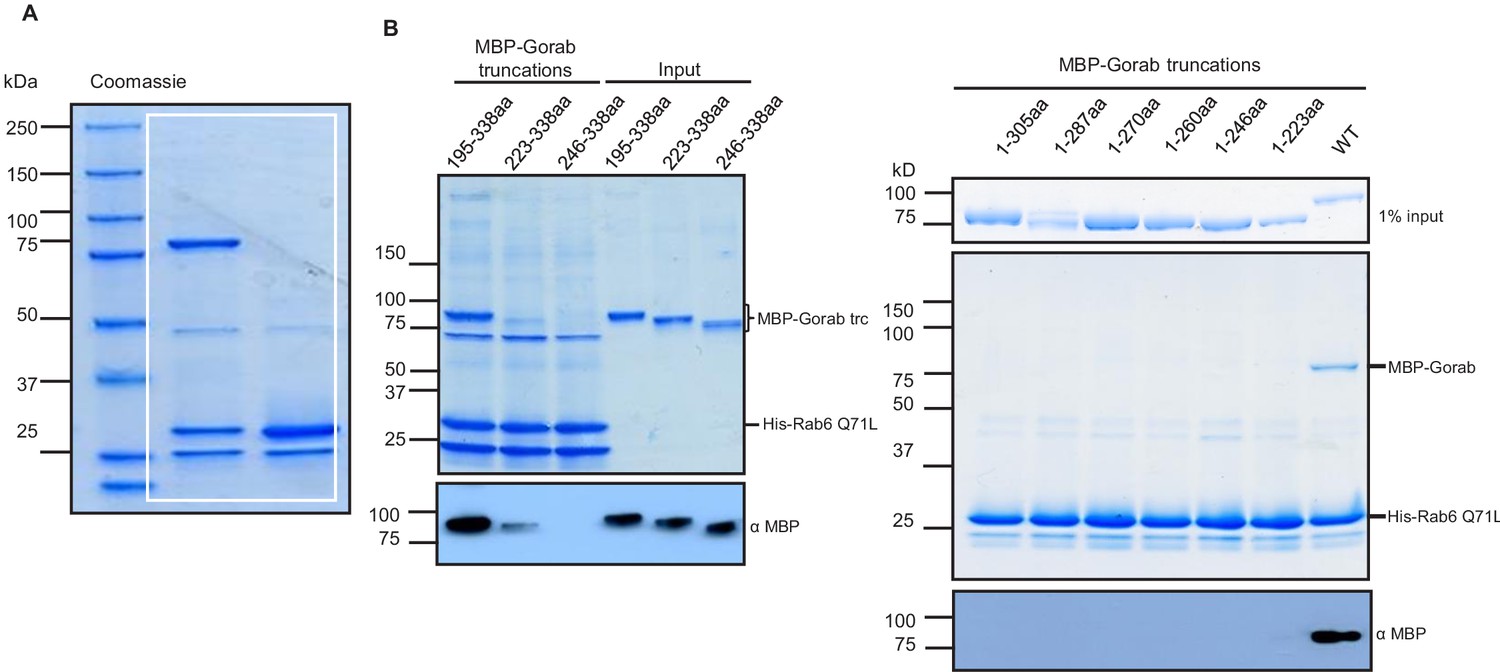
Regions of Gorab required to interact with Rab6.
(A) Uncropped SDS-PAGE of binding assay for His-Rab6 Q71L (GTP-locked) and His-Rab6 T26N (GDP-locked) with MBP-Gorab and corresponding to Figure 6A. SDS-PAGE shows Rab6 Q71L or Rab6 T26N as bait and Gorab as prey. (B) Binding assay of MBP-Gorab truncations (prey) to His-Rab6 (bait) in vitro. Upper panels: SDS-PAGE; lower panels: western blot revealing MBP-Gorab truncations.
Figure 6—figure supplement 2
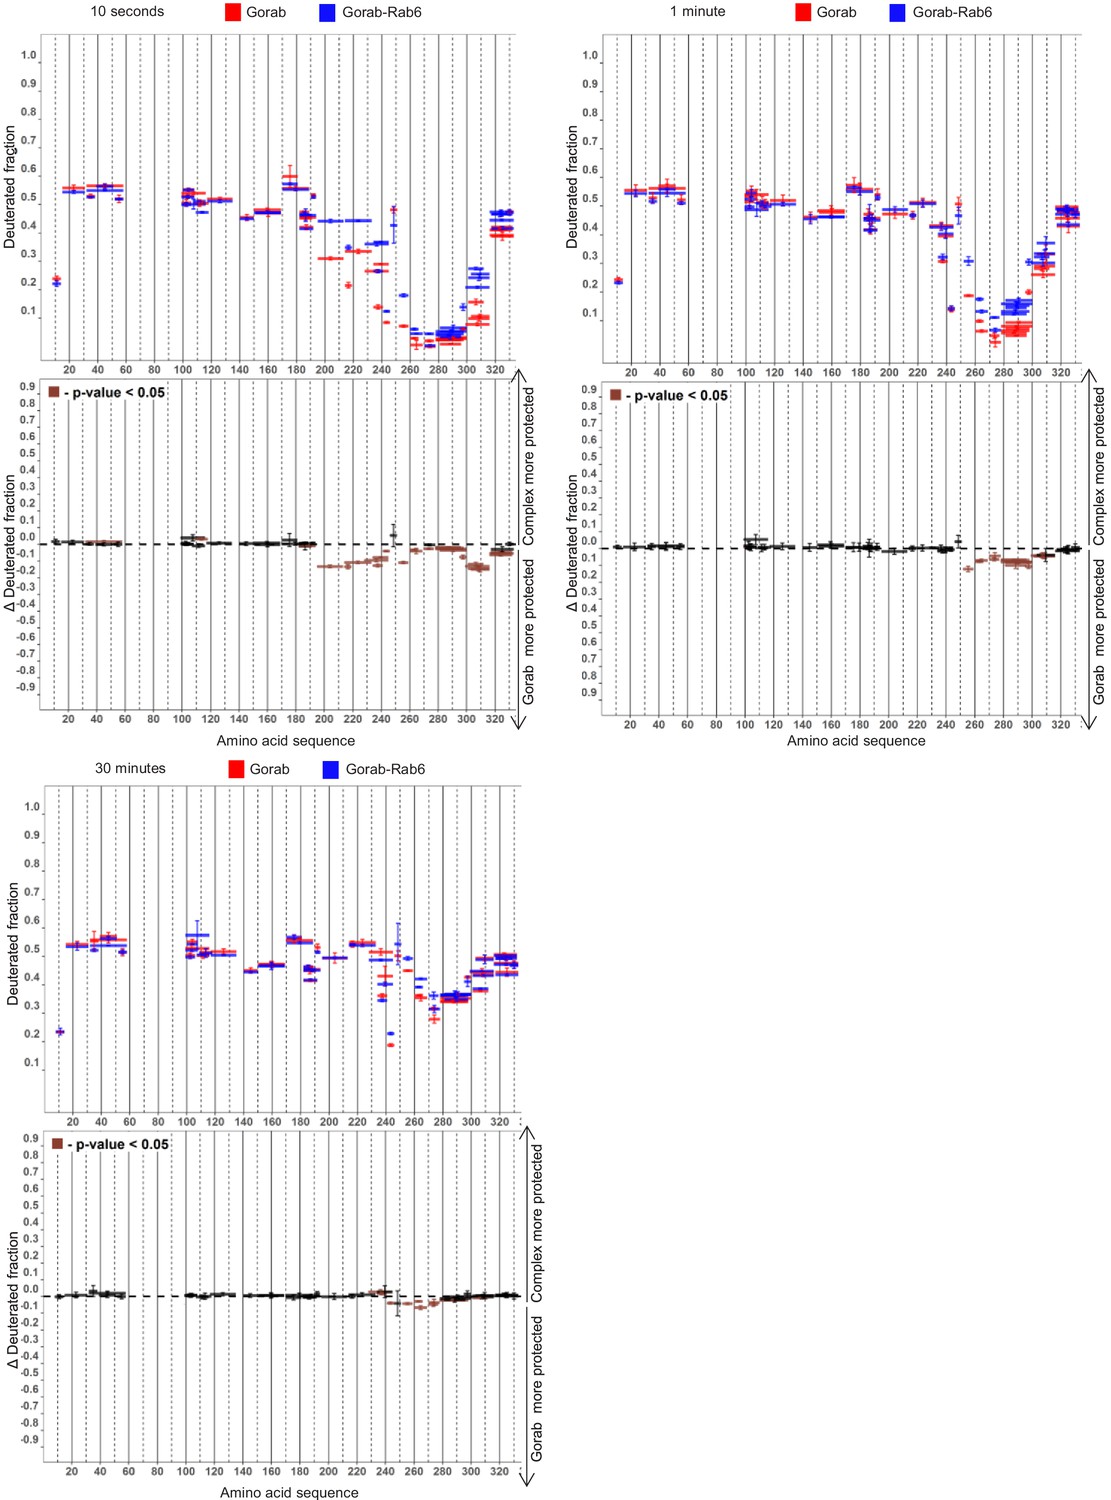
Deuteration time course identifying regions of Gorab that interact with Rab6.
Hydrogen–deuterium exchange pattern of Gorab when in complex with Rab6 following 10 s, 1 min, or 30 min incubations with D2O. Upper panels: Gorab peptides alone (red bars) and when in complex with Rab6 (blue bars). X-axis: position of peptides in amino acid sequence; Y-axis: fraction of deuteration as compared to maximum level of calculated deuteration. Mean of three experiments is shown. Error bars represent standard deviations. Lower panels: differences between deuteration of Gorab peptides alone and in complex with Rab6, derived by subtraction of deuteration levels shown in the upper panel. Brown bars indicate peptides for which the differences measured in repeated experiments satisfied the Welsh t-test with p<0.05.
Figure 6—figure supplement 3
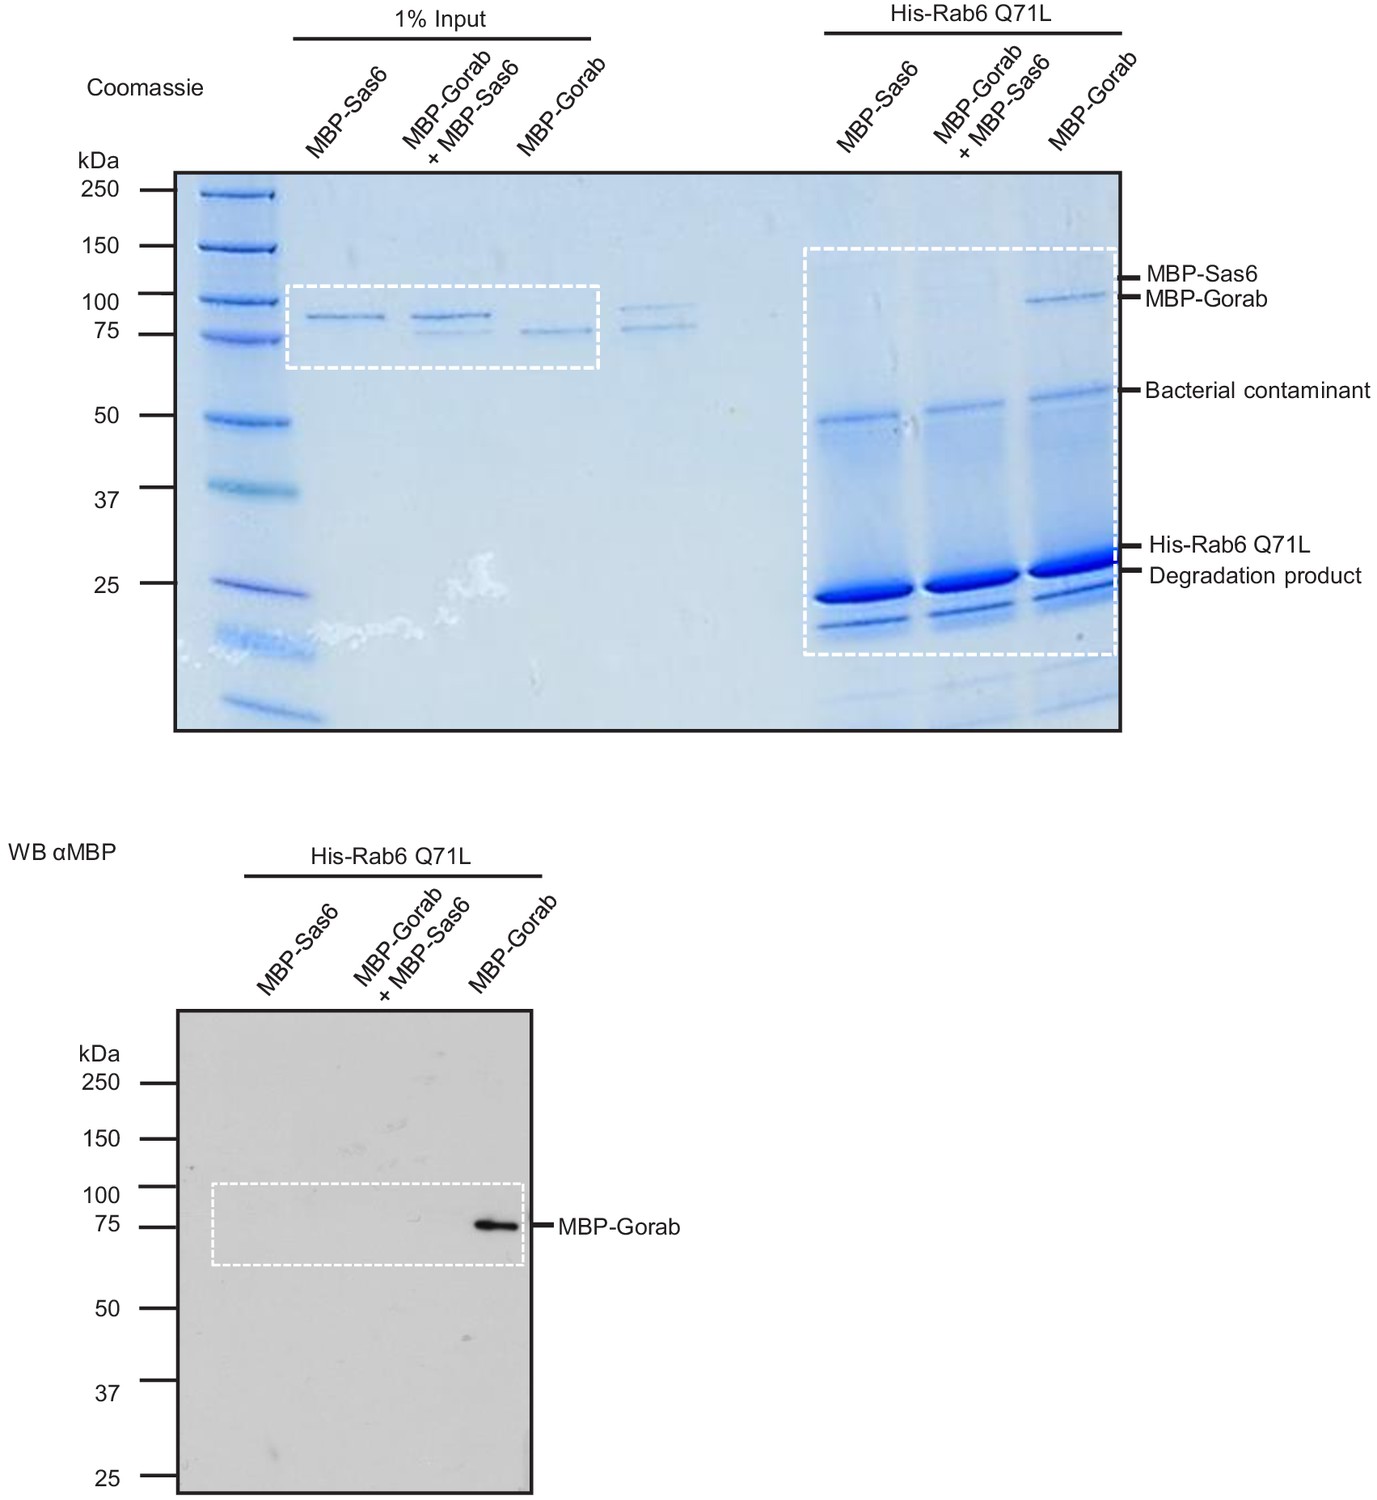
Sas6 interferes with binding of Gorab to Rab6.
Uncropped SDS-PAGE and western blot corresponding to Figure 6E. Binding assay for His-Rab6 (bait) with MBP-Gorab, MBP-Sas6, or complex MBP-Gorab-MBP-Sas6 (prey). Upper panel: SDS-PAGE of binding assay and inputs; lower panel: western blot revealing Gorab.
Figure 7
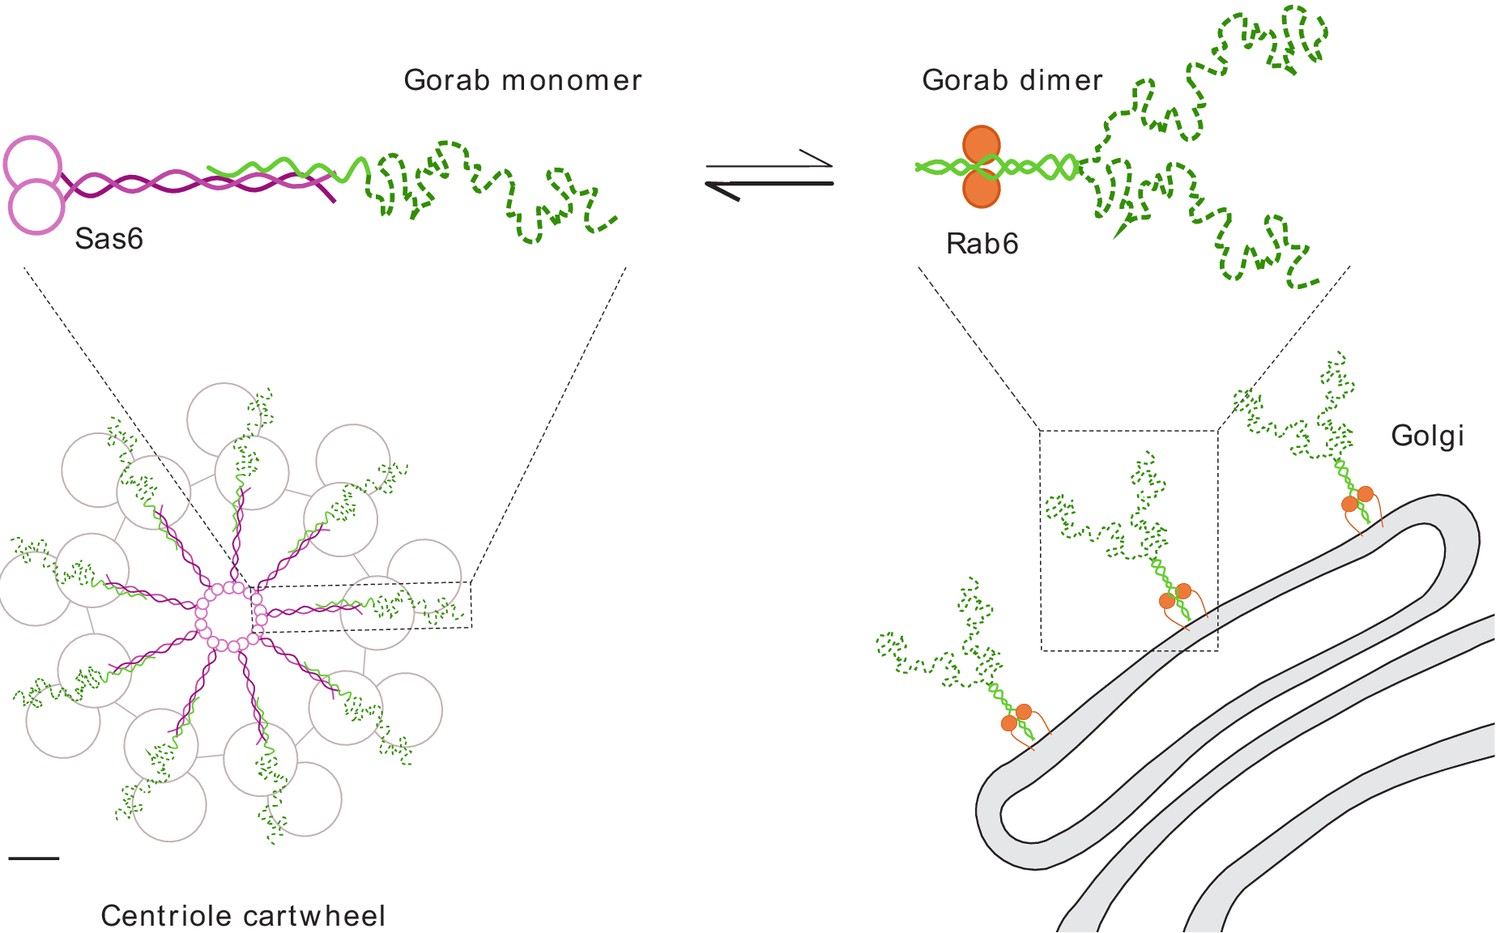
Schematic representation of Gorab, its interacting partners Sas6 and Rab6, and the cellular localization of their complexes.
Gorab is shown in green: N-terminal dynamic domain in dashed dark green and C-terminal putative coiled-coil domain in solid light green. Sas6 is shown in magenta, depicting two N-terminal head domains and the coiled coil formed in a Sas6 dimer. Rab6 is shown in orange. Although Gorab forms a dimer in solution, it dissociates to a monomer upon binding to Sas6 via its C-terminal coiled-coil domain. The Sas6–Gorab complex present in the centriole cartwheel is shown superimposed over the outer microtubule wall of Drosophila centriole consisting of MT doublets, roughly in scale (scale bar 20 nm). Gorab also interacts with Rab6 via its C-terminal coiled-coil domain, but only as a dimer and with a much weaker binding affinity compared to Sas6 binding. Interaction with Rab6 enables Gorab’s localization to the trans-Golgi network, similarly to other golgins.
Videos
Video 1
Climbing test of sas6o flies with and without indicated Sas6 variant transgenes.
Flies were transferred into assay vials without anesthesia and let them accommodate for 15 min, after which they were tapped down, and their climbing ability was assessed.
Video 2
Climbing test of gorab mutant flies.
Flies were transferred into assay vials without anesthesia and let them accommodate for 15 min, after which they were tapped down, and their climbing ability was assessed.
Additional files
Download links
A two-part list of links to download the article, or parts of the article, in various formats.
Downloads (link to download the article as PDF)
Open citations (links to open the citations from this article in various online reference manager services)
Cite this article (links to download the citations from this article in formats compatible with various reference manager tools)
The dimeric Golgi protein Gorab binds to Sas6 as a monomer to mediate centriole duplication
eLife 10:e57241.
https://doi.org/10.7554/eLife.57241


