Different theta frameworks coexist in the rat hippocampus and are coordinated during memory-guided and novelty tasks
- Instituto de Neurociencias, Consejo Superior de Investigaciones Científicas, Universidad Miguel Hernández, Spain
- Centro de Biomateriales e Ingeniería Tisular, Universitat Politècnica de València, Spain
- Instituto Cajal, Consejo Superior de Investigaciones Científicas, Spain
- Departamento de Ingeniería Industrial & IUNE, Escuela Superior de Ingeniería y Tecnología, Universidad de La Laguna, Spain
- Laboratory of Cognitive and Computational Neuroscience, Center for Biomedical Technology, Spain
- Instituto de Física Interdisciplinar y Sistemas Complejos, IFISC (CSIC-UIB), Campus Universitat de les Illes Balears, Spain
Figures
Figure 1 with 3 supplements
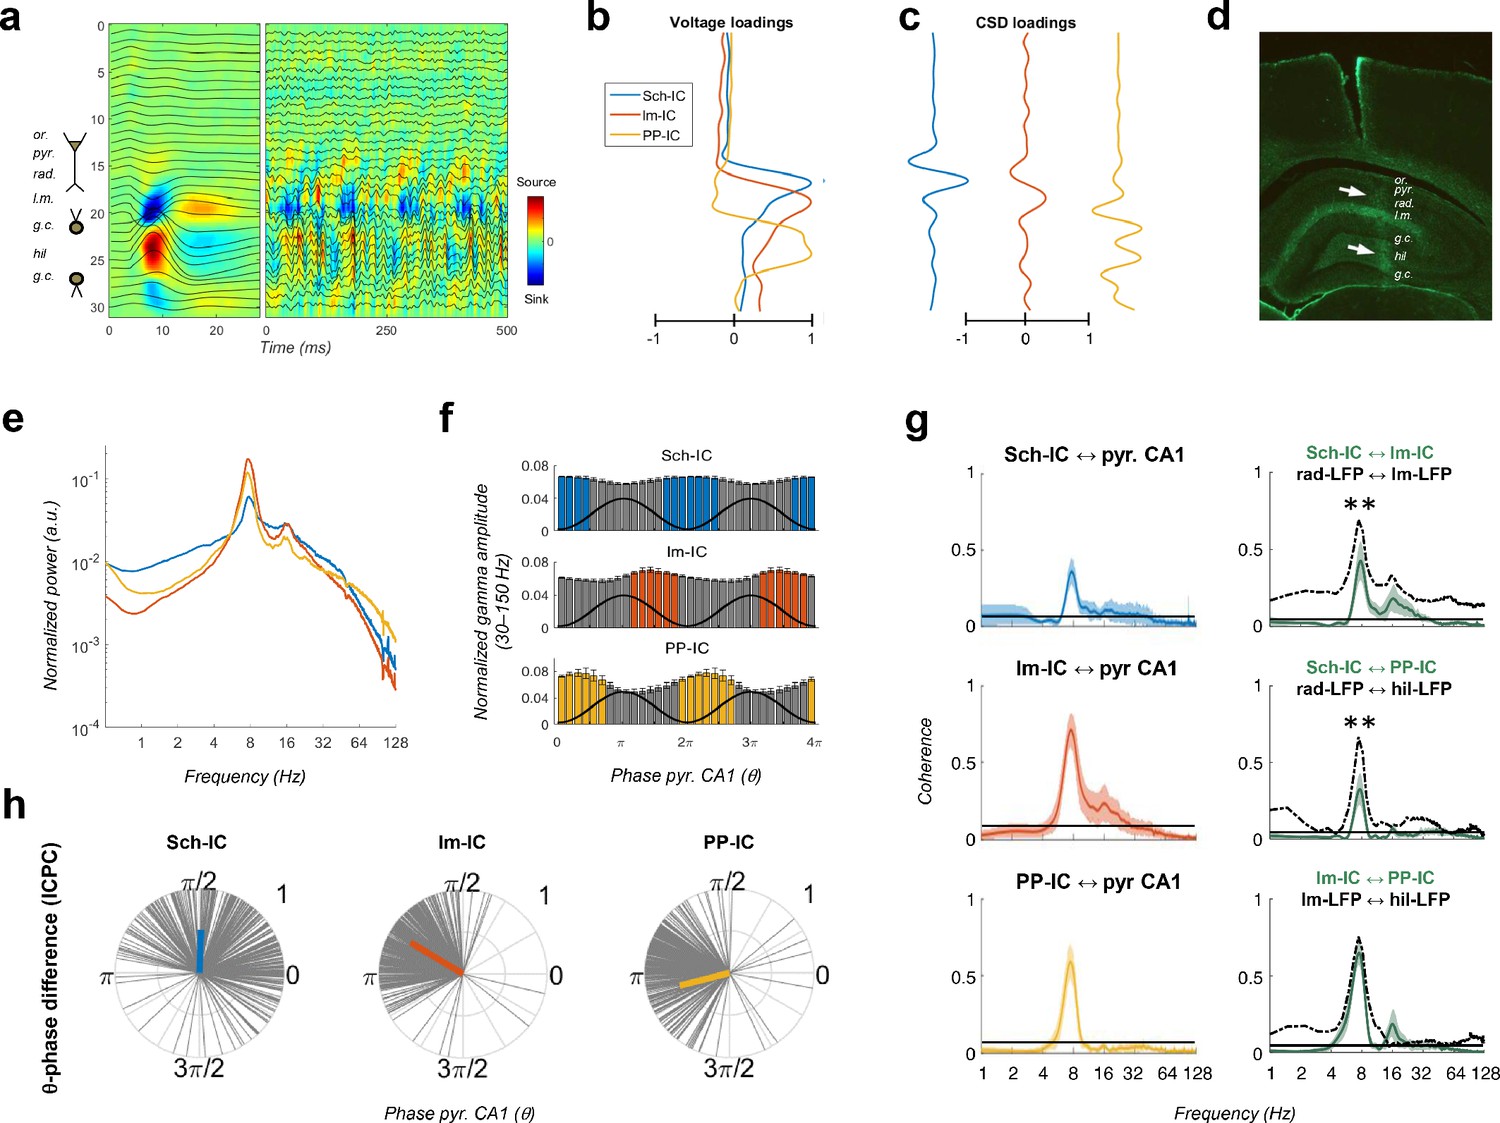
Pathway-specific local field potentials (LFPs).
(a) Depth profiles of the electrophysiological signals recorded in the dorsal hippocampus (32 recordings, sites spaced every 100 μm) evoked by an electric pulse stimulating the perforant pathway (left panel) or during resting activity (right panel). Black traces represent the LFPs and color maps the corresponding CSD. Evoked activity was used to consistently localize the electrodes during implantation. Or, stratum oriens; pyr, pyramidal layer; rad, stratum radiatum; lm, stratum lacunosum-moleculare; gc, granule cell layer; hil, hilus. (b and c) Examples of voltage- and CSD-loadings of the three pathway-specific LFPs extracted with the ICA, with maximum loadings overlapping the corresponding afferent layers in the str. radiatum (Sch-IC), lacunosum-moleculare (lm-IC) and the molecular layer of the dentate gyrus (PP-IC). (d) Position of the recording electrode (arrows) in one representative animal. The histological section is immunostained with GFAP antibodies. (e) The power spectra of the three IC-LFPs averaged across subjects show a clear peak at the theta frequency and a broadband gamma activity. (f) Distribution of gamma amplitude (mean ± s.e.m.) in IC-LFPs along the theta cycles of the LFP recorded in pyr CA1, where its trough and peak coincide with 0 and π radians, respectively. Black waves are an example of the theta oscillation. Color coded bars represent statistically significant values relative to the surrogate distribution in all animals (Materials and methods). (g) On the left panel, we plot the results of the coherence analysis comparing the IC-LFPs against the LFP recorded in pyr CA1. Black lines represent the statistical threshold. On the right panel, the coherence analysis between IC-LFPs (green lines) is compared to the coherence between raw LFP channels recorded at the layers with maximum contribution to each IC-LFP (dashed lines, **p<0.01, we used a two-way ANOVA to compare the theta coherence between pairs of IC-LFPs versus theta coherence between raw LFPs, followed by Bonferroni correction, F(1,12)=32.01, N = 5). (h) Theta phase difference between IC-LFPs and LFPs recorded in CA1 pyr layer. Gray lines represent individual theta wave’s phase relative to CA1 pyr theta trough (at 0/2π radians). Average phase is represented by the colored thick line. Length of the thick line represents ICPC.
Figure 1—figure supplement 1
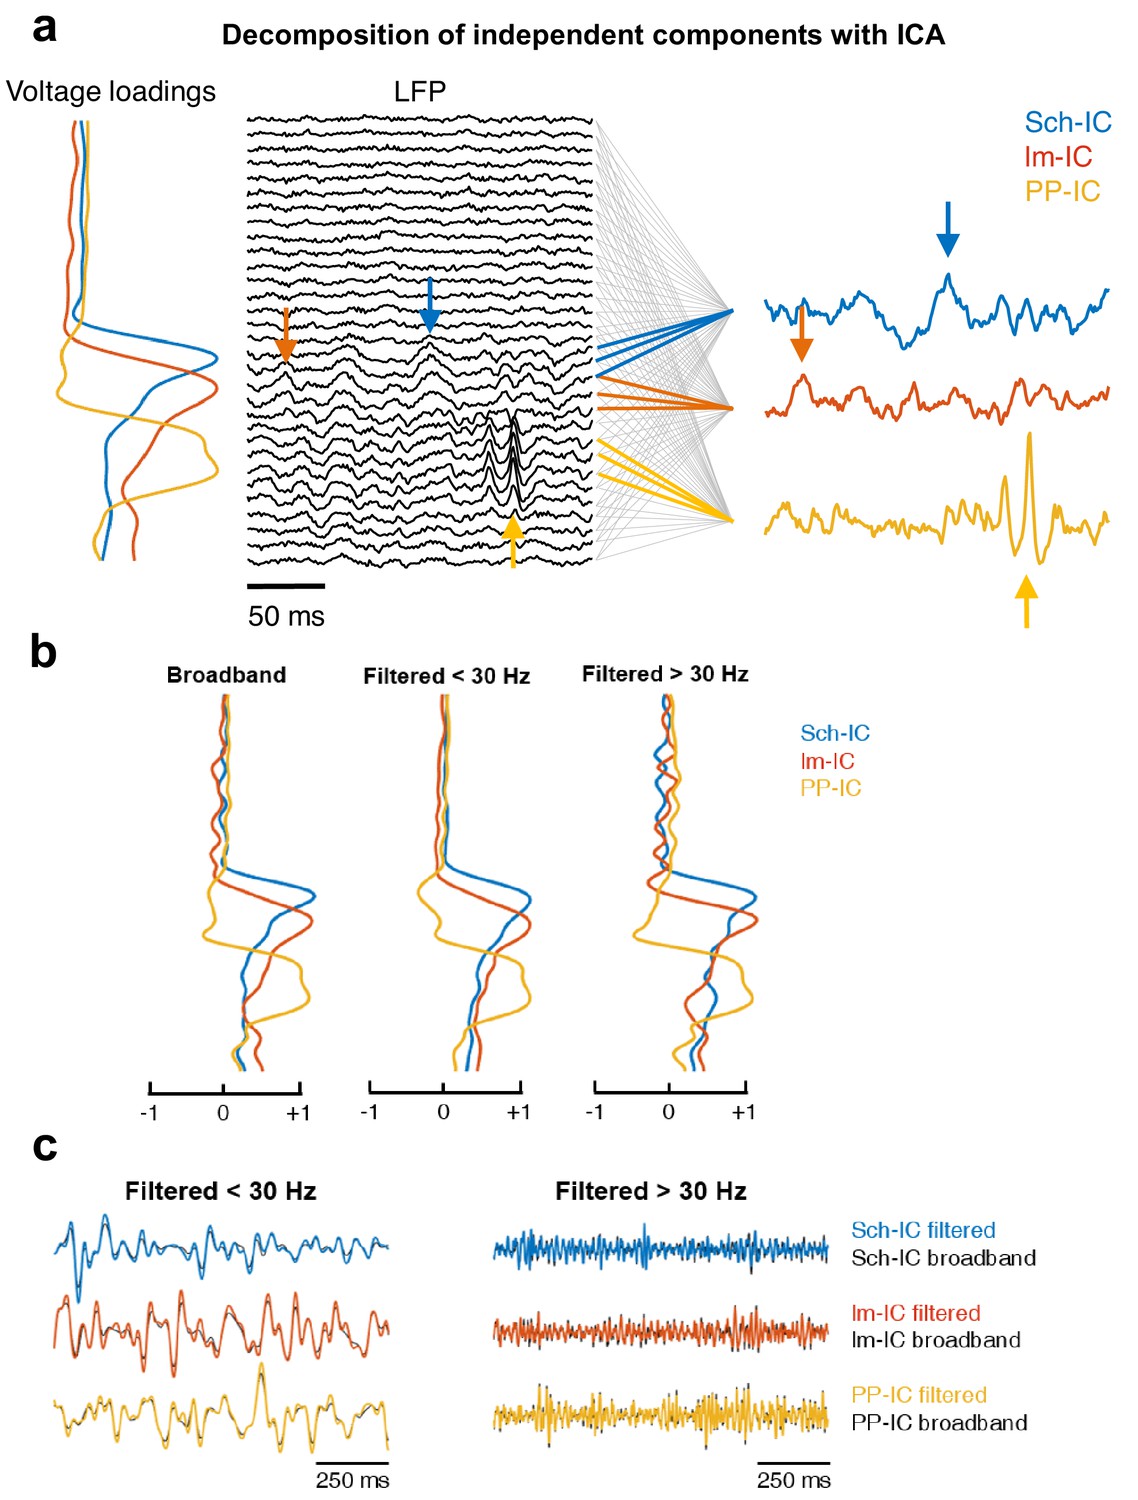
Example of application of ICA.
(a) Diagram of the decomposition of independent components with ICA. The algorithm computes a mixing matrix or voltage loadings which represents the contribution of the sources (independent components) to each LFP channel. The lines between the LFP and the three IC-LFPs indicate which LFP channels have information of each source, based on the voltage loadings. Those channels with a minor contribution are linked with gray lines, while in color there are the channels with the main contribution of each IC-LFP. Note that one LFP channel may contain information of different sources at the same time. We can identify how specific events in the IC-LFPs are spread along their associated LFP channels (arrows). (b) Voltage loadings obtained from an ICA applied to the raw (broadband) LFP recording (left), to the same LFP but low-pass filtered at 30 Hz (center) or high-pass filtered at 30 Hz (right). In all cases, the three main components share a common spatial pattern, with maximums at their afferent hippocampal pathway. (c) Examples of time series comparing the IC-LFP extracted by computing the ICA algorithm and then filtering the signal (black traces), versus those obtained by filtering first the LFPs and then applying ICA (color-coded traces). There are no significant differences neither in the phase of the theta rhythm (center, low-pass filtered at 30 Hz) nor in the amplitude of gamma oscillations (right, high-pass filtered at 30 Hz).
Figure 1—figure supplement 2
Error in phase estimation in function of theta power.
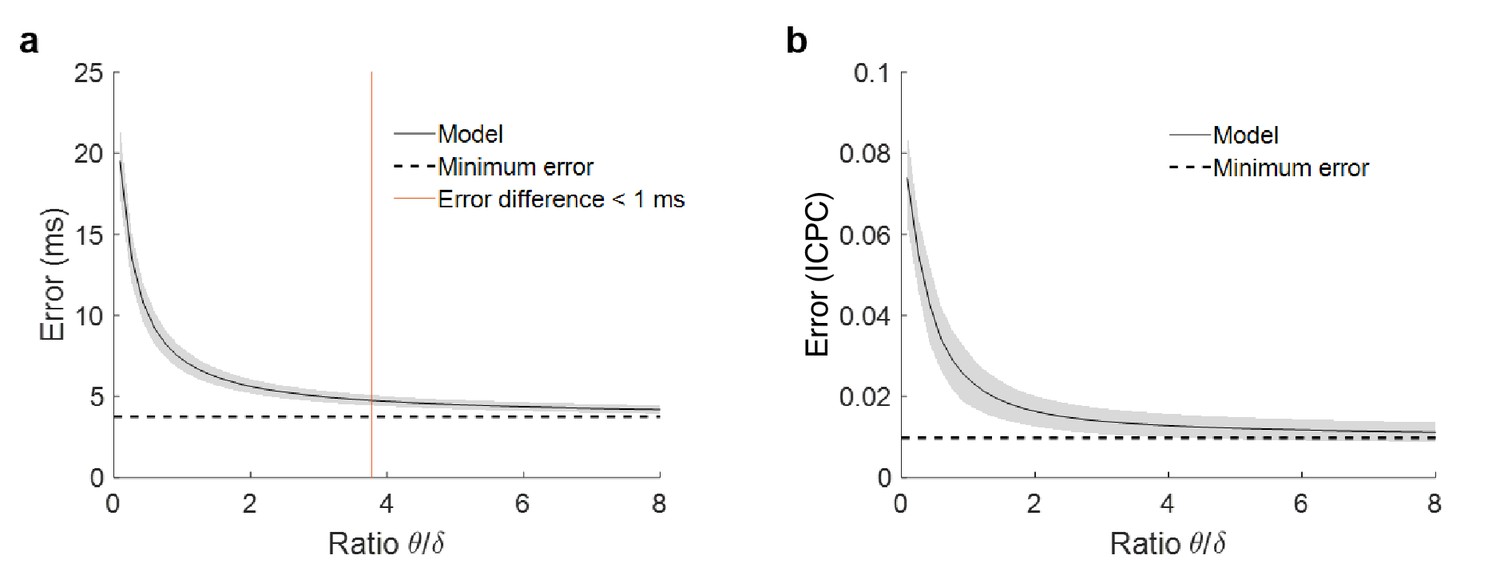
(a) Phase estimation error for simulations with different ratio between theta and delta power. Each point of the solid black line represents the mean error and the grey shadow the standard deviation over 100 simulations. The dashed line is the minimum error, when no noise is added to the model and the estimation does not depend on theta power. The red line marks the point where error due to power is lower than one millisecond (ratio = 3.78). (b) Estimation of the error in the ICPC between two signals as a function of the ratio between theta and delta, following the same methodology as in panel (a) to simulate the signals. For a ratio of 3.78, the accuracy of the ICPC value has and error lower than ±0.01.
Figure 1—figure supplement 3
Examples of synchronization using ICPC.
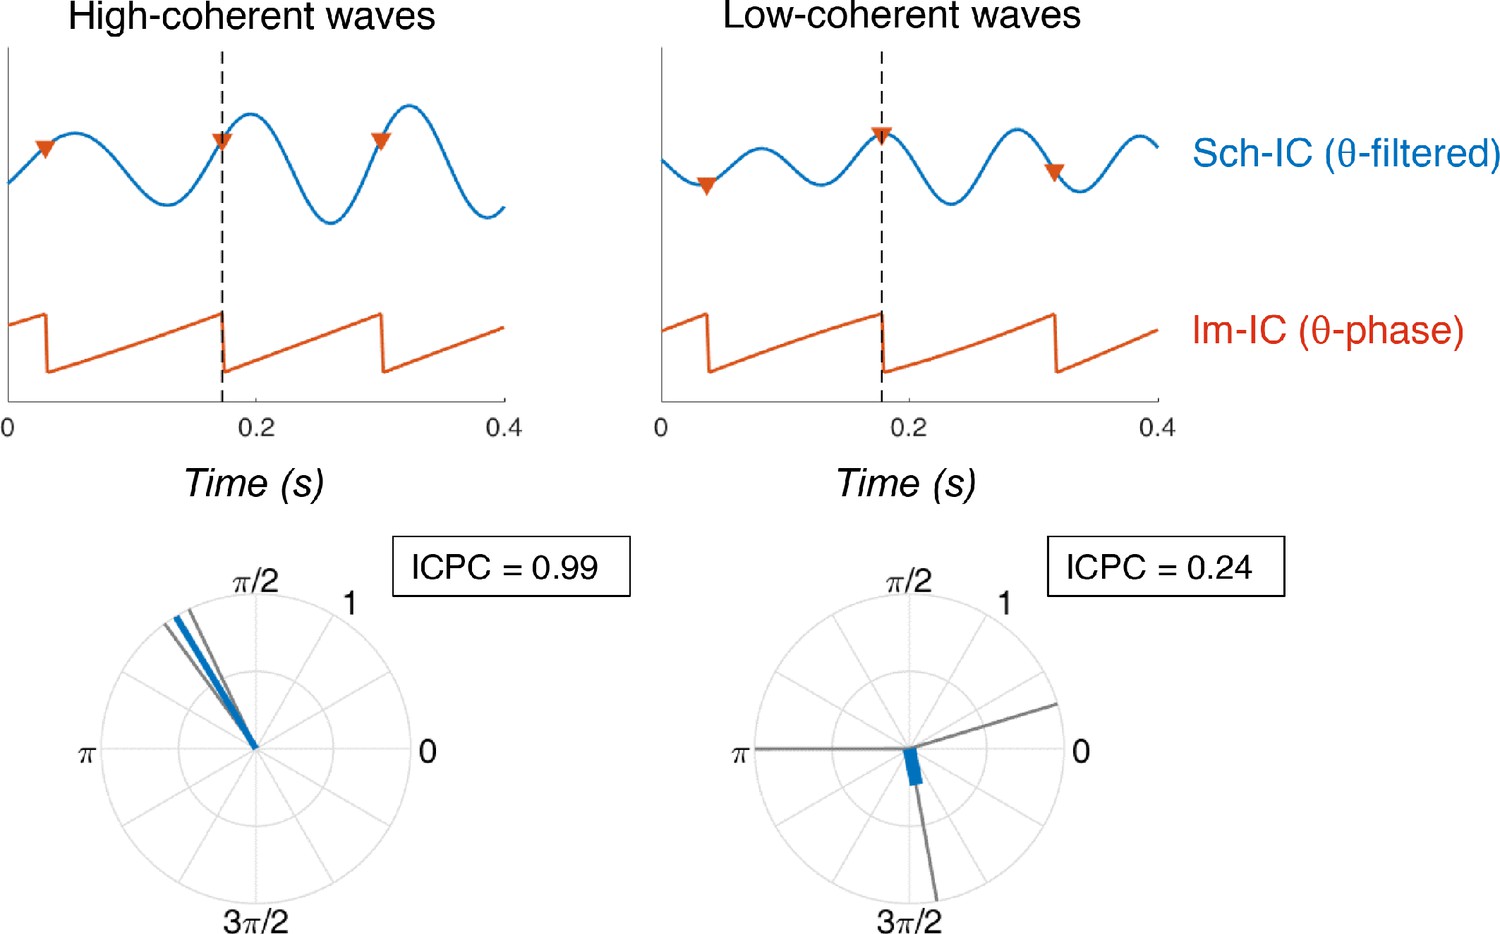
(Top) Temporal traces of Sch-IC (filtered at theta frequency) and the theta phase of lm-IC. Each step in the saw-tooth signal (π radians) is marked with a red triangle and corresponds to a peak in the theta oscillation of lm-IC. Black dashed lines indicate the cycle under consideration. (Bottom) The synchronization between signals is measured by computing the ICPC using the previous, present and consecutive cycles.
Figure 2 with 1 supplement
Different theta frameworks coexist in the dorsal hippocampus.
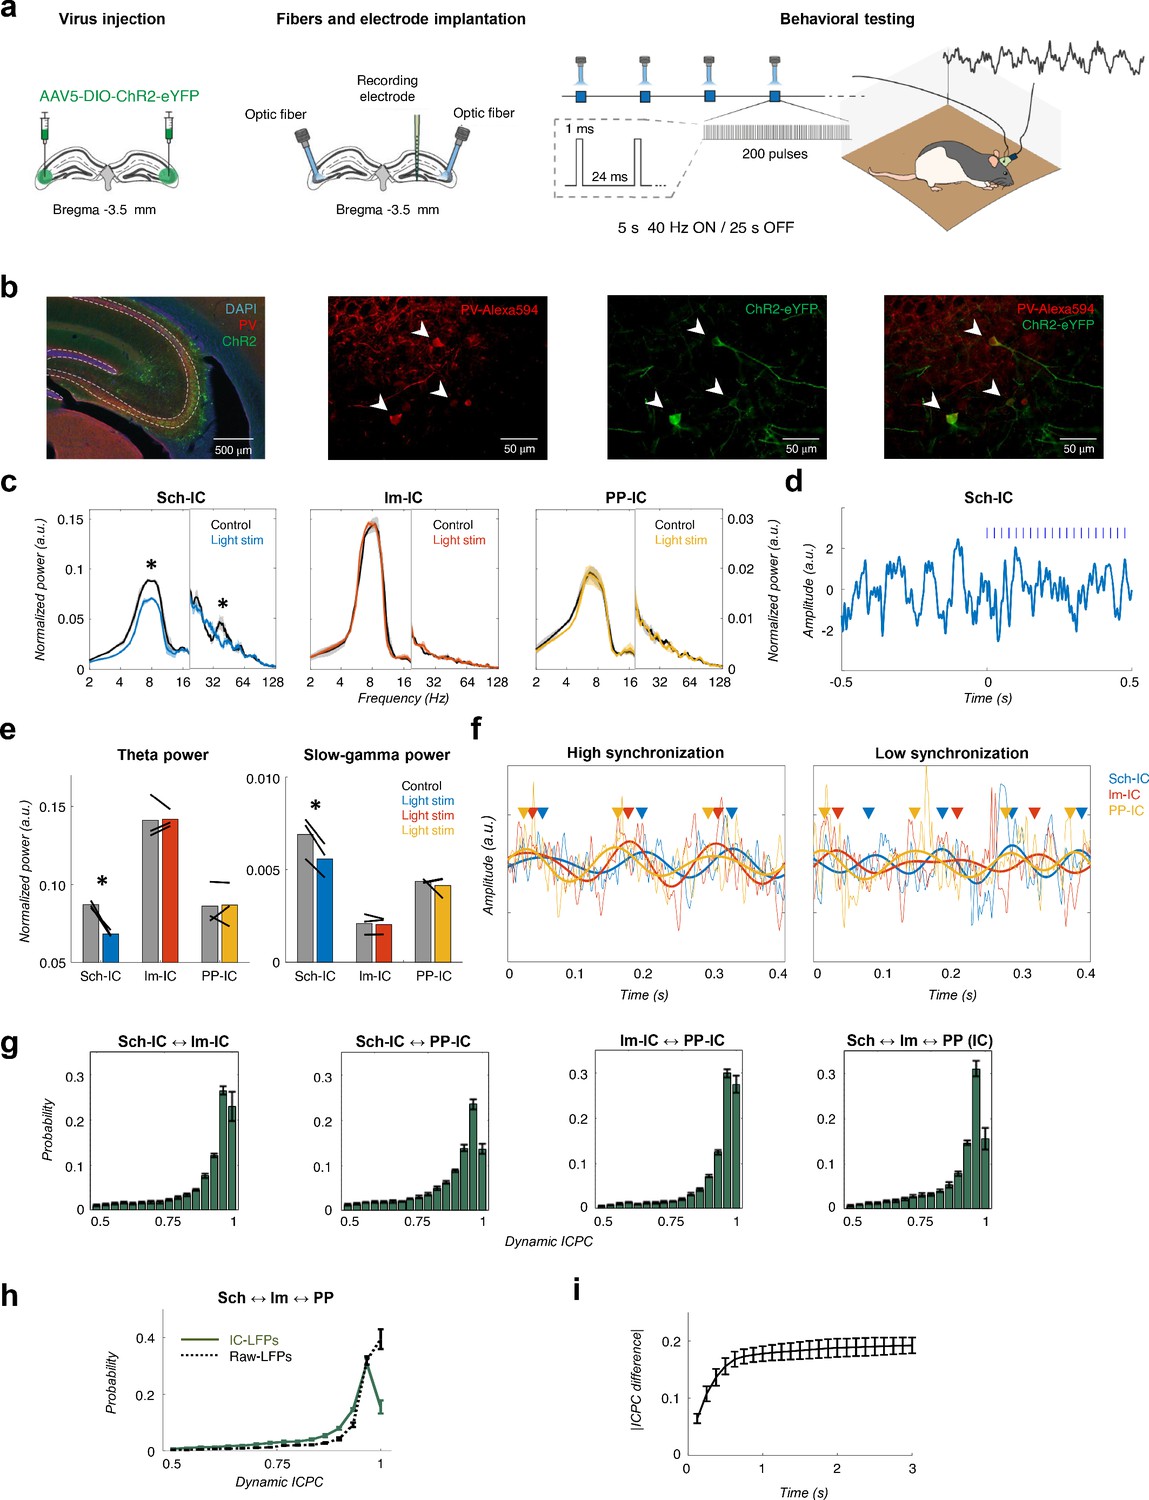
(a) Schematic representation of virus injections (left), implantation of optic fibers and multichannel electrode (middle) and experimental setup and stimulation protocol (right). (b) Representative images of coronal sections confirming the specificity of ChR2 infection in PV interneurons in dorsal CA3. Left, low magnification image showing overlapped DAPI staining (blue), PV+ immunostaining (red) and ChR2-eYFP expression (green). Right, higher magnification images from the CA3 region showing PV+ immunostaining (red), ChR2-eYFP expression (green) and their co-localization. White arrows point to double PV+ and eYFP+ interneurons. (c) Optogenetic manipulation of PV interneurons. Power spectra analysis (mean ± s.e.m.) of the IC-LFPs during light OFF (black traces) and light ON (colored traces) conditions. Blue light (470 nm) illumination reduced theta and slow-gamma power selectively in Sch-IC. Note different y-axis scales for low (<20 Hz) and high (>20 Hz) frequencies for visualization purposes. (d) Representative example of changes in theta rhythm in Sch-IC during stimulation. Blue lines represent light pulses. (e) Statistical comparison between theta (left) and slow-gamma power (right) in control (grey bars) and during light stimulation (color bars; *p<0.05, paired t-test, t = 7.88/7.34 for theta/gamma Sch-IC, N = 3). Black lines represent different subjects. (f) Traces of raw and theta-filtered IC-LFPs showing epochs with high (left) and low (right) phase locking between their rhythms. Triangles pointing to the peak of theta cycles in each IC-LFP (differentiated by colors as before) are used to highlight variability in phase differences. (g) Distribution of ICPC values per theta cycle between pairs of components or with the three IC-LFPs simultaneously (mean ± s.e.m). (h) Distribution of ICPC values between the three IC-LFPs (green lines) and between the raw LFPs. (i) Dynamics of ICPC changes. The y axis represents the average ICPC differences in absolute values between two cycles, and the x axis represents the time difference between their occurrences. Consecutive cycles demonstrate more similar ICPC values than those separated in time up to 0.75 s.
Figure 2—figure supplement 1
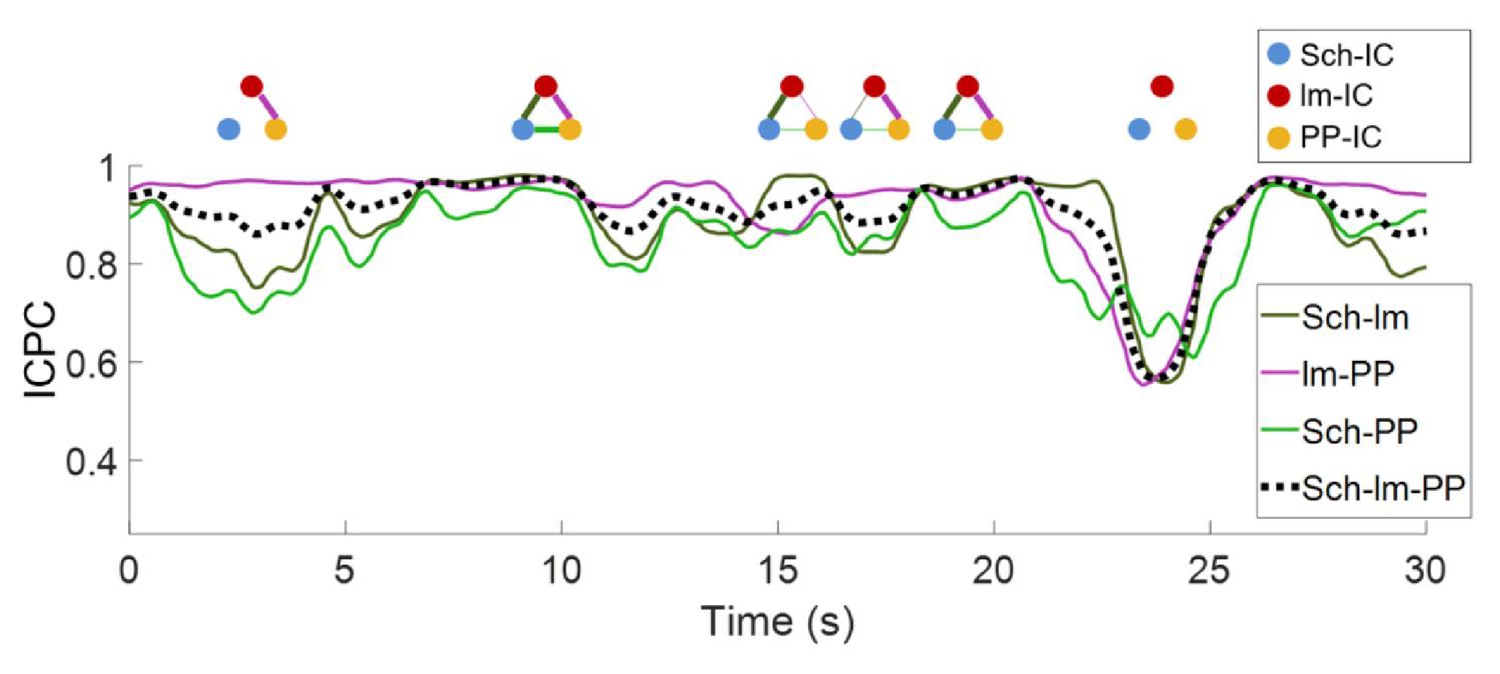
Representative values of ICPC in one animal along time.
The dashed line represents the ICPC computed between the three IC-LFPs, while color-coded curves are the ICPC between pairs of IC-LFPs. A schematic diagram of the connectivity at specific time points is shown at the top, where the thickness of the lines represents the ICPC value between pairs. For clarity, epochs of lower ICPC are represented as nodes without links.
Figure 3 with 2 supplements
Theta-gamma coupling reflects pathway-specific interactions.
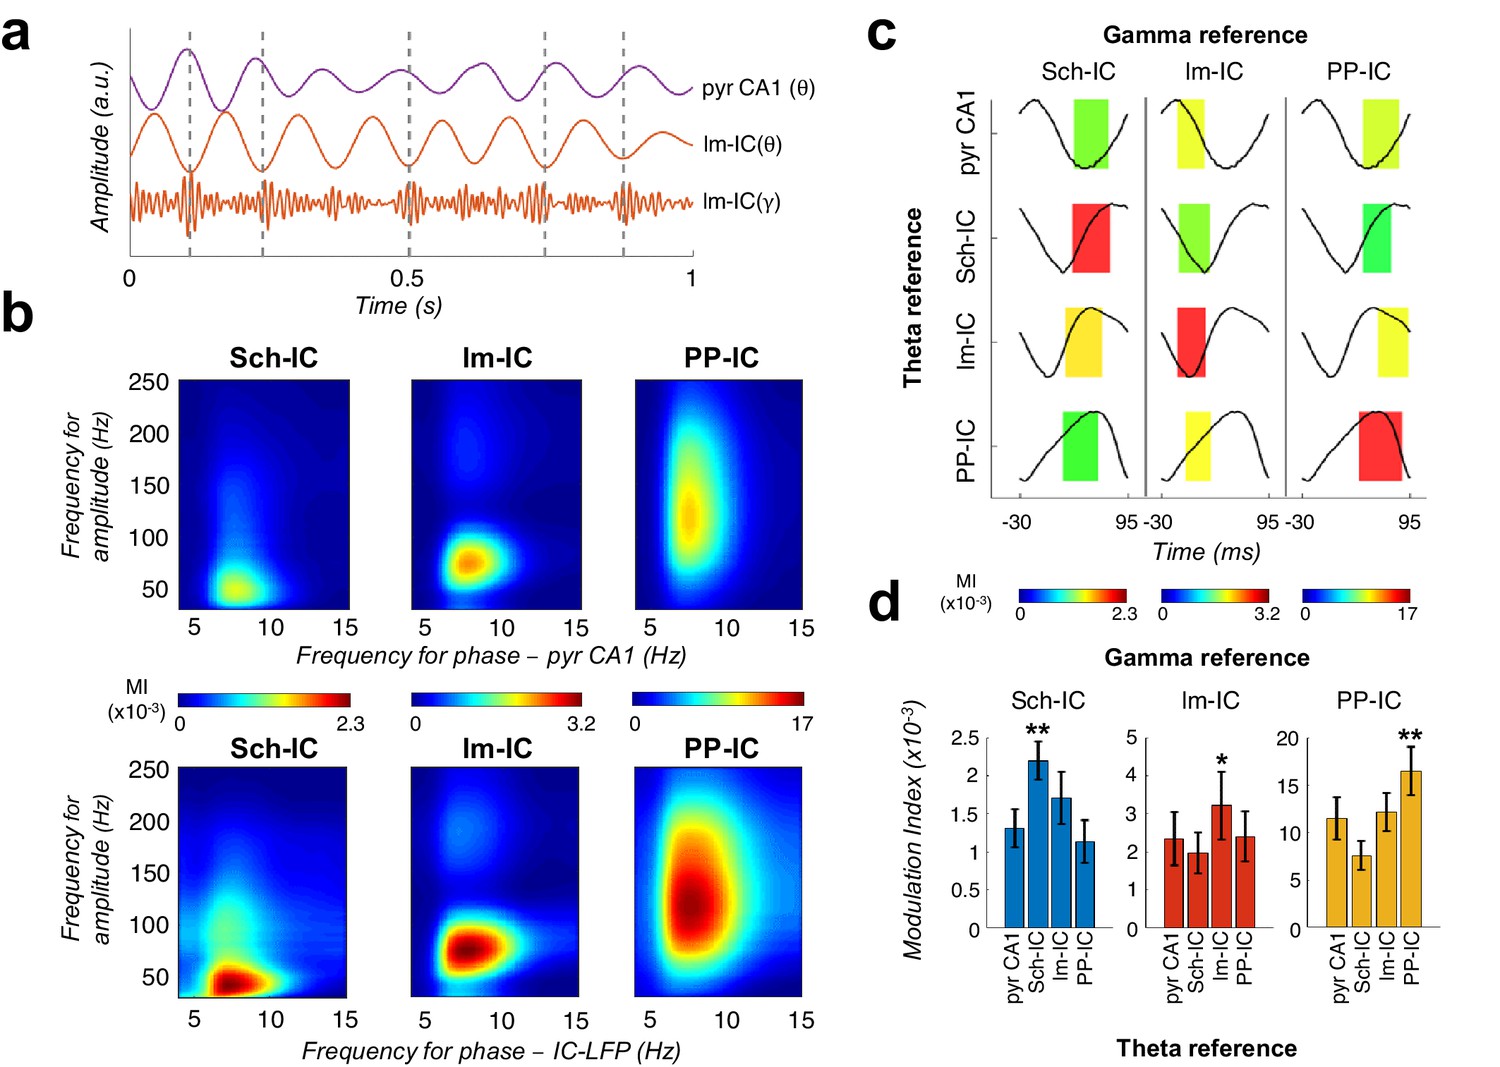
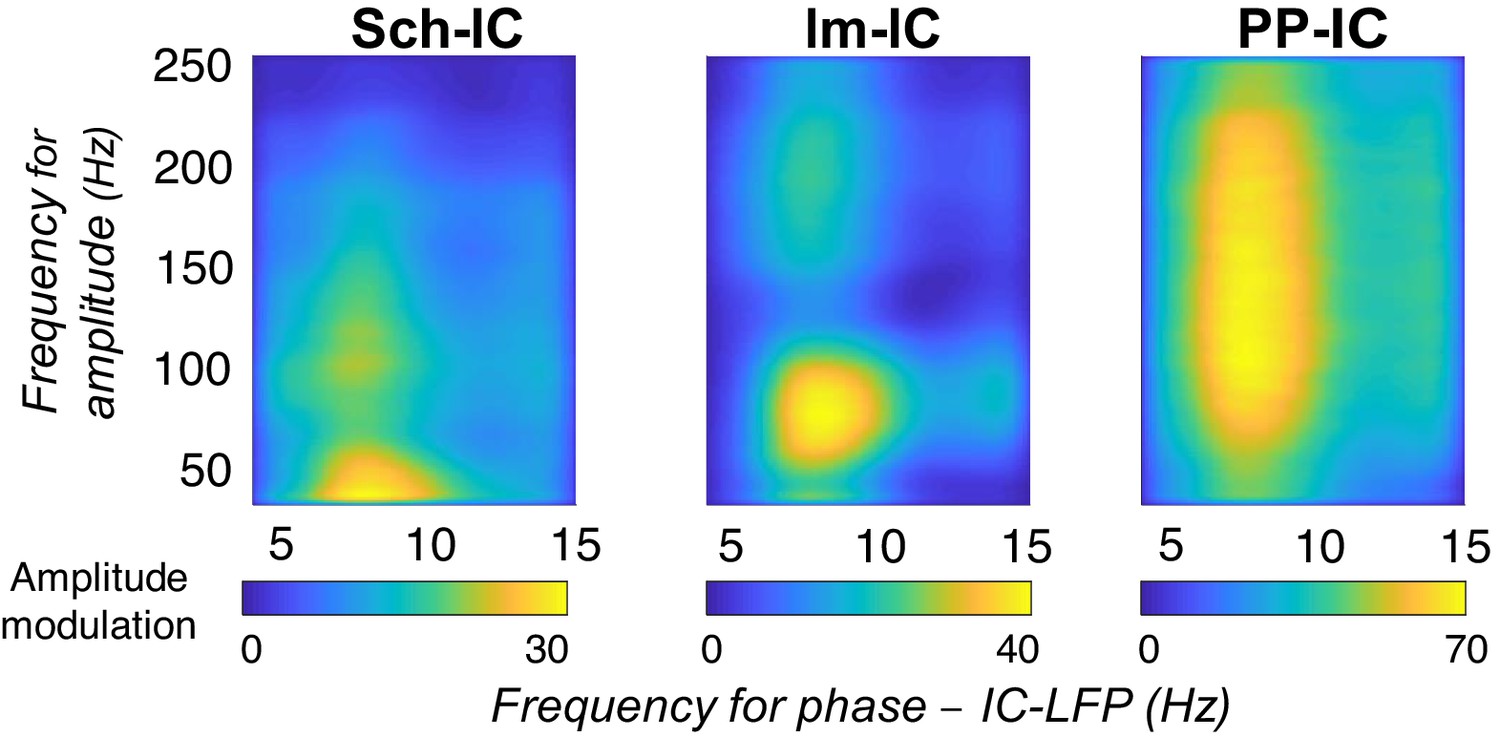
(a) Representative theta- and gamma-filtered traces of lm-IC showing how the gamma envelope is phase-locked at the trough of the theta oscillation recorded in the same IC-LFP (highlighted with dashed lines), but not with the oscillation recorded in the CA1 pyramidal layer (pyr CA1). (b) Modulation strength (color coded MI) of gamma amplitude (30–250 Hz) in the IC-LFPs and the theta phase recorded in the pyr CA1 LFP (upper panels) and the pathway-specific thetas in the corresponding IC-LFPs (lower panels). (c) Interregional CFC across all gamma and theta oscillations recorded in the three IC-LFPs and pyr CA1. Each rectangle represents the MI between the theta phase and the gamma amplitude at a single specific frequency (gamma reference: slow/medium/fast gamma for Sch-IC/lm-IC/PP-IC). The location and width of the rectangles indicate the theta phase at which gamma amplitude is coupled, and the color indicates the MI (color scales at the bottom of each column). Theta waveforms (black traces) are extracted as the average of all theta cycles in the corresponding signals. The highest CFC strength (red rectangle) was always found between theta and gamma oscillations of the same pathway. (d) Maximum theta-gamma CFC corresponds to oscillations recorded in the same IC-LFP, higher than any between-pathway combination. Left/middle/right panel represents the MI (mean ± s.e.m.) between slow/medium/fast gamma recorded from Sch-IC/lm-IC/PP-IC, and the theta phase of all IC-LFPs and the LFP from pyrCA1. Significantly stronger MI values were found in all cases when theta phases were calculated from the corresponding pathway-specific generators, in contrast to pyr CA1 LFP, and when theta and gamma oscillations had the same origin (*/**p<0.05/0.01, one-way ANOVA of repeated measurements between MI with the same theta reference, followed by Bonferroni correction, F(1.182, 4.729)=36.16/F(1.133, 4.531)=8.649/F(1.555, 6.219)=35.32 for Sch-IC/lm-IC/PP-IC as theta reference, N = 5).
Figure 3—figure supplement 1
CFC between gamma amplitude and theta phase of each IC-LFP following the index proposed in Canolty et al., 2006.
Figure 3—figure supplement 2
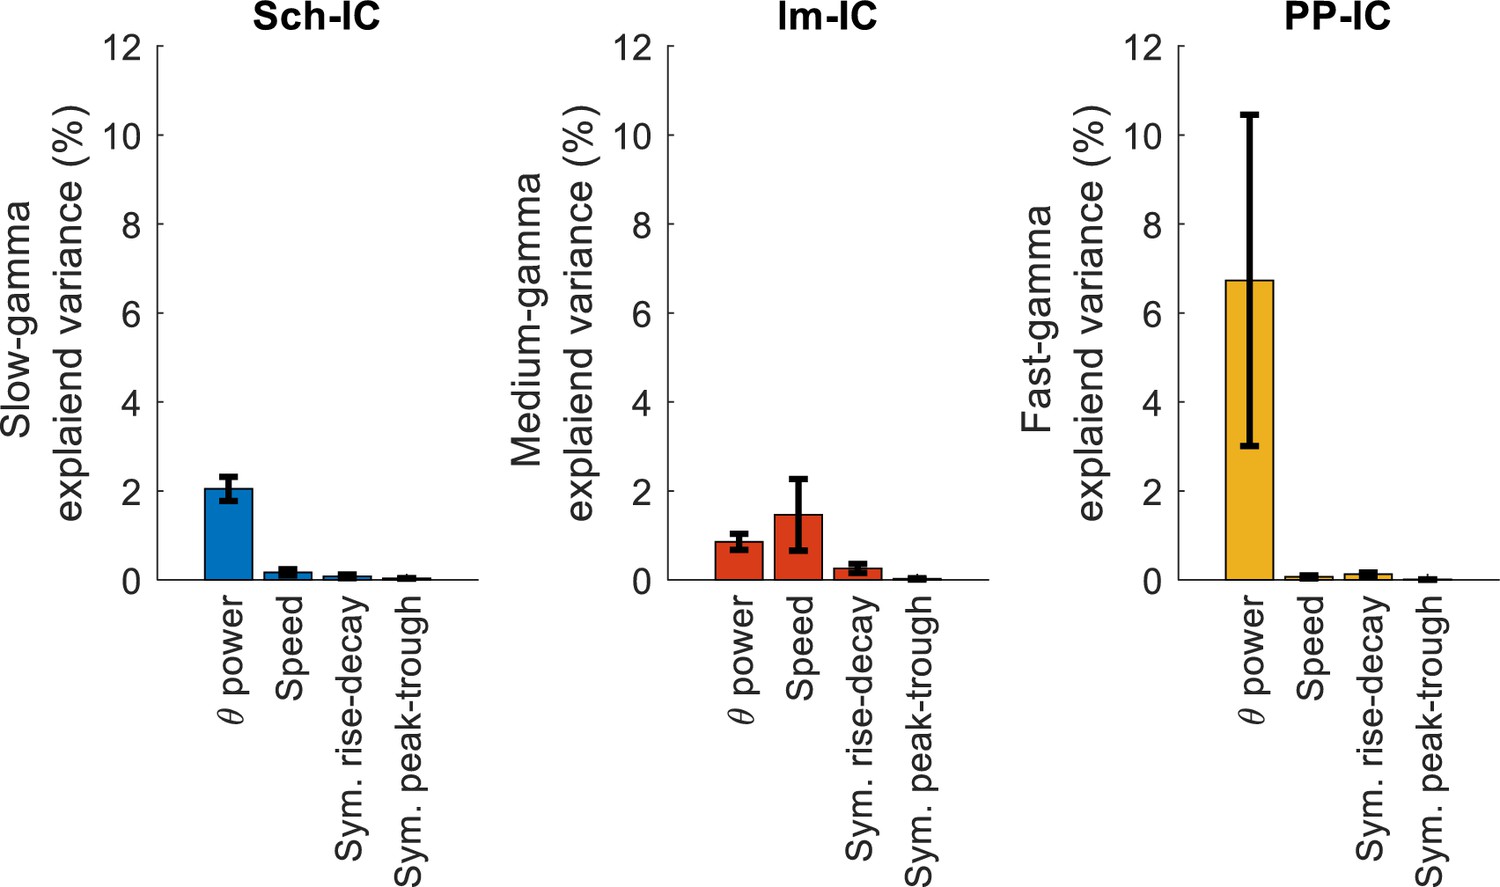
Effect of theta asymmetry in gamma power.
Multiple linear regression with theta power, speed and theta symmetry, measured as the ratio between duration of rise phases vs. decay phases (sym. rise-decay) and between duration of the peak and the trough (sym. peak-trough; see Materials and methods).
Figure 4
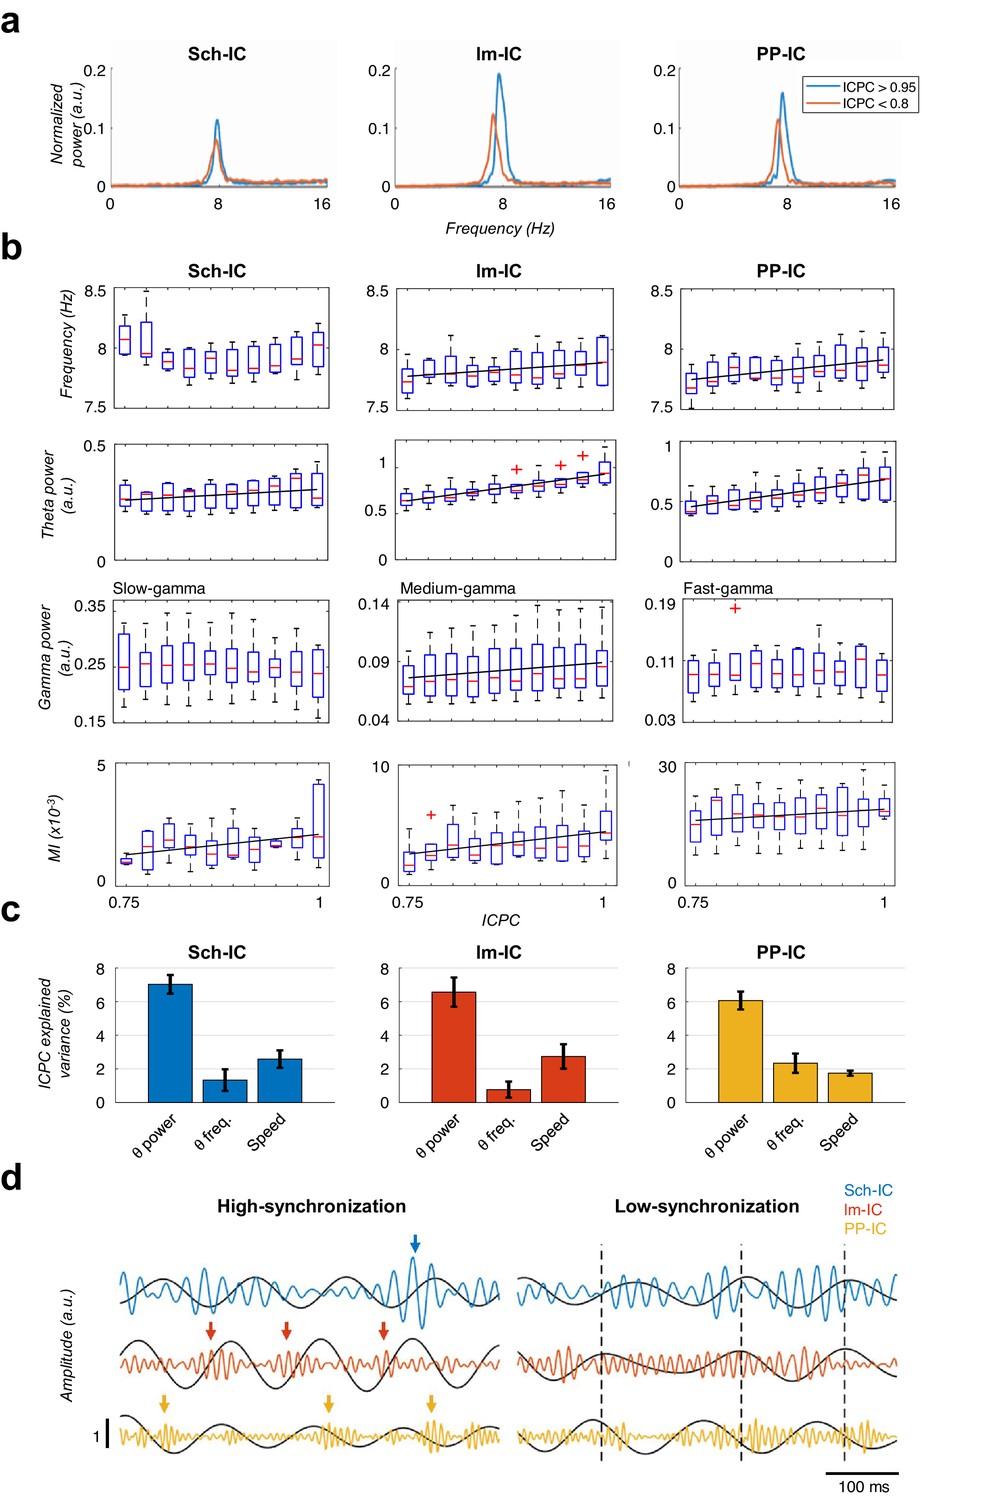
Characterization of theta oscillations as a function of their synchronization.
(a) Power spectrum of the IC-LFPs during high (blue, ICPC >0.95) and low (red, ICPC <0.8) theta synchronization epochs. A strong increase of the theta peak can be seen in all IC-LFPs during theta synchronization, together with a right-shift of the peak frequency for lm-IC and PP-IC. (b) Theta frequency correlated with ICPC in lm-IC and PP-IC (black lines represent statistically significant linear correlations; R = 0.94/0.92, p<0.05, respectively, surrogate test). Theta power correlated in all IC-LFPs with the synchronization state (R = 0.93/0.99/0.99, p<0.05/0.0001/0.0001, respectively). Medium-gamma band was correlated with lm-IC (R = 0.96, p<0.0001), but not with Sch-IC nor PP-IC. CFC in all pathway-specific generators increased with ICPC (R = 0.71/0.82/0.77, p<0.01/0.05/0.001, respectively). Correlations were computed on the mean values of each ICPC bin. For all figures, the central mark of the box indicates the median, and the bottom and top edges of the box indicate the 25th and 75th percentiles, respectively. The whiskers extend to the most extreme data points not considered outliers, and the outliers are plotted individually with red asterisks. (c) Multiple linear regression analysis including theta power, theta frequency and speed as factors to predict the ICPC. Bars represent the variance explained by each factor that cannot be accounted for by other variables. For all cases, the contribution was considered significant (see Materials and methods). (d) Representative theta and gamma traces showing differences in CFC and theta frequency in two synchronization states, from recordings with comparable theta power. Arrows represent gamma events and dashed lines are located at the peak of the theta phase of lm-IC to facilitate the comparison of the synchronization between rhythms.
Figure 5 with 1 supplement
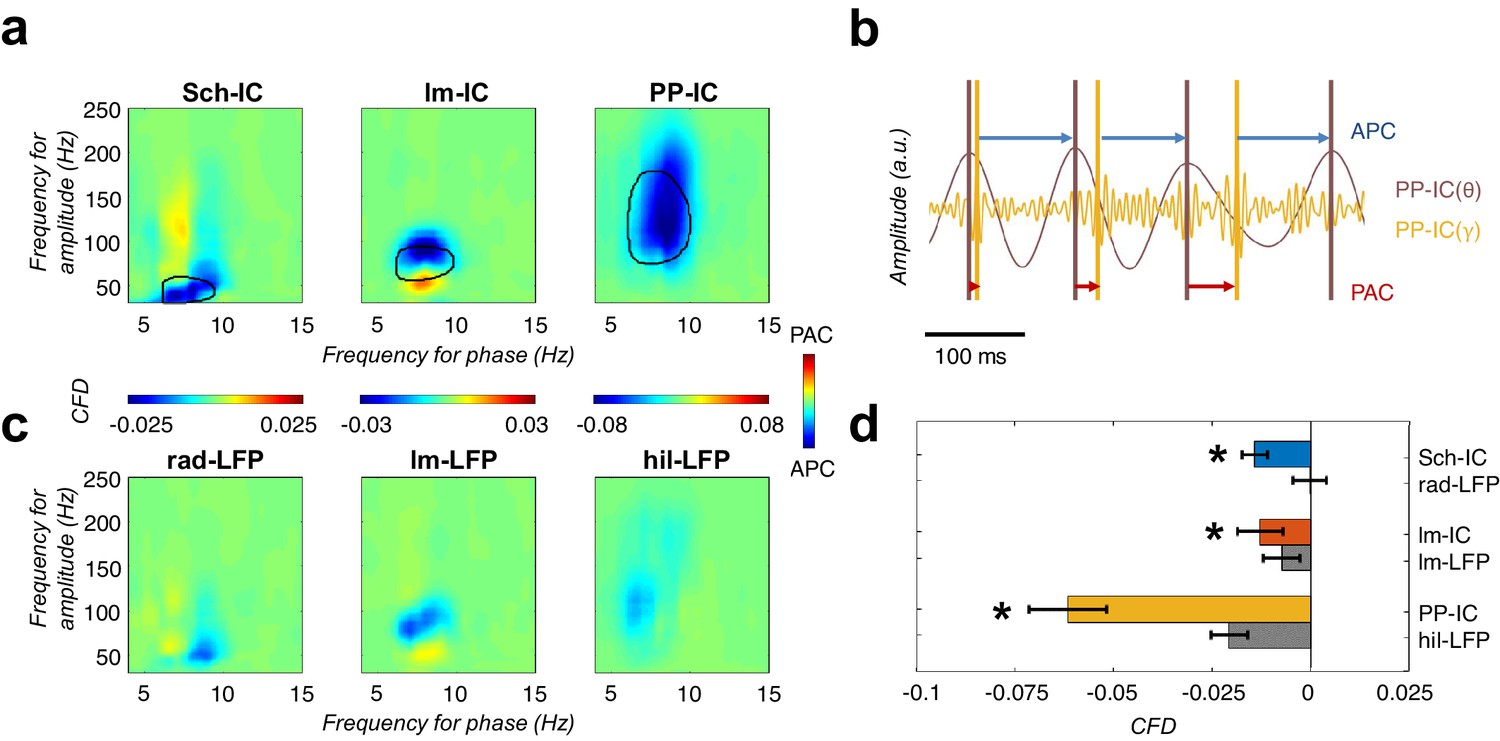
CFD analysis reveals that gamma activity modulates the phase of theta.
(a) CFD analysis of the pathway-specific signals demonstrates maximum negative values (APC) for those pairs of theta-gamma oscillations with the highest CFC (encircled area). These results suggested that gamma oscillations modulate the theta phase. (b) Example of gamma-to-theta coupling in the PP-IC. The time difference from the maximum of gamma activity to the theta peak is almost fixed (APC, blue arrows), while the distance from theta to gamma varies in each cycle (phase-amplitude coupling, PAC; red arrows). (c) Same CFD analysis as in (a) using the raw LFPs from different hippocampal layers confirmed the APC directionality. (d) Comparison between CFD values using IC-LFPs and LFPs showed convergent results, with IC-LFPs outperforming the raw signals (*p<0.05, paired t-test across subjects between IC and LFP values for each IC-LFP separately, t = 3.99/2.98/4.59 for Sch-IC/lm-IC/PP-IC, N = 5).
Figure 5—figure supplement 1
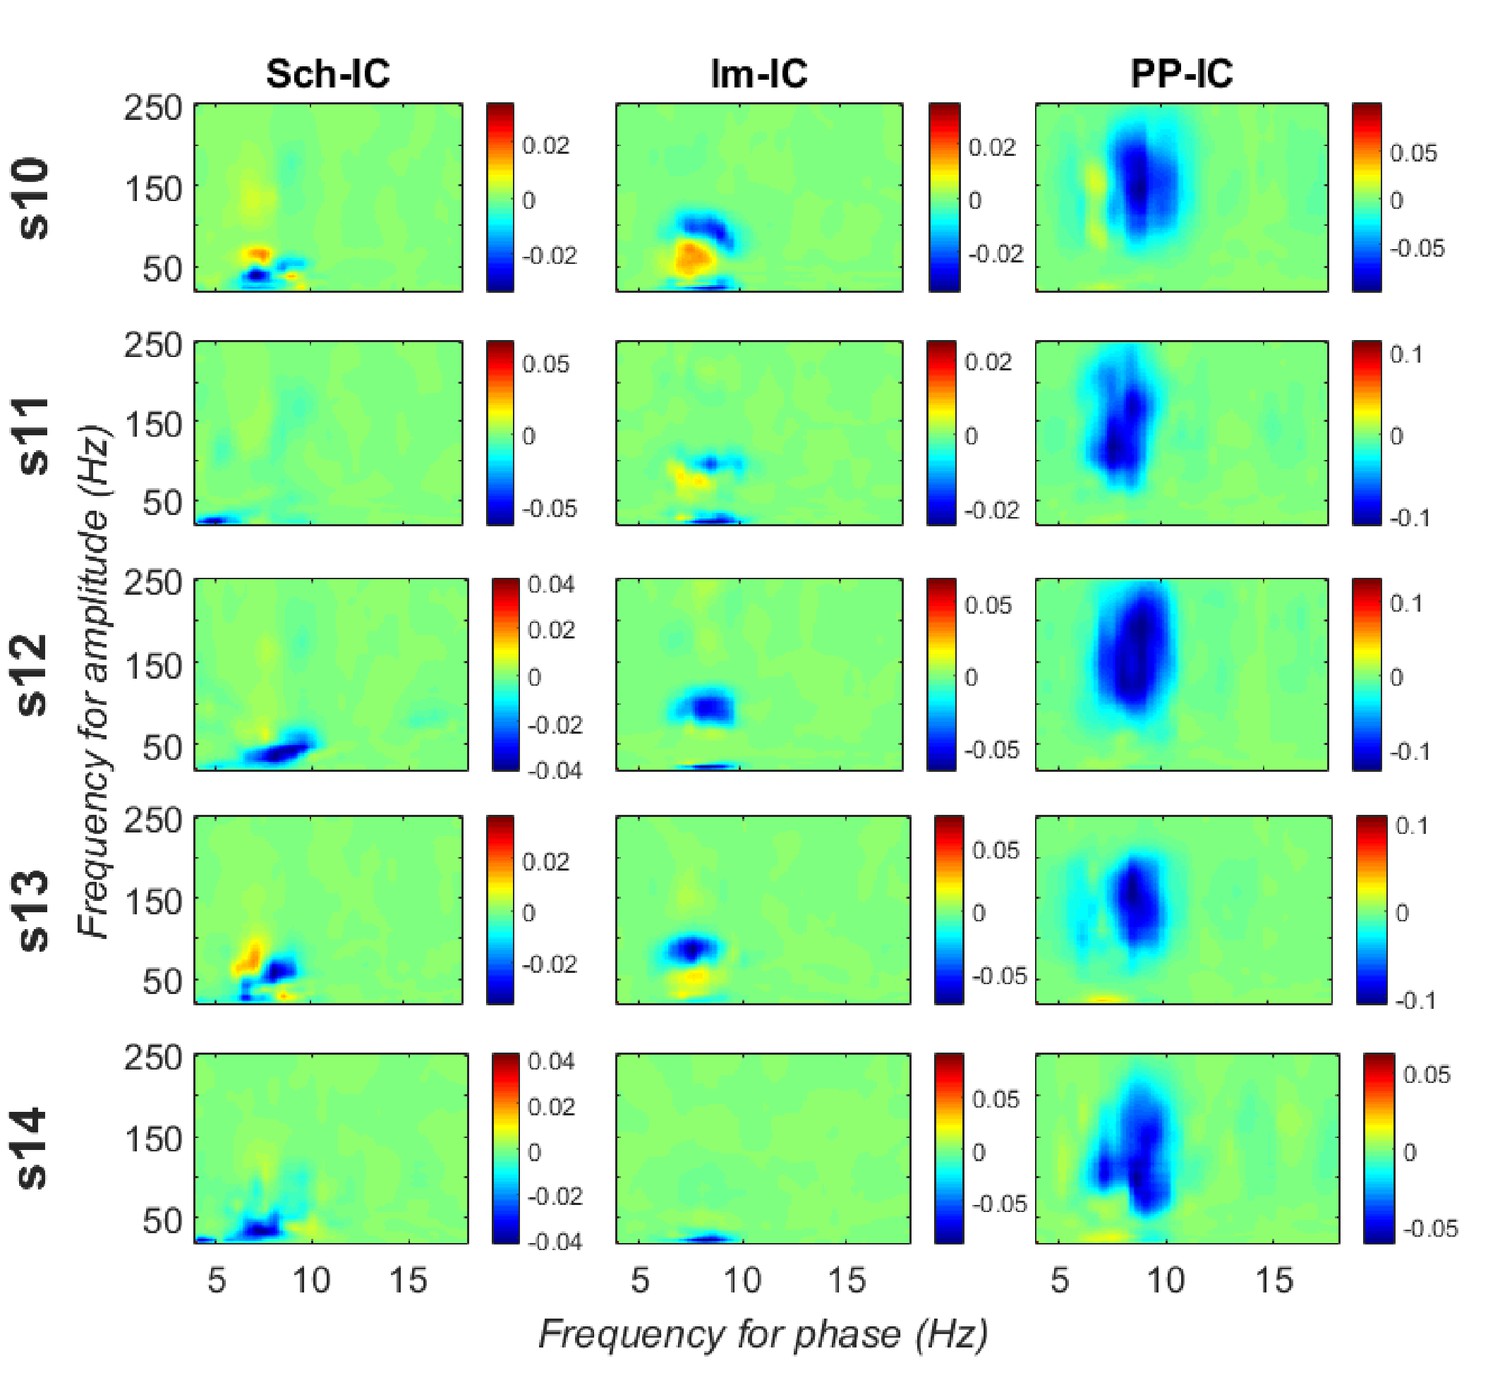
CFD for individual animals measured along all the recording time.
Significant negative values (gamma amplitude drives theta phase) were found in 4 out of 5 subjects in Sch-IC and lm-IC for those pairs of frequencies with maximum CFC (37.5 ± 5 Hz in Sch-IC and 82.5 ± 4 Hz in lm-IC), while negative CFDs were significant in PP-IC for all subjects.
Figure 6 with 2 supplements
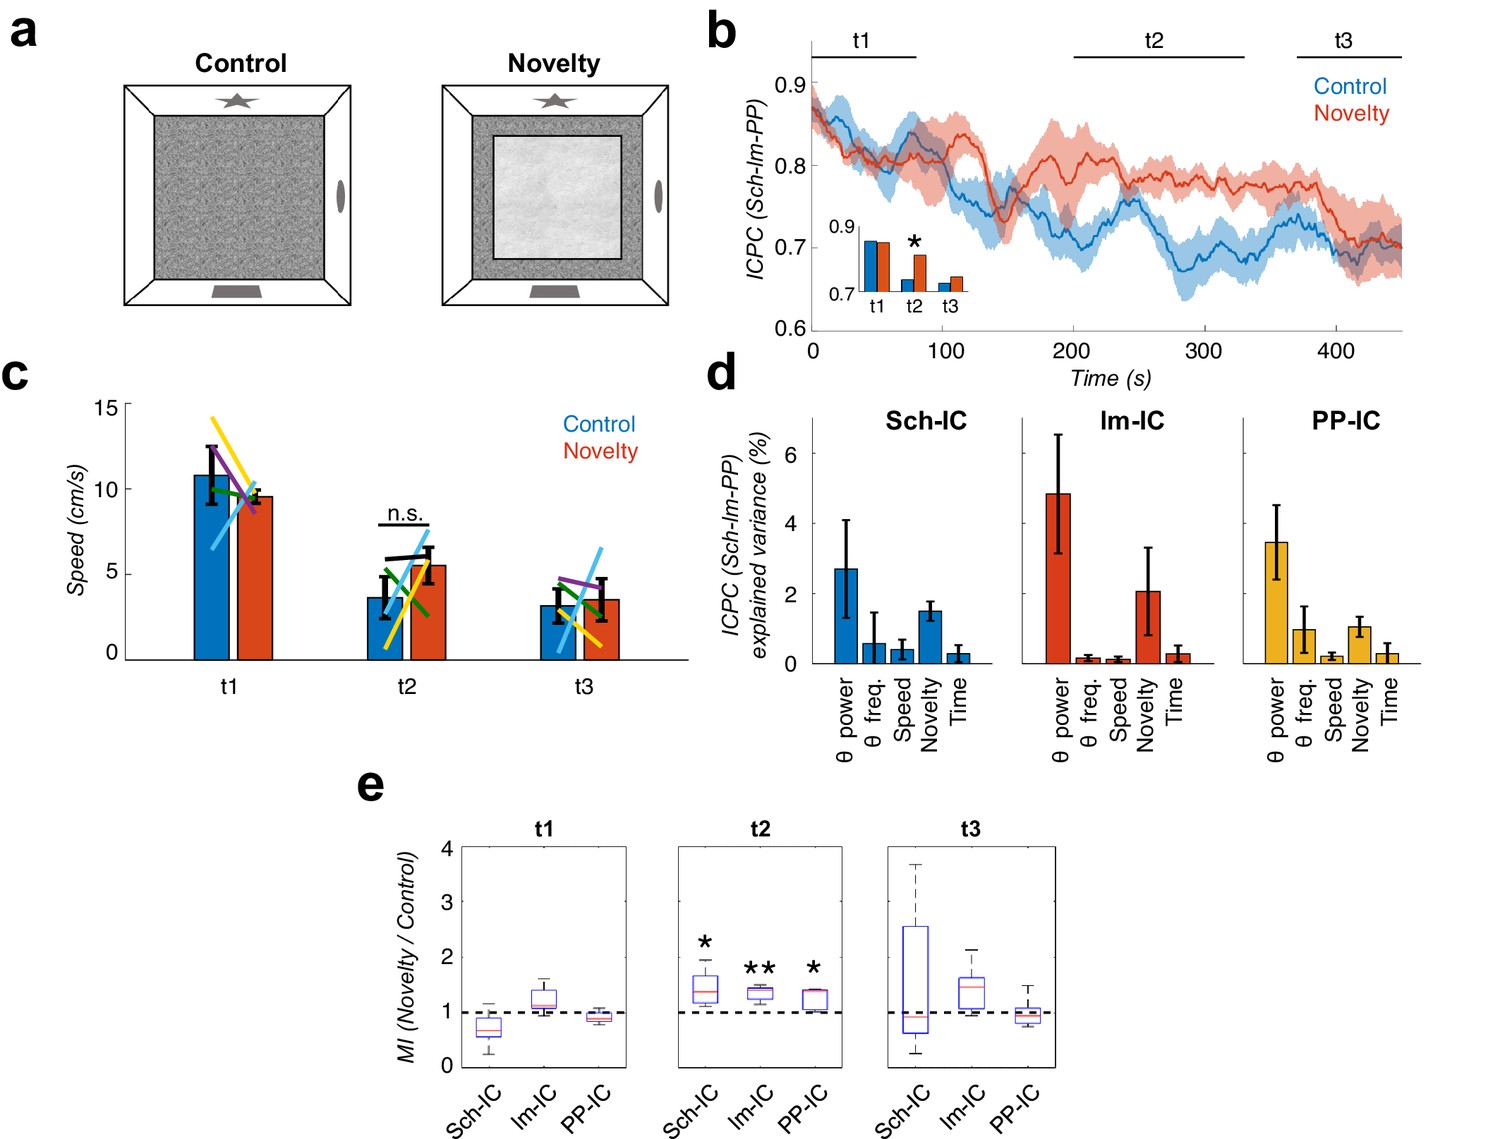
Local theta-gamma CFC and theta synchronization increase in parallel during mismatch novelty.
(a) Scheme of known (left) and novel (right) open-field contexts. After the habituation period (control), the animals were exposed to a different floor (sand paper) located inside the familiar open field, providing a new tactile stimulus (novelty). (b) Time evolution of the dynamic ICPC between the three IC-LFPs (mean ± s.e.m. across all subjects) during exploration: before (blue) and after (red) the introduction of the novel tactile stimulus. Both conditions have a maximum ICPC value at the beginning of the task (t1), corresponding to the initial exploration, followed by a decay in control but not in novelty (t2, inset *p<0.05, paired t-test comparing the average ICPC in control vs. novelty for each time period separately, t = 3, N = 5). Both conditions decrease to the same ICPC level by the end of the exploration time (t3). (c) Averaged movement velocity of the animals during control and novelty. There were not significant differences between both conditions (paired t-test across subjects for each time period, N = 4). Color-lines represent the values of each subject. (d) Multiple linear regression with theta power, theta frequency, speed, session (control or novelty) and time as independent factors contributing to the ICPC between the three IC-LFPs. Bars represent the variance explained by each factor that cannot be accounted for by other variables. All contributions were significant (see Materials and methods) except for the theta frequency in Sch-IC and lm-IC. (e) CFC computed as the ratio between the averaged MI in the defined time window (t1, t2 and t3) in the novelty condition with respect to the control one (*p<0.05, paired t-test across subject, t = 2.95/5.65/2.92 for Sch-IC/lm-IC/PP-IC in t2, N = 5).
Figure 6—figure supplement 1
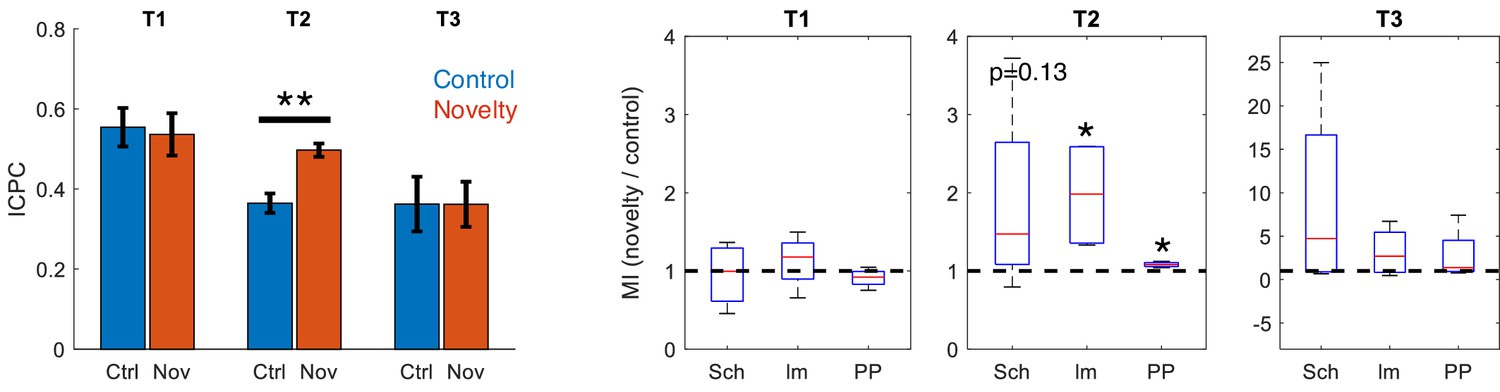
Effect of rearing in novelty task.
Comparison between ICPC (left, **p<0.01, paired t-test between subjects, t = 7.86, N = 4) and MI (right) in control versus novelty sessions after discarding epochs of rearing in the recordings (*p<0.05, paired t-test between subjects, t = 3.34/4.91 for lm-IC/PP-IC in t2, N = 4).
Figure 6—figure supplement 2
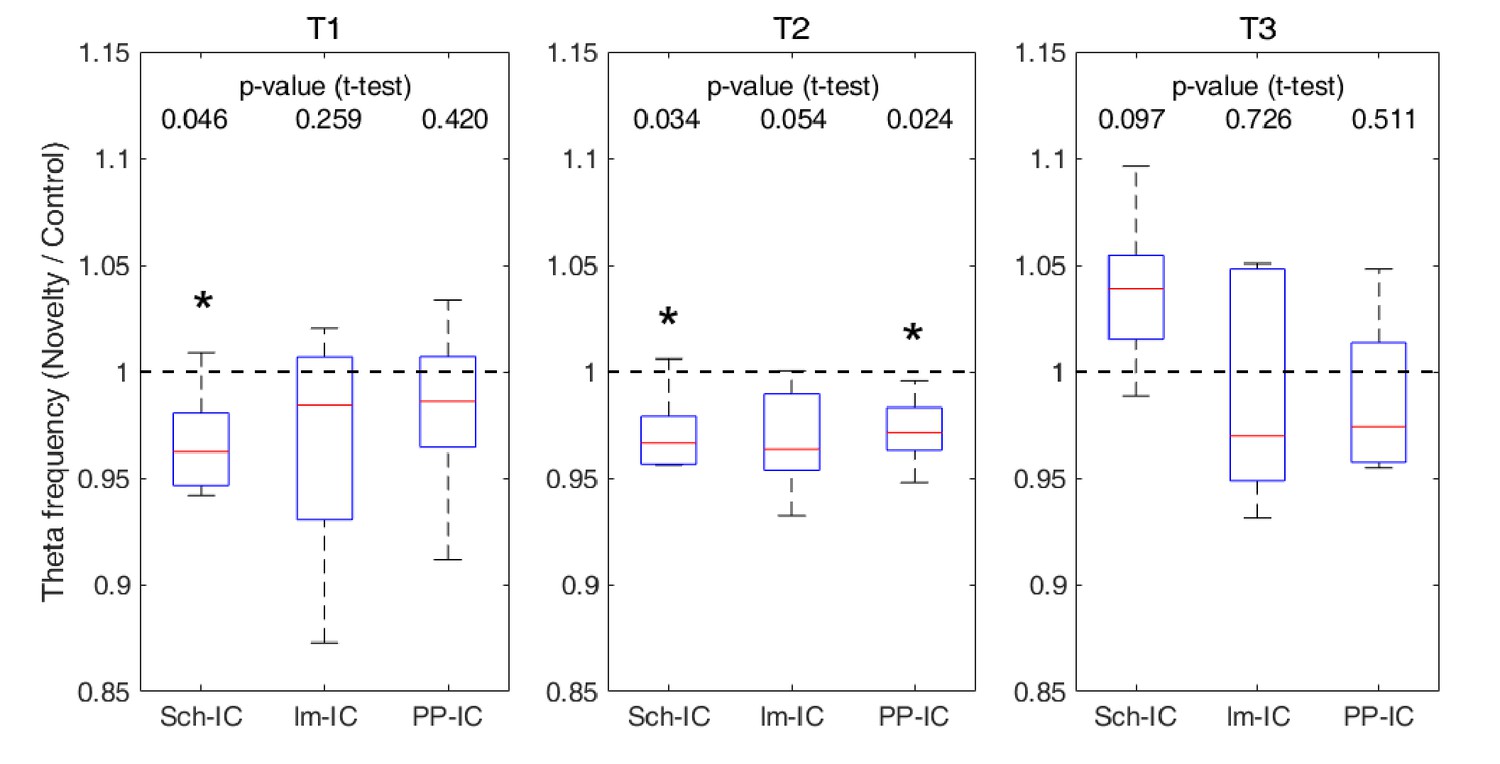
Ratio of theta frequency in novelty sessions with respect to control sessions and for three different time windows during the task (*p<0.05, paired t-test, N = 5).
Figure 7
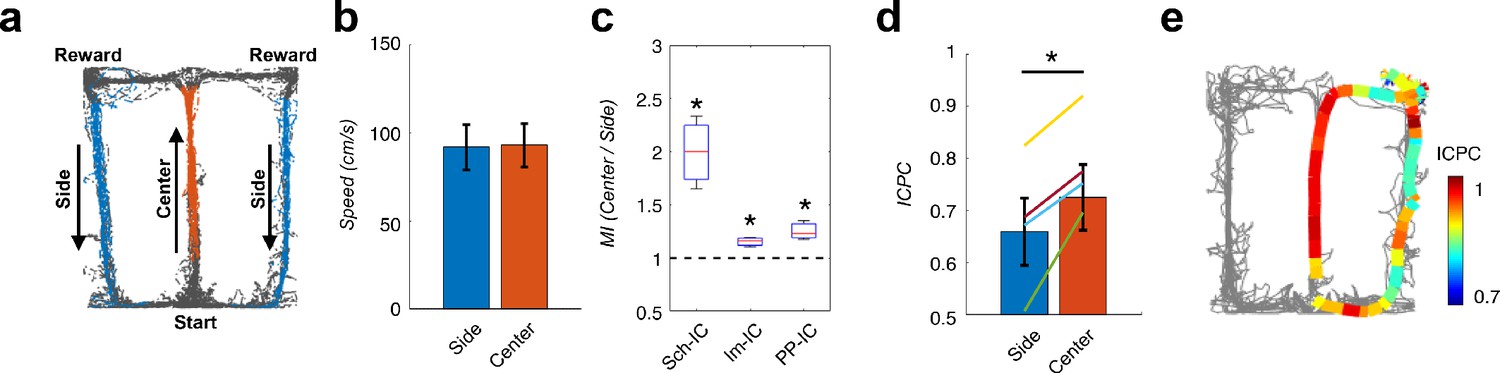
Local theta-gamma CFC and theta synchronization change in parallel and associated with decision making in a T-maze task.
(a) Example of running trajectories during the T-maze task. (b) Averaged movement velocity in the center and side arms (mean ± s.e.m. across all subjects). Only trials with similar speed in both conditions were considered for the analysis. (c) Ratio between the MI at the center of the maze and that at the sides (*p<0.05, paired t-test across subjects, averaging all selected trials for each animal, t = 3.61/4.03/3.54 for Sch-IC/lm-IC/PP-IC, N = 4). (d) ICPC values in the center and side arms showing the synchronization between the three IC-LFPs (*p<0.05, group level paired t-test, t = 4.79, N = 4). Differences within-subject (color lines) were done with paired t-test using all correct trials (yellow line: p<0.0001, N = 114 trials; purple: p<0.05, N = 63; green: p<0.001, N = 151; blue: p=0.07, N = 69). (e) Representative example of ICPC values for different locations in one trial.
Author response image 1
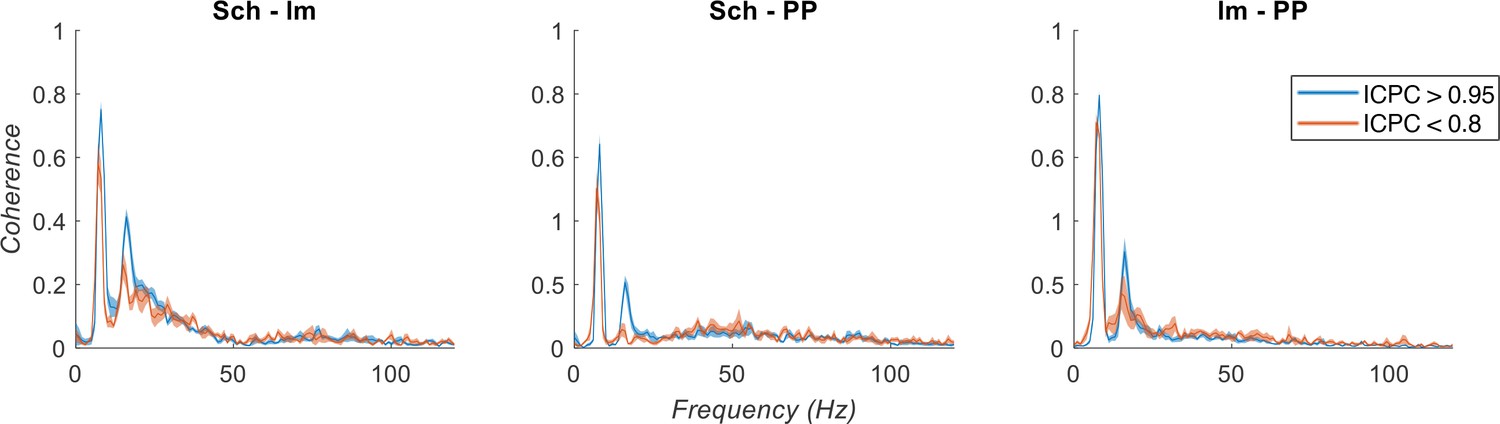
Spectral coherence analysis between IC-LFPs.
Theta synchronization states are separated based on ICPC (color legend). Note the low coherence at gamma frequencies between IC-LFPs.
Additional files
Download links
A two-part list of links to download the article, or parts of the article, in various formats.
Downloads (link to download the article as PDF)
Open citations (links to open the citations from this article in various online reference manager services)
Cite this article (links to download the citations from this article in formats compatible with various reference manager tools)
Different theta frameworks coexist in the rat hippocampus and are coordinated during memory-guided and novelty tasks
eLife 9:e57313.
https://doi.org/10.7554/eLife.57313


