SOX21 modulates SOX2-initiated differentiation of epithelial cells in the extrapulmonary airways
- Department of Pediatric Surgery, Erasmus Medical Center – Sophia Children’s Hospital, Netherlands
- Department of Cell biology, Erasmus Medical Center, Netherlands
Figures
Figure 1 with 1 supplement
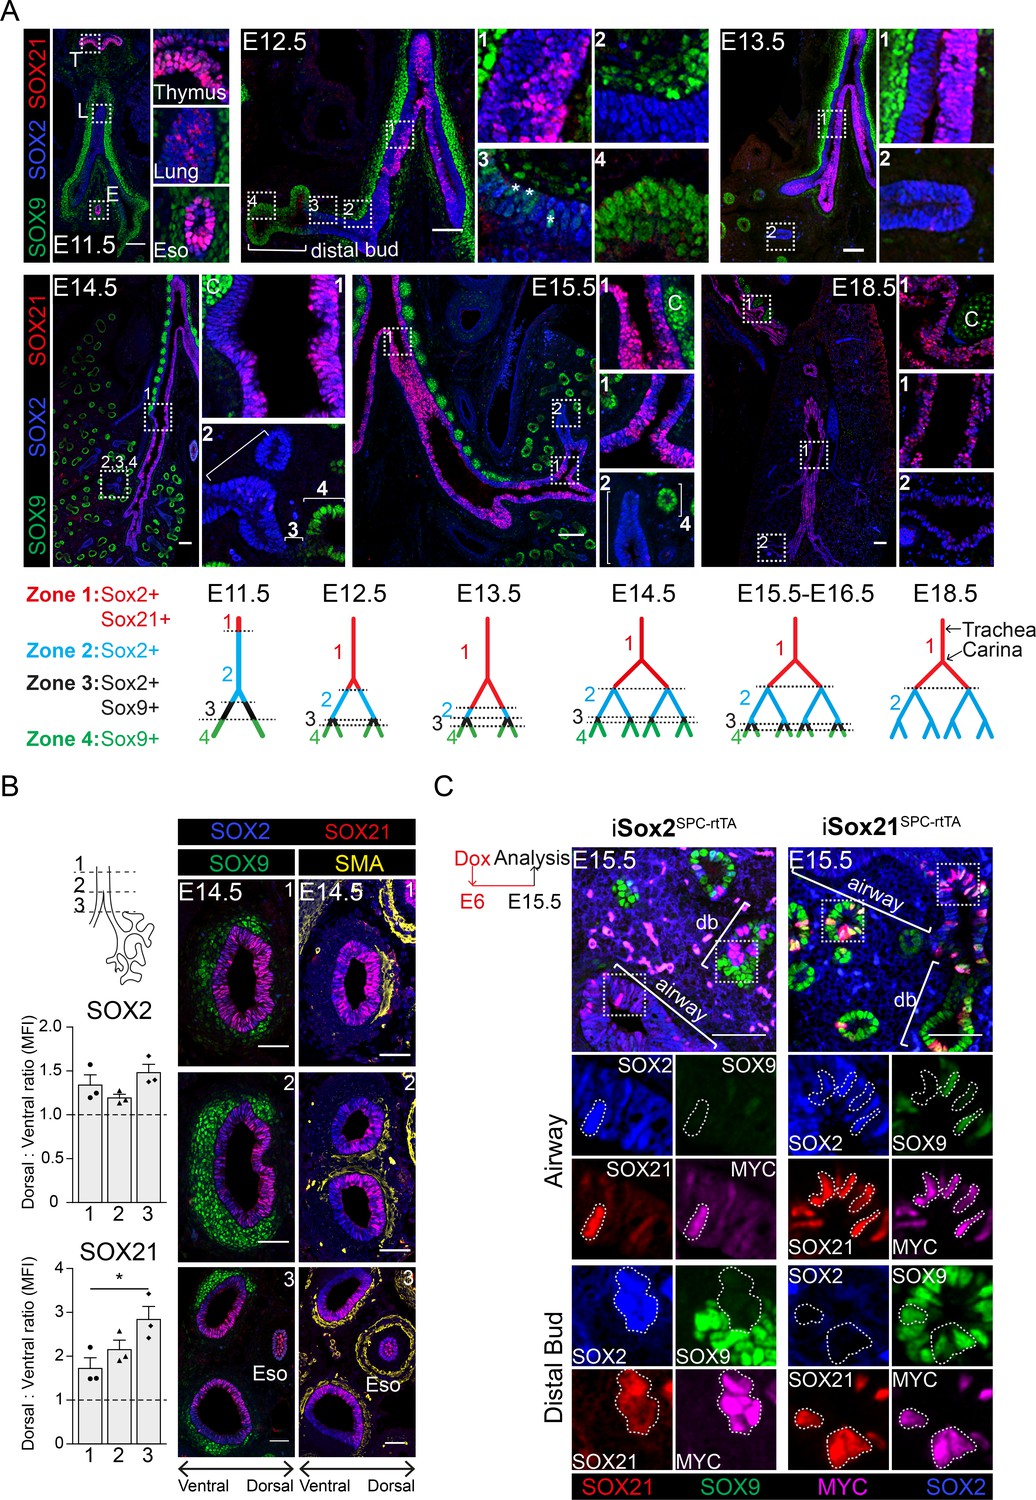
SOX21 is expressed in the proximal region of the SOX2+ non-branching zone of the airway epithelium.
(A) Co-staining of SOX9 (green) for distal buds, SOX2 (blue) for proximal epithelium, and SOX21 (red) at different stages of lung development. Boxed areas are sown as enlarged inserts. Schematic representations show the distribution of SOX9, SOX2, and SOX21 in the different identified zones in the branching airways during gestation. At E12.5, the asterisks indicate the cells in zone three expressing both SOX2 and SOX9. T = thymus, L = lung, E = esophagus, and C = cartilage. Scale bar = 50 µm. (B) Transversal sections at three different locations of an E14.5 trachea and main bronchi stained with SOX2 (blue), SOX9 (green), SOX21 (red), and smooth muscle actin (SMA) (yellow). Location 1 = trachea, 2 = around the carina, and 3 = immediately distal of the carina. SOX9+ mesenchymal cells surround the ventral side of the trachea and bronchi and SMA+ cells surround the dorsal side. The graphs show the ratio of mean fluorescence intensity (MFI) between ventral and dorsal of SOX2 and SOX21 at the three different locations. Scale bar = 50 µm. Eso = esophagus. (C) Sections of E15.5 lungs of doxycycline induced iSox2SPC-rtTA and iSox21SPC-rtTA. Expression of transgenic Myc-tagged Sox2 or Sox21 was induced by giving doxycycline from E6 onwards. Sections are stained with SOX2 (blue), SOX9 (green), SOX21 (red), and MYC (purple). Scale bar = 50 µm. Db = distal bud.
-
Figure 1—source data 1
Quantification of the number of cells represented as Dorsal-Ventral ratio of SOX2 and SOX21 positive cells.
- https://cdn.elifesciences.org/articles/57325/elife-57325-fig1-data1-v2.xlsx
Figure 1—figure supplement 1
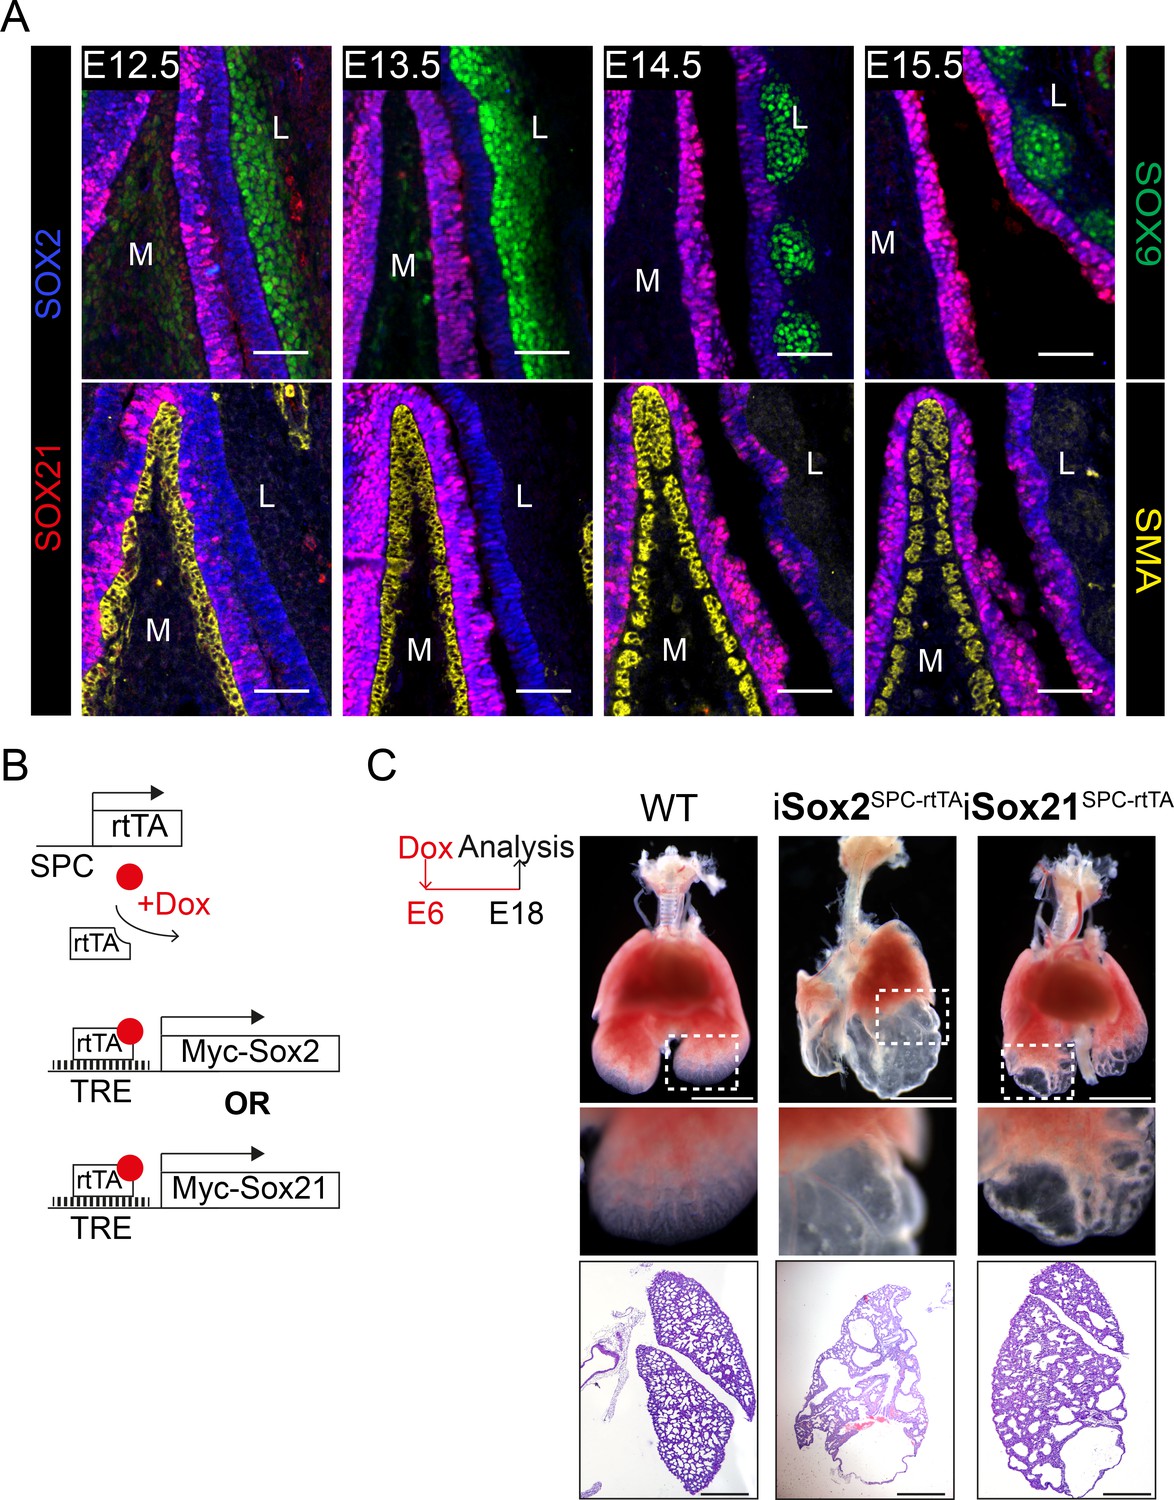
SOX21 is unilaterally detected in the developing trachea and overexpression of SOX21 leads to lung cysts.
(A) Immunostaining on sections of the main bronchi immediately distal of the carina from mice at embryonic day (E) 12.5, 13.5, 14.5, and 15.5 using SOX2 (blue), SOX21 (red), and either SOX9 (green, top row) or smooth muscle actin (SMA; yellow, bottom row). The mesenchymal cells on the medial (M) side express SMA. At the lateral (L) side, mesenchymal cells express SOX9. Scale bar = 50 µm. (B) Schematic representation of the iSox2SPC-rtTA and iSox21SPC-rtTA mouse models. (C) Bright field images of E18.5 lungs from control, iSox2SPC-rtTA and iSox21SPC-rtTA mice that received doxycycline from E6 onwards. Scale bar = 2 mm. HE staining of the lungs show the size of the cysts that are present in the lungs of iSox2SPC-rtTA and iSox21SPC-rtTA mice. Scale bar = 0.5 mm.
Figure 2 with 1 supplement
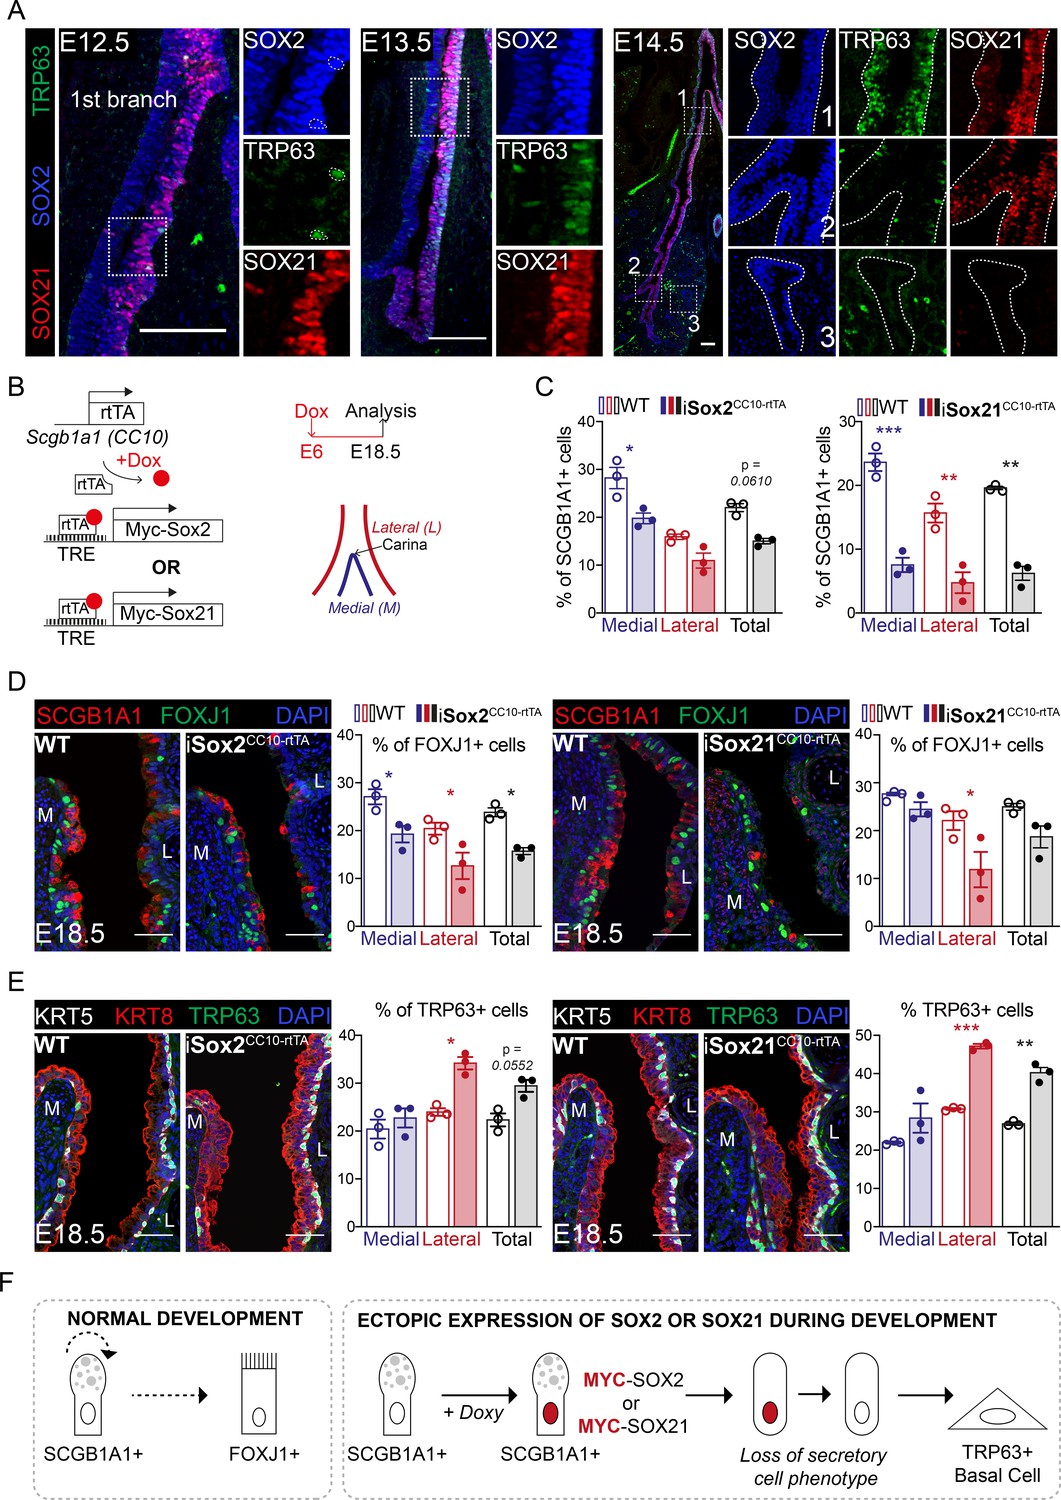
SOX2 and SOX21 are co-expressed in the zone where progenitor cells differentiate to basal cells.
(A) Immunofluorescence of SOX2 (blue), SOX21 (red), and TRP63 (green) on lung sections of E12.5, E13.5, and E14.5 showing a spatial co-localization of the three proteins. Scale bar = 100 µm. (B) Schematic representation of the iSox2CC10-rtTA and iSox21CC10-rtTA mouse models. Doxycycline was given to the dams from E6 till E18.5. The percentage of secretory, ciliated, and basal cells was analyzed at the medial and lateral side in a 400 µm area around the carina. (C) Quantification of the percentage of SCGB1A1+ secretory cells at E18.5 in wild-type (WT; open bars), iSox2CC10-rtTA, and iSox21CC10-rtTA mice (closed bars) represented as percentage of medial (blue), lateral (red), and total (grey) cells. Two-way ANOVA (n = 3; *p<0.05, **p<0.01, ***p<0.001). Scale bar = 50 µm. (D) Immunofluorescence of SCGB1A1 (red) and FOXJ1 (green) in wild-type (WT), iSox2CC10-rtTA, and iSox21CC10-rtTA lung sections at E18.5. Quantification of the percentage of FOXJ1+-ciliated cells at E18.5 in wild-type (WT; open bars), iSox2CC10-rtTA, and iSox21CC10-rtTA mice (closed bars) represented as percentage of medial (blue), lateral (red), and total (grey) cells. Two-way ANOVA (n = 3; *p<0.05). Scale bar = 50 µm. (E) Immunofluorescence of TRP63 (red), KRT5 (grey) basal cells, and KRT8 (red) luminal cells in wild-type (WT), iSox2CC10-rtTA, and iSox21CC10-rtTA lung sections at E18.5. Quantification of the percentage of TRP63+ basal cells at E18.5 in wild-type (WT; open bars), iSox2CC10-rtTA, and iSox21CC10-rtTA (closed bars) mice represented as percentage of medial (blue), lateral (red), and total (grey) cells. Two-way ANOVA (n = 3; *p<0.05, **p<0.01, ***p<0.001). Scale bar = 50 µm. (F) In normal lung development, secretory cells can renew or give rise to ciliated cells. Upon induction of MYC-SOX2 or MYC-SOX21, the secretory cell identity is rapidly lost as shown by the loss of SCGB1A1 expression. Concomitantly, the SCGB1A1/CC10-driven MYC transgene is no longer expressed and cells adopt a TRP63+ basal cell fate.
-
Figure 2—source data 1
Quantification of the number of SCGB1A1, FOXJ1 and TRP63 positive cells represented in the plots.
- https://cdn.elifesciences.org/articles/57325/elife-57325-fig2-data1-v2.xlsx
Figure 2—figure supplement 1
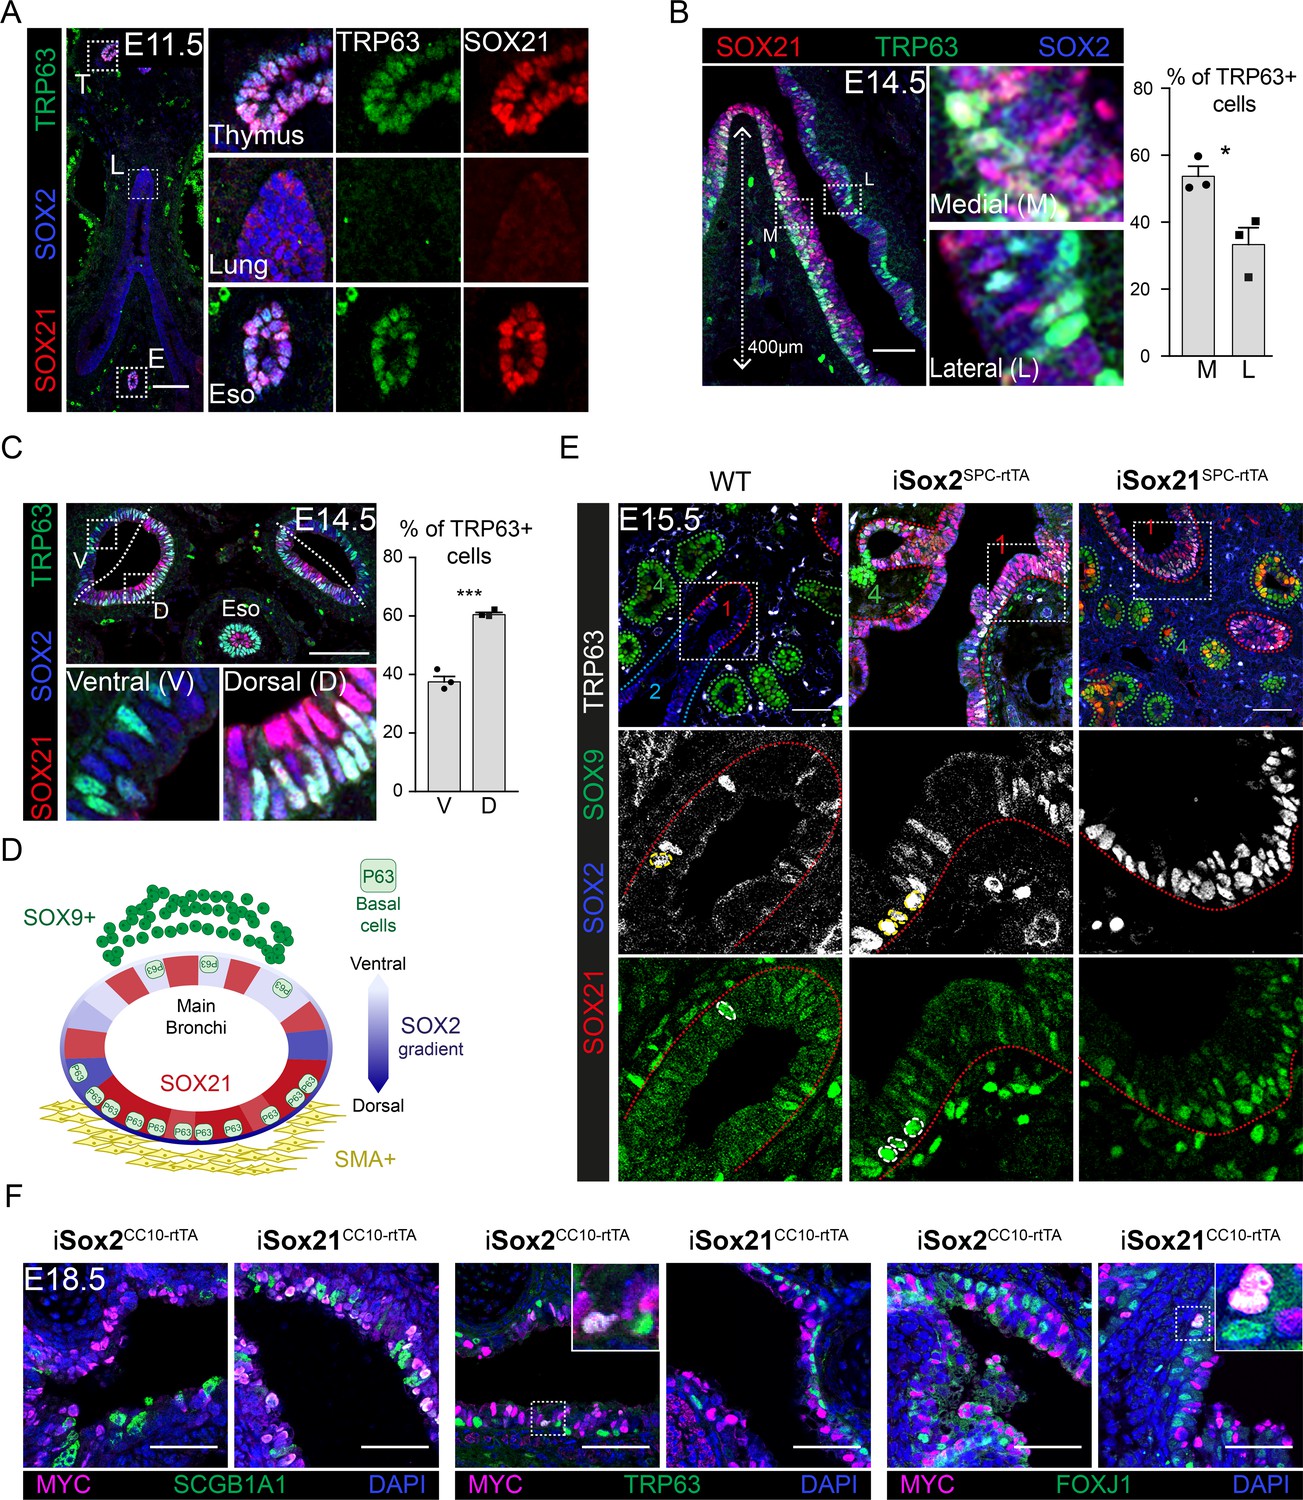
Basal cells arise in the SOX2+ SOX21+ region.
(A) Immunofluorescence of SOX2 (blue), SOX21 (red), and TRP63 (green) on lung sections of embryonic ages (E) 11.5. T = thymus, L = lung, and E = esophagus. Scale bar = 100 µm. (B) Immunofluorescence of SOX2 (blue), SOX21 (red), and TRP63 (green) on longitudinal sections of the main bronchi at E14.5. The graph shows the percentage of basal cells in medial versus lateral side of the bronchi 400 µm proximal of the first branch. Unpaired T-test (n = 3; *p<0.05, *** p<0.001). M = medial, L = lateral. Scale bar = 100 µm. (C) Immunofluorescence of SOX2 (blue), SOX21 (red) and TRP63 (green) on transversal sections the main bronchi on embryonic ages (E) 14.5. The graph shows the percentage of basal cells in the ventral versus dorsal side of the bronchi. Unpaired T-test (n = 3; *p<0.05, ***p<0.001). V = ventral, and D = dorsal. Scale bar = 100 µm. (D) Schematic representation of SOX2 and SOX21 expression, and basal cell differentiation in a transverse section of a main bronchi. (E) E15.5 Lung sections of doxycycline induced (E6 until E15) iSox2SPC-rtTA and iSox21SPC-rtTA mice. Sections are stained with SOX2 (blue), SOX9 (green), SOX21 (red), and TRP63 (grey). Nuclei positive for TRP63 and SOX9 are encircled. Scale bar = 100 µm. (F) E18.5 lung sections of doxycycline induced (E6 until E18.5) iSox2CC10-rtTA and iSox21CC10-rtTA mice. Sections are stained with MYC (purple) and from left to right SCGB1a1, TRP63, and FOXJ1 (green). Scale bar = 50 µm.
Figure 3 with 1 supplement
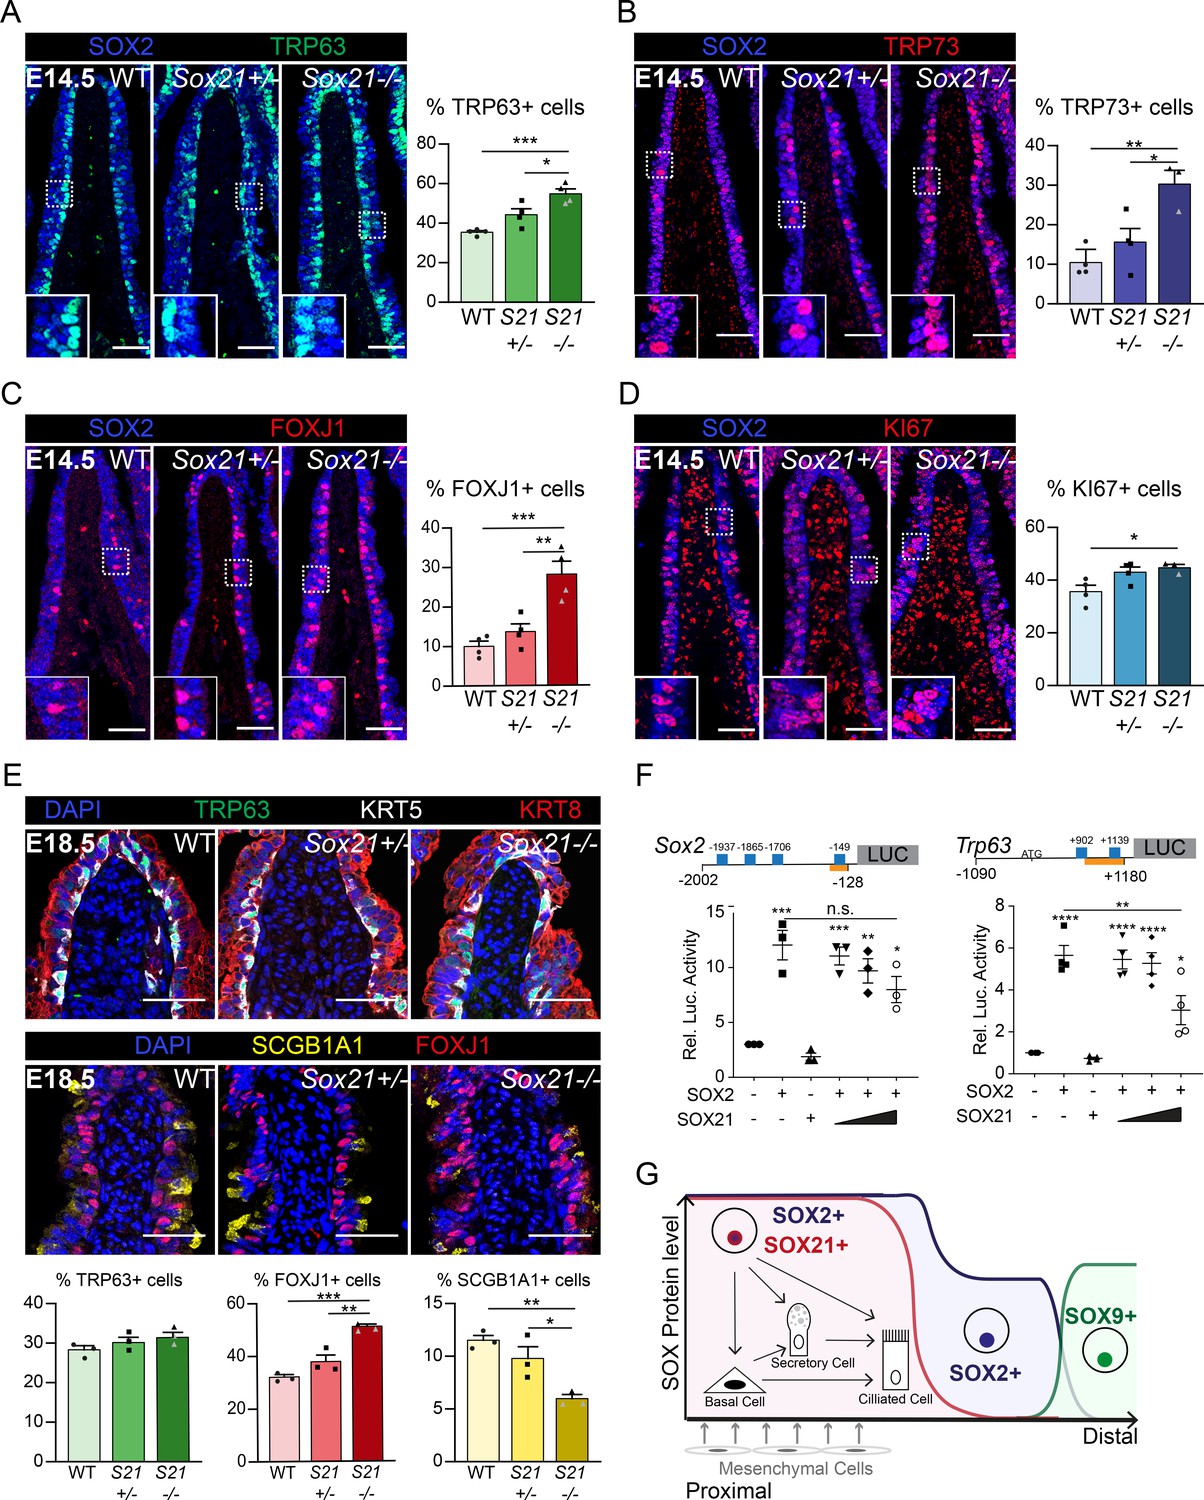
SOX21 counter balances SOX2+ progenitor differentiation to airway-specific cell types.
(A–D) Immunofluorescence and quantification of the number of TRP63+ basal cells (A), TRP73+ cells (B), FOXJ1+-ciliated cells (C), and KI67+-dividing cells (D) at E14.5 in wild-type (WT), Sox21+/−, and Sox21−/− mice. The number of cells were counted within the first 400 µm immediately distal of the carina at the medial side of the airway. One-way ANOVA (n = 3; *p<0.05). Scale bar = 50 µm. (E) Immunofluorescence and quantification of the number of TRP63+ (green) basal cells, FOXJ1+ (red) ciliated cells, and SCGB1A1+ (yellow) secretory cells at E18.5 in wild-type (WT), Sox21+/−, and Sox21−/− mice. The number of cells were counted within the first 400 µm immediately distal of the carina at the medial side of the airway. One-way ANOVA (n = 3; *p<0.05, **p<0.01, ***p<0.001). Scale bar = 50 µm. (F) Luciferase assay to test the transcriptional activity of the Sox2 promotor region from −2002 till −128 andTrp63 promotor region from −1090 till +1180 (+1 is considered the transcriptional start site). Blue squares showing SOX21 binding motifs and the orange bar shows the region bound by RNA polymerase II. The graph shows luciferase activity induced after transfection of FLAG-SOX2 and/or increasing amounts of MYC-SOX21. One-way ANOVA (n = 3; **p<0.01, ***p<0.001, ****p<0.0001, when not indicated otherwise, stars show significance compared to control). (G) Schematic overview of epithelial progenitor maintenance and differentiation during murine lung development. From proximal to distal a transition of SOX protein levels takes place. The most proximal part of the lung, the trachea, and the two main bronchial branches, show high expression levels of SOX2 and co-expression of SOX21. SOX21 balances the maintenance of the SOX2 progenitor state in a zone where progenitor cells are prone to differentiate to airway-specific cell types.
-
Figure 3—source data 1
Quantification of the number of positive cells represented in the plots.
- https://cdn.elifesciences.org/articles/57325/elife-57325-fig3-data1-v2.xlsx
Figure 3—figure supplement 1
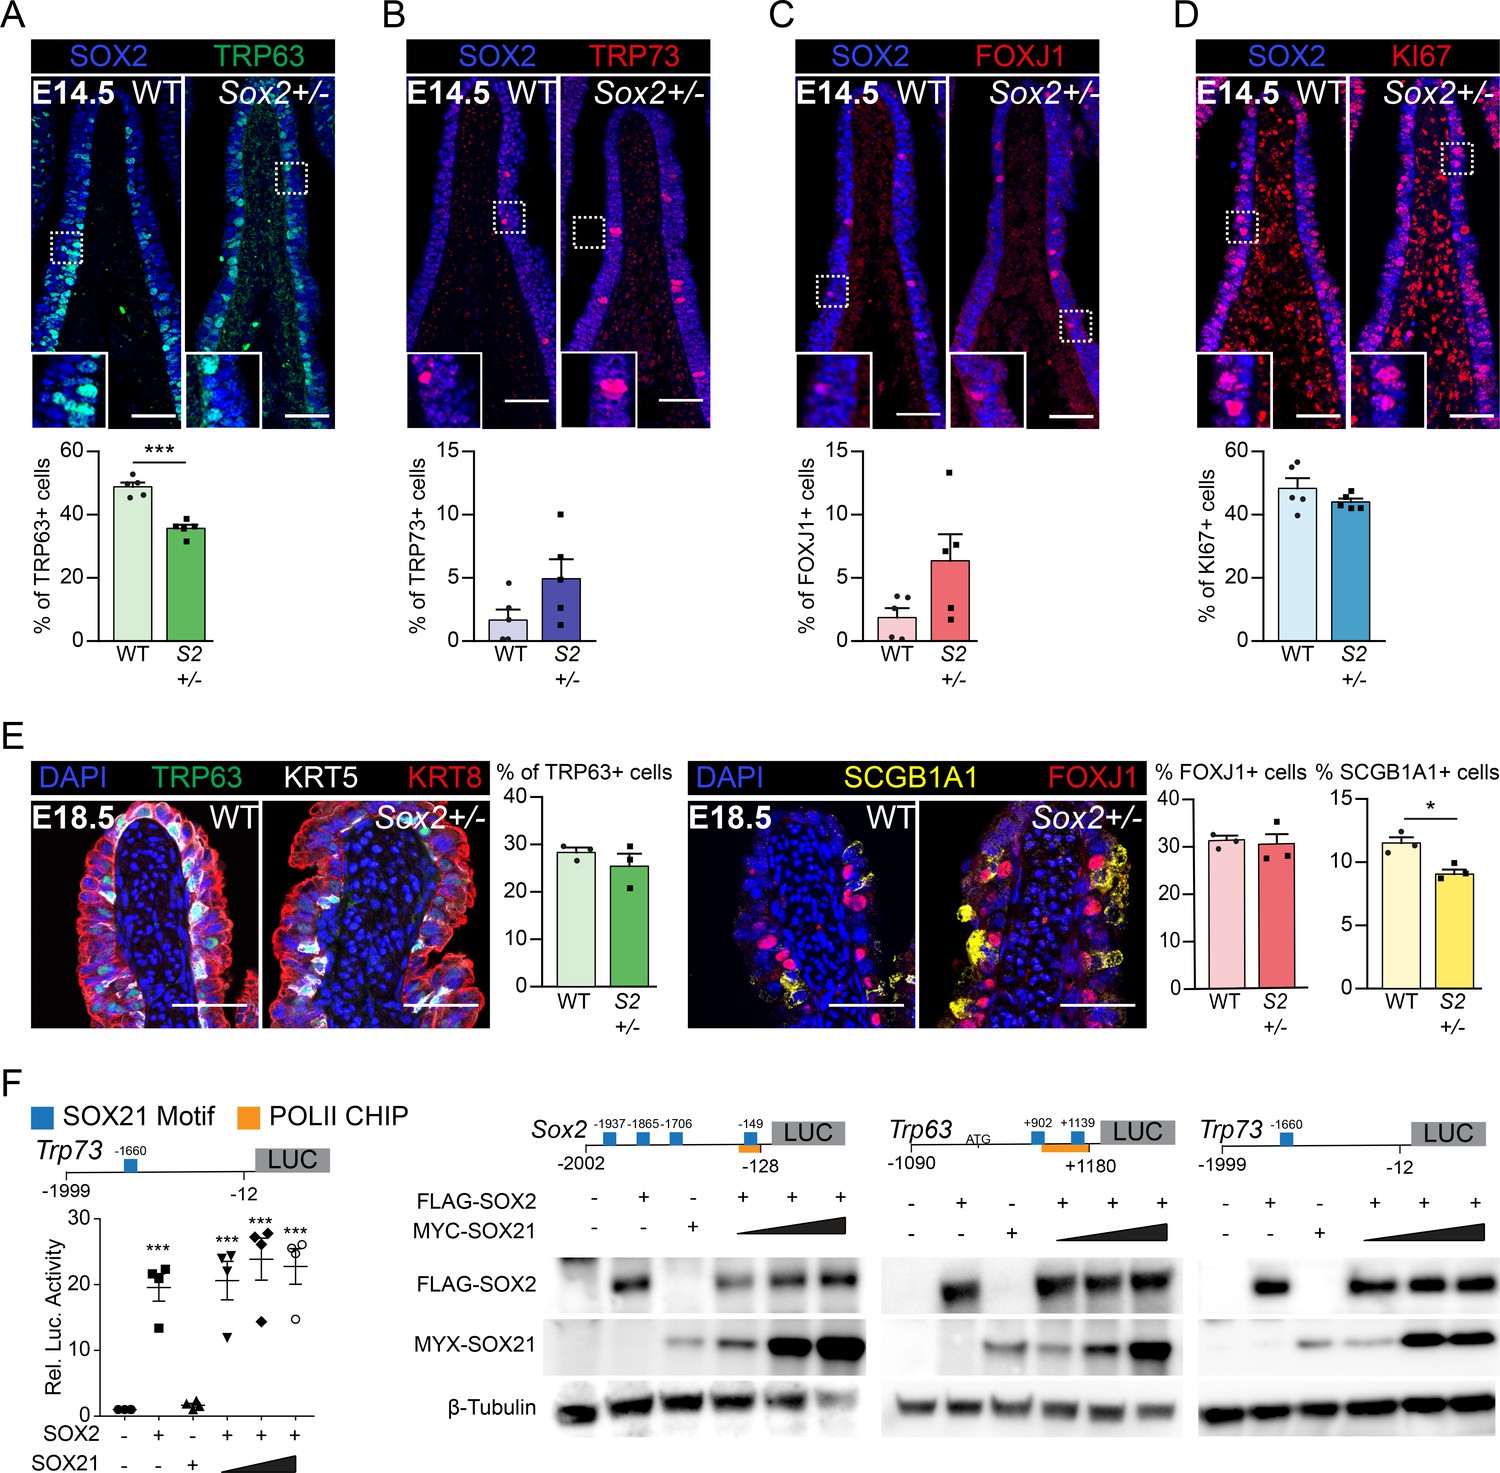
SOX21 counter balances SOX2+ progenitor differentiation to airway specific cell types.
(A–D) Immunofluorescence and quantification of the number of TRP63+ basal cells (A), TRP73+ cells (B), FOXJ1+-ciliated cells (C), and KI67+-dividing cells (D) at E14.5 in wild-type (WT) and Sox2+/− mice. The number of cells were counted within the first 400 µm immediately distal of the carina at the medial side of the airway. Unpaired T-test (n = 5; *p<0.05, ***p<0.001). Scale bar = 50 µm. (E) Immunofluorescence and quantification of the number of TRP63+ (green) basal cells, FOXJ1+ (red) ciliated cells, and SCGB1A1+ (yellow) secretory cells at E18.5 in wild-type (WT) and Sox2+/− mice. The number of cells were counted within the first 400 µm immediately distal of the carina at the medial side of the airway. Unpaired T-test (n = 3; *p<0.05). Scale bar = 50 µm. (F) Luciferase assay to test the transcriptional activity of the Trp73 promotor region from −1999 till −12 (+one is considered the transcriptional start site). One-way ANOVA (n = 3; ***p<0.001, stars show significance compared to control). Western blots showing the protein levels of transfected FLAG-SOX2 and MYC-SOX21 of the luciferase assay belonging to Figure 3F. Beta-tubulin was used as loading control.
Figure 4 with 1 supplement
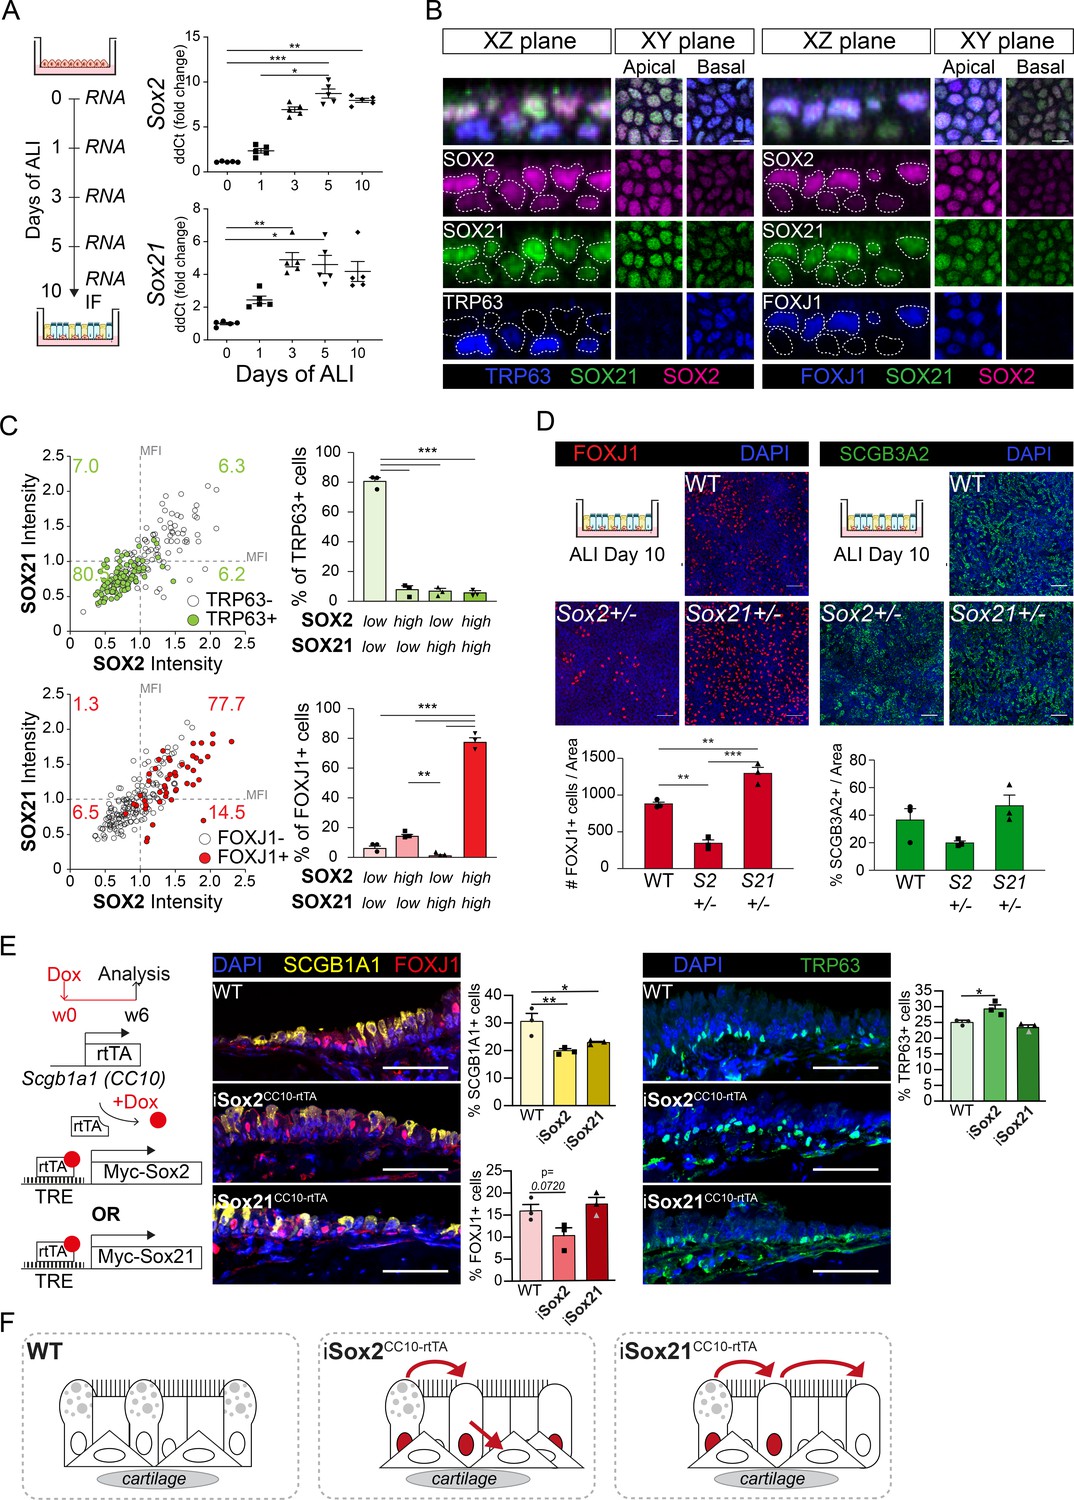
SOX2 and SOX21 are inversely correlated with basal cell differentiation to ciliated cells.
(A) Schematic overview of mouse tracheal epithelial cell (MTEC) culture. QPCR analysis of Sox2 and Sox21 expression during differentiation of MTECs on air–liquid interface (ALI). One-way ANOVA (n = 5; *p<0.05, ** p<0.01, ***p<0.001). (B) Immunofluorescence staining on MTEC 10 days after ALI of SOX2 (purple), SOX21 (green), and TRP63 (blue, left images) or FOXJ1 (blue, right images). Dotted lines show representation of measured nuclei for fluorescence intensity. Scale bar = 25 µm. (C) Dot-plot of the MFI of SOX2 (x-axis) and SOX21 (y-axis). The green filled circles are TRP63+ basal cells and the number in each quadrant represents the percentage of basal cells in each quadrant. Bar graph is the quantification of basal cells that are either high (MFI > 1) or low (MFI < 1) in expression of SOX2 and SOX21. The red filled circles are FOXJ1+-ciliated cells and the number in each square represents the percentage of ciliated cells in each quadrant. Bar graph is the quantification of ciliated cells that are either high (MFI > 1) or low (MFI < 1) in expression of SOX2 and SOX21. One-way ANOVA (n = 3; **p<0.01, ***p<0.001). (D) Analysis of MTEC cultures of tracheal cells derived from wild-type (WT), Sox2+/-, or Sox21+/- animals after 10 days of ALI culture. Immunofluorescence staining of ciliated cells (FOXJ1, red) or secretory cells (SCGB3A2, green). Scale bar = 50 µm. Quantification of the number of ciliated cells per 775 µm2 field. One-way ANOVA (n = 3; **p<0.01). (E) Schematic representation of the iSox2CC10-rtTA and iSox21CC10-rtTA mouse models. Doxycycline was given to adult mice for 6 weeks. Immunofluorescence and quantification of the number of SCGB1A1+ (yellow) secretory cells, FOXJ1+ (red) ciliated cells and TRP63+ (green) basal cells in wild-type (WT) compared to iSox2CC10-rtTA and iSox21CC10-rtTA mice. One-way ANOVA (n = 3; *p<0.05, **p<0.01). Scale bar = 50 µm. (F) Upon homeostasis, tracheal epithelium has a low turnover. The induction of MYC-SOX2 or MYC-SOX21 results in a loss of secretory cell phenotype. The induction of MYC-SOX2 drives the appearance of basal cells. The induction of MYC-SOX21 appears insufficient to drive differentiation toward a basal or ciliated cell type.
-
Figure 4—source data 1
Quantification of the number of positive cells represented in the plots.
- https://cdn.elifesciences.org/articles/57325/elife-57325-fig4-data1-v2.xlsx
Figure 4—figure supplement 1
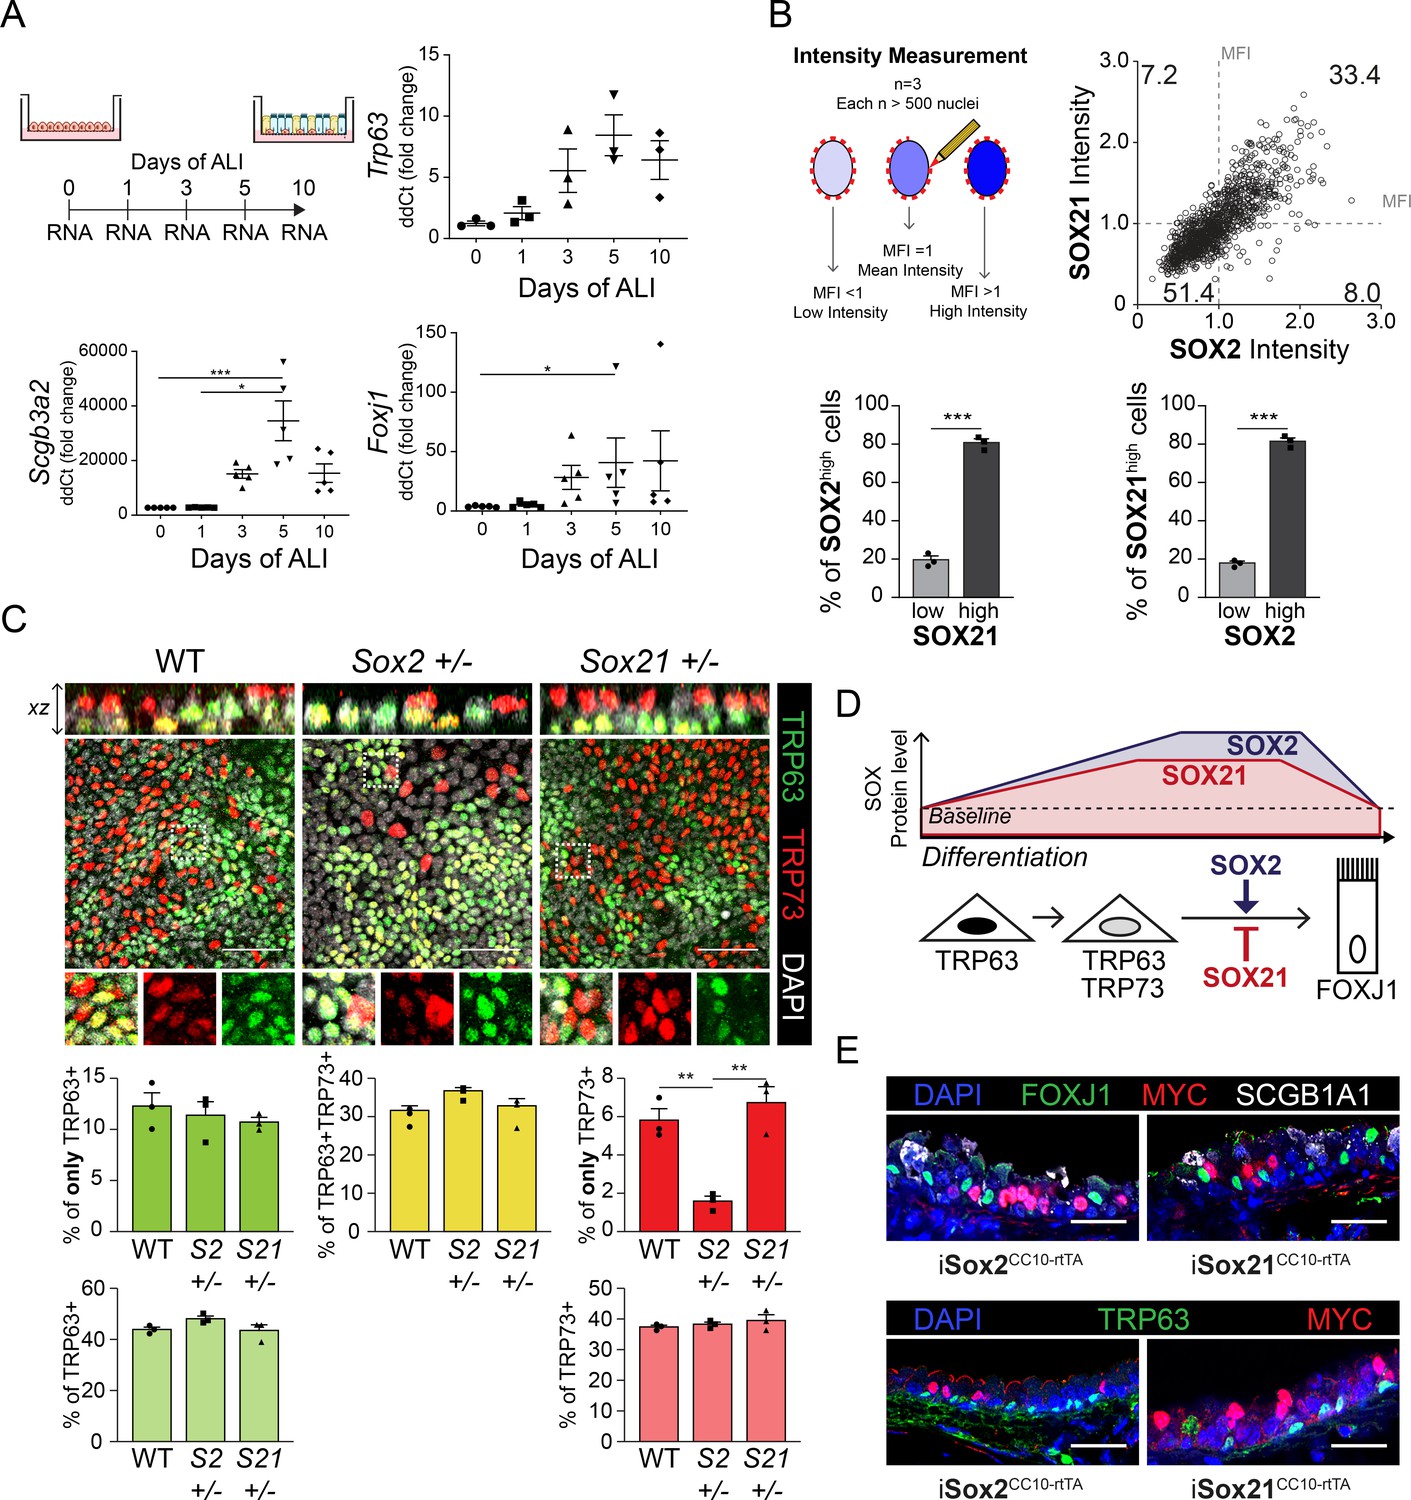
SOX2 and SOX21 are inversely correlated with basal cell differentiation to ciliated cells.
(A) Schematic overview of mouse tracheal epithelial cell (MTEC) culture experiment. QPCR analysis of TRP63, SCGB3A2 and FOXJ1 expression during differentiation of MTECs on air–liquid interface (ALI). One-way ANOVA (n = 3 (TRP63), n = 5 (SCGB3A2, FOXJ1); *p<0.05, ***p<0.001). (B) Schematic representation of the method to measure the mean fluorescence intensity (MFI) on day 10 of ALI. Dot-plot of the MFI of SOX2 (x-axis) and SOX21 (y-axis). The number represents the percentage of cells in each quadrant of the total. Bar graph is the quantification of SOX2 high expressing cells (MFI > 1) that are either high (MFI > 1) or low (MFI < 1) in expression of SOX21 (left) and SOX21 high expressing cells (MFI > 1) that are either high (MFI > 1) or low (MFI < 1) in expression of SOX2 (right). Unpaired T-test (n = 3; ***p<0.001). (C) Analysis of MTEC cultures of tracheal epithelial cells derived from wild-type (WT), Sox2+/−, or Sox21+/− animals, after 10 days of ALI culture. Immunofluorescence staining of TRP63 (green) and TRP73 (red). Scale bar = 50 µm. Quantification of the number of TRP63+ only (top) or total (bottom) basal cells, TRP63+TRP73+-double-positive basal cells, and TRP73+ only (top) or total (bottom) cells. One-way ANOVA (n = 3; **p<0.01). (D) Schematic overview of in vitro basal cell differentiation. SOX2 and SOX21 are expressed at basal levels but upon differentiation stimuli, expression levels increase. Both proteins are highest expressed in apical cells and ciliated cells. We propose a model, where SOX2 stimulates the transition of basal to ciliated cells, while SOX21 acts as an inhibitor in this process. Due, to the presence of FOXJ1+ SOX2highSOX21low cells we propose a sooner downregulation of SOX21 to baseline levels. (E) Trachea sections of doxycycline induced iSox2CC10-rtTA and iSox21CC10-rtTA mice. Sections are stained with MYC (purple), and FOXJ1 (top) and TRP63 (bottom) (green). Scale bar = 50 µm.
Figure 5 with 1 supplement
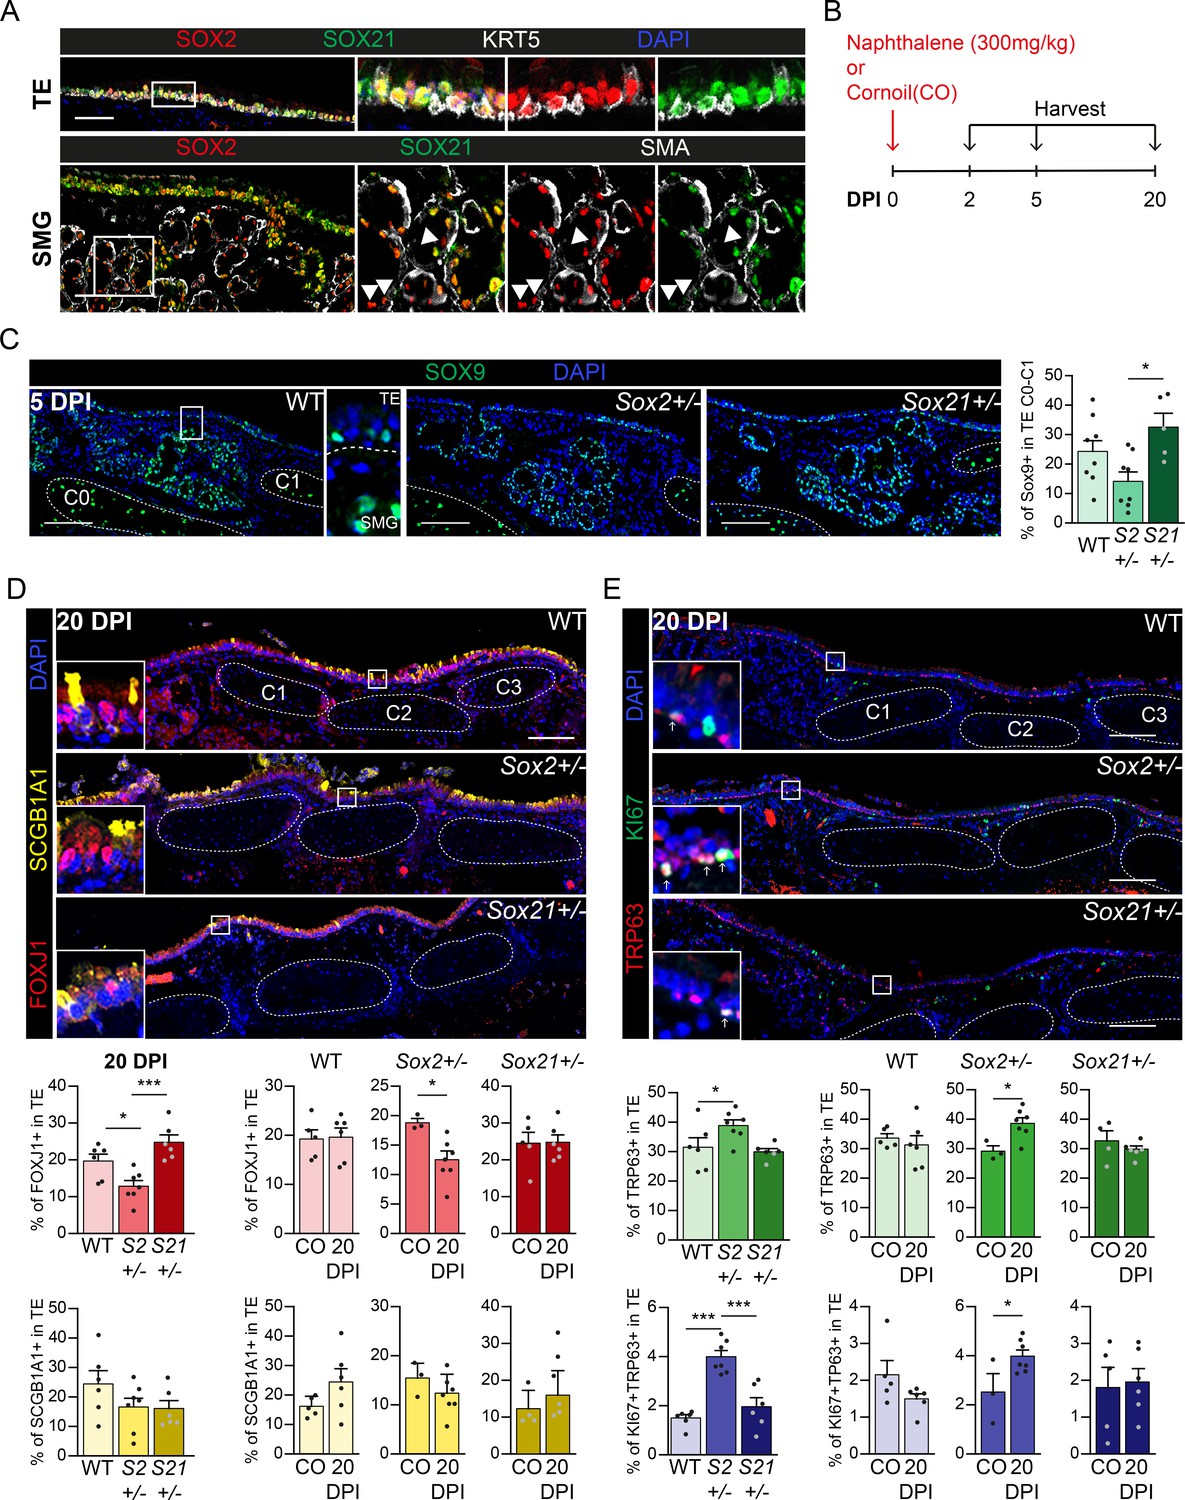
Regeneration is delayed in SOX2 deficient tracheal epithelium.
(A) Immunofluorescence staining on tracheal sections of adult wild-type mice for SOX2 (red), SOX21 (green), and KRT5 (grey, top row) or smooth muscle actin (grey, SMA, bottom row). TE = tracheal epithelium. SMG = submucosal gland. Closed arrowheads (u) indicate single SOX2+ cells. Scale bar = 100 µm. (B) Schematic overview of the experimental set up of the Naphthalene injury and recovery in wild-type (WT), Sox2+/− (S2+/−), and Sox21+/− (S21+/−) mice. (C) Immunofluorescence and quantification of the number of SOX9+ cells, 5 days post injury (DPI), in the upper TE from Cartilage (C) ring 0 till C1 in WT, Sox2+/− and Sox21+/− mice. Scale bar = 100 µm. One-way ANOVA (WT n = 8, Sox2+/− n = 8, Sox21+/− n = 5, *p<0.05). (D) Immunofluorescence of FOXJ+ (red) cells and SCGB1A1+ (yellow) cells in the TE, of WT, Sox2+/− and Sox21+/− mice at 20 DPI. Scale bar = 100 µm. Quantification of the number of FOXJ1+-ciliated cells and SCGB1A1+ secretory cells from C0 till C6 between genotypes. One-way ANOVA (WT n = 6, Sox2+/− n = 7, Sox21+/− n = 6, *p<0.05, ***p<0.001). Quantification of the number of ciliated cells, 20 DPI compared to the corn oil (CO) exposed mice of each WT, Sox2+/− and Sox21+/− mice. Unpaired T-test (WT: CO n = 5 and 20DPI n = 6, Sox2+/−: CO n = 3 and 20DPI n = 7, Sox21+/−: CO n = 5 and 20DPI n = 6, *p<0.05). (E) Immunofluorescence with TRP63 (red) and KI67 (green) to mark dividing basal cells in the TE, 20 DPI, in WT, Sox2+/−, and Sox21+/− mice. Scale bar = 100 µm. Quantification of the number of dividing basal cells from C0 till C6 between genotypes. One-way ANOVA (WT n = 6, Sox2+/− n = 7, Sox21+/− n = 6, ***p<0.001). Quantification of dividing basal cells, 20 DPI compared to CO mice of each wild-type (WT), Sox2+/−, and Sox21+/−. Unpaired T-test (WT: CO n = 5 and 20 DPI n = 6, Sox2+/−: CO n = 3 and 20 DPI n = 7, Sox21+/−: CO n = 5 and 20 DPI n = 6, *p<0.05).
-
Figure 5—source data 1
Quantification of the number of FOXJ1, SCGB1A1, TRP63 and KI67 positive cells represented in the plots.
- https://cdn.elifesciences.org/articles/57325/elife-57325-fig5-data1-v2.xlsx
Figure 5—figure supplement 1
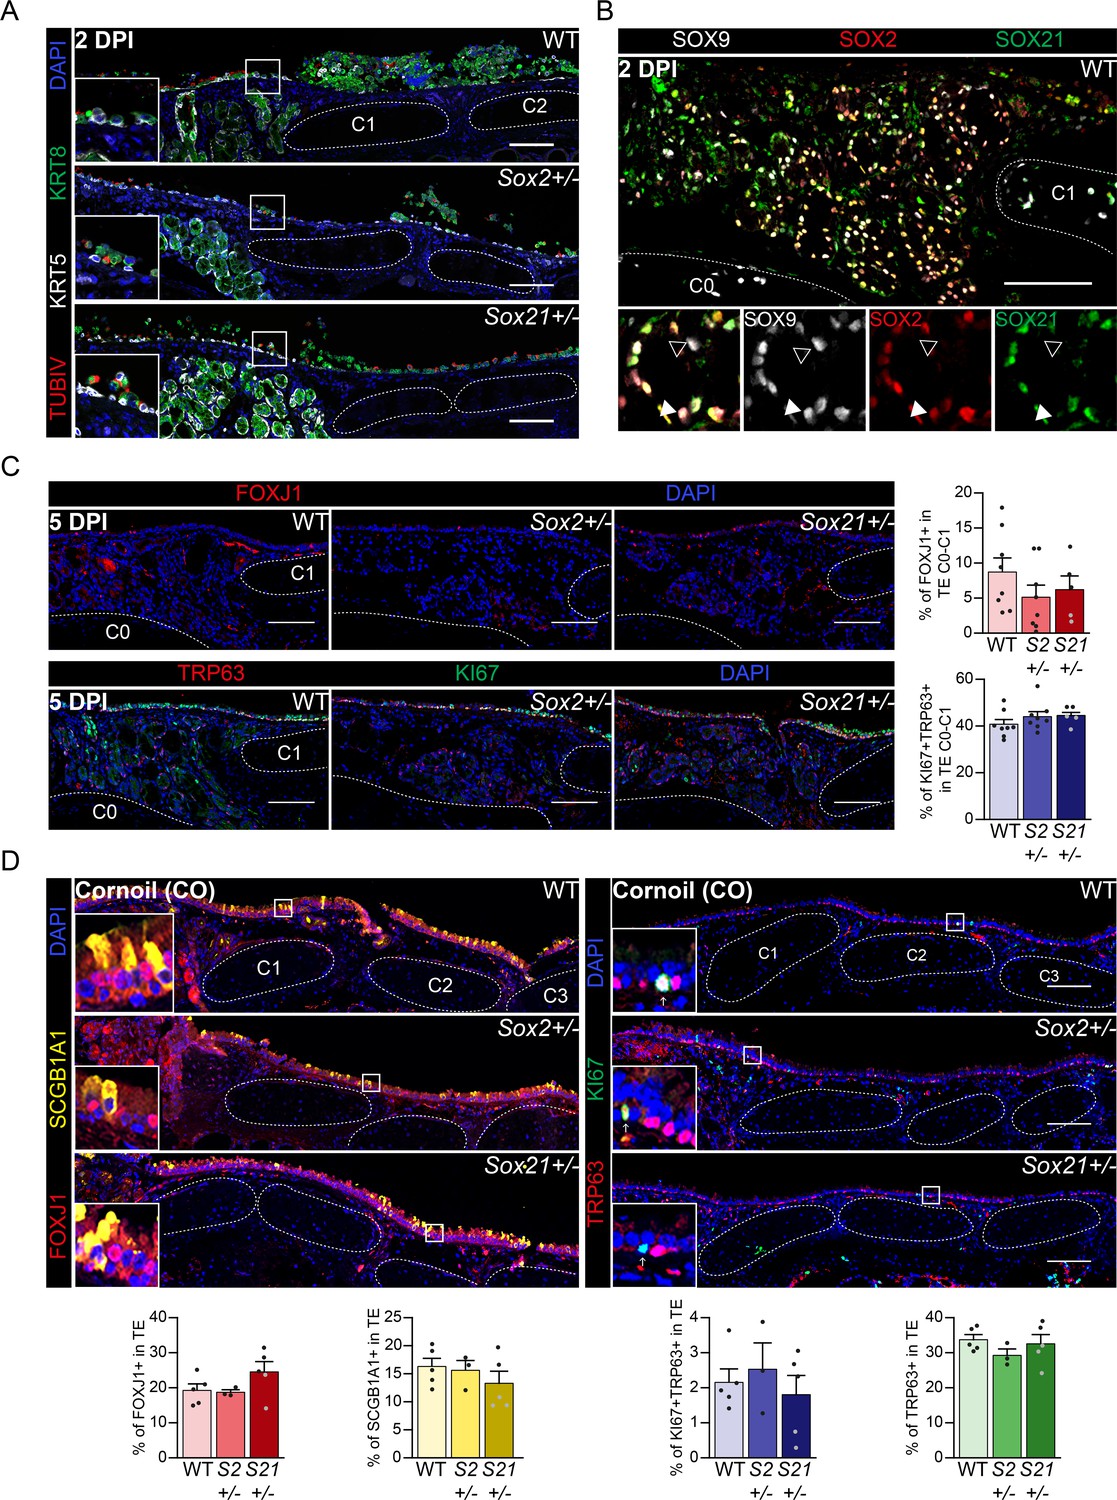
Regeneration is delayed in SOX2 deficient tracheal epithelium.
(A) Immunofluorescence staining on tracheal sections of wild-type (WT), Sox2+/−, and Sox21+/−, 2 days post injury (2 DPI) of Keratin 5 (KRT, grey), Keratin 8 (KRT8, green), TubilinIV (TUBIV, red). (B) Tracheal section showing Submucosal Glands (SMGs) at 2 DPI of wild-type mice. SOX2 (red) and SOX21 (green) expression is detected in SOX9+ SMG cells. Closed white arrowheads (u) indicate cells only expressing SOX2 and SOX9, open arrowheads (w) indicate cells only expressing SOX9. Scale bar = 100 µm. Scale bar = 100 µm. C = cartilage ring. (C) Immunofluorescence of FOXJ1+ ciliated cells (top row) or TRP63+ KI67+ dividing basal cells (bottom row), 5 DPI in wild-type (WT), Sox2+/− and Sox21+/− mice. Scale bar = 100 µm. Quantification of the number of FOXJ1+-ciliated cells from C0 till C1 between genotypes. One-way ANOVA (WT n=8, Sox2+/− n=8, Sox21+/− n=5, * p<0.05). (D) Immunofluorescence of FOXJ1+ (red) ciliated cells and SCGB1A1+ (yellow) secretory cells(left) or TRP63+ (green) KI67+ (red) dividing basal cells (right), on tracheal sections of corn oil exposed (CO) mice. Scale bar = 100 µm. Quantification of the number of FOXJ1+-ciliated cells, SCGB1A1+ secretory cells TRP63+KI67+-dividing basal cells or TRP63+ basal cells from C0 till C6 between genotypes in corn oil exposed (CO) mice. One-way ANOVA (WT n = 5, Sox2+/− n = 3, Sox21+/− n = 5).
Figure 6
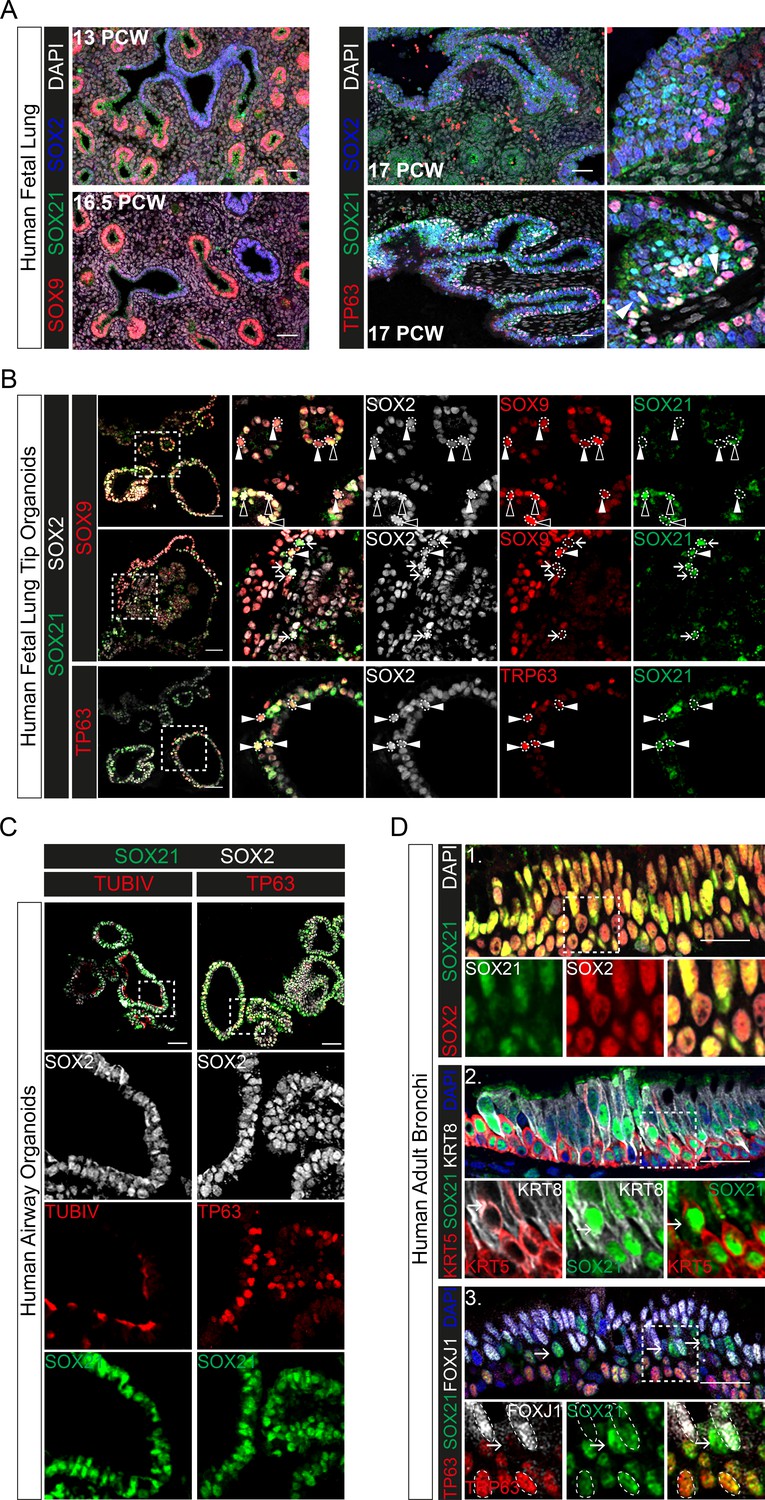
Evolutionary conserved expression of SOX21 in human airway epithelium.
(A) Immunofluorescence on human fetal lung sections post-conceptional week (PCW) 13, 16.5, and 17. Proximal–distal patterning of human developing airways is analyzed with SOX9 (red) and SOX2 (blue) (left). In the small developing airways (left), no expression of SOX21 (green) was observed. On the right, co-staining of SOX2 (blue), SOX21 (green), and TP63 (red). The closed white arrowheads show cells co-expressing TP63 and SOX21. Scale bar = 50 µm. (B) Top and middle row: Immunofluorescence analysis of fetal lung organoids shows SOX2 (grey), SOX9 (red), and SOX21 (green) positive cells. White closed triangles (►) show cells positive for SOX2 and SOX9, open triangles (w) show cells positive for SOX2, SOX21, and SOX9. Arrows (g) show cells positive for SOX21 and SOX2. Bottom row: Immunofluorescence analysis of SOX2 (grey), TP63 (red), and SOX21 (green) in fetal lung organoids. White closed arrowheads (►) show cells positive for SOX2, TP63, and SOX21. Scale bar = 50 µm. (C) Fetal lung organoids differentiated to airway epithelium, as shown by the presence of ciliated cells (TUBIV; left) or basal cells (TP63, right), have an abundant expression of SOX21 (green). Scale bar = 50 µm. (D) Immunofluorescence analysis of sections of human adult bronchi shows co-localization of SOX2 (red) and SOX21 (green) throughout the epithelium (1, top row). SOX21 (green) is expressed in luminal (KRT8; grey) and basal (KRT5; red) cells (2, middle row). SOX21 is expressed in basal (TP63; red) and ciliated (FOXJ1; grey) and is high expressed in cells absent of TP63 and FOXJ1(g) (3, bottom row). Scale bar = 25 µm.
Figure 7 with 1 supplement
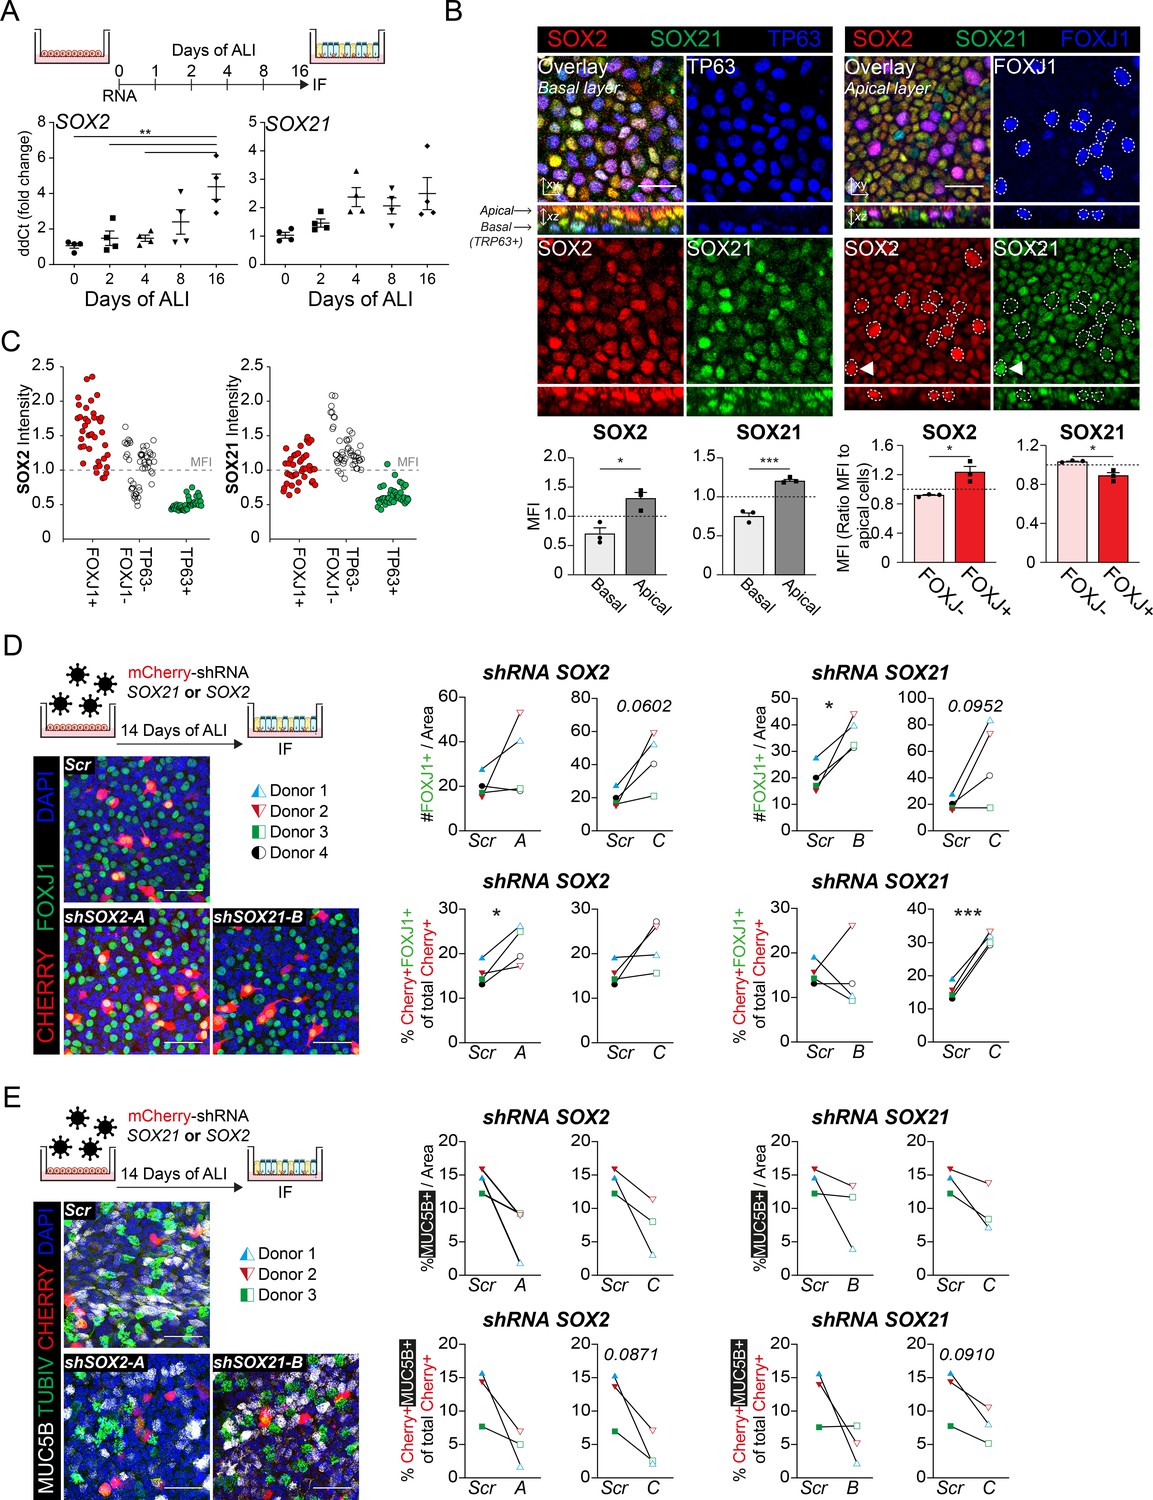
SOX2 and SOX21 in human basal cell differentiation.
(A) Schematic overview of human primary bronchial epithelial cell (HPBEC) culture. QPCR analysis of SOX2 and SOX21 expression during differentiation of HPBECs on air–liquid Interface (ALI). One-way ANOVA (n = 4 (ALI cultures of four different donors); ***p<0.001). (B) Immunofluorescence analysis of HPBEC 16 days after ALI of SOX2 (red), SOX21 (green), and TP63 (blue; left) or FOXJ1 (blue; right). XZ plane shows basal cells (TP63+) at the basal membrane and ciliated cells (FOXJ1+) at the apical side. Scale bar = 25 µm. The grey bar graphs the MFI of SOX2 or SOX21 in basal and apical cells. The red bar graphs show the MFI of SOX2 or SOX21 in FOXJ+ and FOXJ− apical cells. The circled FOXJ1+ nuclei show high expression of SOX2 with sporadic high expression of SOX21(t) as well. Paired T-test (n = 3 [ALI cultures of three different donors]; *p<0.05, ***p<0.001). (C) Dot-plot of the MFI of SOX2 (y-axis: left graph) or SOX21 (y-axis: right graph). Each dot represents a cell, and ALI cultures of two different donors are included. The red filled circles are FOXJ1+-ciliated cells, green filled circles are TP63+ basal cells and non-filled are FOXJ1− TP63− cells. (D) Knockdown of SOX2 or SOX21 after lentiviral transduction of one of two different shRNAs directed against different regions of the SOX2 or SOX21 gene. Scr are HPBECs transduced with lentivirus and expressing a scrambled shRNA. The HPBEC ALI culture was transduced 1 day before exposure to air. The number of FOXJ1+ nuclei were analyzed after 14 days of ALI. Immunofluorescence of FOXJ1+ (green) ciliated cells and mCherry+ (red) transduced cells. Scale bar = 25 µm. The graphs show quantification of the average number of FOXJ1+ cells per area of 375.5 µm2 (Top) and the percentage of FOXJ1+mCherry+ cells of total mCherry+ cells (bottom). Paired T-test (n = 4 [four different donors]; *p<0.05, ***p<0.001). (E) Immunofluorescence of HPBECs transduced with lentiviruses to knockdown SOX2 (shSOX2-B) or SOX21 (right; shSOX21-B) stained with TUBIV+ (green) to visualize differentiated ciliated cells, MUC5B+ (grey) for goblet cells and mCherry+ (red) denotes transduced cells. Scr are HPBECs transduced with lentivirus and expressing a scrambled shRNA. Scale bar = 25 µm. The area of MUC5B+ was measured after 14 days of ALI. The graphs show quantification of the average MUC5B+ per area of 375.5 µm2. n = 3 (three different donors), each treated with two different shRNA constructs.
-
Figure 7—source data 1
Quantification of the number of positive cells represented in the plots.
- https://cdn.elifesciences.org/articles/57325/elife-57325-fig7-data1-v2.xlsx
Figure 7—figure supplement 1
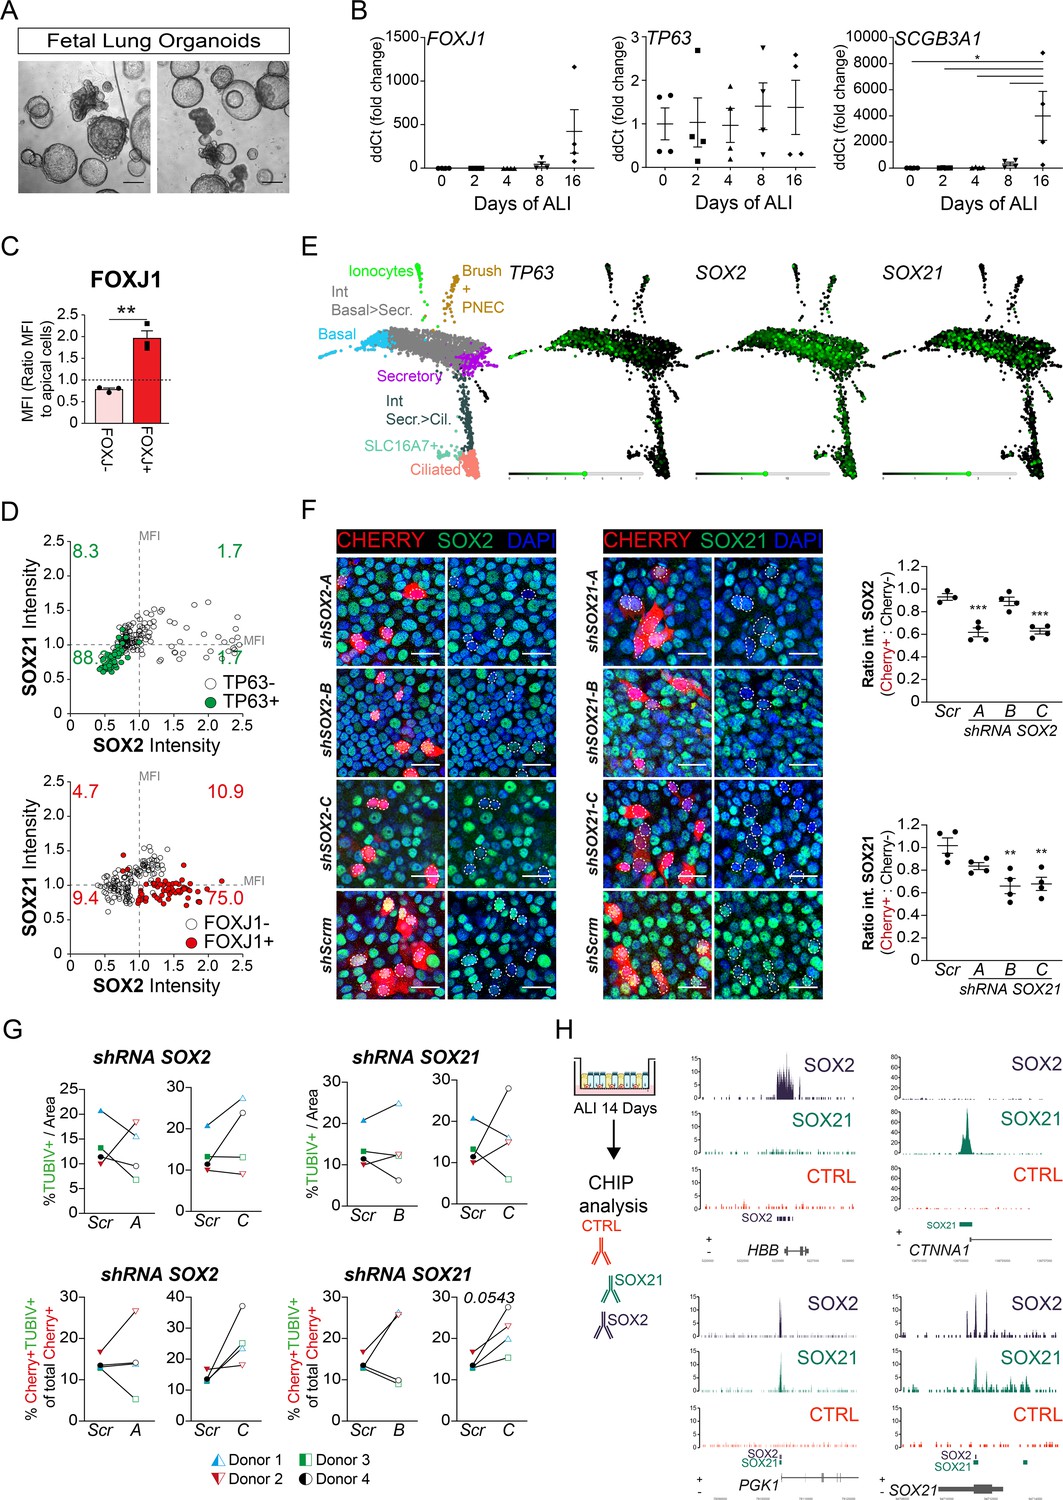
SOX21 in human airway epithelium.
(A) Bright field images of human fetal lung tip organoids (scale bar = 250 µm). (B) QPCR analysis of TP63, SCGB3A1, and FOXJ1 expression during differentiation of HPEBCs on air–liquid Interface (ALI). One-way ANOVA (n = 4 [different donors]; ***p<0.001). (C) Bar graphs show the separation of apical cells in FOXJ1+ versus FOXJ1− cells, belonging to Figure 6D. A higher MFI was found in the cells selected for ciliated cells. Paired T-test (n = 3 [ALI cultures of three different donors]; **p<0.005). (D) Dot-plot representation of the MFI of SOX2 (x–axis) and SOX21 (y–axis). The green filled circles are TP63+ basal cells (upper graph) and the number in each quadrant represents the percentage of basal cells in each square. The red filled circles are FOXJ1+-ciliated cells (lower graph) and the number in each quadrant represents the percentage of ciliated cells in each square. Each dot represents a cell and ALI cultures of two different donors are included. (E) Previous published single cell RNA sequencing data on HPBEC ALI culture showing the expression levels of TRP63, SOX2, and SOX21 in the different cell populations (Plasschaert et al., 2018). (F) Immunofluorescence of HPBECs transduced with lentiviruses to knockdown SOX2 (left; shSOX2-A to C) or SOX21 (right; shSOX21-A to C) stained on ALI D14 with SOX2+ (left) or SOX21+ (right) (green), and mCherry+ (red) denotes transduced cells. shScrm indicates HPBEC cultures transduced with lentivirus and expressing a scrambled shRNA. Scale bar = 25 µm. From each shRNA transduced HPBEC, the intensity of SOX2 or SOX21 was measured in mCherry+ cells and mCherry− cells. The ratio of the intensity per image was determined and plotted in the graph. One-way ANOVA (n = 4; **p<0.01, ***p<0.001). (G) HPBECs transduced with lentivirus shRNA SOX2-A,C or SOX21-B,C or Scrambled (Scr). The area of TUBIV+ was measured after 14 days of ALI. The graphs show quantification of the average TUBIV+ per area of 375.5 µm2. n = 3 (three different donors), each treated with two different shRNA constructs. (H) ChIP-seq analysis of SOX2 and SOX21 binding sites in HPEC at ALI D14. The graphs shows examples of individual SOX2 (HBB) and SOX21 (CTNNA1) binding sites, and common binding sites (PGK1; SOX21).
Author response image 1
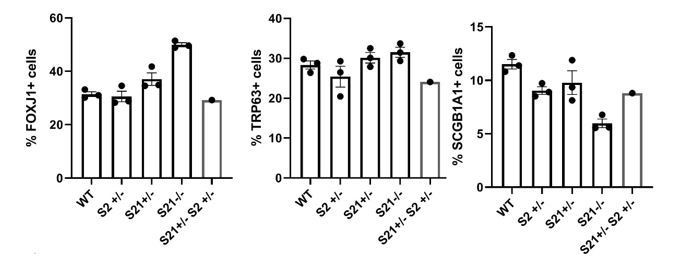
Bar graphs representing the percentage of FOXJ1+, TRP63+ and SCGB1A1+ cells in E18.
5 lungs of WT, Sox2Sox2+/-, Sox21+/-, Sox21-/- and Sox2Sox2+/-Sox21+/- mice.
Author response image 2
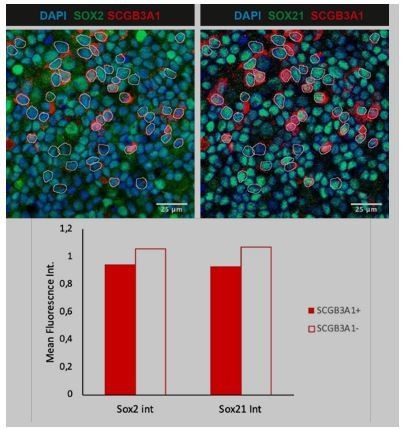
Intensity of SOX2 or SOX21 was measured in nuclei of SCGB3A1+ cells and SCGB3A1- cells.
Circles were put around nuclei that were SCGB3A1+. Staining of SCGB3A1 was analyzed throughout the z-stack.
Tables
Key resources table
| Reagent type (species) or resource | Designation | Source or reference | Identifiers | Additional information |
|---|---|---|---|---|
| Genetic reagent (M. musculus) | Sox2-CreERT | PMID:21982232 | MGI:5295990 | Sox2tm1(cre/ERT2)Hoch The Jackson Laboratories Stock No: 017593 |
| Genetic reagent (M. musculus) | Sox21-KO | PMID:19470461 | MGI:2654070 | Dr. Stavros Malas |
| Genetic reagent (M. musculus) | iSox2 | PMID:18374910 | MGI:98364 | Dr. Robbert Rottier |
| Genetic reagent (M. musculus) | iSox21 | - | MGI:2654070 | Dr. Robbert Rottier |
| Genetic reagent (M. musculus) | SPC-rtTA | PMID:11874100 | MGI:109517 | Prof. Jeffrey Whitsett |
| Genetic reagent (M. musculus) | CC10-rtTA | PMID:10766812 | MGI:98919 | Prof. Jeffrey Whitsett |
| Antibody | Mouse anti-β-TUBULIN IV | BioGenex | MU178-UC | 1:100 |
| Antibody | Mouse anti-FOXJ1 | eBioscience | 14–9965 | 1:200 |
| Antibody | Rabbit anti-KRT5 | Biolegend | Poly19055 | 1:500 |
| Antibody | Rat anti-KRT8 | DSHB | TROMA-I | 1:100 |
| Antibody | Rabbit anti-MYC (Immunofluorescence) | Abcam | AB9106 | 1:500 |
| Antibody | Rabbit anti-SCGB1A1 | Abcam | AB40873 | 1:200 |
| Antibody | Mouse anti-SCGB3A1 | R and D systems | AF1790 | 1:200 |
| Antibody | Goat anti-SCGB3A2 | R and D systems | AF3465 | 1:500 |
| Antibody | Mouse anti-SMA | Neomarkers | MS-113-P1 | 1:500 |
| Antibody | Rabbit anti-SOX2 | Seven-Hills | WRAB-SOX2 | 1:500 |
| Antibody | Goat anti-SOX2 | Immune systems | GT15098 | 1:500 |
| Antibody | Goat anti-SOX21 | R and D systems | AF3538 | 1:100 (TSA: 9 min) |
| Antibody | Rabbit anti-SOX9 | Abcam | AB185230 | 1:500 |
| Antibody | Mouse anti-TRP63 | Abcam | AB735 | 1:100 |
| Antibody | Rabbit anti-TRP73 | Abcam | AB40658 | 1:100 |
| Antibody | Rabbit anti-FLAG | Sigma | F7425 | Western blot, 1:1000 |
| Antibody | Rabbit anti-MYC | Abcam | AB9106 | 1:1000 |
| Antibody | Rabbit anti-MUC5B | Sigma | HPA008246 | 1:500 |
| Antibody | Mouse anti-β -TUBULIN | Sigma | T8328 | 1:2000 |
| Antibody | Alexa Fluor 405, 488, 594 Donkey anti Goat IgG | Jackson ImmunoResearch | 705-475-147, 705-545-147, 705-585-147 | 1:500 |
| Antibody | Alexa Fluor 488, 594, 647 Donkey anti Mouse IgG | Jackson ImmunoResearch | 715-545-151, 715-585-151, 711-605-151 | 1:500 |
| Antibody | Alexa Fluor 488, 594, 647 Donkey anti Rabbit IgG | Jackson ImmunoResearch | 711-545-152, 711-585-151, 711-605-152 | 1:500 |
| Antibody | Alexa Fluor 488, 594 Donkey anti Rat IgG | Jackson ImmunoResearch | 712-545-150 712-585-153 | 1:500 |
| Antibody | Donkey anti-Goat HRP conjugated | Jackson ImmunoResearch | 705-035-147 | 1:500 |
Table 1
Medium.
| KSFM-hPBEC medium | |||
|---|---|---|---|
| Reagent | Company | Cat. no. | Final concentration |
| KSFM | Gibco | 17005034 | n/a |
| Penicillin/streptomycin | Lonza | DE17-602e | 100 U/ml 100 µg/ml |
| Bovine pituitary extract | Gibco | 13028014 | 0.03 mg/ml |
| Human EGF | Peprotech | 315–09 | 25 ng/ml |
| Isoproterenol | Sigma | I-6504 | 1 µM |
| KSFM-MTEC expansion medium | |||
| Reagent | Company | Cat. no. | Final Concentration |
| KSFM | Gibco | 17005034 | n/a |
| Penicillin/streptomycin | Lonza | DE17-602e | 100 U/ml 100 µg/ml |
| Bovine pituitary extract | Gibco | 13028014 | 0.03 mg/ml |
| Mouse EGF | Peprotech | 315–09 | 25 ng/ml |
| Isoproterenol | Sigma | I-6504 | 1 µM |
| Rock Inhibitor (Y27632) | Axon MedChem | 1683 | 10 µM |
| DAPT | Axon MedChem | 1484 | 5 µM |
| MTEC proliferation medium | |||
| Reagent | Company | Cat. no. | Final concentration |
| DMEM:F12 | Gibco | 1133032 | n/a |
| Penicillin/streptomycin | Lonza | DE17-602e | 100 U/ml 100 µg/ml |
| NaHCO3 | Gibco | 25080094 | 0.03% (w/v) |
| Fetal calf serum | HyClone | SH30071.03 | 5% |
| L-Glutamine | Gibco | 25030081 | 1.5 mM |
| Insulin-transferin-selenium | Gibco | 41400045 | 1× |
| Cholera toxin | Sigma | C8052 | 0.1 µg/ml |
| Bovine pituitary extract | Gibco | 13028014 | 0.03 mg/ml |
| Mouse EGF | Peprotech | 315–09 | 25 ng/ml |
| Rock inhibitor (Y27632) | Axon MedChem | 1683 | 10 µM |
| Retinoic acid | Sigma | R2625 | 0.05 µM |
| MTEC differentiation medium | |||
| Reagent | Company | Cat. no. | Final concentration |
| DMEM:F12 | Gibco | 1133032 | n/a |
| Penicillin/streptomycin | Lonza | DE17-602e | 100 U/ml 100 µg/ml |
| NaHCO3 | Gibco | 25080094 | 0.03% (w/v) |
| Bovine serum albumin | Gibco | 15260037 | 0.1% (w/v) |
| L-Glutamine | Gibco | 25030081 | 1.5 mM |
| Insulin-transferin-selenium | Gibco | 41400045 | 1× |
| Cholera toxin | Sigma | C8052 | 0.025 µg/ml |
| Bovine pituitary extract | Gibco | 13028014 | 0.03 mg/ml |
| Mouse EGF | Peprotech | 315–09 | 5 ng/ml |
| Retinoic acid | Sigma | R2625 | 0.05 µM |
| Human fetal organoid medium | |||
| Reagent | Company | Cat. no. | Final concentration |
| Advanced DMEM:F12 | Invitrogen | 12634–034 | n/a |
| R-Spondin | Peprotech | 120–38 | 500 ng/ml |
| Noggin | Peprotech | 120–10C | 100 ng/ml |
| Fgf10 | Peprotech | 100–26 | 100 ng/ml |
| Fgf7 | Peprotech | 100–19 | 100 ng/ml |
| EGF | Peprotech | AF-100–15 | 50 ng/ml |
| CHIR99021 | Stem Cell Techn. | 72052 | 3 µM |
| SB431542 | Tocris | 1614 | 10 µM |
| B27 supplement (- VitA) | ThermoFisher | 12587–010 | 1× |
| N-Acetylcysteine | Sigma | A9165 | 1.25 mM |
| Glutamax 100× | Invitrogen | 12634–034 | 1× |
| N2 | ThermoFisher | 17502–048 | 1× |
| Hepes | Gibco | 15630–56 | 10 mM |
| Penicillin/streptomycin | Lonza | DE17-602e | 100 U/ml 100 µg/ml |
| Primocin | Invivogen | Ant-pm-1 | 50 µg/ml |
| Human airway organoid medium | |||
| Reagent | Company | Cat. no. | Final concentration |
| Advanced DMEM:F12 | Invitrogen | 12634–034 | n/a |
| R-Spondin | Peprotech | 120–38 | 500 ng/ml |
| Noggin | Peprotech | 120–10C | 100 ng/ml |
| Fgf10 | Peprotech | 100–26 | 100 ng/ml |
| Fgf7 | Peprotech | 100–19 | 25 ng/ml |
| SB202190 | Sigma | S7067 | 500 nM |
| A83-01 | Tocris | 2939 | 500 nM |
| Y-27632 | Axon MedChem | 1683 | 5 µM |
| B27 supplement | Gibco | 17504–44 | 1× |
| N-Acetylcysteine | Sigma | A9165 | 1.25 mM |
| Nicotinamide | Sigma | N0636 | 5 mM |
| Glutamax 100× | Invitrogen | 12634–034 | 1× |
| Hepes | Gibco | 15630–56 | 10 mM |
| Penicillin/streptomycin | Lonza | DE17-602e | 100 U/ml 100 µg/ml |
| Primocin | Invivogen | Ant-pm-1 | 50 µg/ml |
Table 2
RT-PCR primers.
| RT-primers | |||
|---|---|---|---|
| Gene | Forward (5’→3’) | Reverse (5’→3’) | Species |
| Foxj1 | CAGACCCCACCTGGCAGAATTC | AAAGGCAGGGTGGATGTGGACT | Mouse |
| Gapdh (housekeeping) | CCTGCCAAGTATGATGACAT | GTCCTCAGTGTAGCCCAAG | Mouse |
| Krt5 | TACCAGACCAAGTATGAGGAG | TGGATCATTCGGTTCATCTCAG | Mouse |
| Scgb1a1 | GCAGCTCAGCTTCTTCGGACA | TCCTGGTCTCTTGTGGGAGGG | Mouse |
| Scgb3a2 | GTGGTTATTCTGCCACTGCCCTT | TCGTCCACACACTTCTTCAGTCC | Mouse |
| Sox2 | AACATGGCAATCAAATGTC | TTGCCAGTACTTGCTCTCAT | Mouse |
| Sox21 | TTGAAAGATGCCTCTCACCA | AATAAGCTAAATGGGAAGGGAG | Mouse |
| Trp63 | GGAAAACAATGCCCAGACTC | GATGGAGAGAGGGCATCAAA | Mouse |
| Actin (housekeeping) | ATTGGCAATGAGCGGTTC | GGATGCCACAGGACTCCAT | Human |
| Foxj1 | CCCACCTGGCAGAATTCAATCCG | CAGTCGCCGCTTCTTGAAAGC | Human |
| Scgb1a1 | GCTCCGCTTCTGCAGAGATCTG | GCTTTTGGGGGAGGGTGTCCA | Human |
| Scgb3a1 | TGCTGGGGGCCCTGACA | ACGTTTATTGAGAGGGGCCGG | Human |
| Sox2 | AATGCCTTCATGGTGTGGTC | TTGCTGATCTCCGAGTTGTG | Human |
| Sox21 | CCACTCGCTTGGATTTCTGACACA | TCGACTCAAACTTAGGGCAACGA | Human |
| Trp63 | CCACCTGGACGTATTCCACTG | TCGAATCAAATGACTAGGAGGGG | Human |
Table 3
Primers used for pGL4.10[luc2] cloning.
| Primers used for pGL4.10[luc2] cloning | ||
|---|---|---|
| Name | Primers (5’→3’) cut site | Cut site |
| Trp63 | Forward: CAGGGTACCGGGCACATTCCATCTTTCCT | KpnI |
| Reverse: CAGCTCGAGAGACTGGTCAAGGCTGCTCT | Xho | |
| Sox2 | Forward: CAGGGTACCCGCGAGAGTATTGCAGGGAA | KpnI |
| Reverse: CAGGCTAGCCGGAGATCTGGCGGAGAATA | NheI | |
| Trp73 | Forward: CAGGGTACCGGACACGCATCTGTTGTGGA | KpnI |
| Reverse: CAGCTCGAGTCTGCACACGCTGAGGAGCT | Xho | |
Additional files
Download links
A two-part list of links to download the article, or parts of the article, in various formats.
Downloads (link to download the article as PDF)
Open citations (links to open the citations from this article in various online reference manager services)
Cite this article (links to download the citations from this article in formats compatible with various reference manager tools)
SOX21 modulates SOX2-initiated differentiation of epithelial cells in the extrapulmonary airways
eLife 10:e57325.
https://doi.org/10.7554/eLife.57325


