Acetylcholine is released in the basolateral amygdala in response to predictors of reward and enhances the learning of cue-reward contingency
- Department of Psychiatry, Yale University, United States
- Yale Interdepartmental Neuroscience Program, United States
- City University of New York, Hunter College, United States
- Program in Neuroscience, Stony Brook University, United States
- National Institute of Neurological Disorders and Stroke (NINDS), United States
- National Institute of Mental Health (NIMH), United States
- Chinese Institute for Brain Research (CIBR), China
- State Key Laboratory of Membrane Biology, Peking University School of Life Sciences, China
- PKU-IDG/McGovern Institute for Brain Research, China
- Peking-Tsinghua Center for Life Sciences, Academy for Advanced Interdisciplinary Studies, Peking University, China
- Section of Comparative Medicine, Yale University School of Medicine, United States
Figures
Figure 1
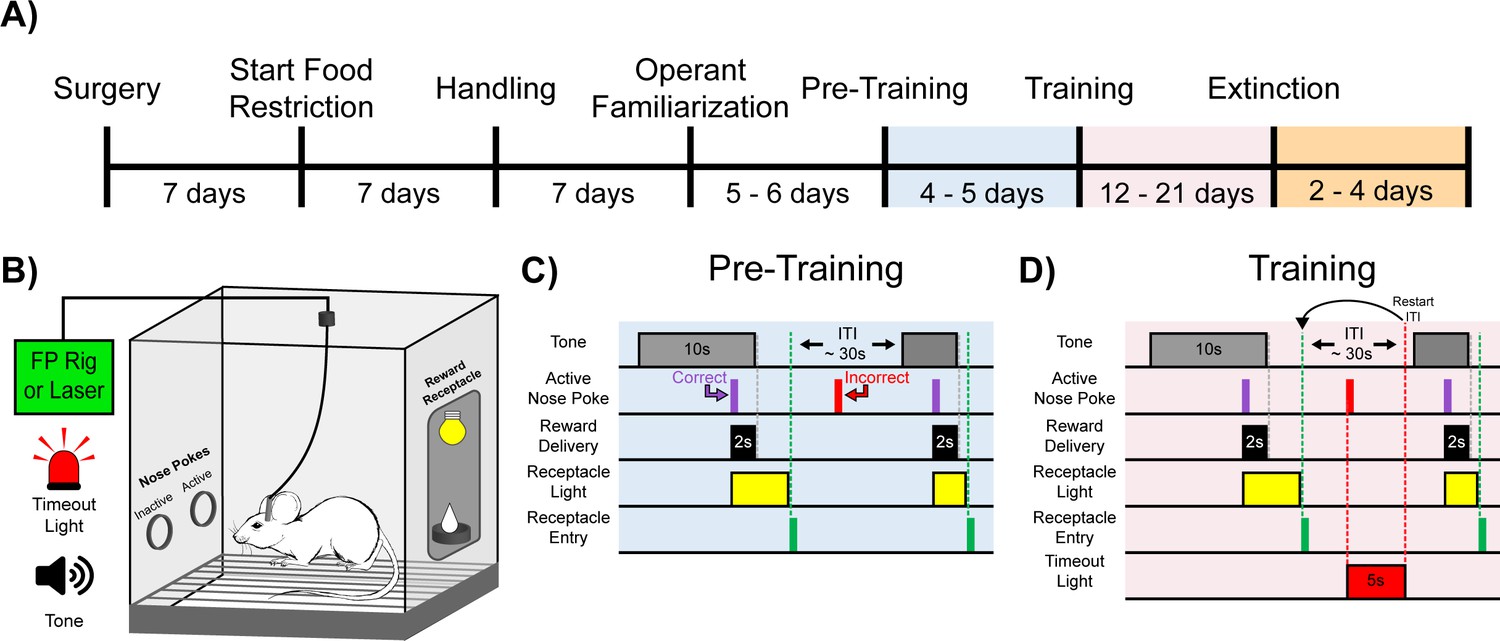
Experimental timeline and cue-reward learning paradigm.
(A) Experimental timeline. Mice began food restriction 7 d after surgery and were maintained at 85% free-feeding body weight for the duration of the experiment. After 7 d of handling, 5–6 d of operant familiarization prepared the mice for the cue-reward learning task (Pre-Training through Extinction). (B) Behavioral chamber setup. Mice were placed in modular test chambers that included two nose poke ports on the left wall (Active and Inactive) and the Reward Receptacle on the right wall. A tone generator and timeout light were placed outside the modular test chamber. For fiber photometry (FP) and optical stimulation (Laser) experiments, mice were tethered to a patch cord(s). (C–D) Details of the Cue-Reward Learning Paradigm. (C) In Pre-Training, an auditory tone was presented on a variable interval 30 schedule (VI30), during which an active nose poke yielded Ensure reward delivery but there was no consequence for incorrect nose pokes (active nose pokes not during tone). (D) Training was identical to Pre-Training, except incorrect nose pokes resulted in a 5 s timeout, signaled by timeout light illumination, followed by a restarting of the intertrial interval (ITI).
Figure 2 with 9 supplements
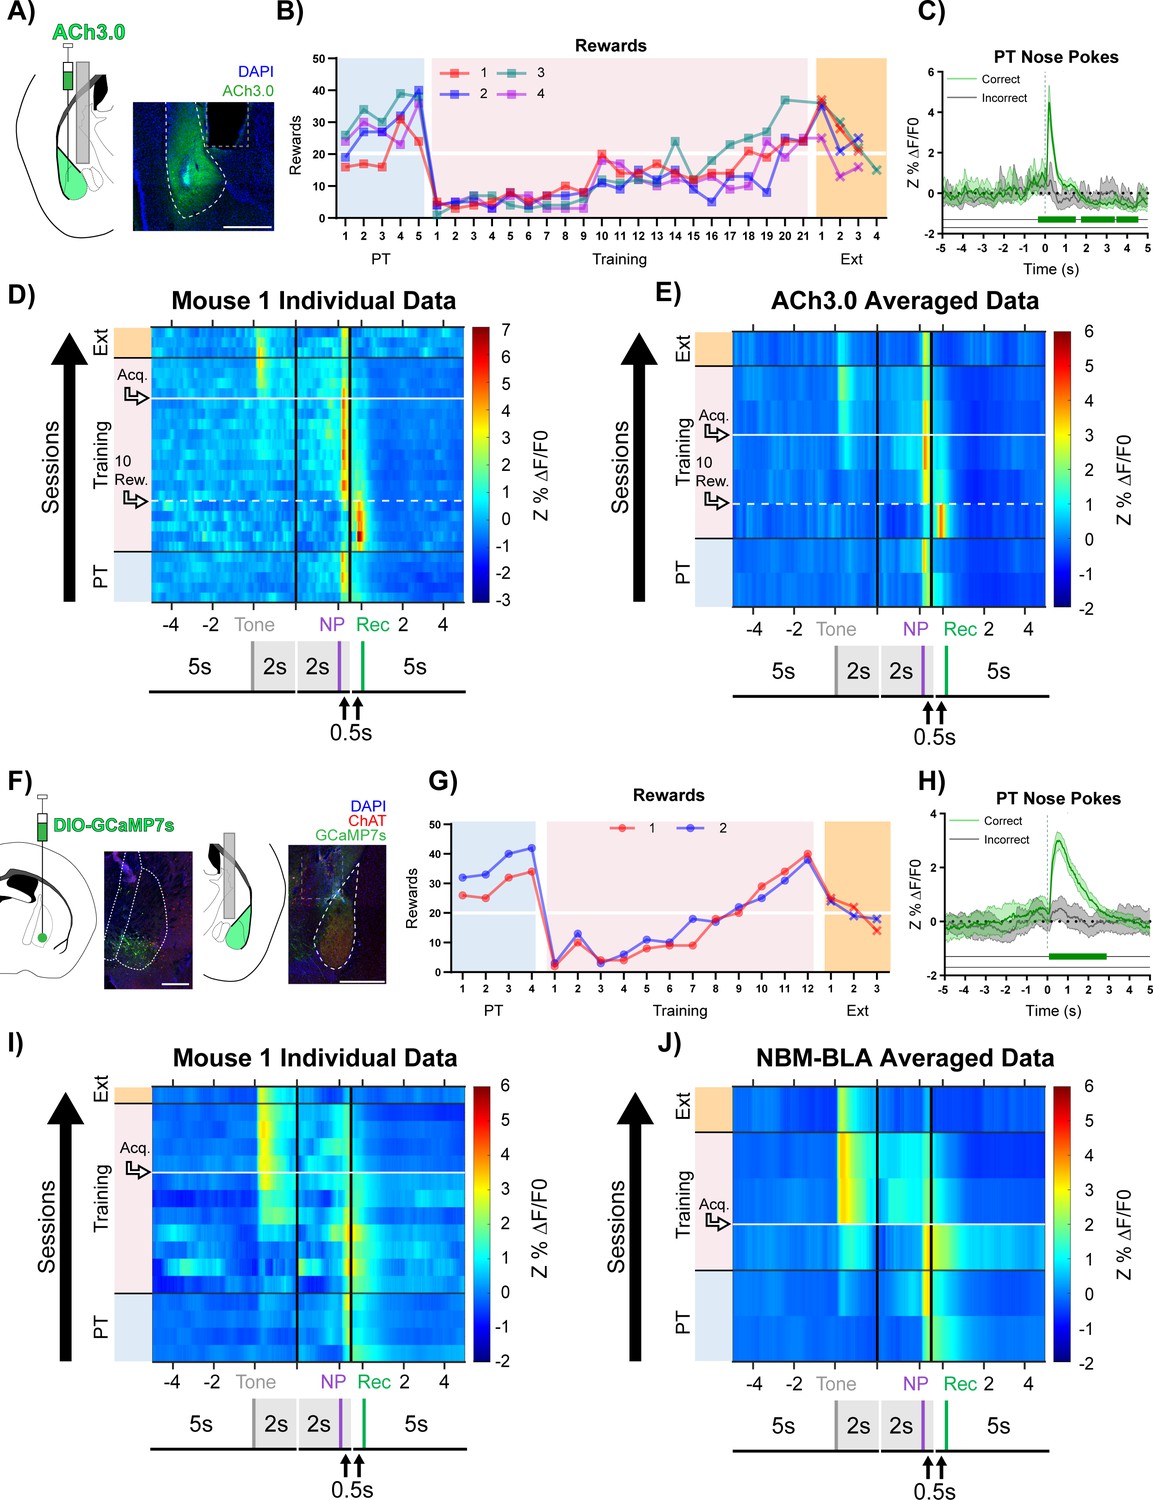
Basolateral amygdala (BLA) ACh signaling aligns with salient events during reward learning.
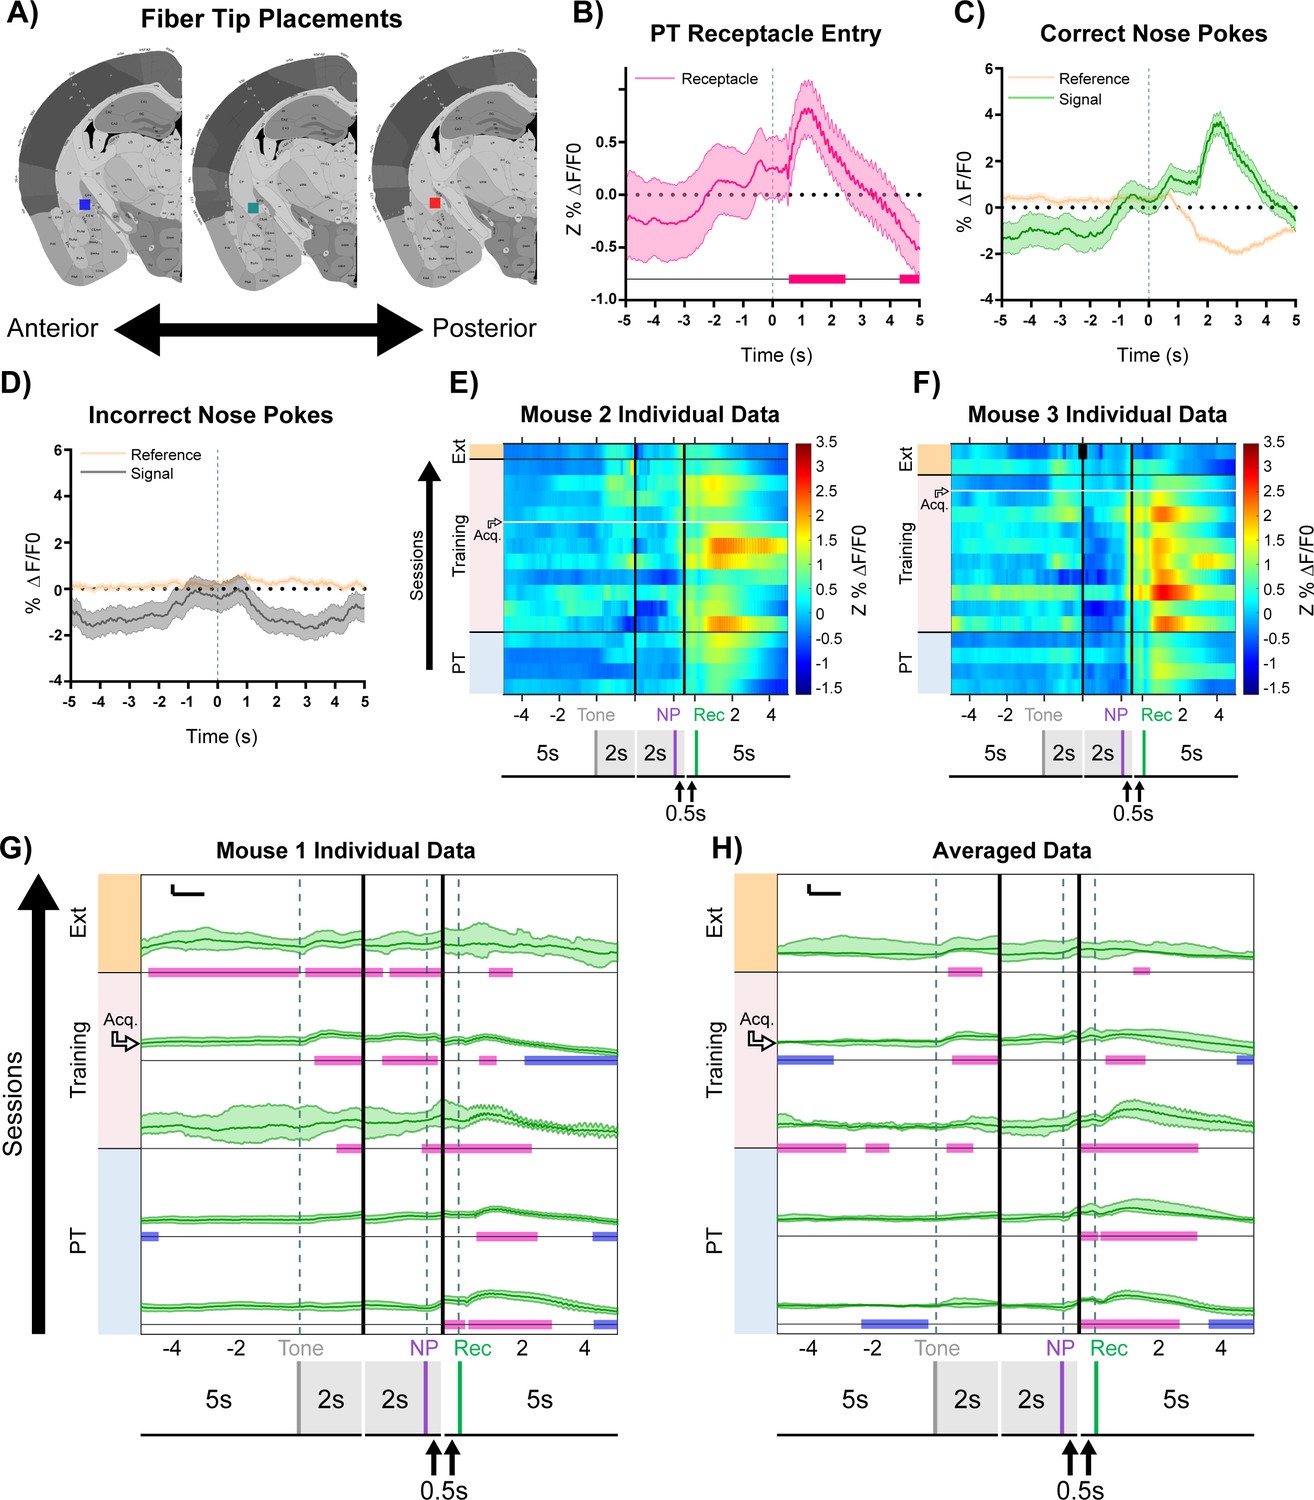
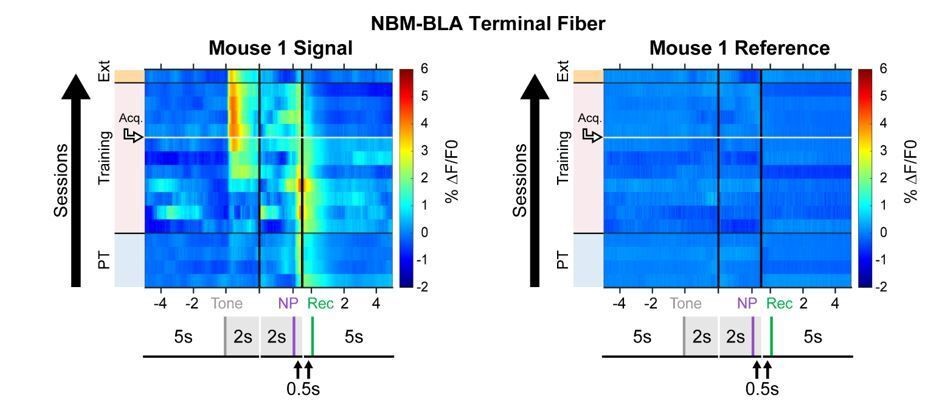
(A) Diagram and example of injection and fiber placement sites in the BLA for recording from mice expressing a fluorescent acetylcholine sensor (ACh3.0). Left: Diagram of BLA ACh3.0 injection and fiber tip placement. Right: Representative coronal brain slice with fiber tip and ACh3.0 expression. Blue: DAPI, Green: ACh3.0. White dashed line: BLA outline. Gray dashed rectangle: fiber track. Scale = 500 µm. Individual fiber placements are shown in Figure 2—figure supplement 1A. (B) Behavioral responses of mice expressing ACh3.0 in BLA. Individual mice acquired the task at different rates as measured by rewards earned. Horizontal white line: acquisition threshold, when a mouse began to earn 20 rewards consistently in Training. Incorrect nose pokes shown in Figure 2—figure supplement 2A. Pre-Training (PT): blue shaded area, Training: pink shaded area, Extinction (Ext): orange shaded area. (C) Fluorescence traces from BLA of ACh3.0-expressing mouse. A significant increase in fluorescence representing BLA ACh release consistently coincided with correct (green line) but not incorrect (gray line) nose pokes on the last day of PT (data are shown from Mouse 1). The mean Z-scored precent ΔF/F0 (Z%ΔF/F0) overlaid on bootstrapped 99% confidence intervals (99% bCIs). Shaded significance bars under traces represent time points where 99% bCIs do not contain 0 for at least 0.5 s. Correct: n = 24; downsampled incorrect: n = 24 of 58. Traces of signal and reference channels (%ΔF/F0) during nose pokes are shown in Figure 2—figure supplement 1B–C. Incorrect nose pokes on the last day of PT versus Training Day 1 shown in Figure 2—figure supplement 2B. (D) Heatmap of BLA ACh signaling in Mouse 1 across all training phases, aligned to tone onset (Tone), correct nose poke (NP), and receptacle entry (Rec). Each row is the average of rewarded trials across a training session. White dashed horizontal line: first Training day earning 10 rewards. Horizontal white line: acquisition threshold, when a mouse began to earn 20 rewards consistently in Training. Black horizontal lines: divisions between training phases. Black vertical lines: divisions between breaks in time to allow for variable latencies in tone onset, correct nose poke, and receptacle entry (reward retrieval). The bCI plot for Mouse 1 is in Figure 2—figure supplement 1G. Individual heatmaps for mice 2–4 in Figure 2—figure supplement 1D–F. Incorrect nose pokes heatmaps for individual mice shown in Figure 2—figure supplement 2C–F. (E) Heatmap of BLA ACh signaling averaged across mice. Signal aligned as in (D) with a selection of data from key days in the behavioral paradigm shown. From bottom to top: PT Day 1, PT Day 5, Early Training Day, First Training day earning 10 rewards (white dashed horizontal line), Mid Training Day, Acquisition Day (white horizontal line), Last Training Day, Last Extinction Day. The bCI plot for cohort averaged data is in Figure 2—figure supplement 1H. Incorrect nose poke heatmap and bCI plot averaged across mice shown in Figure 2—figure supplement 2G–H. (F) Diagram and example of Nucleus Basalis of Mynert (NBM)-BLA terminal fiber recordings. Left: DIO-GCaMP7s was injected in the NBM of ChAT-IRES-Cre mice, individual injection sites are shown in Figure 2—figure supplement 5A. Representative coronal brain slice showing GCaMP7s expression. White dashed lines: internal capsule and globus pallidus outlines. Blue: DAPI, Green: GCaMP7s, Red: ChAT. Scale = 500 µm; separate channels shown in Figure 2—figure supplement 5B. Right: An optical fiber was implanted above the ipsilateral BLA, individual fiber placements are shown in Figure 2—figure supplement 5A. Representative coronal brain slice showing GCaMP7 expression and fiber tip placement. White dashed line: BLA outline. Gray dashed rectangle: fiber tract. Blue: DAPI, Green: GCaMP7s, Red: ChAT. Scale = 500 µm; separate channels shown in Figure 2—figure supplement 5C. (G) Behavioral responses of mice during NBM-BLA terminal fiber recordings. White horizontal line: acquisition threshold, when a mouse began to earn 20 rewards consistently in Training. Incorrect nose pokes shown in Figure 2—figure supplement 6A. (H) NBM-BLA terminal fiber activity is similar to ACh3.0 recordings. NBM-BLA terminal fiber activity significantly increased with correct (green line) but not incorrect (gray line) nose pokes on the last day of PT (data shown for Mouse 1). Mean Z%ΔF/F0 overlaid on bootstrapped 99% confidence intervals (99% bCIs). Shaded significance bars under traces represent time points where 99% bCIs do not contain 0 for at least 0.5 s. Correct: n = 42; downsampled incorrect: n = 42 of 101. Signal and reference channels (%ΔF/F0) during nose pokes are shown in Figure 2—figure supplement 5D–E. Incorrect nose pokes on the last day of PT versus Training Day 1 shown in Figure 2—figure supplement 6B. See Figure 2—figure supplement 9A–H for simultaneous ACh3.0 and NBM-BLA terminal fiber recordings. (I) Heatmap of NBM-BLA terminal fiber activity in Mouse 1 across all training phases, as in (D-E). Blanks in the heatmaps indicate time bins added for alignment. bCI plot for Mouse 1 in Figure 2—figure supplement 7F. Mouse 2 individual heatmap shown in Figure 2—figure supplement 5F. Incorrect nose pokes heatmaps for individual mice shown in Figure 2—figure supplement 6C–D. (J) Heatmap of NBM-BLA terminal fiber activity averaged across mice. Signal aligned as in (D-E, I) with a selection of key days shown, from bottom to top: PT Day 1, PT Day 4, Early Training, Acquisition Day (white horizontal line), Last Training Day, Last Extinction Day. The bCI plot for cohort averaged data in Figure 2—figure supplement 7G. Incorrect nose poke heatmap and bCI plot averaged across mice shown in Figure 2—figure supplement 6E + Figure 2—figure supplement 8E.
Figure 2—figure supplement 1

BLA ACh3.0 recording.
(A) Squares indicate optical fiber tips for individual mice. 1 (red), 2 (blue), 3 (teal), 4 (purple). (B) Increase in fluorescence (%ΔF/F0) following correct nose pokes is specific to the signal (465 nm, green) channel and is not observed in the reference channel (405 nm, tan). Data from Mouse 1 PT Day 5 as in Figure 2C. Mean ± SEM, n = 24. (C) Minimal increase in fluorescence (%ΔF/F0) following incorrect nose pokes. Signal (465 nm, gray) channel, reference channel (405 nm, tan). Data from Mouse 1 PT Day 5 as in Figure 2C. Downsampled mean ± SEM, n = 24 of 58. (D–F) Individual mouse data for mice 2–4 as shown in Figure 2D. Dashed white horizontal line: first Training day earning 10 rewards (10 Rew.). White horizontal line: acquisition threshold (Acq.). (G) Mouse 1 combined action bCI plot for subset of days used in cohort averaged heatmap Figure 2E (from bottom to top: PT Day 1, PT Day 5, Early Training Day, First Training day earning 10 rewards, Mid Training Day, Acquisition Day, Last Training Day, Last Extinction Day). Mean overlaid on 99% bCIs for tone onset, correct nose poke, and receptacle entry. Pink and blue significance bars under traces denote time points where 99% bCIs are above or below 0 for at least 0.5 s, respectively. Horizontal scale = 1 s. Vertical scale = 5 Z%ΔF/F0. (H) Cohort averaged combined action bCI plot for subset of days used in (G) and cohort averaged heatmap Figure 2E. Trial level mean overlaid on 99% bCIs for tone onset, correct nose poke, and receptacle entry. Pink and blue significance bars under traces denote time points where 99% bCIs are above or below 0 for at least 0.5 s, respectively. Horizontal scale = 1 s. Vertical scale = 5 Z%ΔF/F0.
Figure 2—figure supplement 2
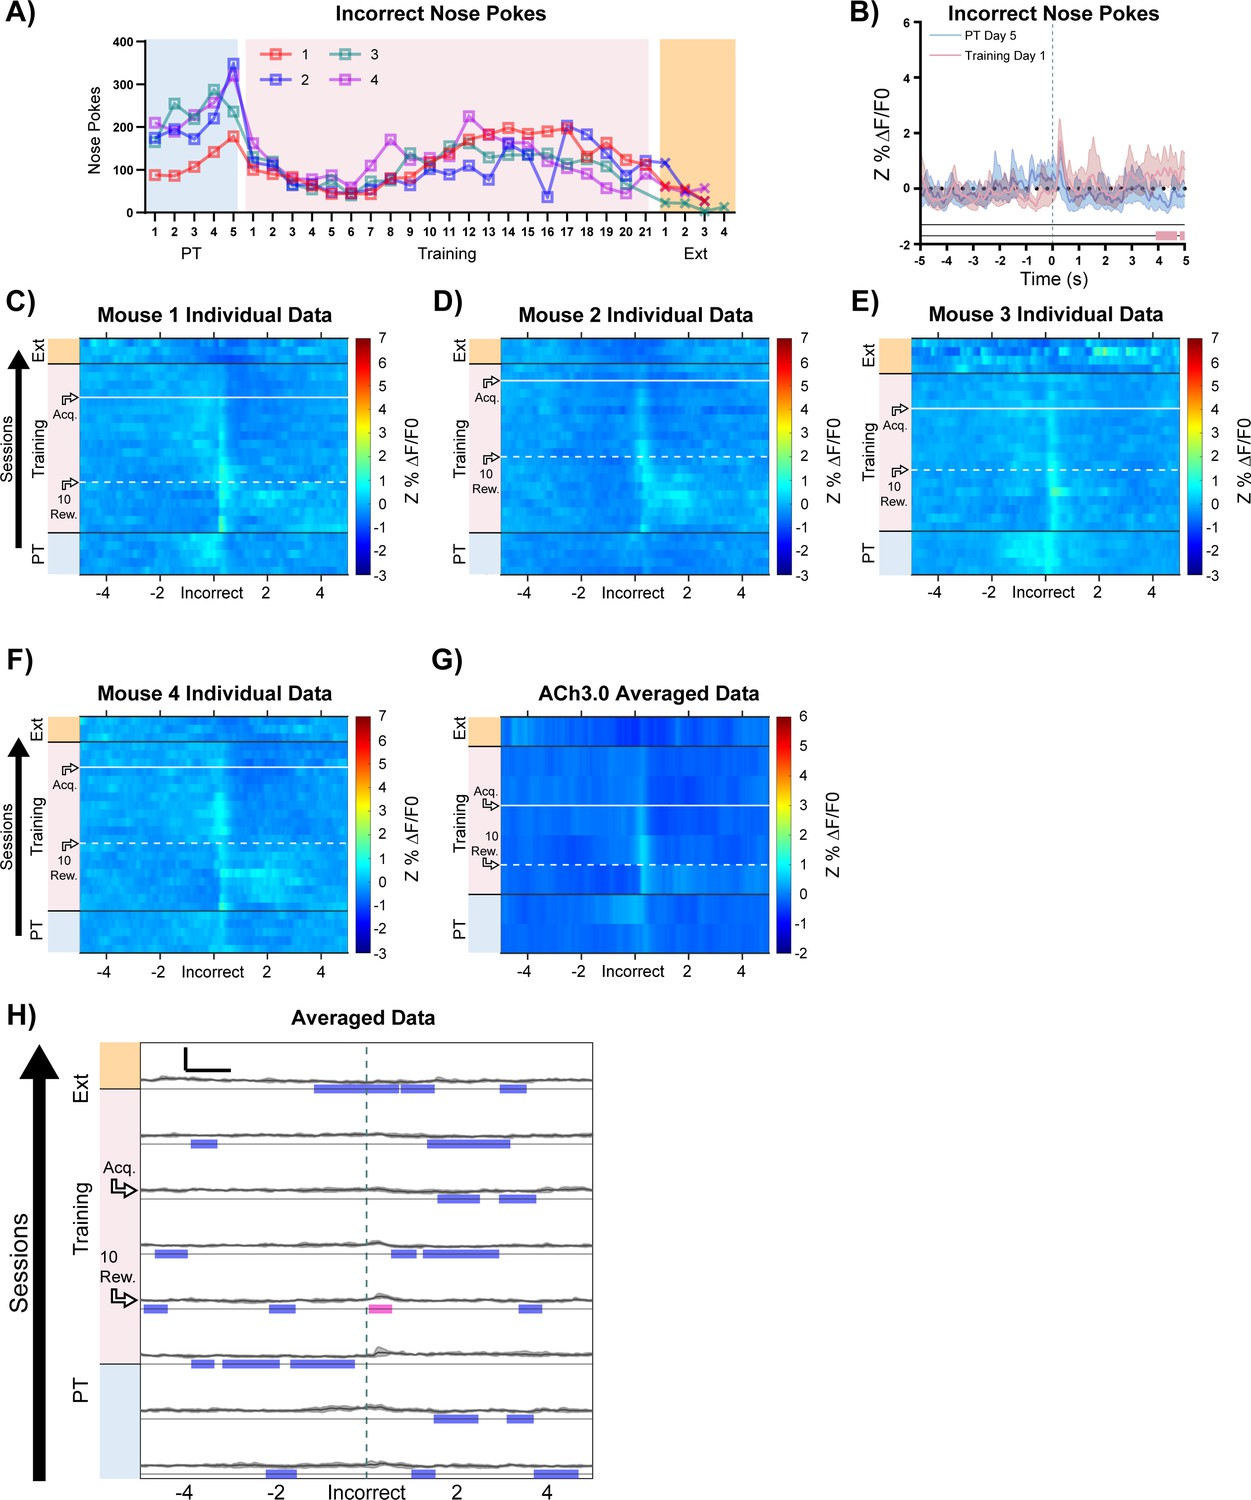
BLA ACh3.0 recording: incorrect nose pokes.
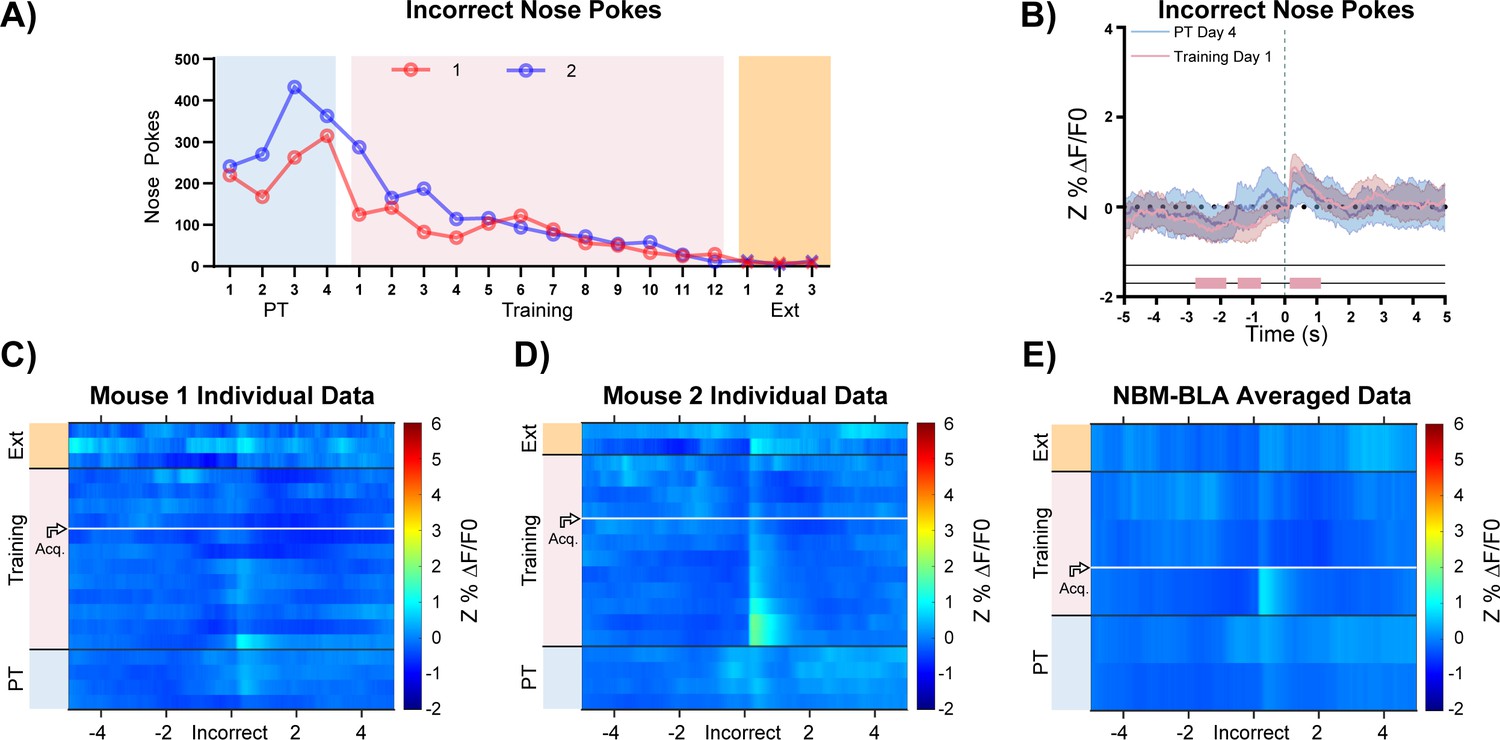
(A) Incorrect nose poking of individual mice throughout training. (B) Incorrect nose pokes that yield timeouts (downsampled Training Day 1, pink line, n = 24 of 66) result in a modest increase in BLA ACh signaling but incorrect nose pokes before timeouts are introduced (downsampled PT Day 5, blue line, n = 24 of 58) do not. Data from Mouse 1 as in Figure 2C, Mean Z%ΔF/F0 overlaid on bootstrapped 99% confidence intervals (99% bCIs). Shaded significance bars under traces represent time points where 99% bCIs do not contain 0 for at least 0.5 s. (C–F) Individual mouse heatmaps of BLA ACh signaling across all training phases, aligned to incorrect nose poke. Each row is the average of incorrect nose pokes that led to (or would have led to for PT) a timeout across a session. White dashed horizontal line: first Training day earning 10 rewards. Horizontal white line: acquisition threshold, when a mouse began to earn ~20 rewards consistently in Training. Black horizontal lines: divisions between training phases. (G) Heatmap of BLA ACh signaling during incorrect nose poke averaged across mice. Signal aligned as in (C-F) with a selection of data from key days in the behavioral paradigm shown. From bottom to top: PT Day 1, PT Day 5, Early Training Day, First Training day earning 10 rewards (white dashed horizontal line), Mid Training Day, Acquisition Day (white horizontal line), Last Training Day, Last Extinction Day. Black horizontal lines: divisions between training phases. (H) Cohort averaged bCI plot for subset of days used in (G). Trial level mean (downsampled to 20) overlaid on 99% bCIs for incorrect nose poke. Pink and blue significance bars under traces denote time points where 99% bCIs are above or below 0 for at least 0.5 s, respectively. It is unclear how to interpret the time points significantly below 0 before and after incorrect nose pokes pulled out by bootstrapping. This may be an artifact of the small signal across incorrect trials, although this remains to be investigated. Horizontal scale = 1 s. Vertical scale = 5 Z%ΔF/F0.
Figure 2—figure supplement 3

BLA ACh3.0 recording replicate.
(A) Squares indicate optical fiber tips for individual mice. 5 (orange), 6 (cyan), 7 (brown), 8 (navy). (B) Behavioral responses of mice during BLA ACh3.0 recordings. Individual mice acquired the task at different rates as measured by rewards earned. White horizontal line: acquisition threshold, when a mouse began to earn 20 rewards consistently in Training. Incorrect nose pokes shown in Figure 2—figure supplement 4A. (C–F) Heatmaps of BLA ACh signaling in mice 5–8 across all training phases, aligned to tone onset (Tone), correct nose poke (NP), and receptacle entry (Rec). Each row is the average of rewarded trials across a training session. Horizontal white line: acquisition threshold, when a mouse began to earn 20 rewards consistently in Training. Black horizontal lines: divisions between training phases. Black vertical lines: divisions between breaks in time to allow for variable latencies in tone onset, correct nose poke, and receptacle entry (reward retrieval). Blanks in the heatmaps indicate time bins added for alignment. (G) Heatmap of BLA ACh signaling averaged across mice 5–8. Signal aligned as in (C-F) with a selection of key days shown, from bottom to top: PT Day 1, PT Day 4, Early Training, Acquisition Day (white horizontal line), Last Training Day, Last Extinction Day. (H) Mouse 5 combined action bCI plot for subset of days used in (G). Mean overlaid on 99% bCIs for tone onset, correct nose poke, and receptacle entry. Pink and blue significance bars under traces denote time points where 99% bCIs are above or below 0 for at least 0.5 s, respectively. Horizontal scale = 1 s. Vertical scale = 5 Z%ΔF/F0. (I) Cohort (mice 5–8) averaged combined action bCI plot for subset of days used in (G-H). Trial level mean overlaid on 99% bCIs for tone onset, correct nose poke, and receptacle entry. Pink and blue significance bars under traces denote time points where 99% bCIs are above or below 0 for at least 0.5 s, respectively. Horizontal scale = 1 s. Vertical scale = 5 Z%ΔF/F0.
Figure 2—figure supplement 4
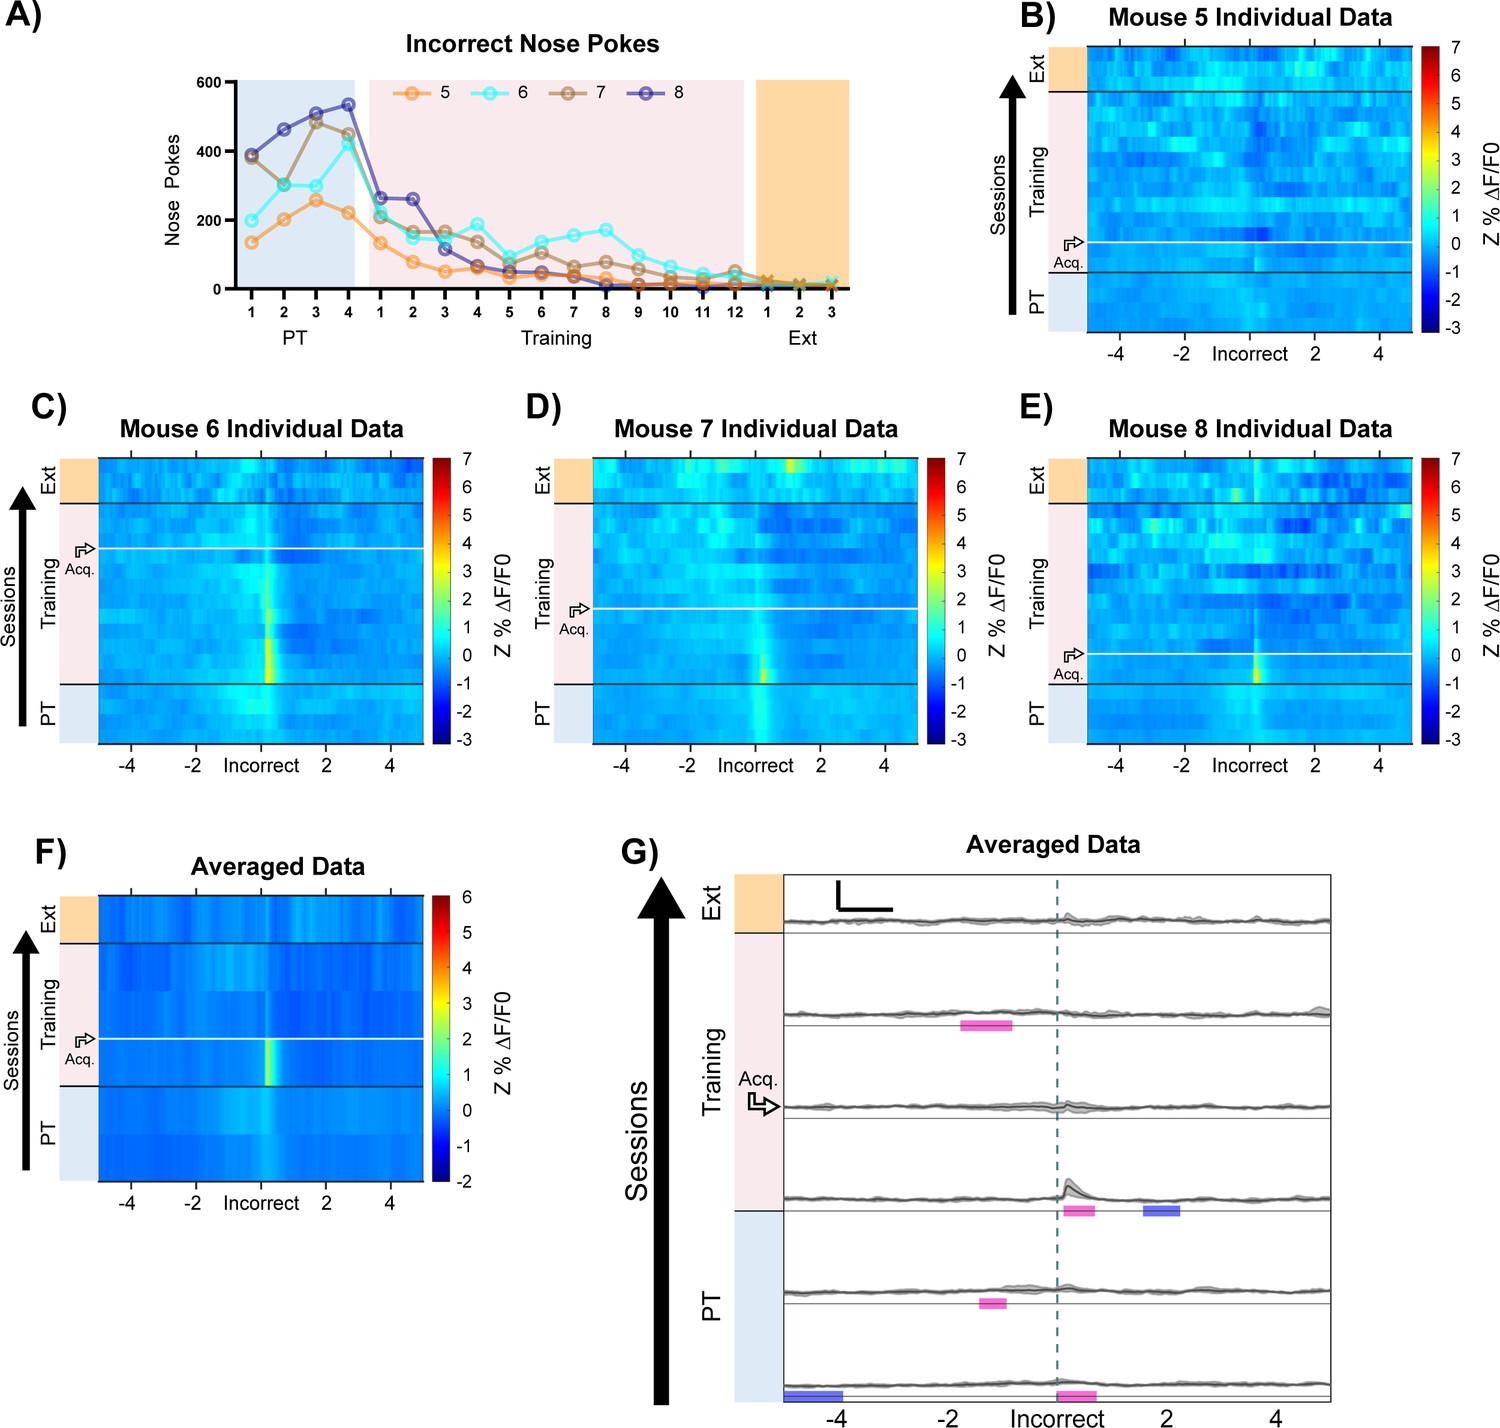
BLA ACh3.0 recording replicate: incorrect nose pokes.
(A) Incorrect nose poking of individual mice throughout training. (B–E) Individual mouse heatmaps of BLA ACh signaling across all training phases, aligned to incorrect nose poke. Each row is the average of incorrect nose pokes that led to (or would have led to for PT) a timeout across a session. Horizontal white line: acquisition threshold, when a mouse began to earn 20 rewards consistently in Training. Black horizontal lines: divisions between training phases. (F) Heatmap of BLA ACh signaling during incorrect nose poke averaged across mice. Signal aligned as in (B-E) with a selection of data from key days in the behavioral paradigm shown. From bottom to top: PT Day 1, PT Day 4, Early Training Day, Acquisition Day (white horizontal line), Last Training Day, Last Extinction Day. Black horizontal lines: divisions between training phases. (G) Cohort averaged bCI plot for subset of days used in (F). Downsampled trial level mean overlaid on 99% bCIs for incorrect nose poke. Pink and blue significance bars under traces denote time points where 99% bCIs are above or below 0 for at least 0.5 s, respectively. Horizontal scale = 1 s. Vertical scale = 5 Z%ΔF/F0.
Figure 2—figure supplement 5

NBM-BLA GCaMP7s recording in cholinergic terminal fibers.
(A) Circles indicate NBM DIO-GCaMP7s injection sites for individual mice, 1 (red), 2 (blue). Triangles indicate estimated optical fiber tips based on adjacent slices for individual mice. 1 (red), 2 (blue). (B) Representative injection site coronal slice from Figure 2F with channels separated. Scale = 500 µm. (C) Representative fiber tip site coronal slice from Figure 2F with channels separated. Scale = 500 µm. (D) Increase in fluorescence (%ΔF/F0) following correct nose pokes is specific to the signal (465 nm, green) channel and is not observed in the reference channel (405 nm, tan). Data from Mouse 1 PT Day 4 as in Figure 2H. Mean ± SEM, n = 42. (E) Minimal increase in fluorescence (%ΔF/F0) following incorrect nose pokes. Signal (465 nm, gray) channel, reference channel (405 nm, tan). Data from Mouse 1 PT Day 4 as in Figure 2H. Downsampled mean ± SEM, n = 42 of 101. (F) Individual data for Mouse 2 as shown in Figure 2I. White horizontal line: acquisition threshold. (G) Mouse 1 combined action bCI plot for subset of days used in cohort averaged heatmap Figure 2J (from bottom to top: PT Day 1, PT Day 4, Early Training Day, Acquisition Day, Last Training Day, Last Extinction Day). Mean overlaid on 99% bCIs for tone onset, correct nose poke, and receptacle entry. Pink and blue significance bars under traces denote time points where 99% bCIs are above or below 0 for at least 0.5 s, respectively. Horizontal scale = 1 s. Vertical scale = 5 Z%ΔF/F0.
Figure 2—figure supplement 6
NBM-BLA GCaMP7s recording in cholinergic terminal fibers: incorrect nose pokes.
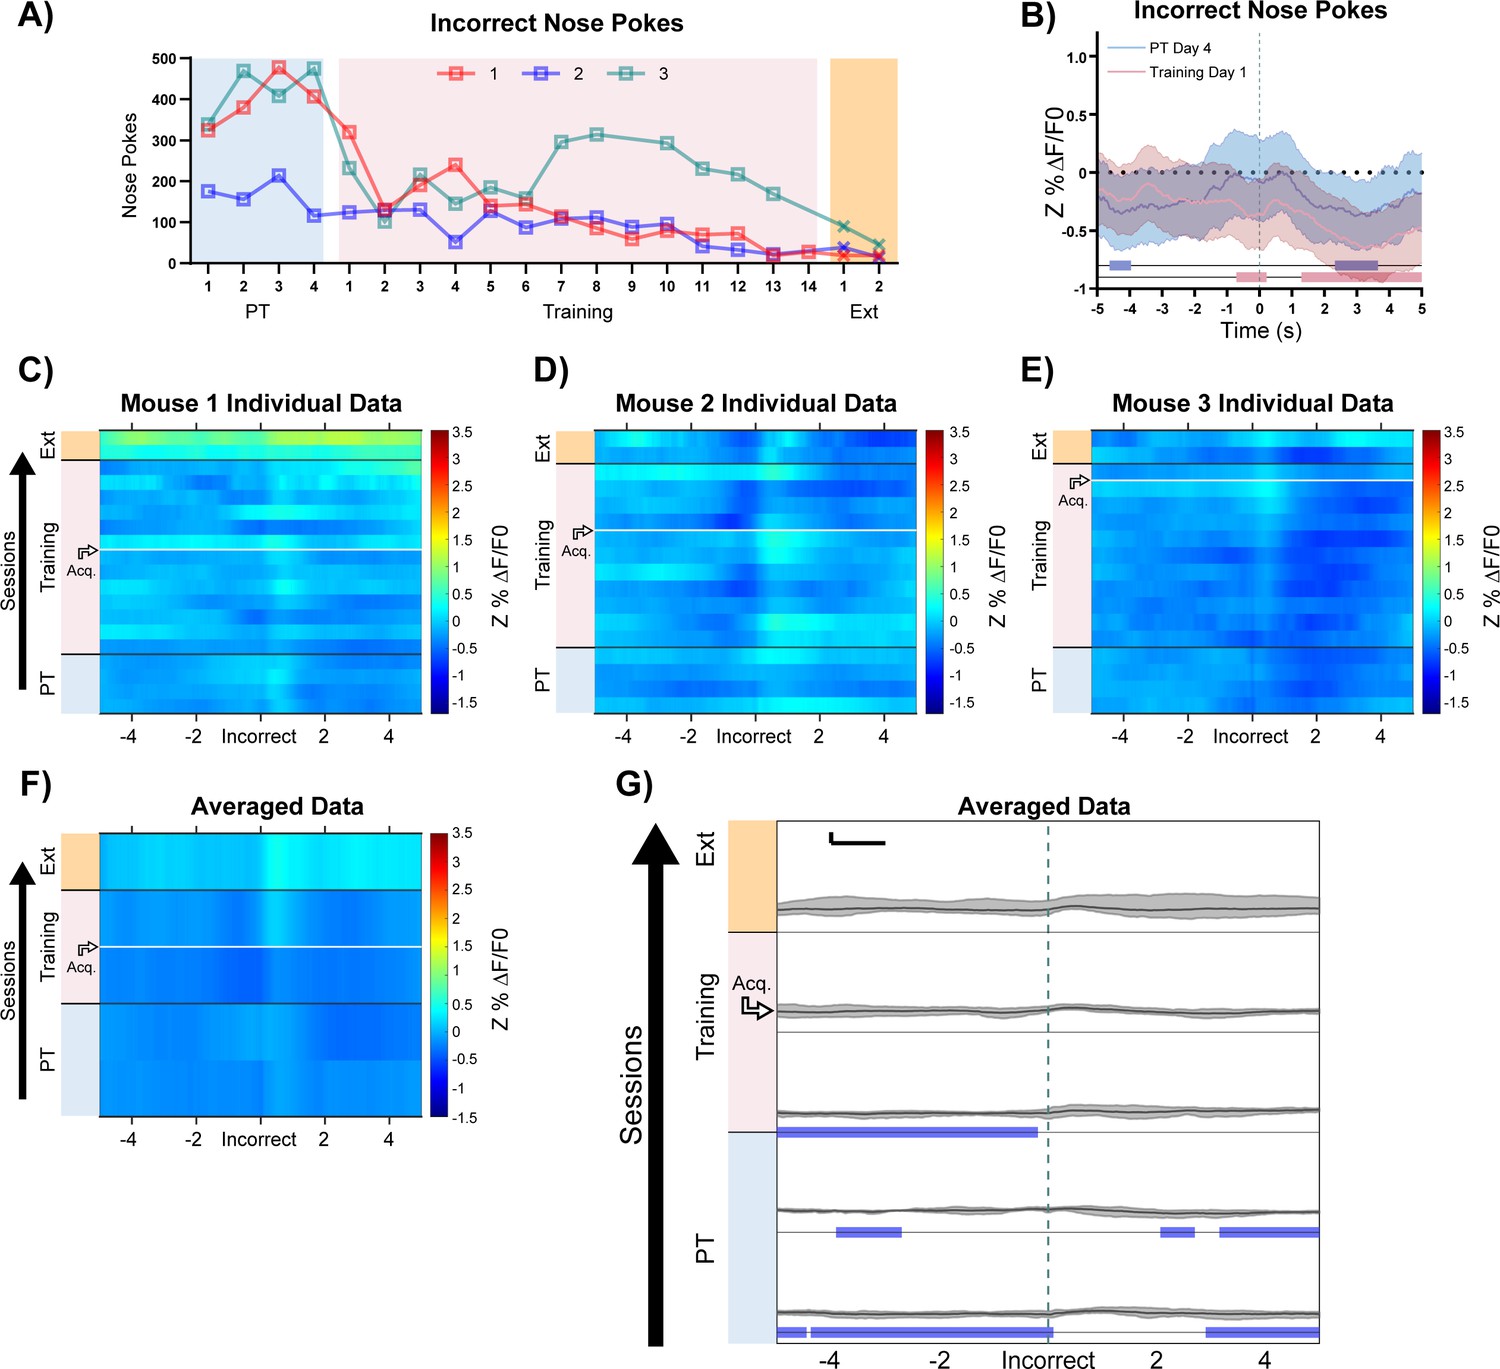
(A) Incorrect nose poking of individual mice throughout training. (B) Incorrect nose pokes that yield timeouts (downsampled Training Day 1, pink line, n = 42 of 105) result in a significant increase in NBM-BLA terminal fiber activity, but incorrect nose pokes before timeouts are introduced (downsampled PT Day 4, blue line, n = 42 of 101) do not. Data from Mouse 1 as in Figure 2H, mean Z%ΔF/F0 overlaid on bootstrapped 99% confidence intervals (99% bCIs). Shaded significance bars under traces represent time points where 99% bCIs do not contain 0 for at least 0.5 s. (C–D) Individual mouse heatmaps of NBM-BLA terminal fiber activity across all training phases, aligned to incorrect nose poke. Each row is the average of incorrect nose pokes that led to (or would have led to for PT) a timeout across a session. Horizontal white line: acquisition threshold, when a mouse began to earn 20 rewards consistently in Training. Black horizontal lines: divisions between training phases. (E) Heatmap of NBM-BLA terminal fiber activity during incorrect nose poke averaged across mice. Signal aligned as in (C-D) with a selection of data from key days in the behavioral paradigm shown. From bottom to top: PT Day 1, PT Day 4, Early Training Day, Acquisition Day (white horizontal line), Last Training Day, Last Extinction Day. Black horizontal lines: divisions between training phases.
Figure 2—figure supplement 7

NBM-BLA GCaMP7s recording in cholinergic terminal fibers replicate.
(A) Circles indicate NBM DIO-GCaMP7s injection sites for individual mice, 3 (teal), 4 (purple). Squares indicate optical fiber tips for individual mice, 3 (teal), 4 (purple). (B) Behavioral responses of mice during NBM-BLA recordings. Individual mice acquired the task at different rates as measured by rewards earned. White horizontal line: acquisition threshold, when a mouse began to earn 20 rewards consistently in Training. Incorrect nose pokes shown in Figure 2—figure supplement 8A. (C–D) Heatmaps of NBM-BLA terminal fiber activity in mice 3–4 across all training phases, aligned to tone onset (Tone), correct nose poke (NP), and receptacle entry (Rec). Each row is the average of rewarded trials across a training session. Horizontal white line: acquisition threshold, when a mouse began to earn 20 rewards consistently in Training. Black horizontal lines: divisions between training phases. Black vertical lines: divisions between breaks in time to allow for variable latencies in tone onset, correct nose poke, and receptacle entry (reward retrieval). Blanks in the heatmaps indicate time bins added for alignment. (E) Heatmap of NBM-BLA terminal fiber activity averaged across mice 3–4. Signal aligned as in (C-D) with a selection of key days shown, from bottom to top: PT Day 1, PT Day 4, Early Training, Acquisition Day (white horizontal line), Last Training Day, Last Extinction Day. Black horizontal lines: divisions between training phases. Black vertical lines: divisions between breaks in time to allow for variable latencies in tone onset, correct nose poke, and receptacle entry (reward retrieval). (F) Mouse 3 combined action bCI plot for subset of days used in cohort averaged heatmap (E). Mean overlaid on 99% bCIs for tone onset, correct nose poke, and receptacle entry. Pink and blue significance bars under traces denote time points where 99% bCIs are above or below 0 for at least 0.5 s, respectively. Horizontal scale = 1 s. Vertical scale = 5 Z%ΔF/F0. (G) Cohort (mice 1–4) averaged combined action bCI plot for subset of days used in (E-F). Trial level mean overlaid on 99% bCIs for tone onset, correct nose poke, and receptacle entry. Pink and blue significance bars under traces denote time points where 99% bCIs are above or below 0 for at least 0.5 s, respectively. Horizontal scale = 1 s. Vertical scale = 5 Z%ΔF/F0.
Figure 2—figure supplement 8

NBM-BLA GCaMP7s recording in cholinergic terminal fibers replicate: incorrect nose pokes.
(A) Incorrect nose poking of individual mice throughout training. (B–C) Individual mouse heatmaps of NBM-BLA terminal fiber activity across all training phases, aligned to incorrect nose poke. Each row is the average of incorrect nose pokes that led to (or would have led to for PT) a timeout across a session. Horizontal white line: acquisition threshold, when a mouse began to earn 20 rewards consistently in Training. Black horizontal lines: divisions between training phases. (D) Heatmap of NBM-BLA terminal fiber activity during incorrect nose poke averaged across mice 3–4. Signal aligned as in (B-C) with a selection of data from key days in the behavioral paradigm shown. From bottom to top: PT Day 1, PT Day 4, Early Training Day, Acquisition Day (white horizontal line), Last Training Day, Last Extinction Day. Black horizontal lines: divisions between training phases. (E) Cohort (mice 1–4) averaged bCI plot for subset of days used in (D). Trial level mean (downsampled to 20) overlaid on 99% bCIs for incorrect nose poke. Pink and blue significance bars under traces denote time points where 99% bCIs are above or below 0 for at least 0.5 s, respectively. As for other experiments measuring signal before and after incorrect nosepokes, it is unclear how to interpret the time points significantly below 0 pulled out by bootstrapping. As mentioned previously, this may be an artifact of the small signal across incorrect trials, although this remains to be investigated. Horizontal scale = 1 s. Vertical scale = 5 Z%ΔF/F0.
Figure 2—figure supplement 9

Simultaneous BLA ACh3.0 + GCaMP7s recording in NBM-BLA cholinergic terminal fibers.
(A) Left: DIO-jRCaMP1b was injected in the NBM of ChAT-IRES-Cre mice. Representative coronal brain slice showing jRCaMP1b expression. Yellow dashed lines: internal capsule and globus pallidus outlines. Scale = 500 µm. (White box: higher magnification area shown in B.) (B) Higher magnification of injection site. Scale = 100 µm. (C) Circle indicates NBM DIO-jRCaMP1b injection site for Mouse 1. (D) ACh3.0 was injected into the ipsilateral BLA and an optical fiber was implanted above the BLA. White dashed line: BLA outline. Scale = 500 µm. (E) Squares indicate optical fiber tips for individual mice. ACh3.0 + RCaMP (red), ACh3.0 + RCaMP sham (gray), (F) A substantial increase in both fluorescence representing BLA ACh release (green line) and NBM-BLA cholinergic terminal activity (magenta line) coincided with correct nose pokes on the last day of PT. Mean Z%ΔF/F0 overlaid on bootstrapped 99% confidence intervals (99% bCIs). Shaded significance bars under traces represent time points where 99% bCIs do not contain 0 for at least 0.5 s. n = 42. (G) Modest increase in fluorescence in both channels following incorrect nose pokes on the last day of PT. Mean Z%ΔF/F0 overlaid on bootstrapped 99% confidence intervals (99% bCIs). Shaded significance bars under traces represent time points where 99% bCIs do not contain 0 for at least 0.5 s. Downsampled n = 42 of 94. (H) jRCaMP1b signal is not simply crosstalk from ACh3.0 channel. A substantial increase in fluorescence representing BLA ACh release (green line) following correct nose pokes did not necessitate signal in RCaMP sham red channel (gray line). Last day of PT. Mean Z%ΔF/F0 overlaid on bootstrapped 99% confidence intervals (99% bCIs). Shaded significance bars under traces represent time points where 99% bCIs do not contain 0 for at least 0.5 s. n = 44. (I) Incorrect nose pokes on the last day of PT, as in G, for ACh3.0 + RCaMP sham mouse. Downsampled n = 44 of 135.
Figure 3 with 4 supplements
BLA CaMKIIα neuron activity aligns to reward retrieval and cue-reward learning.
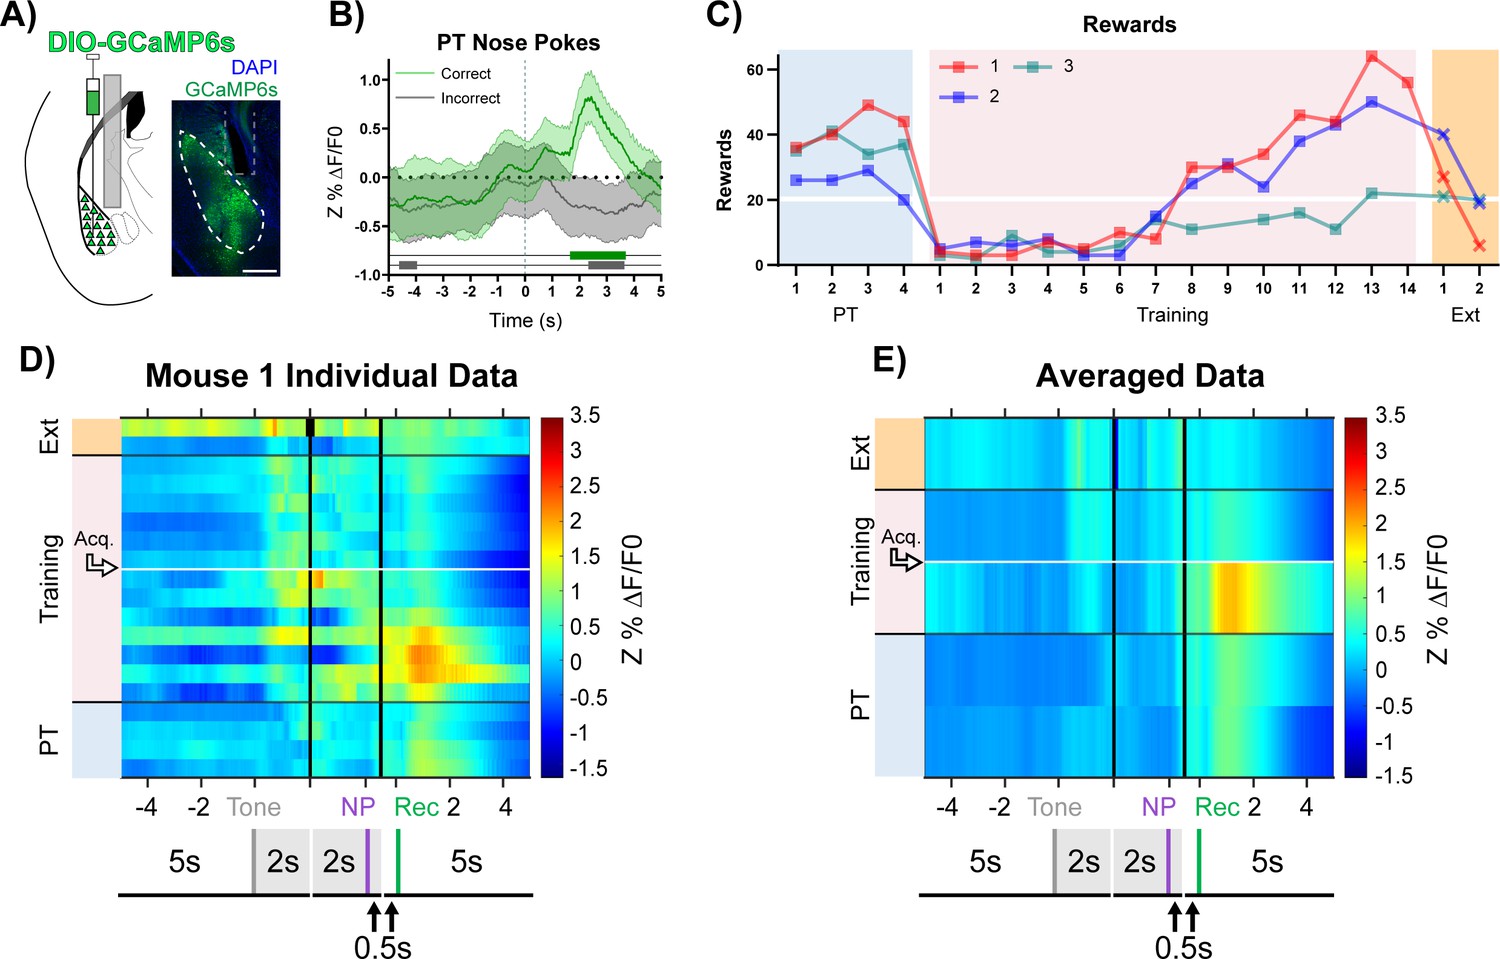
(A) Diagram and example of injection and fiber placement sites in the BLA for recording from CaMKIIα-Cre mice expressing a fluorescent calcium indicator (DIO-GCaMP6s). Left: Diagram of injection and fiber placement. Right: Representative coronal brain slice with fiber tip and GCaMP6s expression. White dashed line: BLA outline. Gray dashed rectangle: fiber tract. Blue: DAPI, Green: GCaMP6s. Scale 500 µm. Individual fiber placements are shown in Figure 3—figure supplement 1A. (B) Fluorescence traces from BLA of GCaMP6s-expressing CaMKIIα-Cre mice. On the last day PT (data shown for mouse 1), correct nose pokes (green line) were followed by a modest but significant rise in BLA CaMKIIα cell activity that increased steeply following receptacle entry (Figure 3—figure supplement 1B) while incorrect nose pokes (gray line) were followed by a modest decrease in activity. Mean Z%ΔF/F0 overlaid on bootstrapped 99% confidence intervals (99% bCIs). Shaded significance bars under traces represent time points where 99% bCIs do not contain 0 for at least 0.5 s. Correct: n = 44; downsampled incorrect: n = 44 of 141. Signal and reference channels (%ΔF/F0) during nose pokes are shown in Figure 3—figure supplement 1C–D. Incorrect nose pokes on the last day of PT versus Training Day 1 shown in Figure 3—figure supplement 2B. (C) Behavioral responses of CaMKIIα-Cre mice expressing GCaMP6s in BLA. Individual mice acquired the task at different rates as measured by rewards earned. Horizontal white line: acquisition threshold, when a mouse began to earn 20 rewards consistently in Training. Incorrect nose pokes shown in Figure 3—figure supplement 2A. (D) Heatmap of BLA CaMKIIα cell activity (Mouse 1) across all training phases, aligned to tone onset (Tone), correct nose poke (NP), and receptacle entry (Rec). Each row is the average of rewarded trials across a training session. White horizontal line: Day acquisition threshold met, as determined by rewards earned. Black horizontal lines: divisions between training phases. Black vertical lines: divisions between breaks in time to allow for variable latencies in tone onset, correct nose poke, and receptacle entry. Blanks in the heatmaps indicate time bins added for alignment. The bCI plot for Mouse 1 in Figure 3—figure supplement 1G. Individual heatmaps for mice 2–3 in Figure 3—figure supplement 1E–F. Incorrect nose pokes heatmaps for individual mice shown in Figure 3—figure supplement 2C–E. (E) Heatmap of BLA CaMKIIα cell activity averaged across mice. Signal aligned as in (D) with a selection of key days shown, from bottom to top: PT Day 1, PT Day 4, Early Training Day, Acquisition Day (white horizontal line), Last Extinction Day. The bCI plot for cohort averaged data in Figure 3—figure supplement 1H. Incorrect nose poke heatmaps averaged across mice shown in Figure 3—figure supplement 2F.
Figure 3—figure supplement 1
GCaMP6s recording in BLA CaMKIIα cells.
(A) Squares indicate optical fiber tips for individual mice. 1 (red), 2 (blue), 3 (teal). (B) Increase in fluorescence (Z%ΔF/F0) during the last day of PT (data shown for Mouse 1) aligns more closely to receptacle entry (reward retrieval) on rewarded trials. Mean ± SEM, n = 44. (C) Increase in fluorescence (%ΔF/F0) following correct nose pokes is specific to the signal (465 nm, green) channel and is not observed in the reference channel (405 nm, tan). Mirroring in reference channel following correct nose poke is likely due to a change in the pool of unbound sensor, because data are not acquired at the ‘true’ isosbestic point of GCaMP (Barnett et al., 2017; Kim et al., 2016a; Sych et al., 2019). Data from Mouse 1, PT Day 4 as in Figure 3B. Mean ± SEM, n = 44. (D) Decrease in fluorescence (%ΔF/F0) following incorrect nose pokes is seen in signal channel (465 nm, gray) but not reference channel (405 nm, tan). Data from Mouse 1, PT Day 4 as in Figure 3B. Downsampled mean ± SEM, n = 44 of 141. (E–F) Individual data for mice not shown in Figure 3D. White horizontal line: acquisition threshold. (G) Mouse 1 combined action bCI plot for subset of days used in cohort averaged heatmap Figure 3E (from bottom to top: PT Day 1, PT Day 4, Early Training Day, Acquisition Day, Last Extinction Day). Mean overlaid on 99% bCIs for tone onset, correct nose poke, and receptacle entry. Pink and blue significance bars under traces denote time points where 99% bCIs are above or below 0 for at least 0.5 s, respectively. Horizontal scale = 1 s. Vertical scale = 1 Z%ΔF/F0. (H) Cohort averaged combined action bCI plot for subset of days used in cohort averaged heatmap Figure 3E. Trial level mean overlaid on 99% bCIs for tone onset, correct nose poke, and receptacle entry. Pink and blue significance bars under traces denote time points where 99% bCIs are above or below 0 for at least 0.5 s, respectively. Horizontal scale = 1 s. Vertical scale = 1 Z%ΔF/F0.
Figure 3—figure supplement 2
GCaMP6s recording in BLA CaMKIIα cells: incorrect nose pokes.
(A) Incorrect nose pokes of individual mice throughout training. (B) Both incorrect nose pokes that yield timeouts (downsampled Training Day 1, pink line, n = 44 of 124) and incorrect nose pokes before timeouts are introduced (downsampled PT Day 4, blue line, n = 44 of 141) result in a modest decrease in BLA CaMKIIα neuron activity. Data from Mouse 1 as in Figure 3B, mean Z%ΔF/F0 overlaid on bootstrapped 99% confidence intervals (99% bCIs). Shaded significance bars under traces represent time points where 99% bCIs do not contain 0 for at least 0.5 s. (C–E) Individual mouse heatmaps of BLA CaMKIIα neuron activity across all training phases, aligned to incorrect nose poke. Each row is the average of incorrect nose pokes that led to (or would have led to for PT) a timeout across a session. Horizontal white line: acquisition threshold, when a mouse began to earn ~20 rewards consistently in Training. Black horizontal lines: divisions between training phases. (F) Heatmap of BLA CaMKIIα neuron activity during incorrect nose poke averaged across mice. Signal aligned as in (C-E) with a selection of data from key days in the behavioral paradigm shown. From bottom to top: PT Day 1, PT Day 4, Early Training Day, Acquisition Day (white horizontal line), Last Extinction Day. (G) Cohort averaged bCI plot for subset of days used in (F). Trial level mean (downsampled to 20) overlaid on 99% bCIs for incorrect nose poke. Pink and blue significance bars under traces denote time points where 99% bCIs are above or below 0 for at least 0.5 s, respectively. It is unclear how to interpret the substantial number of time points significantly below 0 before and after incorrect nose pokes and may be an artifact. Horizontal scale = 1 s. Vertical scale = 1 Z%ΔF/F0.
Figure 3—figure supplement 3

GCaMP6s recording in BLA CaMKIIα replicate.
(A) Squares indicate optical fiber tips for individual mice. 4 (purple), 5 (orange), 6 (cyan), 7 (brown). (B) Behavioral responses of mice during BLA CaMKIIα GCaMP6s recordings. Individual mice acquired the task at different rates as measured by rewards earned. White horizontal line: acquisition threshold, when a mouse began to earn 20 rewards consistently in Training. Incorrect nose pokes shown in Figure 3—figure supplement 4A. (C–F) Heatmaps of BLA CaMKIIα cell activity in mice 4–7 across all training phases, aligned to tone onset (Tone), correct nose poke (NP), and receptacle entry (Rec). Each row is the average of rewarded trials across a training session. Horizontal white line: acquisition threshold, when a mouse began to earn 20 rewards consistently in Training. Black horizontal lines: divisions between training phases. Black vertical lines: divisions between breaks in time to allow for variable latencies in tone onset, correct nose poke, and receptacle entry (reward retrieval). Blanks in the heatmaps indicate time bins added for alignment. (G) Mouse 4 combined action bCI plot for subset of days, from bottom to top: PT Day 1, PT Day 4, Early Training Day, Acquisition Day, Last Training Day, Last Extinction Day. Mean overlaid on 99% bCIs for tone onset, correct nose poke, and receptacle entry. Pink and blue significance bars under traces denote time points where 99% bCIs are above or below 0 for at least 0.5 s, respectively. Horizontal scale = 1 s. Vertical scale = 5 Z%ΔF/F0.
Figure 3—figure supplement 4
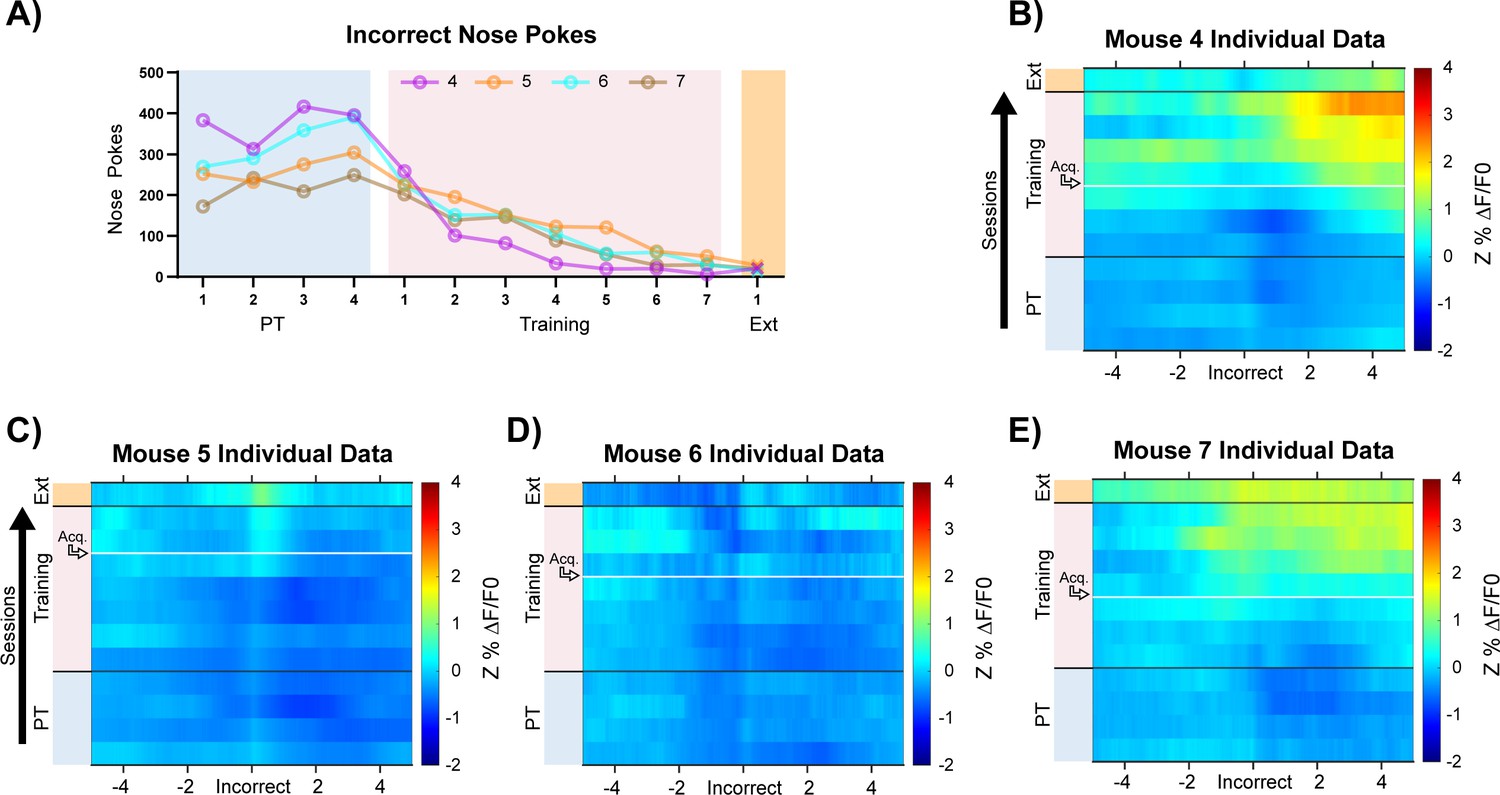
GCaMP6s recording in BLA CaMKIIα replicate: incorrect nose pokes.
(A) Incorrect nose poking of individual mice throughout training. (B–E) Individual mouse heatmaps of BLA CaMKIIα cell activity across all training phases, aligned to incorrect nose poke. Each row is the average of incorrect nose pokes that led to (or would have led to for PT) a timeout across a session. Horizontal white line: acquisition threshold, when a mouse began to earn 20 rewards consistently in Training. Black horizontal lines: divisions between training phases.
Figure 4 with 5 supplements
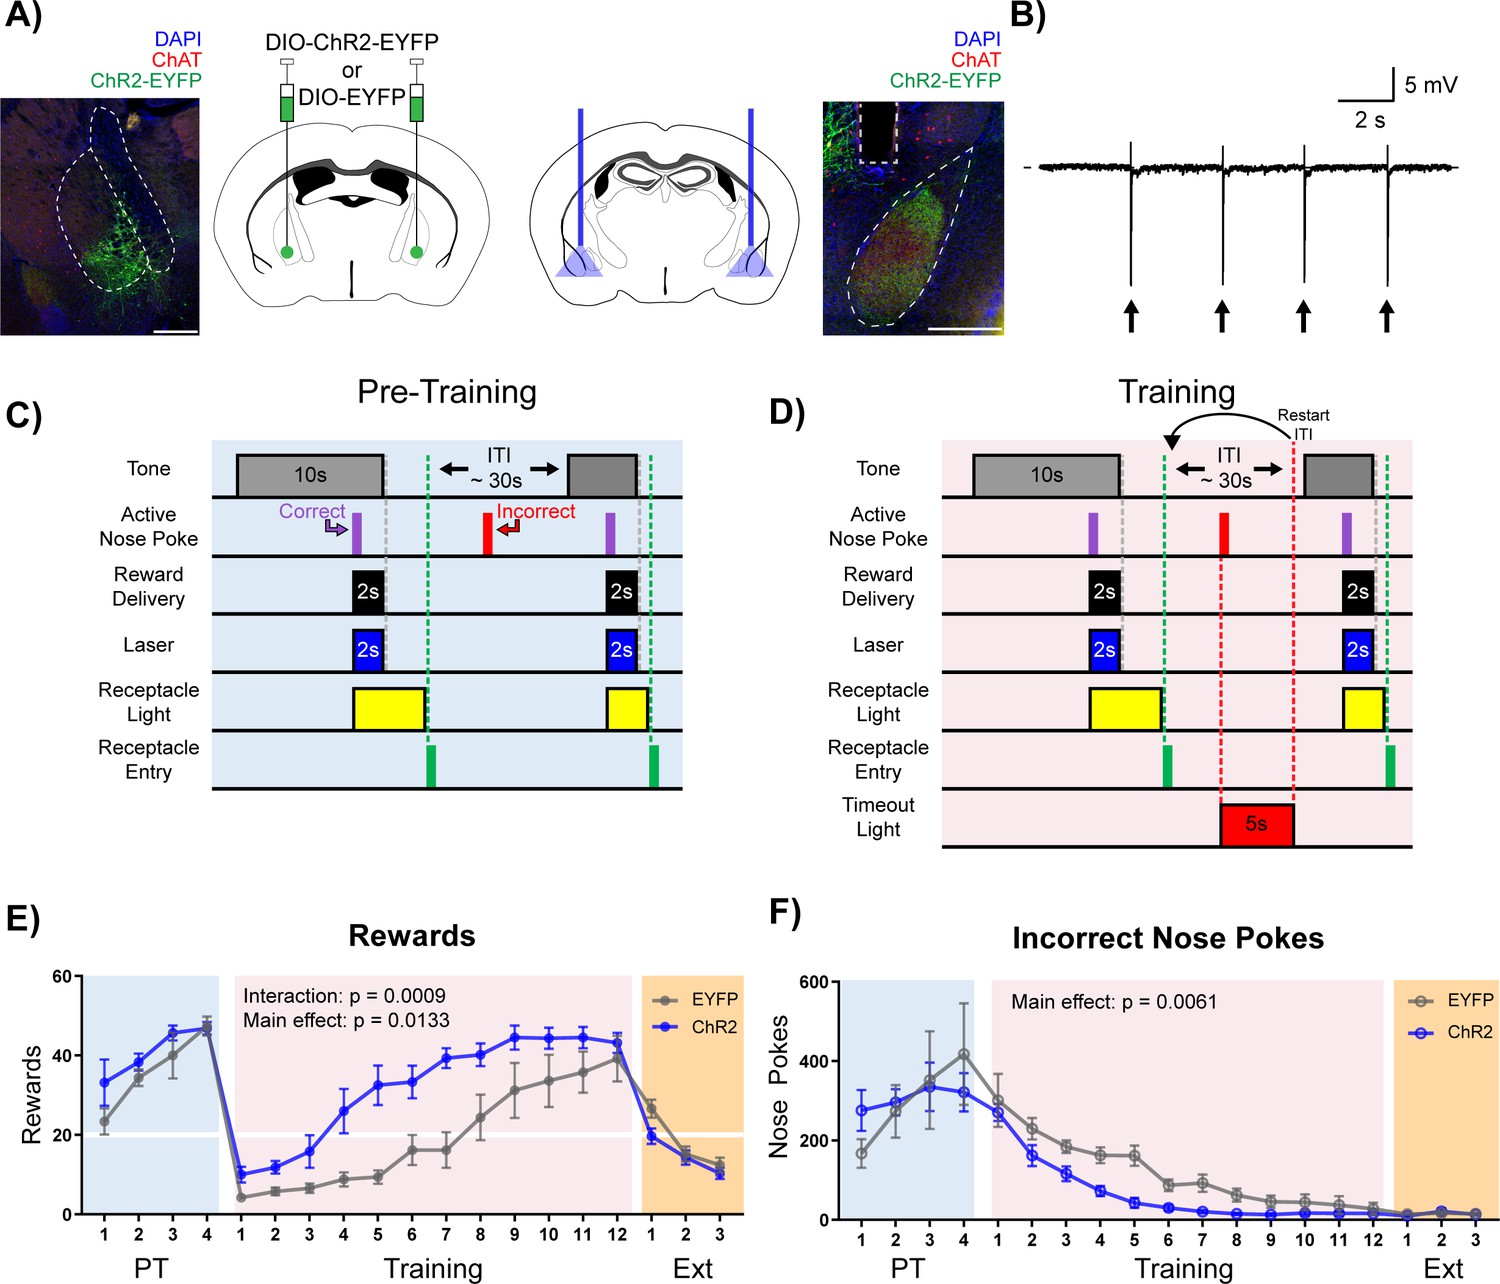
Stimulation of cholinergic terminal fibers in the BLA enhances cue-reward learning.
(A) Schematic of optical stimulation of ChAT+ terminal fibers projecting to the BLA. Left: Bilateral AAV injection into the NBM of ChAT-IRES-Cre mice to gain optical control over ChAT+ NBM cells and representative coronal brain slice showing ChR2-EYFP expression. White dashed lines: internal capsule and globus pallidus outlines. Blue: DAPI, red: ChAT, green: ChR2-EYFP. Scale: 500 µm, individual injection sites shown in Figure 4—figure supplement 1A and separate channels shown in Figure 4—figure supplement 1B. Right: Bilateral optical fiber implantation above BLA to stimulate BLA-projecting ChAT+ NBM cells. Representative coronal brain slice showing ChR2-EFYP expression and fiber tip placement. Gray dashed rectangle: fiber tract. White dashed: BLA outline. Blue: DAPI, red: ChAT, green: ChR2-EYFP. Scale: 500 µm, individual fiber tip placements shown in Figure 4—figure supplement 1C and separate channels shown in Figure 4—figure supplement 1D. Injection sites and fiber tip placements for males from Figure 4—figure supplement 3C–F shown in Figure 4—figure supplement 4A–B. (B) Optical stimulation validation via local field potential recordings. Extracellular recording of action potentials induced by optical stimulation of ChAT+ NBM cells expressing ChR2. Arrows indicate 60 ms laser pulse. (C–D) Details of the Cue-Reward Learning Paradigm (C) During Pre-Training, auditory tones were presented on a variable interval 30 schedule (VI30), during which an active nose poke (correct) yielded Ensure reward delivery and 2 s of optical stimulation but there was no consequence for incorrect nose pokes (active nose pokes not during tone). (D) Training was identical to Pre-Training, except incorrect nose pokes resulted in a 5 s timeout, signaled by house light illumination, followed by a restarting of the ITI. (E) Behavioral performance in a cue-reward learning task improves with optical stimulation of ChAT+ fibers in BLA. EYFP- and ChR2-expressing mice earn similar numbers of rewards during PT (blue shaded region). ChR2-expressing mice more rapidly earn significantly more rewards than EYFP-expressing mice during Training (pink shaded region). No significant differences were observed during extinction training (orange shaded region). Horizontal white line: acquisition threshold, when a mouse began to earn ~20 rewards consistently in Training. Mean ± SEM, EYFP: n = 5, ChR2: n = 6. Individual data are shown in Figure 4—figure supplement 3A. Data for males shown in Figure 4—figure supplement 3C,E. (F) EYFP- and ChR2-expressing mice made similar numbers of incorrect nose pokes during Pre-Training. ChR2-epxressing mice made significantly fewer incorrect nose pokes than EYFP-expressing mice in Training. No significant differences were observed during extinction training. Mean ± SEM, EYFP: n = 5, ChR2: n = 6. Individual data are shown in Figure 4—figure supplement 3B. Data for males shown in Figure 4—figure supplement 3D,F. Additional behavioral assays shown in Figure 4—figure supplement 5A–F.
Figure 4—figure supplement 1

Injection sites and optical fiber placements.
(A) Circles indicate NBM injection sites for individual mice, EYFP (green) and ChR2 (blue). Anterior/Posterior position relative to Bregma indicated. (B) Representative injection site coronal slice from Figure 4A with channels separated. Scale = 500 µm. (C) Squares indicate observable optical fiber tips for individual mice, EYFP- (green) and ChR2-expressing mice (blue). Triangles indicate estimated optical fiber tips based on adjacent slices. Anterior/Posterior position relative to Bregma indicated. (D) Representative fiber tip site coronal slice from Figure 4A with channels separated. Scale = 500.
Figure 4—figure supplement 2
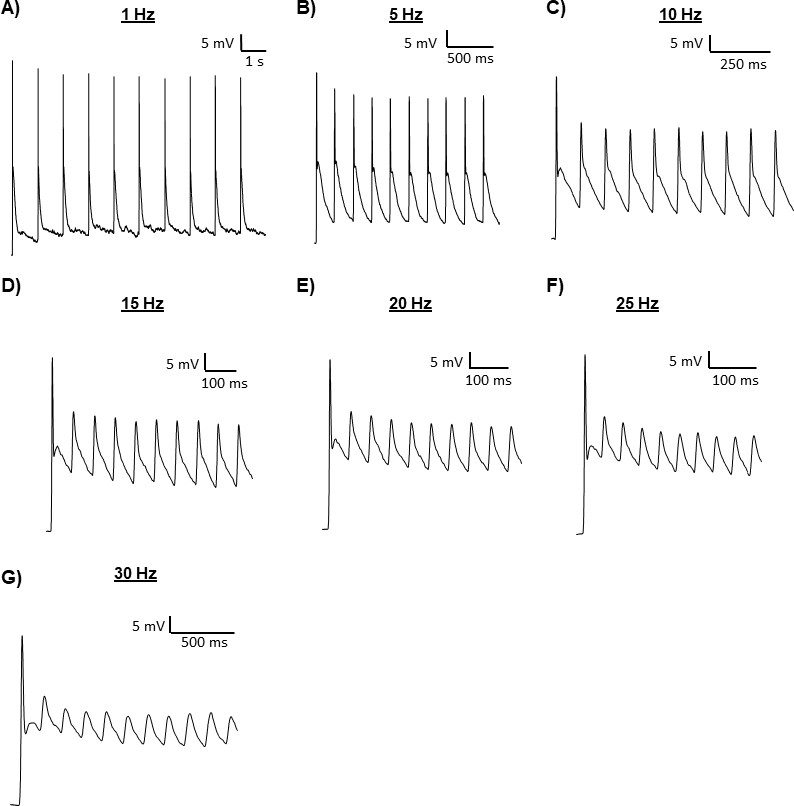
Ex vivo electrophysiology.
(A–G) Current clamp recordings of ChAT+ NBM cells expressing ChR2. Optical stimulation was delivered at the indicated frequency.
Figure 4—figure supplement 3
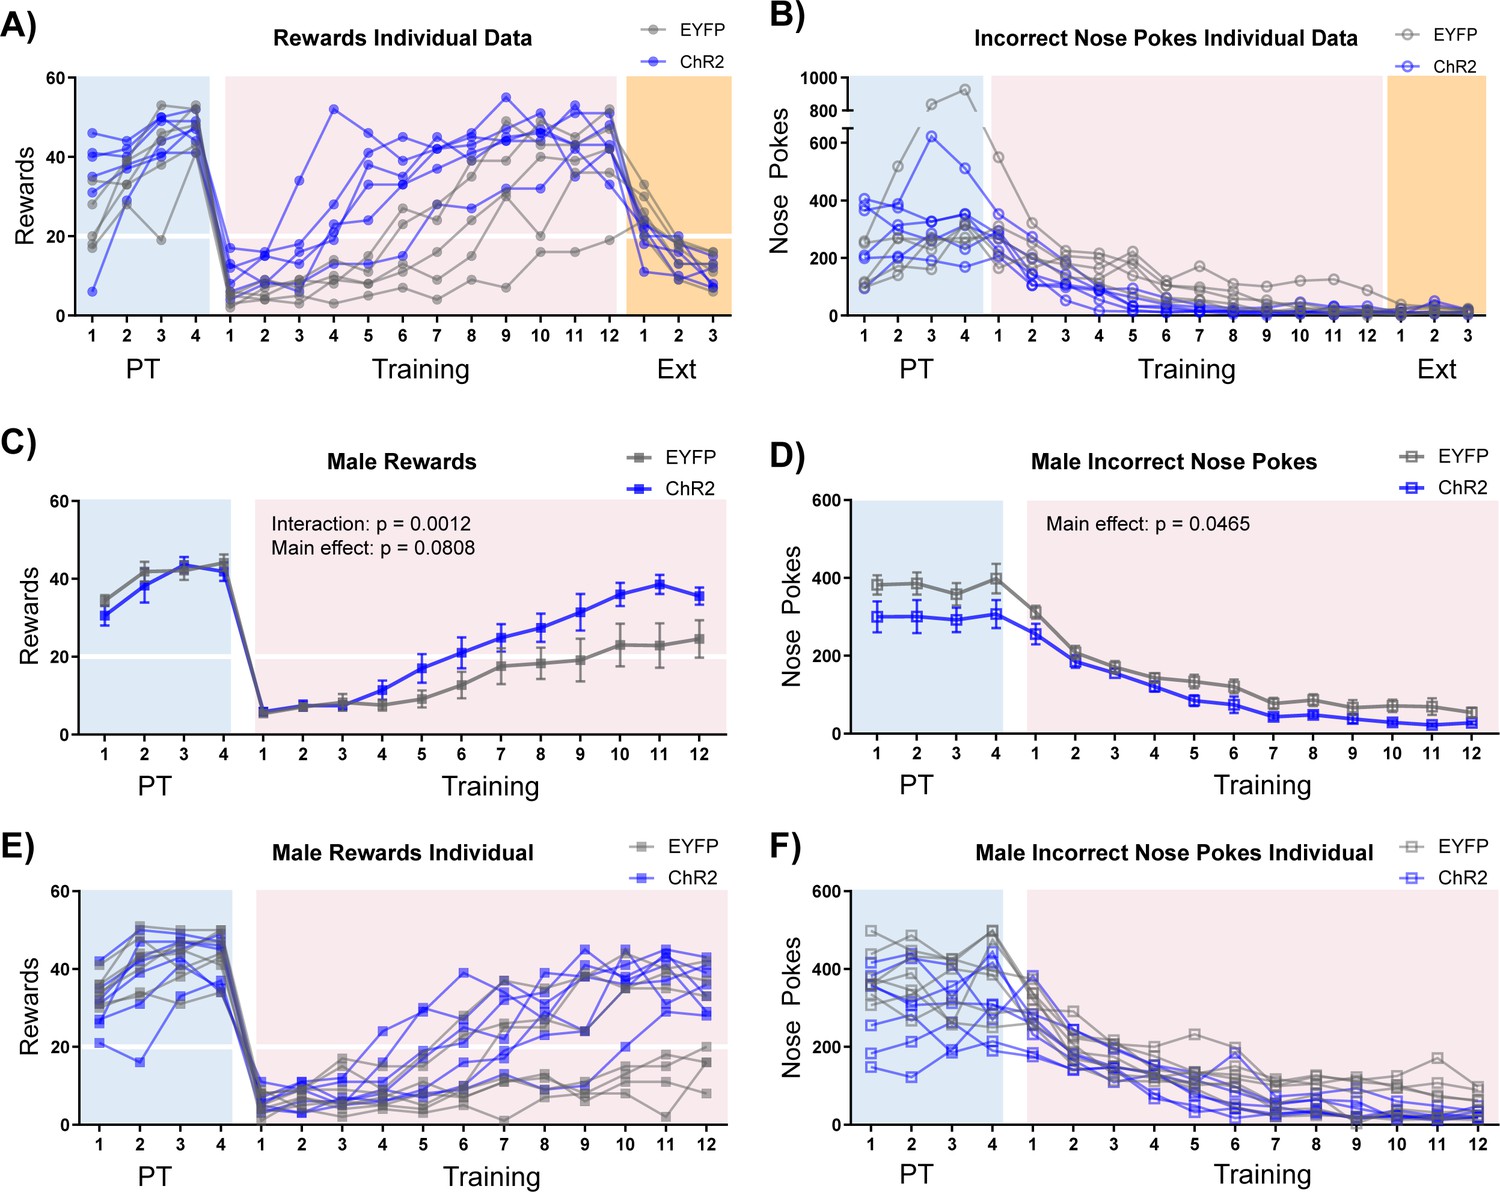
Individual behavioral data and male cohort.
(A) Rewards earned for individual mice from Figure 4E. Horizontal white line: acquisition threshold, when a mouse began to earn ~20 rewards consistently in Training. (B) Incorrect nose pokes for individual mice from Figure 4F. (C) Optical stimulation of ChAT+ NBM-BLA terminal fibers (ChR2-expressing mice, blue squares) had a similar effect on rewards earned during Training in male mice compared to female mice. Mean ± SEM, EYFP: n = 7, ChR2: n = 7. Horizontal white line: acquisition threshold, when a mouse began to earn ~20 rewards consistently in Training. (D) Optical stimulation of ChAT+ NBM-BLA terminal fibers (ChR2-expressing mice, blue squares) had a similar effect on incorrect nose pokes during Training in male mice compared to female mice. Mean ± SEM, EYFP: n = 7, ChR2: n = 7. (E) Individual data for graph shown in C. (F) Individual data for graph shown in D.
Figure 4—figure supplement 4

Injection sites and optical fiber placements.
(A) Circles indicate NBM injection sites for individual mice, EYFP- (green), and ChR2-expressing mice (blue). Anterior/Posterior position relative to Bregma indicated. (B) Squares indicate observable optical fiber tips for individual mice, EYFP- (green), and ChR2-expressing mice (blue). Triangles indicate estimated site of optical fiber tips based on adjacent slices. Anterior/Posterior position relative to Bregma indicated.
Figure 4—figure supplement 5

Additional behavioral assays with NBM-BLA optical stimulation.
(A) Stimulation of ChAT+ NBM-BLA terminal fibers did not support self-stimulation. Mice were allowed to nose poke for 2 s of stimulation in the Training paradigm. Data for female mice from Figure 4, Figure 4—figure supplement 1, Figure 4—figure supplement 3A–B. (B) Stimulation of ChAT+ NBM-BLA terminal fibers did not support real time place preference. Mice were allowed to move freely between two sides of an empty cage with distinct floor contexts for 15 min. Data are reported as percent time spent on the laser-paired side. Closed circles: Mean ± SEM, open circles: data for individual mice. Data for female mice from Figure 4, Figure 4—figure supplement 1, Figure 4—figure supplement 3A–B. (C) Stimulation of ChAT+ NBM-BLA terminal fibers during a progressive ratio test did not affect active nose poking. Closed squares: Mean ± SEM, open squares: individual mice. Data for male mice from Figure 4—figure supplement 3C–F + 4. (D) There were no differences between EYFP- and ChR2-expressing mice in locomotor activity. X-axis ticks = 5 min bins, Laser = 5 min of 20 s on/off optical stimulation. Closed circles: Mean ± SEM, open circles: data for individual mice. Data for female mice from Figure 4, Figure 4—figure supplement 1, Figure 4—figure supplement 3A–B. (E–F) No difference in behavior was seen between EYFP- and ChR2-expressing mice on any measures in the Light/Dark Box Test. Data for female mice from Figure 4, Figure 4—figure supplement 1, Figure 4—figure supplement 3A–B.
Figure 5 with 1 supplement
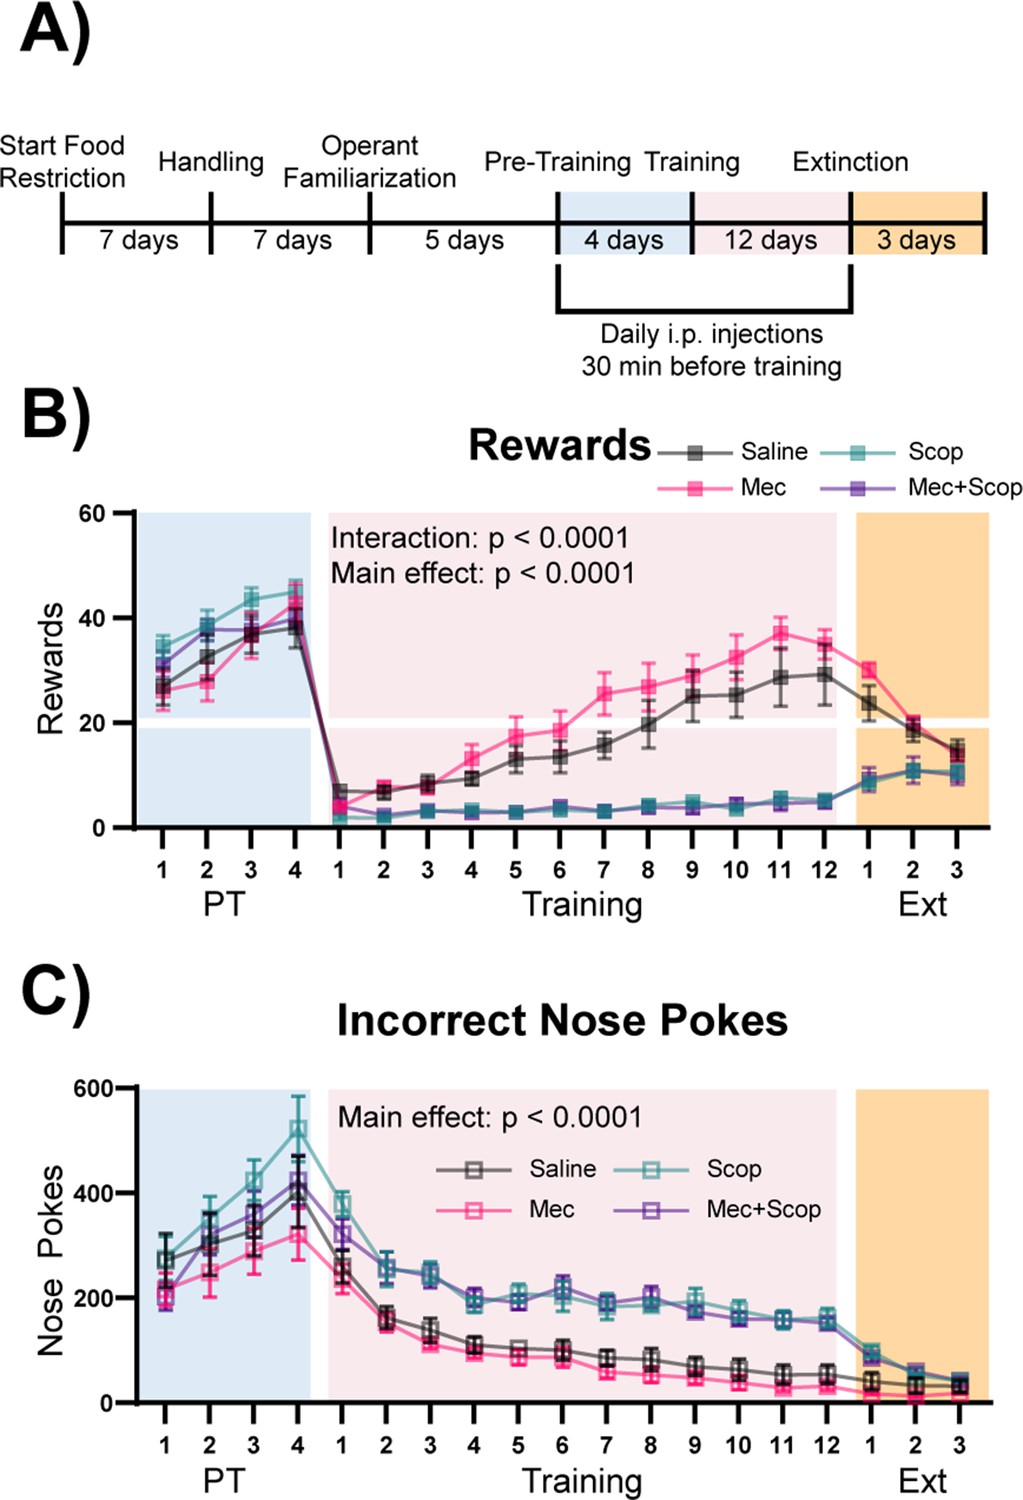
Muscarinic, but not nicotinic, ACh receptor antagonism prevents learning of a cue-reward contingency.
(A) Timeline of drug administration. Saline or ACh receptor (AChR) antagonists were delivered i.p., 30 min before PT and Training sessions, the same phases of the task as optical stimulation in Figure 4. (B) Behavioral performance of mice administered AChR antagonists. AChR antagonists had no significant effect on rewards earned during Pre-Training. Muscarinic AChR antagonism (Scop and Mec+Scop) resulted in significantly fewer rewards earned during Training. There was no significant difference between saline controls and those receiving the nicotinic AChR antagonist (Mec) during Training and mice extinguished responding at similar rates. Mean ± SEM Saline (n = 8), Mec (n = 9), Scop (n = 8), Mec+Scop (n = 9). Horizontal white line: acquisition threshold, when a mouse began to earn ~20 rewards consistently in Training. Individual data are shown in Figure 5—figure supplement 1A. (C) Incorrect nose pokes. Incorrect nose poking was not affected by AChR antagonism during PT but Scop- and Scop+Mec-treated mice maintained high levels of incorrect nose pokes compared to Saline- and Mec-treated mice throughout Training. Mean ± SEM, Saline (n = 8), Mec (n = 9), Scop (n = 8), or Mec+Scop (n = 9). Individual data are shown in Figure 5—figure supplement 1B. AChR antagonist locomotor test shown in Figure 5—figure supplement 1C.
Figure 5—figure supplement 1
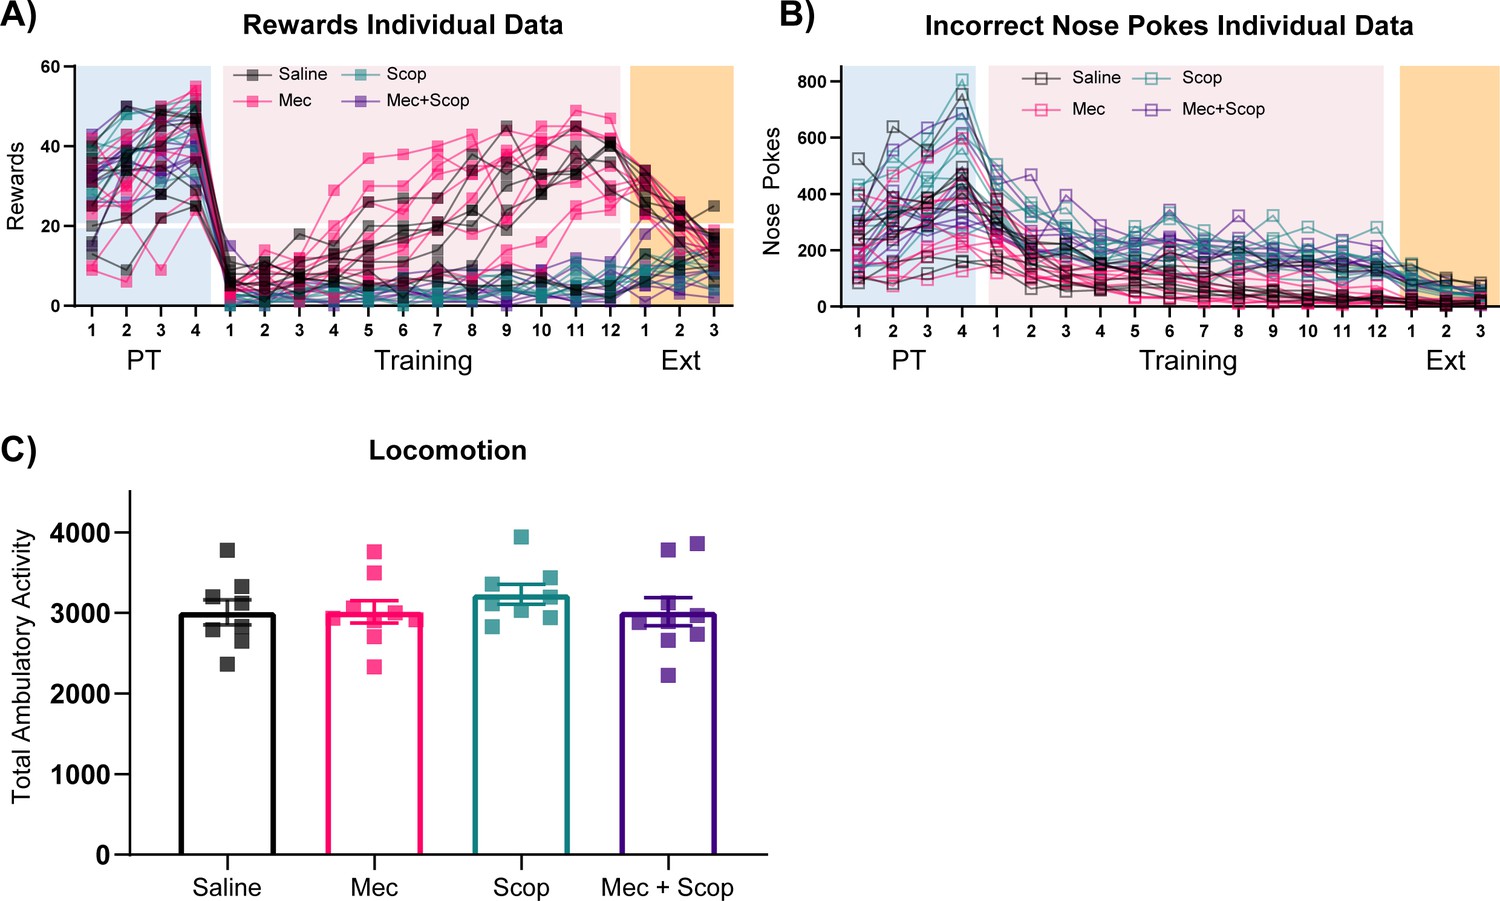
Individual behavioral data and locomotion.
Figure 6 with 2 supplements
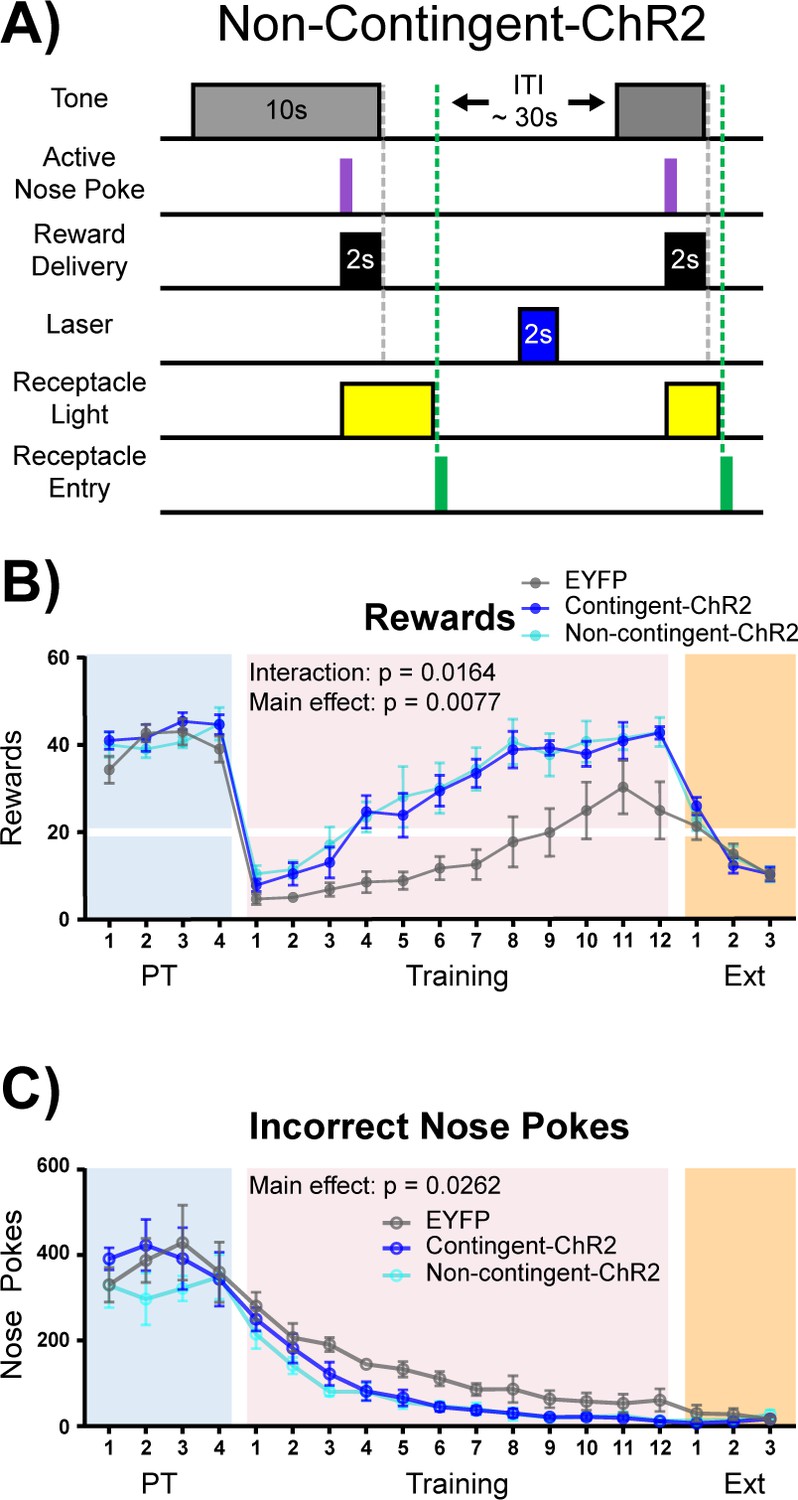
Non-contingent stimulation of cholinergic NBM-BLA terminals is sufficient to enhance cue-reward learning.
(A) Experimental details of laser stimulation in non-contingent-ChR2 mice. Non-contingent-ChR2-expressing mice received the same number of light stimulations as contingent-ChR2-expressing mice, but stimulation was only given during the ITI, when non-contingent mice had not made a response within 2 s. Injection sites and fiber placements are shown in Figure 6—figure supplement 1A–B. (B) Non-contingent NBM-BLA optical stimulation also improves behavioral performance in cue-reward learning task. There was no significant difference in the number of rewards earned between EYFP (n = 6), contingent-ChR2 (n = 5), or non-contingent-ChR2 (n = 5) mice during Pre-Training. Contingent- and non-contingent-ChR2-expressing mice more rapidly earned significantly more rewards during Training than EYFP-expressing mice. No differences were observed between groups during extinction training. Mean ± SEM EYFP: n = 6, contingent-ChR2: n = 5, non-contingent-ChR2: n = 5. Horizontal white line: acquisition threshold, when a mouse began to earn 20 rewards consistently in Training. Individual data are shown in Figure 6—figure supplement 2A. (C) Incorrect nose pokes. There was no significant difference in the number of incorrect nose pokes between groups during Pre-Training. Contingent- and non-contingent-ChR2-expressing mice made significantly fewer incorrect nose pokes during Training than EYFP-expressing mice. No differences between groups were observed during extinction training. Mean ± SEM EYFP: n = 6, contingent-ChR2: n = 5, non-contingent: n = 5. Individual data are shown in Figure 6—figure supplement 2B.
Figure 6—figure supplement 1

Injection sites and optical fiber placements.
(A) Circles indicate NBM injection sites for individual mice, EYFP-expressing (green), contingent-ChR2-expressing (blue), and non-contingent-ChR2-expressing mice (cyan). Anterior/Posterior position relative to Bregma indicated. (B) Squares indicate observable optical fiber tips for individual mice, EYFP-expressing (green), contingent-ChR2-expressing (blue), and non-contingent-ChR2-expressing mice (cyan). Triangles indicate estimated site of optical fiber tips based on adjacent slices. Anterior/Posterior position relative to Bregma indicated.
Figure 6—figure supplement 2
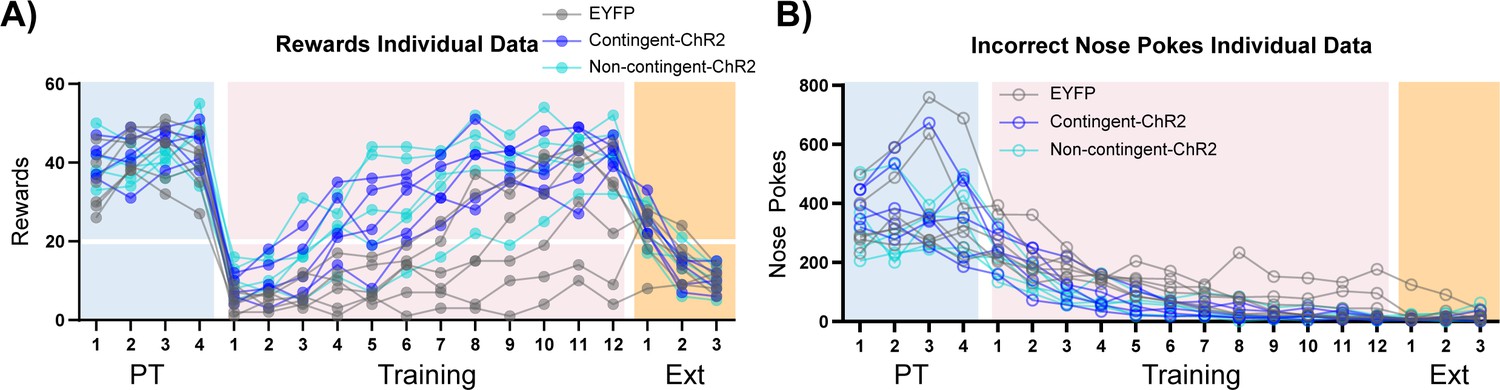
Individual behavioral data.
Author response image 1
Tables
Key resources table
| Reagent type (species) or resource | Designation | Source or reference | Identifiers | Additional information |
|---|---|---|---|---|
| Genetic reagent (M. musculus) | B6;129S6-Chattm2(cre)Lowl/J | Jackson Laboratory | Stock #: 006410 RRID:IMSR_JAX:006410 | |
| Genetic reagent (M. musculus) | C57BL/6J | Jackson Laboratory | Stock #: 000664 RRID:IMSR_JAX:000664 | |
| Genetic reagent (M. musculus) | Tg(Camk2a-cre)2Gsc | Günter Schütz, German Cancer Research Center | RRID:MGI:4457404 | Casanova et al., 2001; Wohleb et al., 2016 |
| Antibody | Anti-ChAT (goat polyclonal) | Millipore Sigma | Cat #: AB144P RRID:AB_2079751 | (1:1000) |
| Antibody | Anti-GFP (chicken, polyclonal) | Thermo Fisher Scientific | Cat #: A10262, RRID:AB_2534023 | (1:1000) |
| Antibody | Anti-DsRed (rabbit, monoclonal) | Takara Bio | Cat #: 632392, RRID:AB_2801258 | (1:1000) |
| Antibody | Donkey anti-chicken 488 (secondary) | Jackson ImmunoResearch | Cat #: 703-545-155, RRID:AB_2340375 | (1:1000) |
| Antibody | Donkey anti-rabbit 555 (secondary) | Thermo Fisher Scientific | Cat #: A-31572, RRID:AB_162543 | (1:1000) |
| Antibody | Donkey anti-goat 555 (secondary) | Thermo Fisher Scientific | Cat #: A-21432, RRID:AB_141788 | (1:1000) |
| Antibody | Donkey anti-goat 647 (secondary) | Thermo Fisher Scientific | Cat #: A-21447, RRID:AB_141844 | (1:1000) |
| Recombinant DNA reagent | AAV9 hSyn-ACh3.0 | Yulong Li Jing et al., 2018;Jing et al., 2019 | Cat #: YL10002-AV9 | |
| Recombinant DNA reagent | AAV1 Syn-FLEX-GCaMP6s-WPRE-SV40 | Addgene | Cat #: 100845-AAV1 RRID:Addgene_100845 | |
| Recombinant DNA reagent | AAV1-Syn-FLEX-jGCaMP7s-WPRE | Addgene | Cat #: 104491-AAV1 RRID:Addgene_104491 | |
| Recombinant DNA reagent | AAV1 Syn-FLEX-NES-jRCaMP1b-WPRE-SV40 | Addgene | Cat #: 100850-AAV1 RRID:Addgene_100850 | |
| Recombinant DNA reagent | AAV2 EF1a-DIO-EYFP | UNC Viral Vector Core | RRID:SCR_002448 | |
| Recombinant DNA reagent | AAV2 EF1a-DIO-hChR2(H134R)-EYFP | UNC Viral Vector Core | RRID:SCR_002448 | |
| Chemical compound, drug | Mecamylamine hydrochloride | Millipore Sigma | Cat #: M9020 | |
| Chemical compound, drug | (-) Scopolamine hydrochloride | Millipore Sigma | Cat #: S1013 | |
| Software, algorithm | MATLAB | MathWorks | RRID:SCR_001622 | Version 2020a |
| Software, algorithm | GraphPad Prism 8 | GraphPad Software | RRID:SCR_002798 | |
| Software, algorithm | EthoVision XT 10 | Noldus | RRID:SCR_000441 | |
| Software, algorithm | FV10-ASW | Olympus | RRID:SCR_014215 | Version 04.02.03.06 |
| Software, algorithm | Doric Neuroscience Studio | Doric Lenses | Version 5.3.3.14 | |
| Software, algorithm | MED-PC IV | Med Associates Inc | RRID:SCR_012156 | |
| Other | Allen Reference Atlas | Lein et al., 2007 | RRID:SCR_013286 | |
| Other | DAPI stain | Thermo Fisher Scientific | Cat #: 62248 | 1:1000 |
Additional files
-
Supplementary file 1
Number of mice that acquired the reward learning behavior, number that were excluded, and any training deviations.
(A) Mice in the initial BLA ACh3.0 group were trained outside of the sound attenuating chambers. These mice had 5 dof Pre-Training because they were trained concurrently with another cohort of mice (not shown) that required an extra day to reach two consecutive days of 20 rewards earned and were advanced to a VI 20 schedule of reinforcement during Training after 9 d to promote responding. Training was extended to allow all mice to acquire. Due to time constraints during acquisition, Mouse 3 in this cohort was moved to Extinction after 20 d of Training because it had acquired earlier, was earning the most rewards, and we wanted to record more extinction days. (B) Mice in the BLA ACh3.0 and NBM-BLA terminal fiber replicate experiments were advanced to 1 d of Extinction after only 7 d of Training due to the COVID-19 shutdown. (C) BLA ACh3.0 and NBM-BLA terminal fiber jRCaMP1b mice were analyzed as dual channel mice just through Pre-Training and were instead used as replicates of the BLA ACh3.0 experiment. One of the mice had apparatus errors during Training and had to be excluded. (D) Mice in the initial BLA CaMKIIα GCaMP6 were trained outside of the sound attenuating chambers. Mouse 1 progressed from Pre-Training to Training a day earlier than the rest of the group and was able to have an extra day of Training before the 2 d of Extinction. Mice in this group were advanced to a VI 20 schedule of reinforcement during Training after 6–7 d to promote responding. Training was extended to allow more mice to acquire.
- https://cdn.elifesciences.org/articles/57335/elife-57335-supp1-v3.xlsx
-
Transparent reporting form
- https://cdn.elifesciences.org/articles/57335/elife-57335-transrepform-v3.pdf
Download links
A two-part list of links to download the article, or parts of the article, in various formats.
Downloads (link to download the article as PDF)
Open citations (links to open the citations from this article in various online reference manager services)
Cite this article (links to download the citations from this article in formats compatible with various reference manager tools)
Acetylcholine is released in the basolateral amygdala in response to predictors of reward and enhances the learning of cue-reward contingency
eLife 9:e57335.
https://doi.org/10.7554/eLife.57335


