Optical control of ERK and AKT signaling promotes axon regeneration and functional recovery of PNS and CNS in Drosophila
- Raymond G. Perelman Center for Cellular and Molecular Therapeutics, The Children's Hospital of Philadelphia, United States
- Department of Pathology and Laboratory Medicine, University of Pennsylvania, United States
- Department of Biochemistry, United States
- Neuroscience Program, United States
- Center for Biophysics and Quantitative Biology, United States
- Beckman Institute for Advanced Science and Technology, University of Illinois at Urbana-Champaign, United States
Figures
Figure 1 with 1 supplement
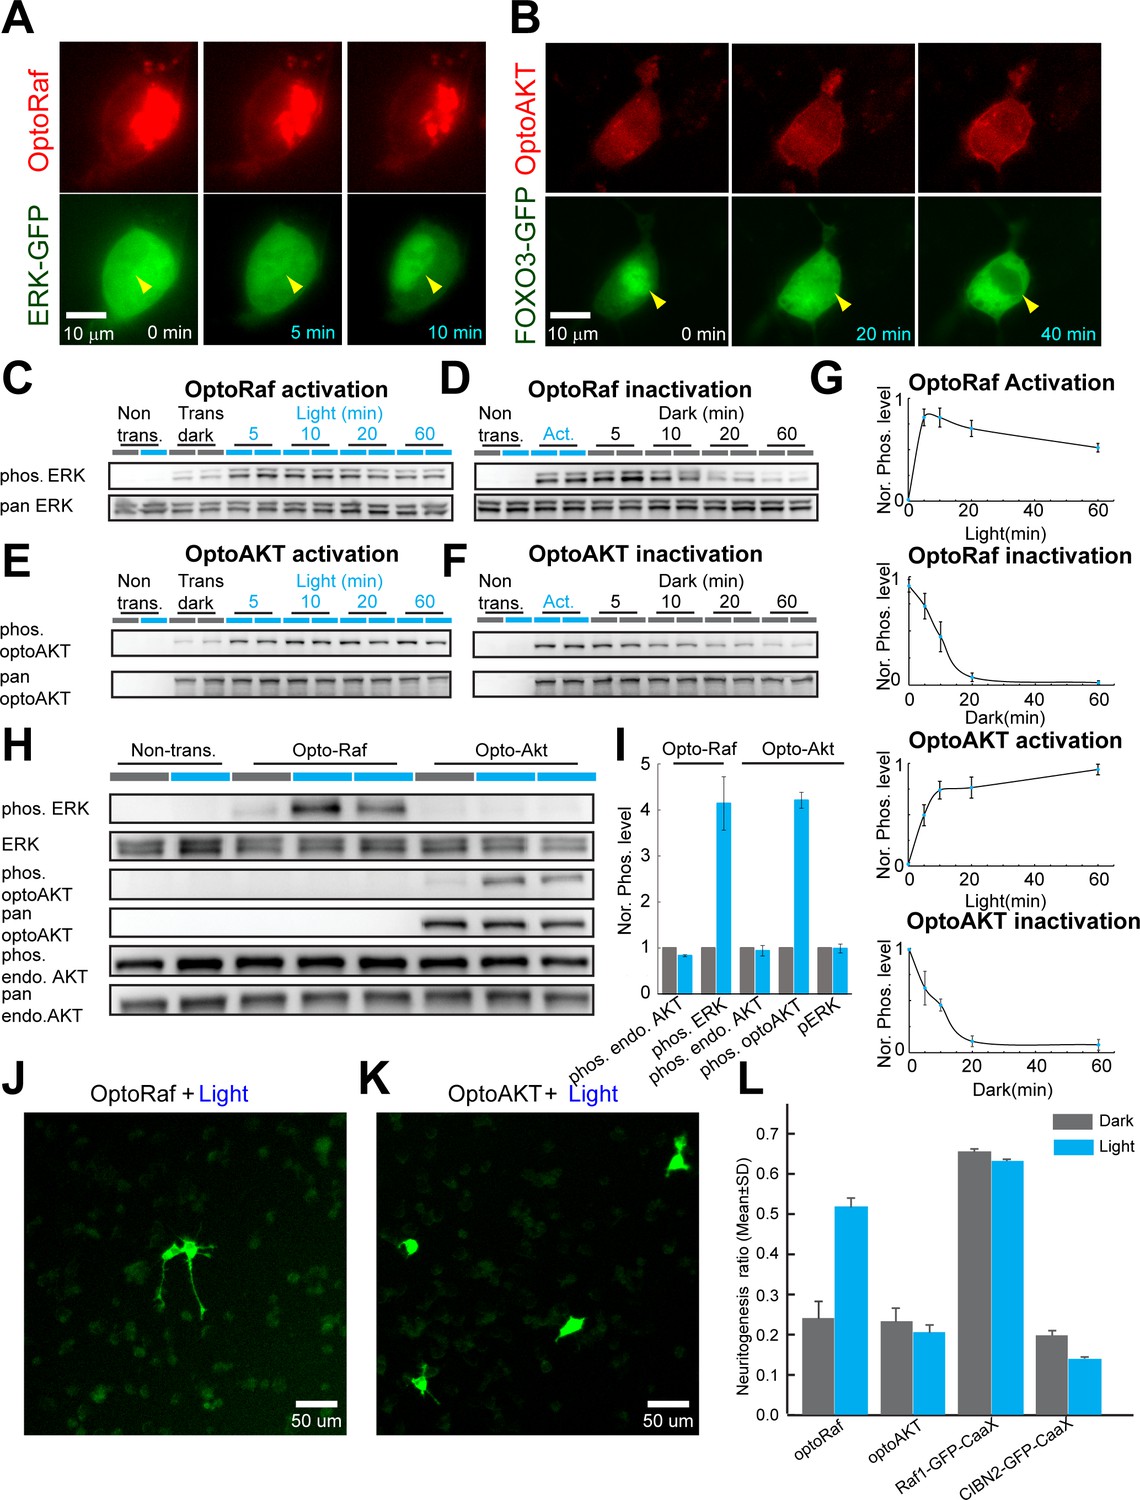
OptoRaf and optoAKT specifically activate the ERK and AKT subcircuits, respectively.
(A) Activation of optoRaf benchmarked with ERK2-EGFP nuclear translocation. (B) Activation of optoAKT benchmarked with FOXO3-EGFP nuclear export. Scale bars = 10 μm. (C) Western blot analysis of the pERK and ERK activities in response to time-stamped activation of optoRaf. Blue light (0.5 mW/cm2) was applied for 5, 10, 20, and 60 min to HEK293T cells transfected with optoRaf. Non-transfected cells or optoRaf-transfected cells (dark) were used as negative controls. (D) Inactivation of the pERK activity after blue light was shut off. (E) Western blot analysis of the pAKT (S473) and AKT activities in response to time-stamped activation of optoAKT. Cells were treated with identical illumination scheme in (C). (F) Inactivation of the pAKT activity after blue light was shut off. (G) Plots of normalized pERK and pAKT activity upon optoRaf and optoAKT activation, respectively (maximum activation was defined as 1). Both optoRaf and optoAKT show rapid (less than 5 min) and reversible activation patterns (N = 3). (H) OptoRaf and optoAKT do not show cross activity at the level of ERK and AKT. Cells were exposed to blue light (0.5 mW/cm2) for 10 min before lysis. (I) Quantification of the phosphorylated protein level, phosphorylation level was normalized to non-transfected group(N = 3). (J, K) PC12 cells transfected with either optoRaf (J) or optoAKT (K) were treated by blue light for 24 hr (0.2 mW/cm2). Scale bars = 50 μm. (I) Quantification of the neuritogenesis ratio of PC12 cells transfected with optoRaf or optoAKT. A membrane-targeted Raf (Raf1-EGFP-CaaX) causes constitutive neuritogenesis independent of light treatment, whereas the no-Raf (CIBN2-EGFP-CaaX) control does not increase the neuritogenesis ratio under light or dark treatment. See also Figure 1—figure supplement 1.
-
Figure 1—source data 1
OptoRaf and optoAKT specifically activate the ERK and AKT subcircuits, respectively.
- https://cdn.elifesciences.org/articles/57395/elife-57395-fig1-data1-v2.xlsx
Figure 1—figure supplement 1
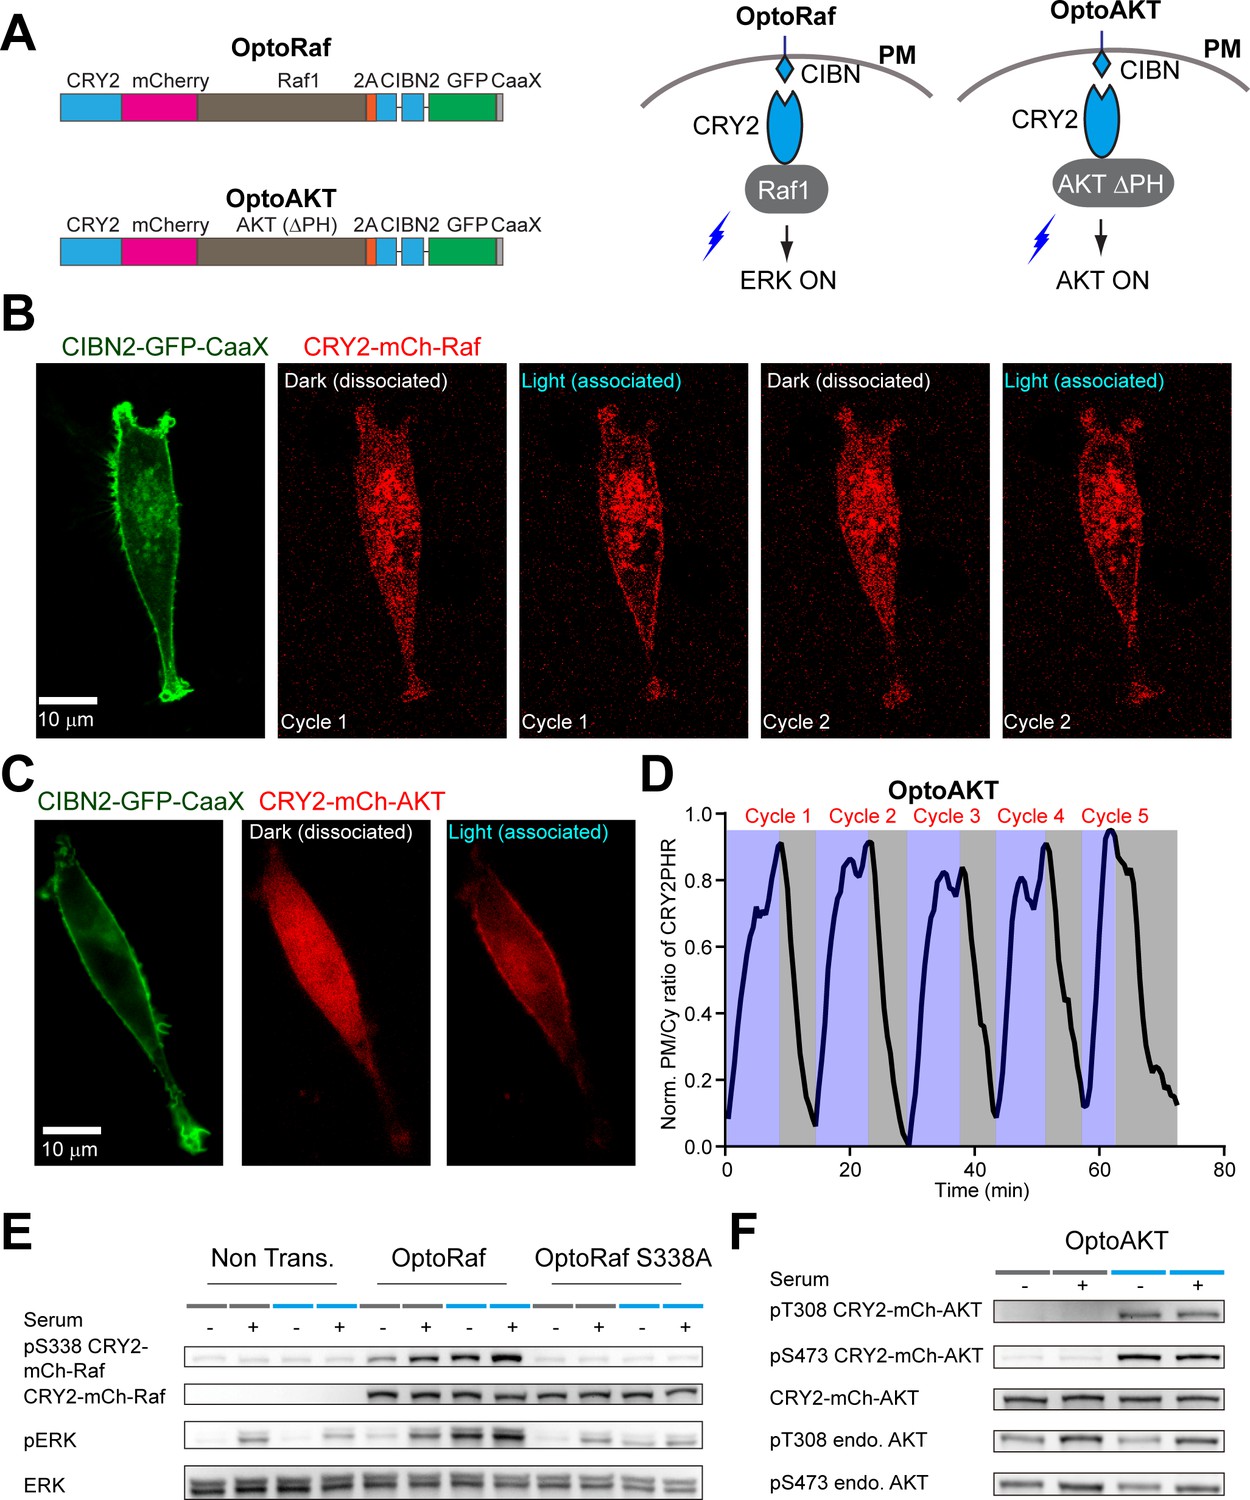
Design and live cell imaging for optoRaf and optoAKT in mammalian cell cultures.
(A) Blue light illumination facilitates the association of CIBN and CRY2, and the CIBN/CRY2 complex spontaneously dissociates in the dark. In both optoRaf and optoAKT, CIBN-EGFP-CaaX anchors to the plasma membrane and the cytosolic signaling protein is fused to CRY2. Under blue light stimulation, optoRaf and optoAKT recruit the signaling protein, Raf1 (optoRaf) and AKT ΔPH (optoAKT) to the plasma membrane to activate the ERK and AKT signaling pathway, respectively. (B, C) Live-cell imaging of reversible membrane recruitment of CRY2-mCh-Raf (B) CRY2-mCh-AKT (C). After each cycle of light stimulation, cells were kept in the dark for about 30 min. (D) Multiple cycles of membrane recruitment can be achieved from the same cell. (E) Western blot analysis of the optoRaf S338A mutant, serum containing full medium or blue light was applied to activate Raf/ERK signaling. (F) Western blot analysis of the T308 and S473 phosphorylation sites, serum containing full medium or blue light was applied to activate AKT signaling.
-
Figure 1—figure supplement 1—source data 1
Design and live cell imaging for optoRaf and optoAKT in mammalian cell cultures.
- https://cdn.elifesciences.org/articles/57395/elife-57395-fig1-figsupp1-data1-v2.xlsx
Figure 2 with 3 supplements
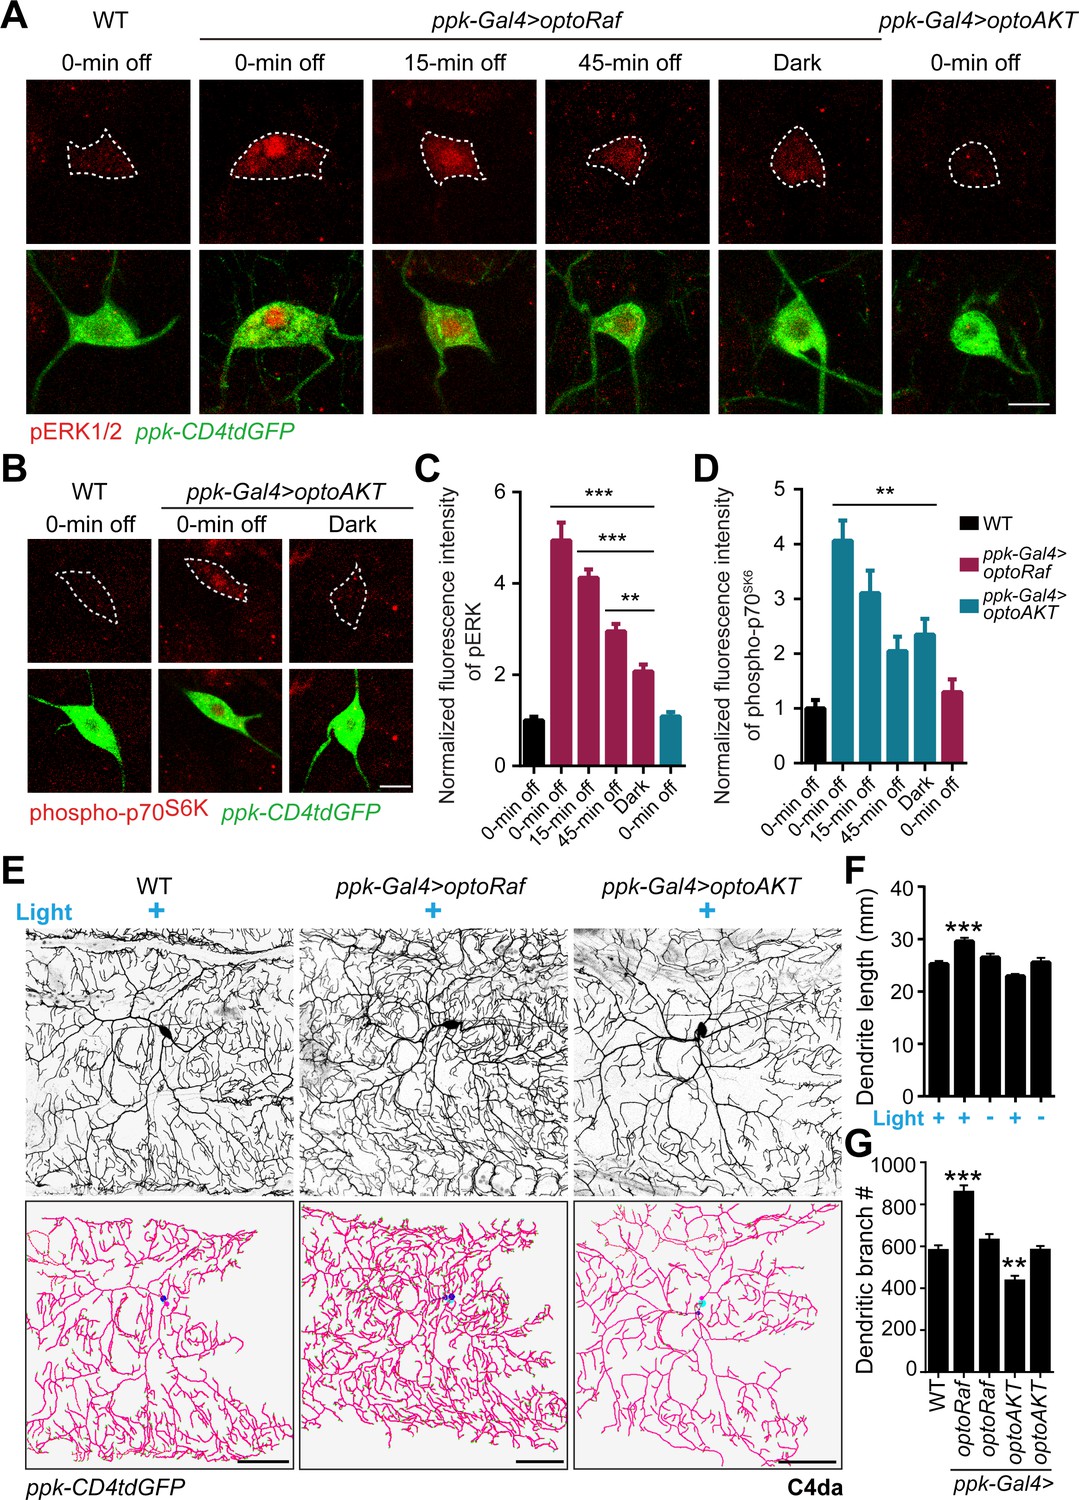
Activation of optoRaf but not optoAKT increases C4da neuron dendrite complexity.
(A–D) 15 min blue light stimulation activates optoRaf and optoAKT in flies in vivo. After the light was off, the downstream effectors inactivated gradually. (A) The body walls from WT and optoRaf expressing larvae were dissected and stained for pERK1/2. The 15 min continuous light illumination leads to the enhanced fluorescent intensity and nuclear translocation of pERK in the optoRaf-expressing C4da neurons (labeled by ppk-CD4tdGFP). pERK signal is significantly increased even at 45 min after the light was off. Notably, the ERK signaling is not activated by light stimulation in optoAKT-expressing neurons. C4da neuron cell bodies are outlined by dashed white lines. Scale Bar = 10 μm. (B) Phospho-p70S6K is activated by light illumination in optoAKT expressing neurons, and gradually returned to baseline after blue light was shut off. (C) Qualification of pERK fluorescence intensity in (A). The intensity of pERK in transgenic larvae was normalized to that of WT. WT (0 min off) N = 19, optoRaf (0 min off) N = 16, optoRaf (15 min off) N = 19, optoRaf (45 min off) N = 18, optoRaf (dark) N = 18, optoAKT (0 min off) N = 19 neurons. (D) Qualification of phospho-p70S6K fluorescence intensity in (B). The intensity of phospho-p70S6K in transgenic larvae was normalized to that of WT. WT (0 min off) N = 18, optoAKT (0 min off) N = 19, optoAKT (15 min off) N = 23, optoAKT (45 min off) N = 20, optoAKT (dark) N = 16, optoRaf (0 min off) N = 23 neurons. (E–G) Activation of Raf/MEK/ERK but not AKT signaling by 72 hr' light stimulation increases dendrite outgrowth and branching in C4da neurons. (E) Representative images of C4da neurons from WT, optoRaf and optoAKT expressing larvae with 72 hr' light stimulation and the unstimulated controls. Neurons were reconstructed with Neuronstudio. Scale bar = 50 μm. (F) Quantification of total dendrite length of C4da neurons. (G) Qualification of dendritic branch number. WT (light) N = 21, optoRaf (light) N = 21, optoRaf (dark) N = 21, optoAKT (light) N = 20, optoAKT (dark) N = 20 neurons. All data are mean ± SEM. The data were analyzed by one-way ANOVA followed by Dunnett's multiple comparisons test, **p<0.01, ***p<0.001. See also Figure 3—figure supplements 1–2.
-
Figure 2—source data 1
Activation of optoRaf but not optoAKT increases C4da neuron dendrite complexity.
- https://cdn.elifesciences.org/articles/57395/elife-57395-fig2-data1-v2.xlsx
Figure 2—figure supplement 1
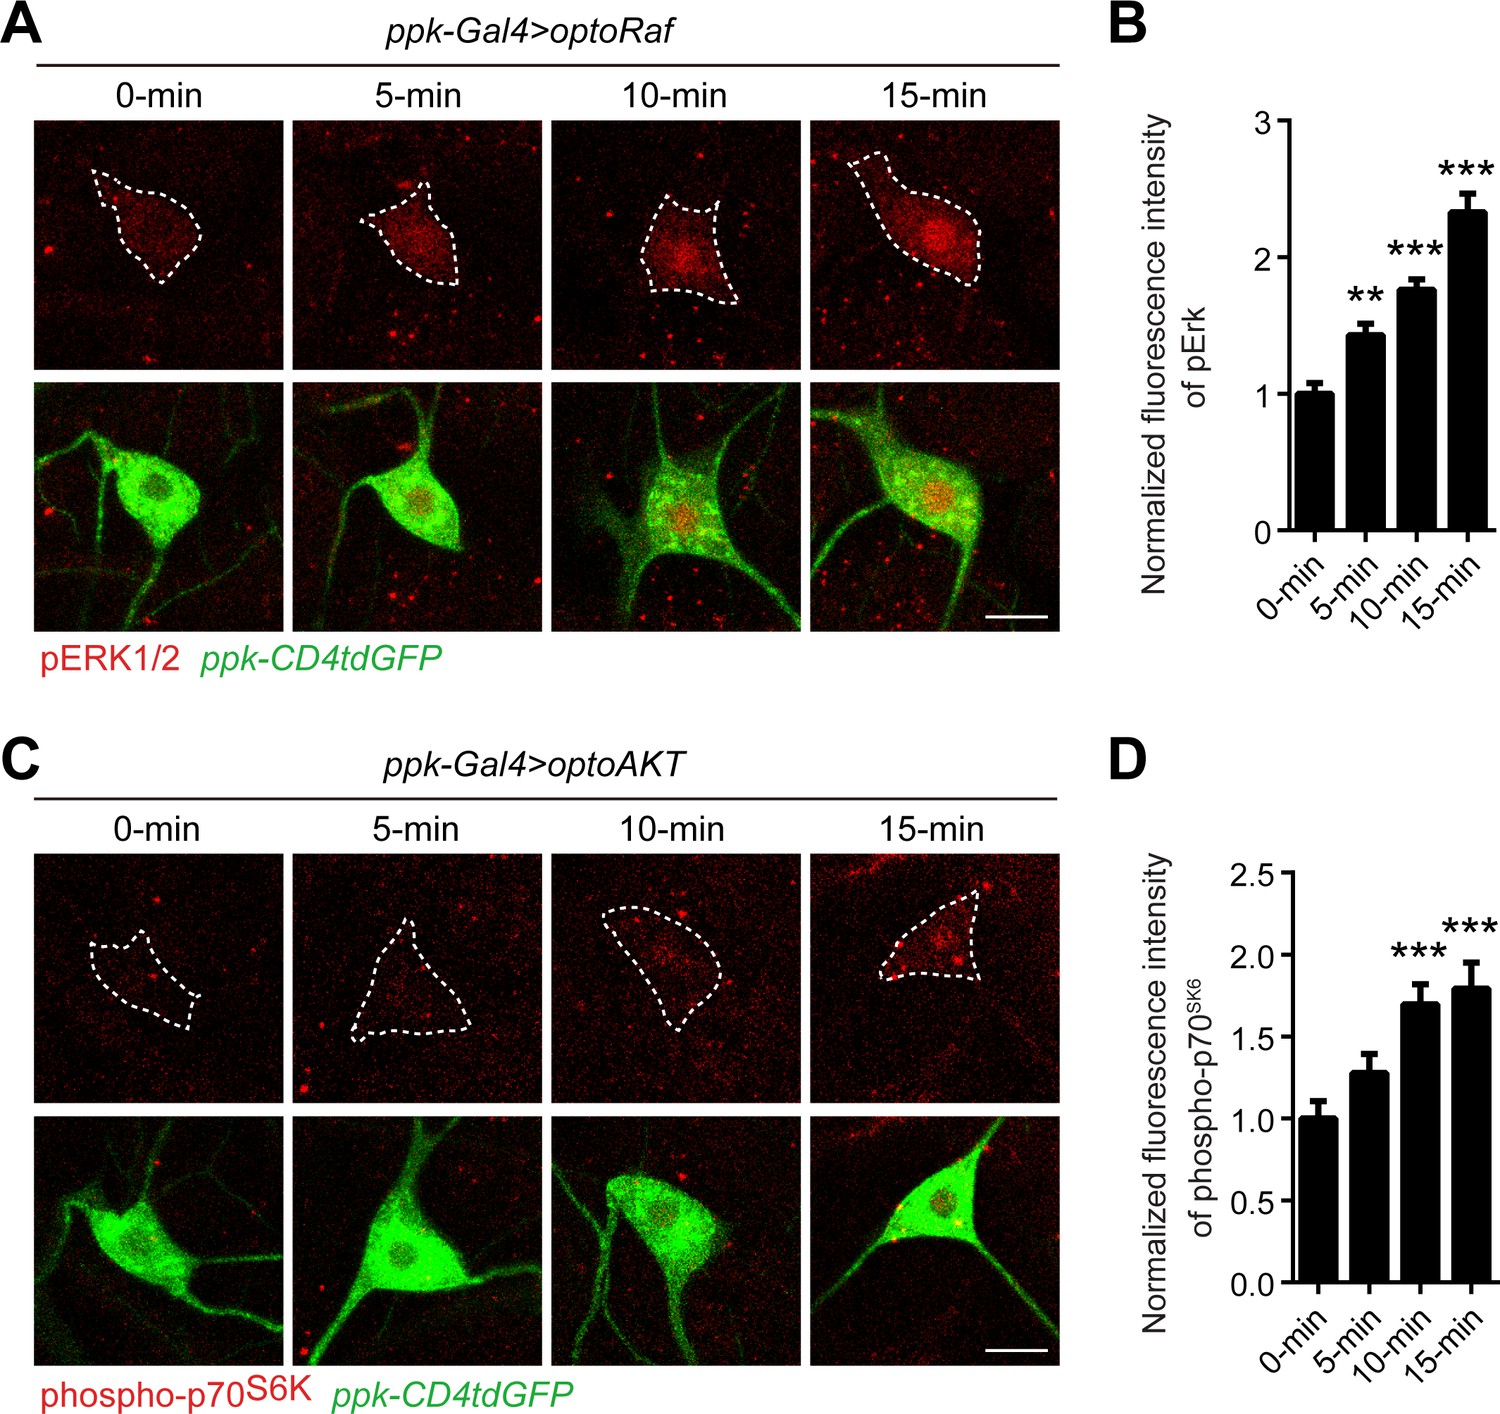
Activation kinetics of optoRaf and optoAKT in fly sensory neurons.
(A–B) 5 min light illumination is sufficient to activate optoRaf, while longer light stimulation can further increase pERK intensity and induce ERK nuclear translocation. Blue light is applied for 0, 5, 10, and 15 min to optoRaf expressing larvae. The fluorescence intensity of pERK is normalized to that of neurons with no blue light treatment (0 min). optoRaf (0 min) N = 20, optoRaf (5 min) N = 21, optoRaf (10 min) N = 18, optoRaf (15 min) N = 16. (C–D) The intensity of phospho-p70S6K is significantly increased after 10 min light illumination in optoAKT expressing neurons. Blue light is applied for 0, 5, 10, and 15 min to optoAKT expressing larvae. The fluorescence intensity of phospho-p70S6K is normalized to that of neurons with no blue light treatment (0 min). optoAKT (0 min) N = 17, optoAKT (5 min) N = 18, optoAKT (10 min) N = 17, optoAKT (15 min) N = 17. Data are mean ± SEM, analyzed by one-way ANOVA followed by Dunnett’s multiple comparisons test. **p<0.01, ***p<0.001.
-
Figure 2—figure supplement 1—source data 1
Activation kinetics of optoRaf and optoAKT in fly sensory neurons.
- https://cdn.elifesciences.org/articles/57395/elife-57395-fig2-figsupp1-data1-v2.xlsx
Figure 2—figure supplement 2
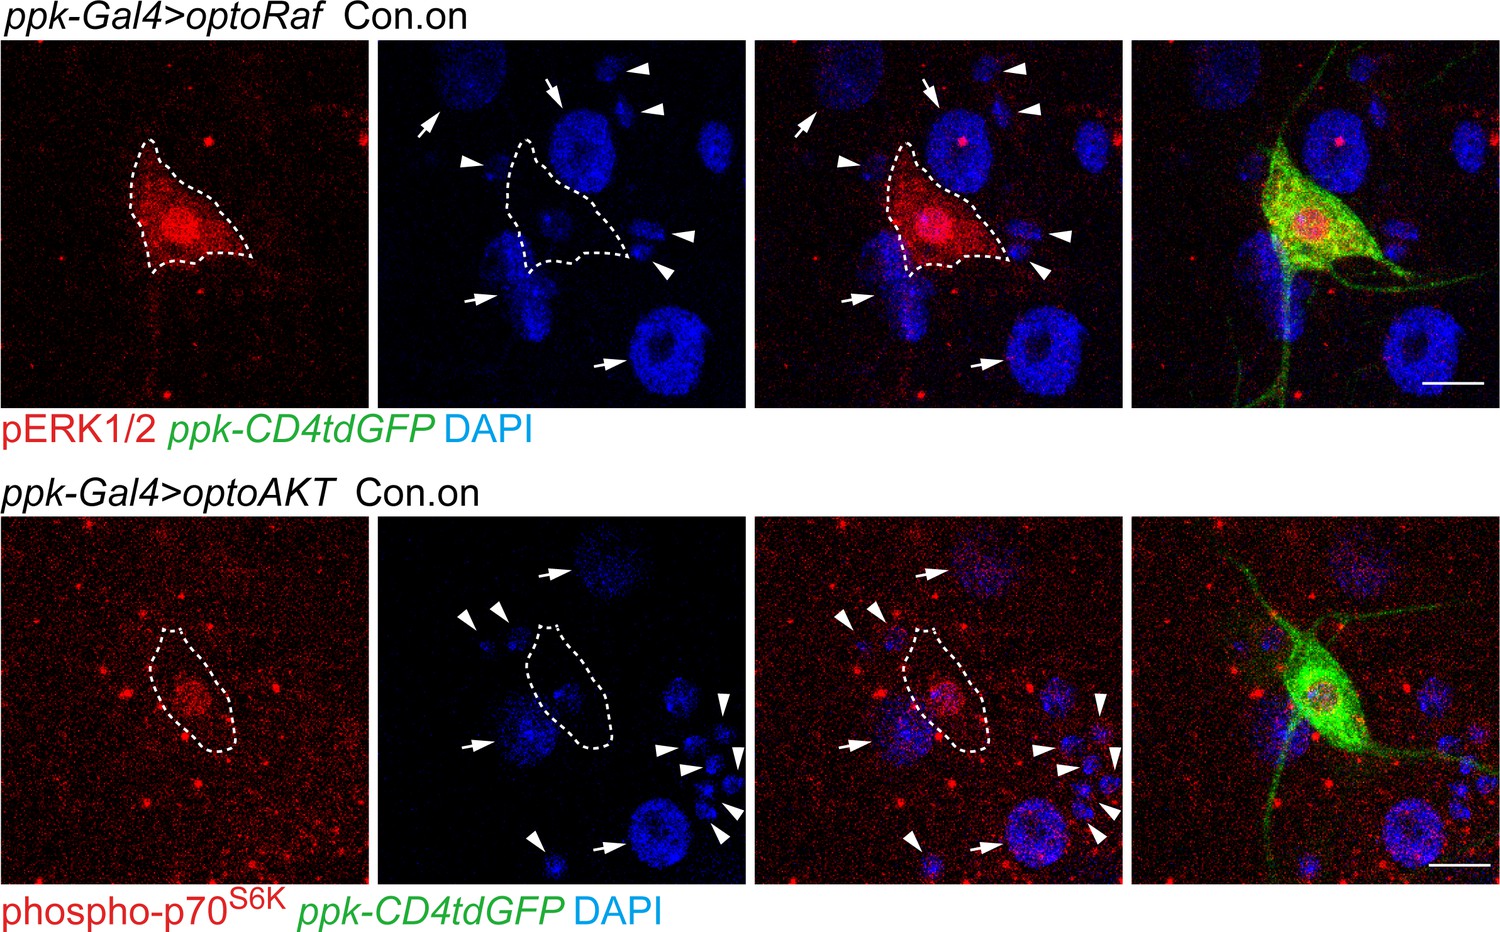
The specific activation of ERK/p70S6K in C4da neurons.
Downstream effectors are specifically activated in optoRaf or optoAKT expressing neurons by light illumination. The arrowheads mark da neurons and arrows mark epithelial cells. Scale S6K = 10 μm.
Figure 2—figure supplement 3
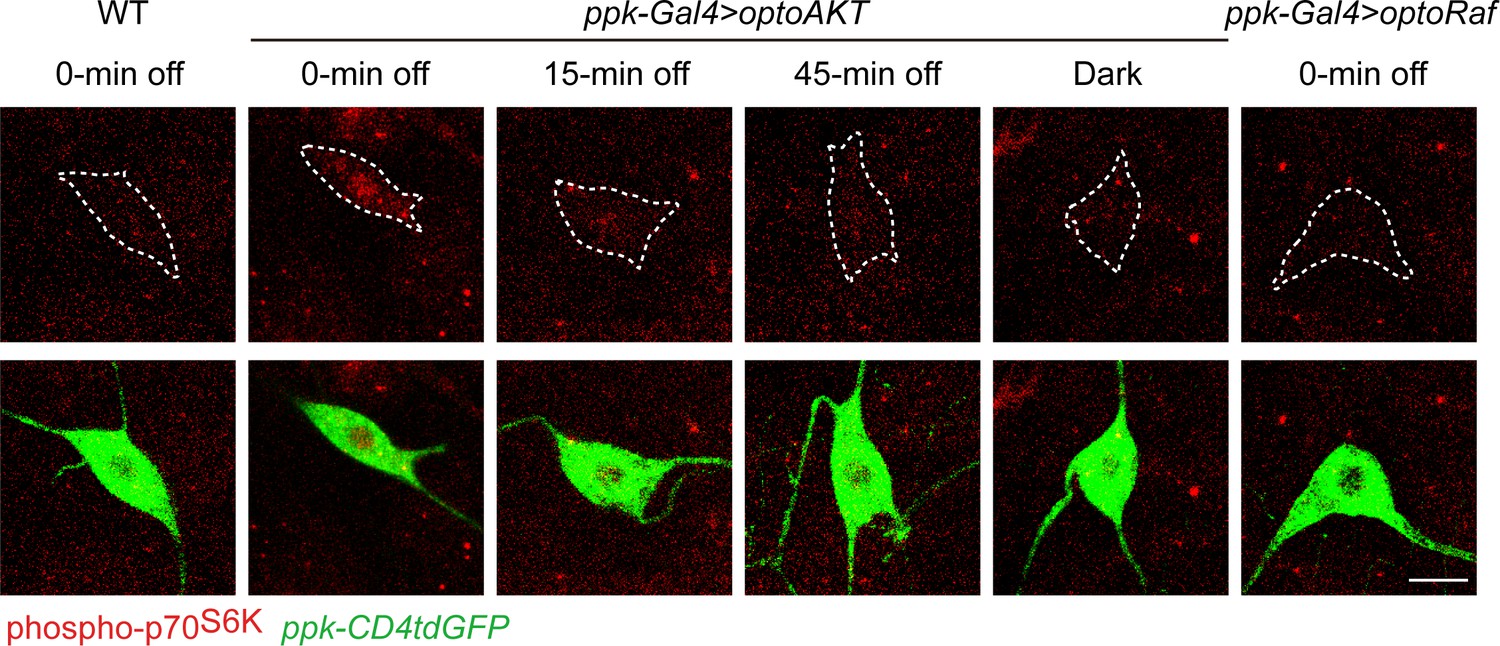
Inactivation kinetics of optoRaf, and activation of optoRaf does not upregulate phospho-p70S6K.
Phospho-p70S6K was activated by 15 min light illumination in optoAKT expressing neurons, and inactivated 15 min after the light was off. No enhancement of phospho-p70S6K fluorescent intensity was observed in optoRaf-expressing neurons with light stimulation.
Figure 3 with 2 supplements
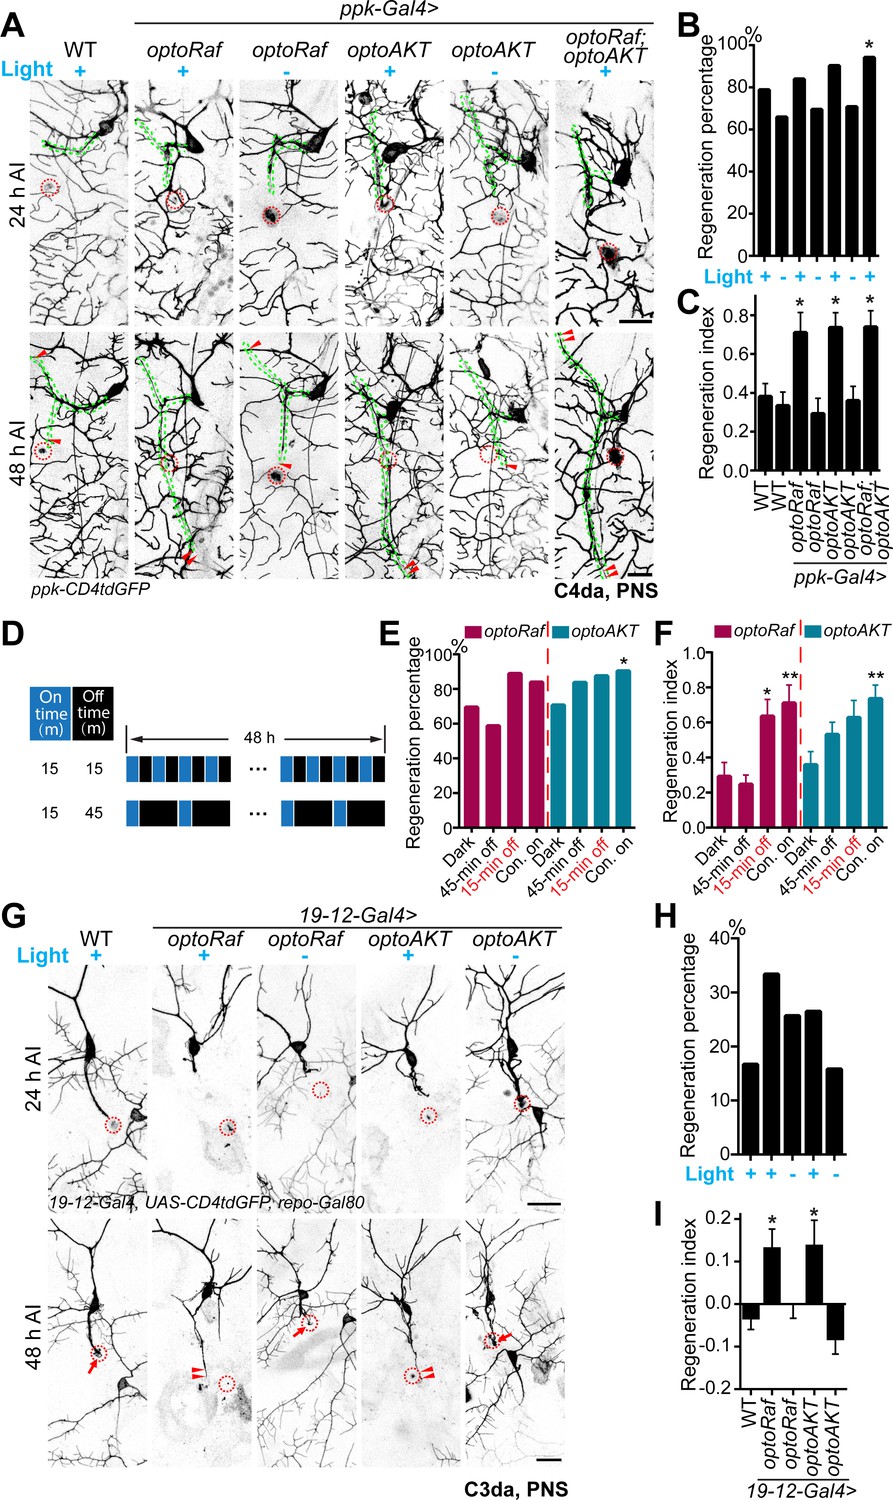
Light-stimulated optoRaf or optoAKT enhances axon regeneration in the PNS.
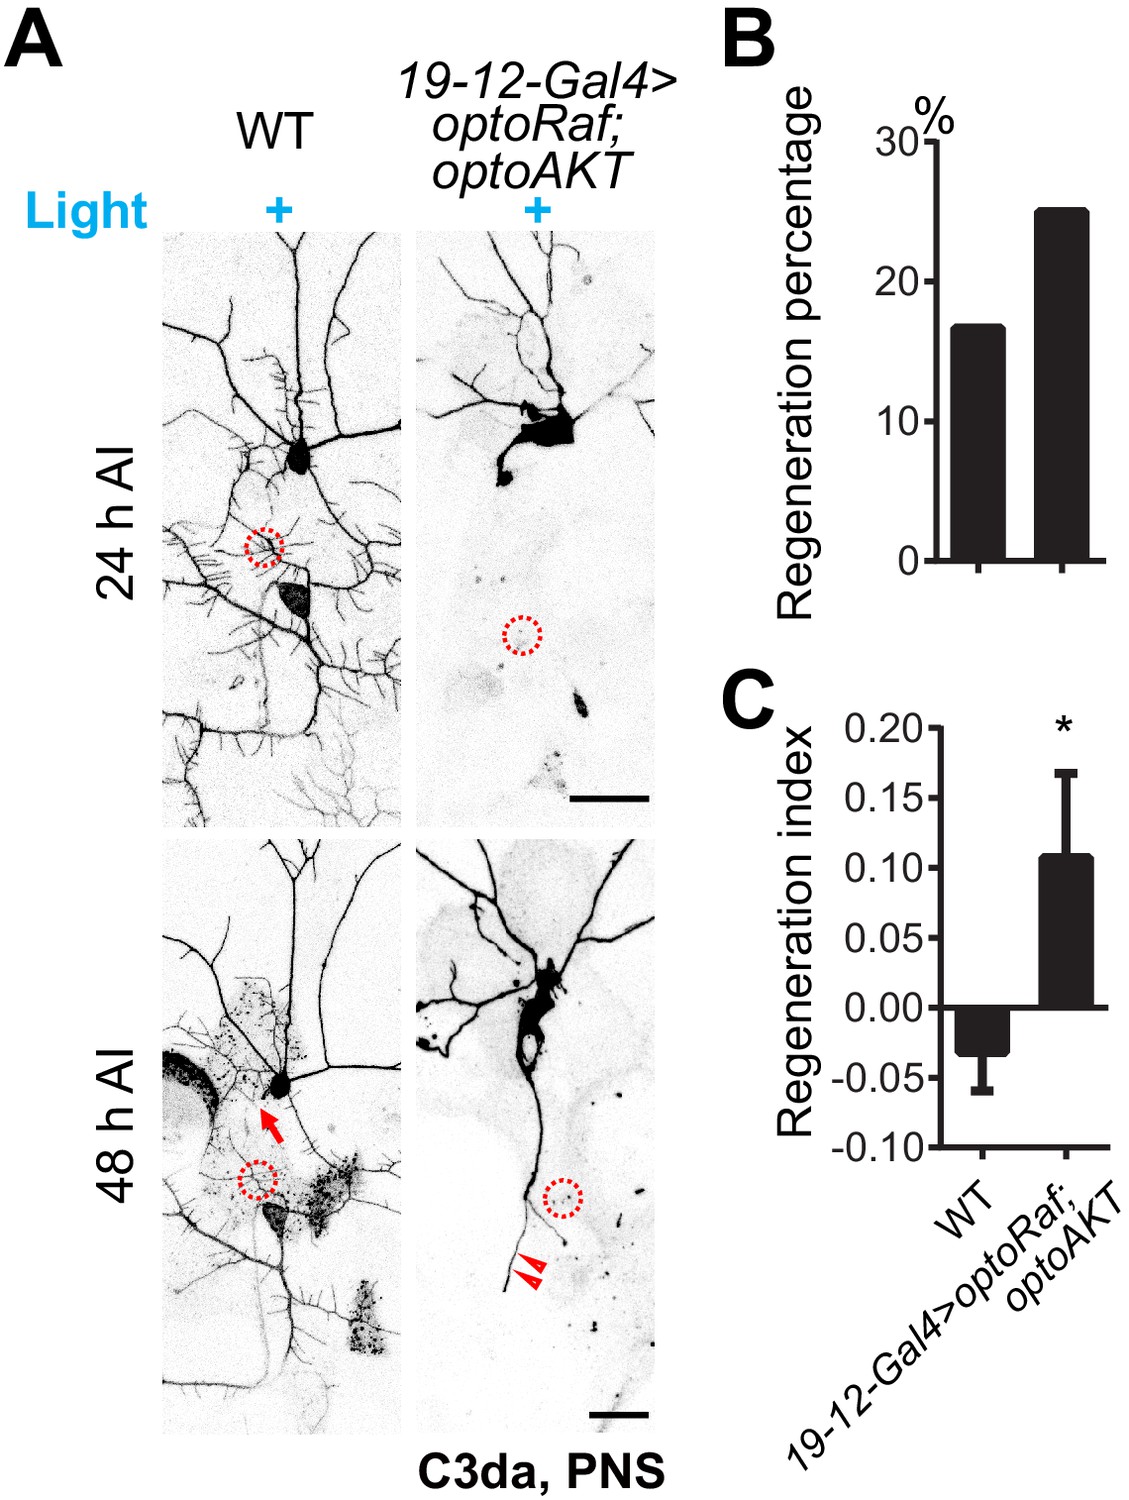
(A–C) Compared with WT, C4da neurons expressing optoRaf or optoAKT show significantly increased axon regeneration in response to blue light. No enhancement was observed in the unstimulated controls. (A) C4da neuron axons were severed and their regeneration was assayed at 48 hr AI. The injury sites are marked by the red dashed circles and regenerating axons are marked by arrowheads. Axons are outlined with dashed green lines. Scale bar = 20 μm. (B) The regeneration percentage of light-stimulated transgenic groups is not significantly higher than WT. Fisher's exact test, p=0.3010, p=0.7608, p=0.4219, p=0.2007, p=0.5933, p=0.0440. (C) Qualification of C4da neuron axon regeneration by the regeneration index. WT (light) N = 33, WT (dark) N = 41, optoRaf (light) N = 36, optoRaf (dark) N = 36, optoAKT (light) N = 52, optoAKT (dark) N = 41, optoRaf + optoAKT (light) N = 51 neurons. Data are mean ± SEM, analyzed by one-way ANOVA followed by Dunnett's multiple comparisons test. (D–F) After injury, larvae were subjected to programmed light and dark cycles for a total of 48 hr. The intermittent light stimulation promotes axon regrowth in optoRaf expressing larvae similar to constant light when the off-time is 15 min. (D) The intermittent patterns of the light stimulus. (E) Compared with larvae incubated in dark, light stimulation is capable of increasing the percentage of regenerated axons. Fisher's exact test, p=0.3616, p=0.0795, p=0.2668, p=0.2030, p=0.1004, p=0.0285. (F) Qualification of C4da axon regeneration by the regeneration index. OptoRaf (dark) N = 36, optoRaf (45 min off) N = 46, optoRaf (15 min off) N = 36, optoRaf (Con. on) N = 36, optoAKT (dark) N = 41, optoAKT (45 min off) N = 49, optoAKT (15 min off) N = 40, optoAKT (Con. on) N = 52 neurons. Data are mean ± SEM, analyzed by one-way ANOVA followed by Dunnett's multiple comparisons test. (G–I) Blue light stimulation significantly enhances axon regeneration in the regeneration-incompetent C3da neurons. (G) C3da neuron axon degeneration was verified at 24 hr AI and axon regeneration was assessed at 48 hr AI. The injury sites are marked by the dashed circles, regenerated axons are demarcated by arrowheads, and arrows mark non-regenerated axons. Scale bar = 20 μm. (H) The regeneration percentage is not significantly different. Fisher’s exact test, p=0.1146, p=0.4155, p=0.3979, p=1.000. (I) Qualification of axon regeneration by the regeneration index. WT (light) N = 42, optoRaf (light) N = 36, optoRaf (dark) N = 39, optoAKT (light) N = 34, optoAKT (dark) N = 38 neurons. Data are mean ± SEM, analyzed by one-way ANOVA followed by Dunnett's multiple comparisons test. *p<0.05, **p<0.01. See also Figure 3—figure supplements 1 and 2.
-
Figure 3—source data 1
Light-stimulated optoRaf or optoAKT enhances axon regeneration in the PNS.
- https://cdn.elifesciences.org/articles/57395/elife-57395-fig3-data1-v2.xlsx
Figure 3—figure supplement 1
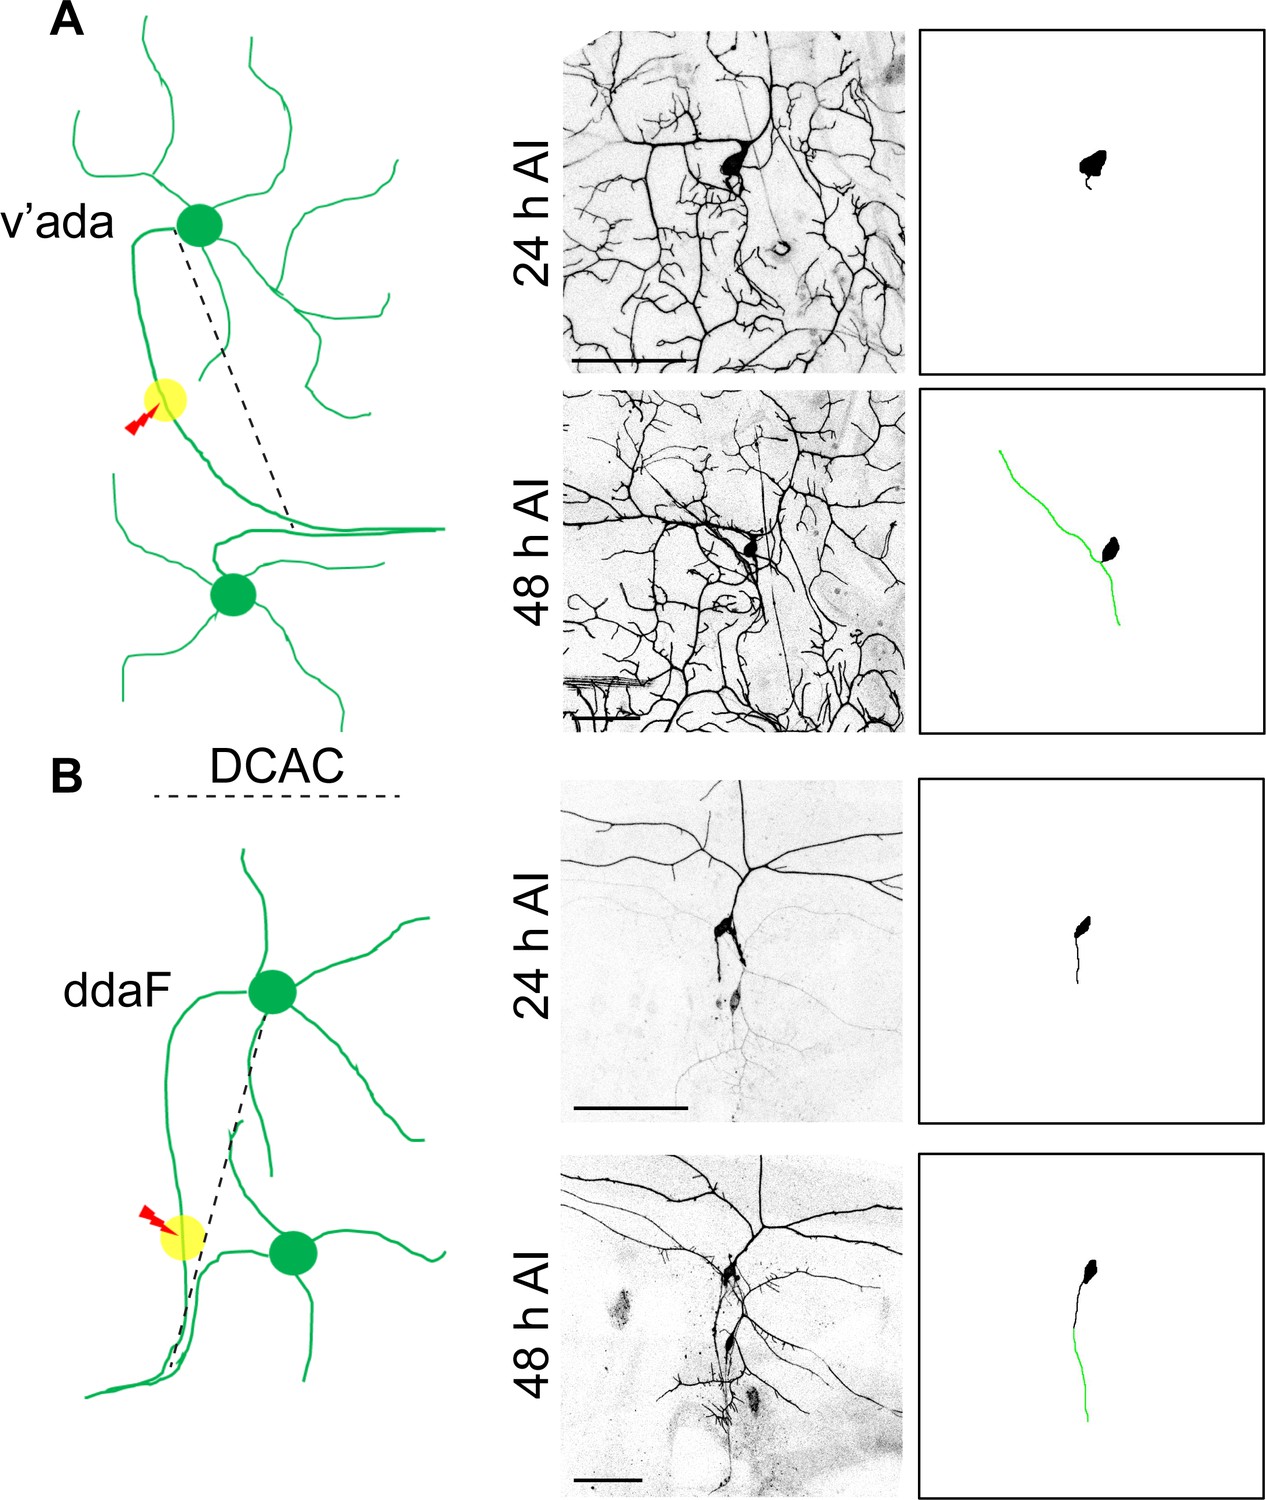
Quantification of axon regeneration in the PNS.
(A) A schematic diagram depicts the C4da neuron injury model. At 48 hr AI, two branches of the regenerating axon are extended towards two opposite directions. To calculate the regeneration index, the increased length of the longer branch was measured and normalized by DCAC (the distance between the cell body and the axon converging point). Scale bar = 50 μm. (B) A schematic drawing depicts the C3da neuron injury model. The green line depicts the regenerated axon. Scale bar = 50 μm.
Figure 3—figure supplement 2
Co-activation of optoRaf and optoAKT does not further promote axon regeneration in C3da neurons.
(A) C3da neurons expressing both optoRaf and optoAKT show increased, but not additive regeneration capacity in response to blue light. (B–C) Quantification of C3da axon regeneration percentage (B) and regeneration index (C) at 48 hr AI. WT (light) N = 42, optoRaf + optoAKT (light) N = 44 neurons, regeneration index p=0.0409, regeneration percentage p=0.4300. Data are mean ± SEM, analyzed by unpaired t test or Fisher’s exact test. *p<0.05.
-
Figure 3—figure supplement 2—source data 1
Co-activation of optoRaf and optoAKT does not further promote axon regeneration in C3da neurons.
- https://cdn.elifesciences.org/articles/57395/elife-57395-fig3-figsupp2-data1-v2.xlsx
Figure 4
Local optogenetic stimulation conveys guidance instructions to regenerating axons.
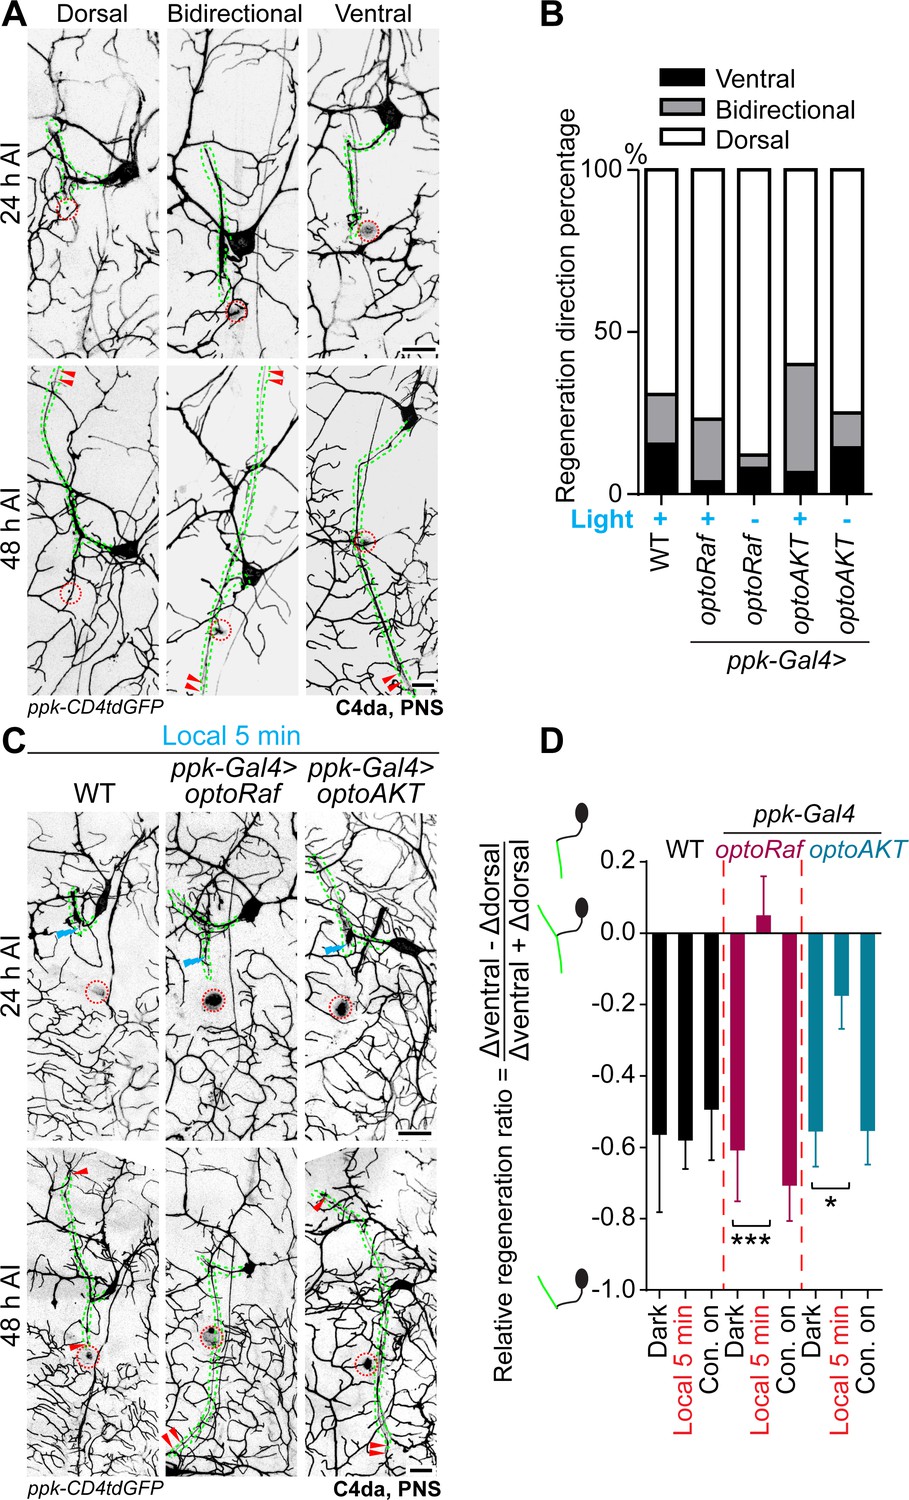
(A, B) Regenerating axons prefer to regrow away from the original trajectory, with only a minority of axons finding the correct path. (A) Representative images of axons retracting or bifurcating at 24 hr AI. At 48 hr AI in WT, regenerating axons extend dorsally, ventrally, or both directions. The injury site is marked by the dashed circles and regenerating axons are marked by arrowheads. Axons are outlined with dashed green lines. Scale bar = 20 μm. (B) Light stimulation fails to increase the percentage of axons regrowing towards the right direction. The percentage of axons extending towards the correct trajectory (ventral + bidirectional) were analyzed by Fisher's exact test, p=0.7554, p=0.1729, p=0.6097, p=0.7638. WT (light) N = 26, optoRaf (light) N = 26, optoRaf (dark) N = 25, optoAKT (light) N = 45, optoAKT (dark) N = 28 neurons. (C, D) Restricted local activation of optoRaf or optoAKT significantly increases the relative regeneration ratio. The ratio is defined to weigh the regeneration potential of the ventral branch against the dorsal branch. (C) A single pulse of light stimulation delivered specifically on the ventral axon branch at 24 hr AI (blue flash symbol) is capable of promoting the preferential extension of regenerating axons in optoRaf or optoAKT expressing larvae. The injury sites are demarcated by the dashed red circles and regenerating axons are marked by arrowheads. Axons are outlined with dashed green lines. Blue flash symbols show the restrict light delivery to the ventral branch. (D) Qualification of the relative regeneration ratio of v'ada. WT (dark) N = 32, WT (local 5 min) N = 32, WT (Con. on) N = 33, optoRaf (dark) N = 32, optoRaf (local 5 min) N = 35, optoRaf (Con. on) N = 36, optoAKT (dark) N = 33, optoAKT (local 5 min) N = 34, optoAKT (Con. on) N = 36 neurons. Data are mean ± SEM, analyzed by one-way ANOVA followed by Dunnett's multiple comparisons test, *p<0.05, ***p<0.001.
-
Figure 4—source data 1
Local optogenetic stimulation conveys guidance instructions to regenerating axons.
- https://cdn.elifesciences.org/articles/57395/elife-57395-fig4-data1-v2.xlsx
Figure 5 with 1 supplement
Activation of optoRaf or optoAKT promotes axon regeneration in the CNS.
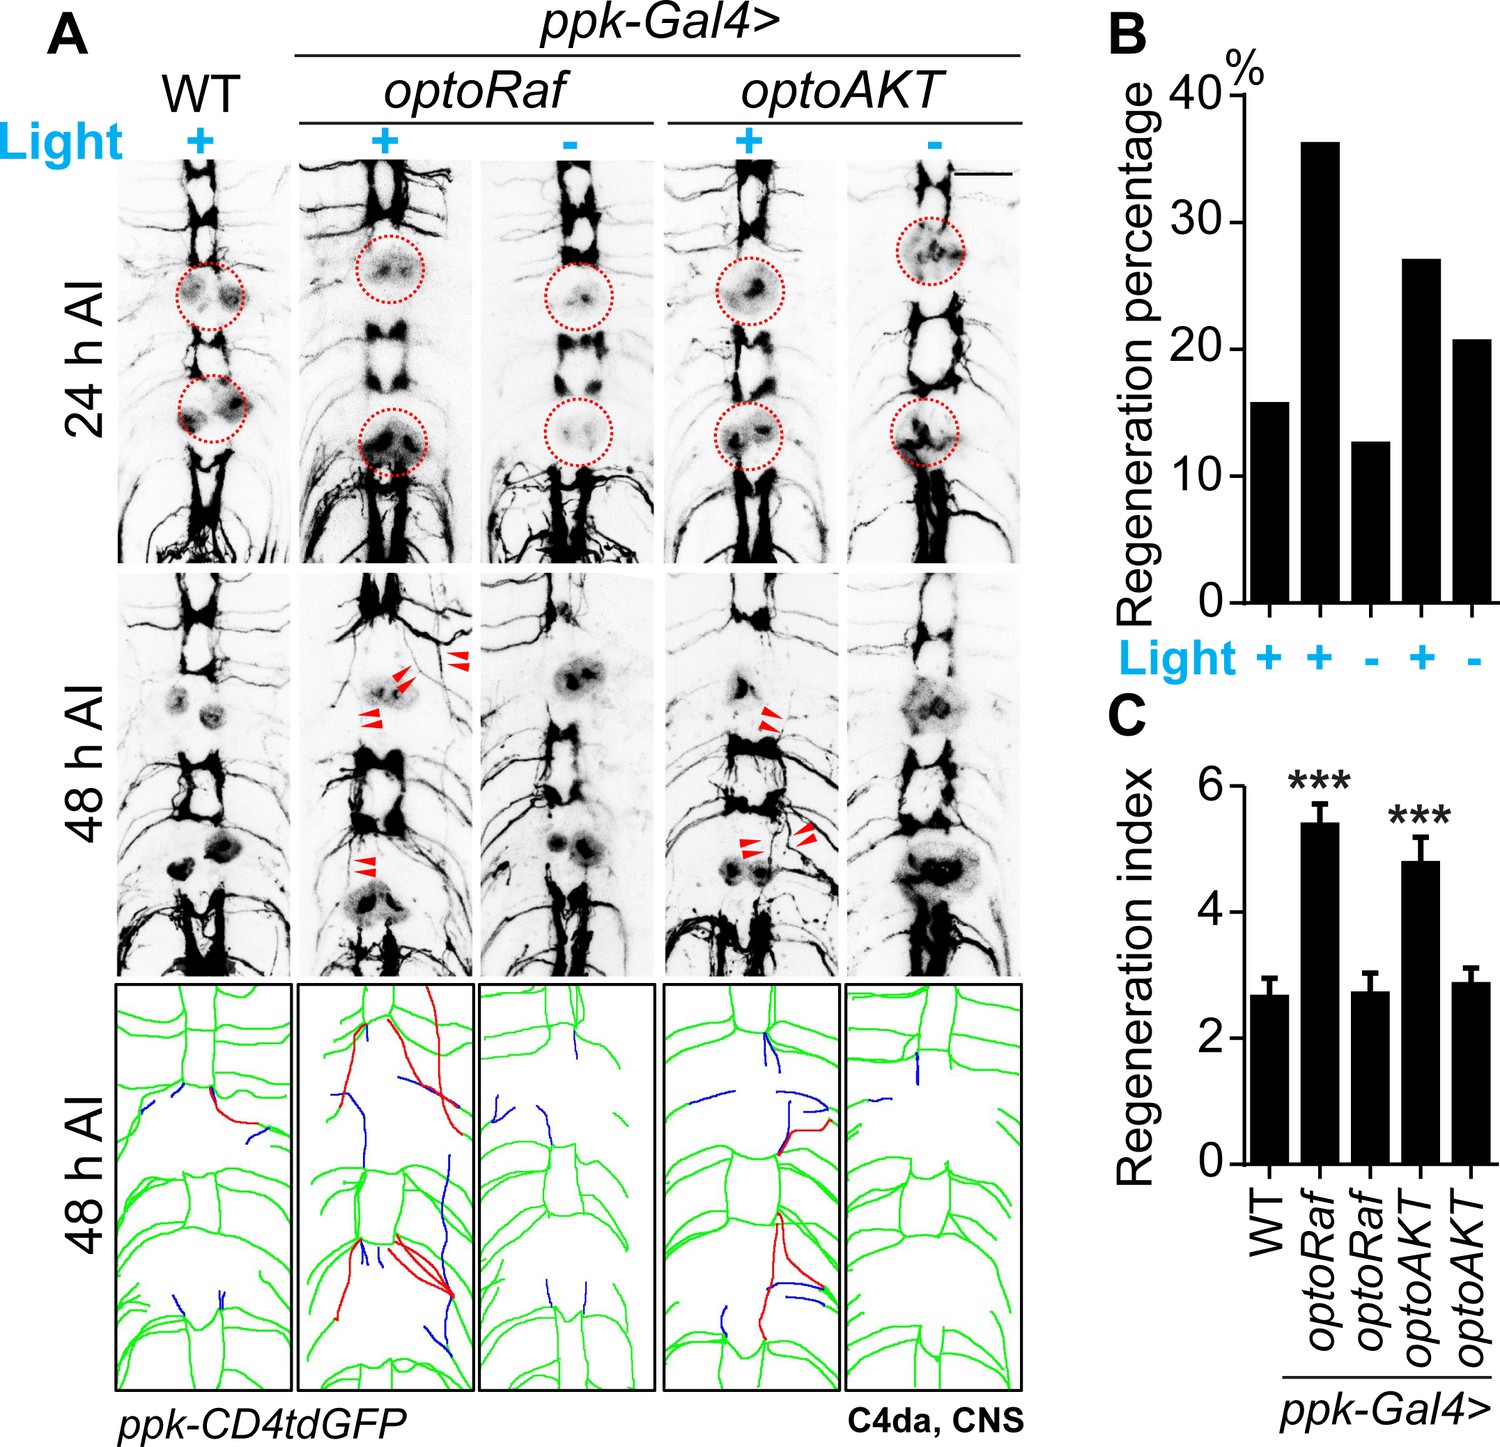
(A–C) Light stimulation significantly enhances axon regeneration in the VNC of optoRaf- or optoAKT-expressing larvae. (A) Complete degeneration in A3 and A6 commissure segments was confirmed at 24 hr AI and regeneration of these two segments was assayed independently at 48 hr AI. The injury sites are marked by the red dashed circles and regenerating axons are labeled by arrowheads. In the schematic diagrams, regrowing axons that reached other bundles and thus define a regenerating commissure segment are highlighted in red, while other regrowing axons are illustrated in blue. Scale bar = 20 μm. (B) The regeneration percentage is not significantly different. Fisher's exact test, p=0.0971, p=1.000, p=0.3415, p=0.7524. (C) Qualification of axon regeneration in VNC by the regeneration index. WT (light) N = 32, optoRaf (light) N = 36, optoRaf (dark) N = 32, optoAKT (light) N = 26, optoAKT (dark) N = 34 segments. Data are mean ± SEM, analyzed by one-way ANOVA followed by Dunnett's multiple comparisons test, ***p<0.001. See also Figure 5—figure supplement 1.
-
Figure 5—source data 1
Activation of optoRaf or optoAKT promotes axon regeneration in the CNS.
- https://cdn.elifesciences.org/articles/57395/elife-57395-fig5-data1-v2.xlsx
Figure 5—figure supplement 1
Quantification of axon regeneration in the CNS.
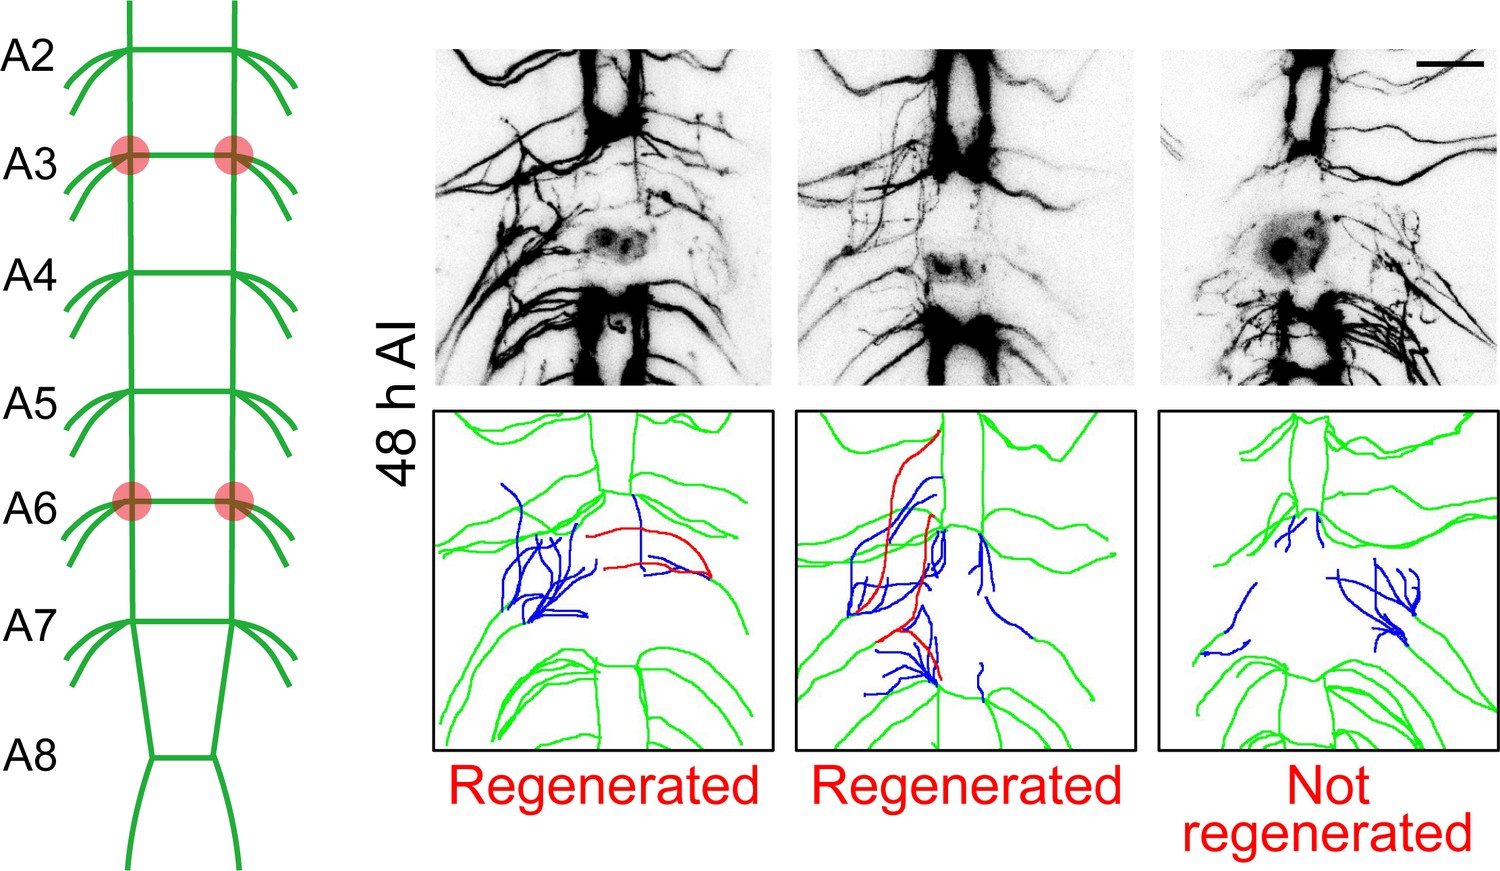
A schematic diagram of the VNC injury method. The abdominal A3 and A6 bundles were injured by laser and the regeneration of these two commissure segments were assessed independently at 48 hr AI. The regeneration index is defined as the total length of all regenerated axons normalized to the length between A4 and A5 bundles. However, a commissure segment is defined as regenerated only when at least one axon extends beyond the midline of the commissure region or connects with other intact bundles. Those axons are illustrated in the schematic diagrams in red, while other regrowing axons are in blue. Scale bar = 20 μm.
Figure 6
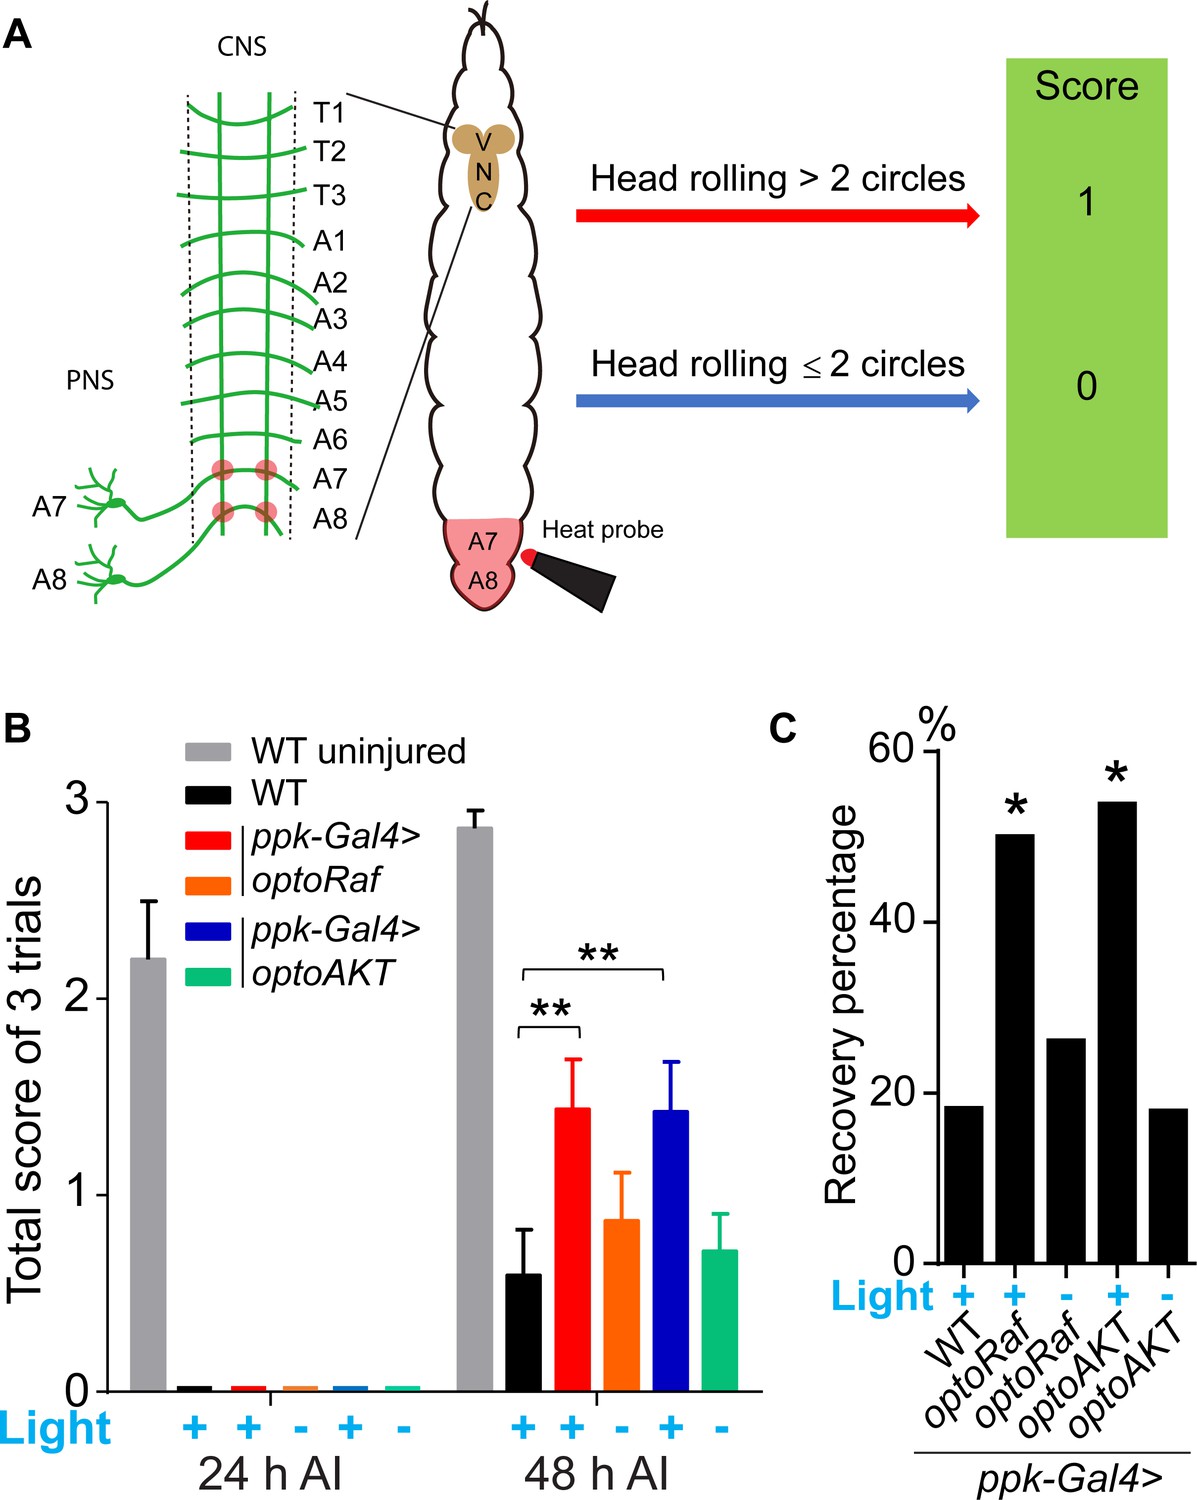
Activation of optoRaf or optoAKT promotes functional regeneration after CNS injury.
(A) A schematic drawing of the behavioral recovery test. The A7 and A8 C4da neuron axon bundles (corresponding to the A7 and A8 body segments) in the VNC were injured by laser and the larva was then subjected to three consecutive trials at 24 and 48 hr AI, respectively. In each trial, a 47°C heat probe was applied at the A7 or A8 segments. A fully recovered larva would produce a stereotypical rolling behavior in response to the heat probe and would be scored as ‘1’, otherwise as ‘0’. If the total score of the three trials was below 1 at 24 hr AI but increased to 2 or 3 at 48 hr AI, the larva was defined as recovered. (B, C) The behavioral recovery test was performed at 24 hr and 48 hr after VNC injury (A7 and A8 bundles). Larvae expressing optoRaf or optoAKT exhibit significantly accelerated recovery in response to light stimulation. (B) Qualification of the total scores at each time point. WT (uninjured) N = 15, WT (light) N = 22, optoRaf (light) N = 32, optoRaf (dark) N = 23, optoAKT (light) N = 26, optoAKT (dark) N = 28. Data are mean ± SEM, analyzed by two-way ANOVA followed by Tukey's multiple comparisons test. (C) Qualification of the recovery percentage. The data were analyzed by Fisher's exact test, p=0.0230, p=0.7222, p=0.0167, p=1.000. *p<0.05, **p<0.01.
-
Figure 6—source data 1
Activation of optoRaf or optoAKT promotes functional regeneration after CNS injury.
- https://cdn.elifesciences.org/articles/57395/elife-57395-fig6-data1-v2.xlsx
Videos
Video 1
Reversible optogenetic stimulation of Raf membrane recruitment with optoRaf resolved by live-cell imaging in BHK21 cells.
Cells were cotransfected with CIBN-EGFP-CaaX and CRY2-mCh-Raf1, and recovered overnight before imaging. Blue and green light (exposure time 200 ms) were applied every 2 s until the fluorescence intensity of mCherry on the plasma membrane does not change. Cells were left on the microscope in the dark from 30 min to allow for membrane dissociation of CRY2-mCh-Raf. In the next cycle, the same light pattern was repeated and membrane recruitment of CRY2-mCh-Raf was recorded.
Video 2
Reversible optogenetic stimulation of AKT membrane recruitment with optoAKT resolved by live-cell imaging in BHK21 cells.
Cells were cotransfected with CIBN-EGFP-CaaX and CRY2-mCh-AKT, and recovered overnight before imaging. Blue and green light (exposure time 200 ms) were applied every 10 s until the fluorescence intensity of mCherry on the plasma membrane does not change. Cells were left on the microscope in the dark from 30 min to allow for membrane dissociation of CRY2-mCh-AKT. In the next cycle, the same light pattern was repeated and membrane recruitment of CRY2-mCh-AKT was recorded.
Video 3
Optogenetic activation of optoRaf causes nuclear translocation of ERK2-EGFP in BHK21 cells.
Cells were transfected with optoRaf (CIBN-CaaX and CRY2-mCh-Raf1) and ERK2-EGFP, and recovered overnight before imaging. Blue and green light (exposure time 200 ms) were applied every 10 s. Nuclear translocation of ERK2-EGFP was recorded.
Video 4
Optogenetic activation of optoAKT causes retreatment of FOXO3-EGFP from the nucleus into the cytoplasm in BHK21 cells.
Cells were transfected with optoAKT (CIBN- CaaX and CRY2-mCh-AKT) and FOXO3-EGFP, and recovered overnight before imaging. Blue and green light (exposure time 200 ms) were applied every 1 min. Nuclear export of FOXO3-EGFP was recorded.
Tables
Key resources table
| Reagent type (species) or resource | Designation | Source or reference | Identifiers | Additional information |
|---|---|---|---|---|
| Gene (Homo sapiens) | Raf1 | PMID:24667437 | NCBI Gene ID: 207 | |
| Gene (Homo sapiens) | AKT | PMID:27082641 | NCBI Gene ID: 5894 | |
| Strain, strain background (D. melanogaster) | 19–12-Gal4 | PMID:21068723 | FLYB: FBti0148308 | FlyBase symbol: P{GAL4}19–12 |
| Strain, strain background (D. melanogaster) | repo-Gal80 | PMID:19091965 | FLYB: FBtp0067904 | Flybase symbol: P{repo-GAL80.L} |
| Strain, strain background (D. melanogaster) | ppk-CD4-tdGFP | PMID:21606367 | BDSC: 35842 FLYB: FBti0143429 RRID:BDSC_35842 | Flybase symbol: P{ppk-CD4-tdGFP}1b |
| Strain, strain background (D. melanogaster) | ppk-Gal4 | PMID:21606367 | BDSC: 32079 FLYB: FBti0131208 RRID:BDSC_32079 | Flybase symbol: P{ppk-GAL4.G}3 |
| Strain, strain background (D. melanogaster) | UAS-optoRaf | This paper | Transgenic fly with inducible expression of optoRaf, Dr. Yuanquan Song | |
| Strain, strain background (D. melanogaster) | UAS-optoAKT | This paper | Transgenic fly with inducible expression of optoAKT, Dr. Yuanquan Song | |
| Cell line (Homo sapiens) | HEK293T | PMID:32277988 | Dr. Lin-Feng Chen | |
| Cell line (Rattus norvegicus) | PC12 | PMID:22206868 | Dr. Tobias Meyer | |
| Cell line (Mesocricetus auratus) | BHK-21 | PMID:26080442 | Dr. Steven Chu | |
| Transfected construct (Homo sapiens) | pEGFP N1 CRY2-mCh-Raf1-P2A-CIBNx2-EGFP-CAAX | This paper | OptoRaf, CIBN-CRY2 based Raf membrane translocation system. Dr. Kai Zhang | |
| Transfected construct (Homo sapiens) | pEGFP N1 CRY2-mCh-Raf1 S338A-P2A-CIBNx2-EGFP-CAAX | This paper | OptoRaf S338A CIBN-CRY2 based Raf S338A membrane translocation system. Dr. Kai Zhang | |
| Transfected construct (Homo sapiens) | pEGFP N1 CRY2-mCh-AKT-P2A-CIBNx2-EGFP-CAAX | This paper | OptoAKT, CIBN-CRY2 based AKT membrane translocation system. Dr. Kai Zhang | |
| Transfected construct (Arabidopsis thaliana) | pEGFP C1 CIBN-EGFP-CAAX | PMID:21037589 | Dr. Chandra Tucker | |
| Transfected construct (Homo sapiens) | pEGFP C1 Raf1-EGFP-CaaX | PMID:24667437 | A constitutively active form of Raf1. Dr. Kai Zhang | |
| Transfected construct (Rattus norvegicus) | pEGFP N1 ERK2-EGFP | PMID:24667437 | Fluorescently label ERK2 for nuclear translocation assay. Dr. Kai Zhang | |
| Transfected construct (Homo sapiens) | pEGFP N1 FOXO3-EGFP | PMID:10102273 | Fluorescently labeled FOXO3 for nuclear export assay. Dr. Kai Zhang | |
| Antibody | Anti-Phospho-p44/42 MAPK (Erk1/2) (Thr202/Tyr204), rabbit monoclonal | Cell Signaling Technology | Cat# 4370T RRID:AB_2315112 | IF (1:400) |
| Antibody | Anti-Phospho-Drosophila p70 S6 Kinase (Thr398), rabbit polyclonal | Cell Signaling Technology | Cat# 9209S RRID:AB_2269804 | IF (1:100) |
| Antibody | Phospho-p44/42 MAPK (Erk1/2) (Thr202/Tyr204), rabbit polyclonal | Cell Signaling Technology | Cat# 9101S RRID:AB_331646 | WB (1:1000) |
| Antibody | p44/42 MAPK (Erk1/2), rabbit polyclonal | Cell Signaling Technology | Cat# 9102S RRID:AB_330744 | WB (1:1000) |
| Antibody | c-Raf, rabbit polyclonal | Cell Signaling Technology | Cat# 9422S RRID:AB_390808 | WB (1:1000) |
| Antibody | Phospho-c-Raf (Ser338) (56A6), rabbit monoclonal | Cell Signaling Technology | Cat# 9427S RRID:AB_2067317 | WB (1:1000) |
| Antibody | Phospho-Akt (Ser473) (D9E) XP, rabbit monoclonal | Cell Signaling Technology | Cat# 4060S RRID:AB_2315049 | WB (1:1000) |
| Antibody | Phospho-Akt (Thr308) (244F9), rabbit monoclonal | Cell Signaling Technology | Cat# 4056S RRID:AB_331163 | WB (1:1000) |
| Antibody | Akt (pan) (C67E7), rabbit monoclonal | Cell Signaling Technology | Cat# 4691S RRID:AB_915783 | WB (1:1000) |
| Antibody | PLCγ1, rabbit polyclonal | Cell Signaling Technology | Cat# 2822S RRID:AB_2163702 | WB (1:1000) |
| Antibody | Phospho-PLCγ1 (Tyr783), rabbit polyclonal | Cell Signaling Technology | Cat# 2821S RRID:AB_330855 | WB (1:1000) |
| Antibody | GAPDH (14C10) Rabbit monoclonal | Cell Signaling Technology | Cat# 2118S RRID:AB_561053 | WB (1:1000) |
| Antibody | Anti-rabbit IgG, HRP-linked Antibody (Goat anti-rabbit) | Cell Signaling Technology | Cat# 7074S RRID:AB_2099233 | WB (1:1000) |
| Antibody | fluorescence-conjugated secondary antibodies (Donkey anti-rabbit 647) | Jackson ImmunoResearch | Cat# 711-605-152 RRID:AB_2492288 | WB (1:1000) |
| Recombinant DNA reagent | pACU2 (plasmid) | PMID:21606367 | RRID:Addgene_31223 | |
| Chemical compound, drug | VECTASHIELD Antifade Mounting Medium (with DAPI) | Vector Laboratories | Cat# H-1200 | |
| Software, algorithm | ImageJ (Fiji) | http://fiji.sc | RRID:SCR_002285 | |
| Software, algorithm | NeuronStudio | https://biii.eu/neuronstudio | RRID:SCR_013798 |
Additional files
Download links
A two-part list of links to download the article, or parts of the article, in various formats.
Downloads (link to download the article as PDF)
Open citations (links to open the citations from this article in various online reference manager services)
Cite this article (links to download the citations from this article in formats compatible with various reference manager tools)
Optical control of ERK and AKT signaling promotes axon regeneration and functional recovery of PNS and CNS in Drosophila
eLife 9:e57395.
https://doi.org/10.7554/eLife.57395


