Real-time in vivo imaging of extracellular ATP in the brain with a hybrid-type fluorescent sensor
- Department of Pharmacology, Graduate School of Medicine, The University of Tokyo, Japan
- Department of Physiology, Graduate School of Medicine, The University of Tokyo, Japan
- Graduate School of Pharmaceutical Sciences, The University of Tokyo, Japan
- Graduate School of Medicine, The University of Tokyo, Japan
- Department of Cellular and Molecular Pharmacology, Nihon University School of Medicine, Japan
- International Research Center for Neurointelligence, The University of Tokyo Institutes for Advanced Study, The University of Tokyo, Japan
Figures
Figure 1 with 1 supplement
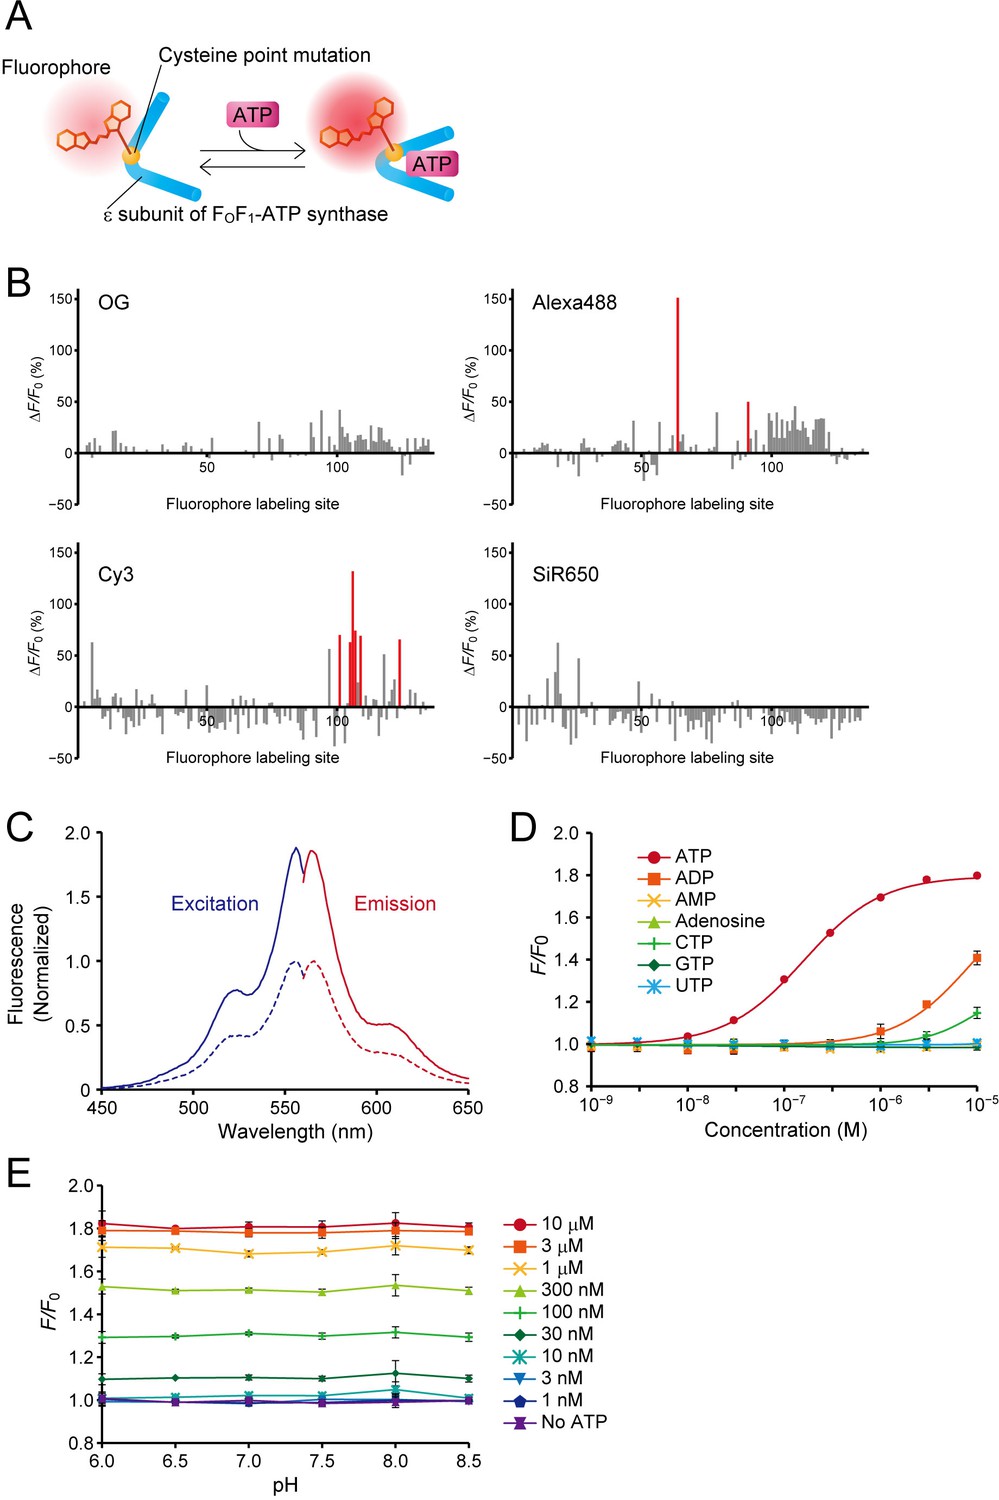
Design, optimization, and characterization of ATPOS in vitro.
. (A) Schematic illustration of a hybrid-type ATP sensor composed of the ε subunit of FoF1-ATP synthase having a cysteine point mutation at which a small-molecule fluorophore is conjugated. (B) Results of HyFInD screening. Bars indicate fluorescence changes (ΔF/F0) of fluorescence conjugates labeled with OG (upper left), Alexa488 (upper right), Cy3 (bottom left), and SiR650 (bottom right) in response to 2 mM ATP. The numbers 1–134 on the horizontal axis represent the positions in the amino-acid sequence at which cysteine point mutation is introduced for fluorophore labeling. The fluorescent conjugates indicated by red bars were tested in the second screening. (C) Normalized excitation (blue) and emission spectra (red) of ATPOS with (solid line) or without 1 mM ATP (dashed line). (D) Dose-response curves of ATPOS to ATP, ADP, AMP, adenosine, CTP, GTP, and UTP (n = 3). Plots were fitted with the Hill equation. (E) The pH dependence of ATPOS. Fluorescence intensities normalized to the fluorescence intensity at pH 7.4 without ATP (F/F0) are plotted as a function of pH (n = 3). Data are presented as mean ± SEM. In some figures, error bars representing SEM are smaller than the symbols indicating the mean.
Figure 1—figure supplement 1
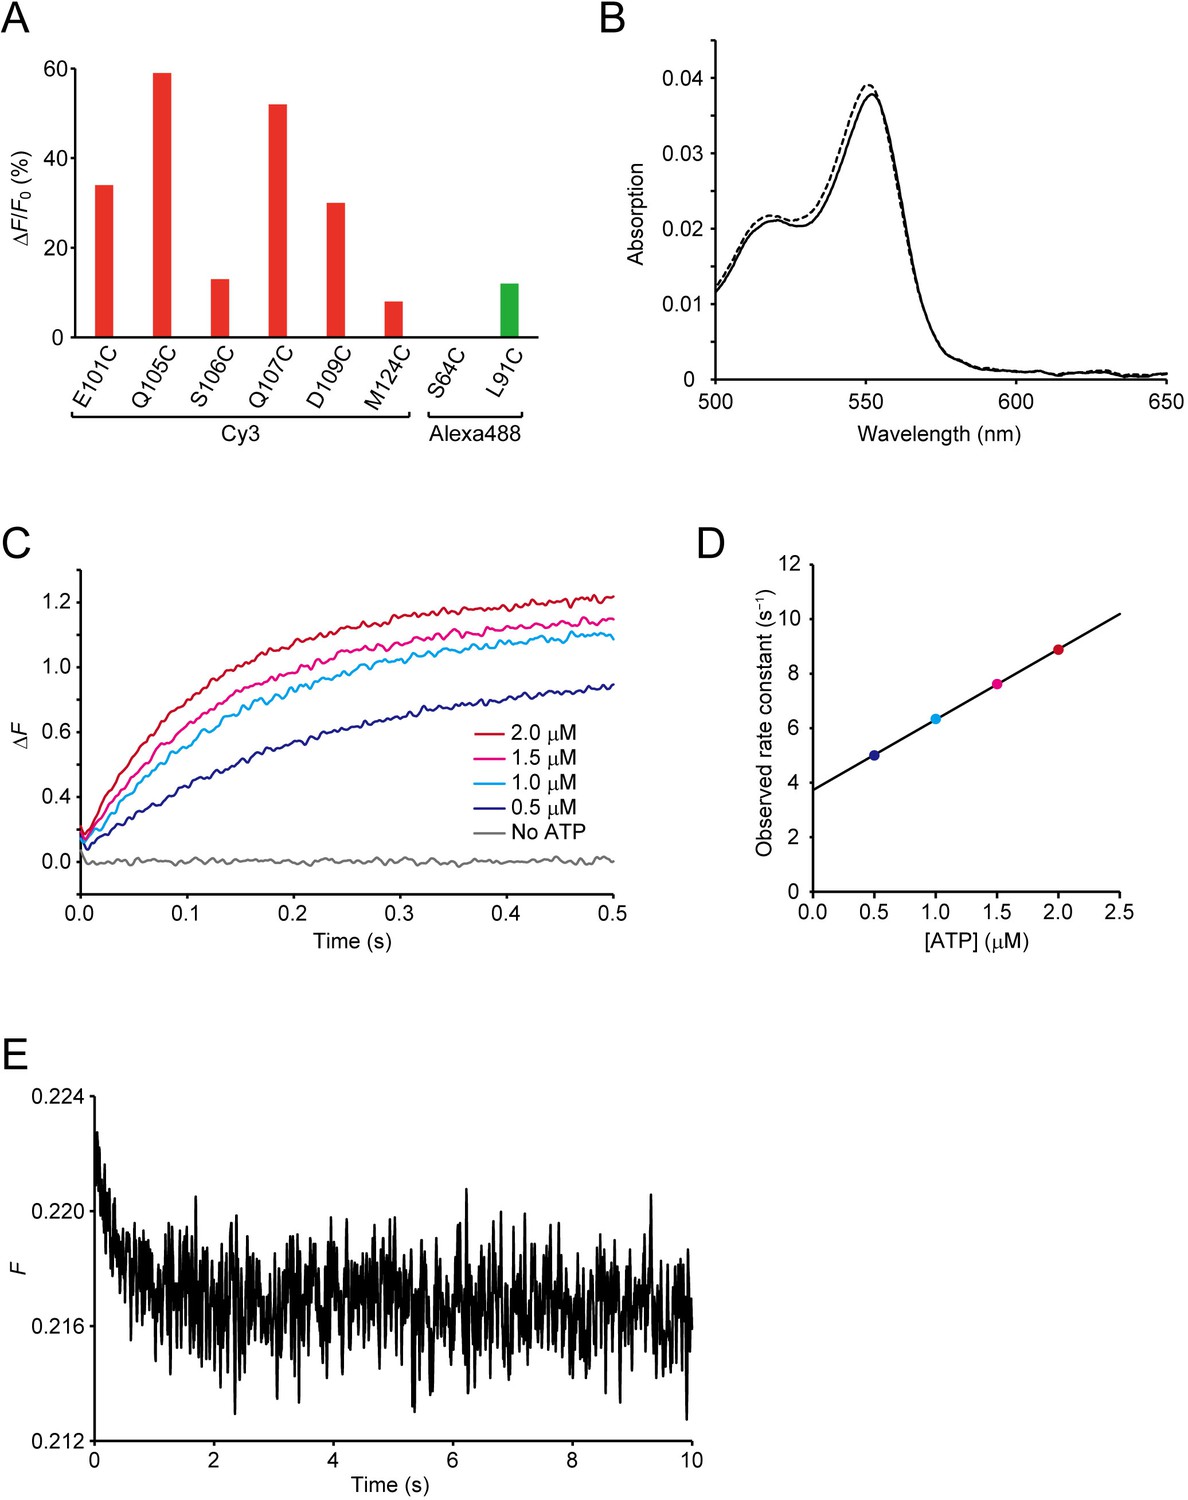
Screening and characterization of ATPOS.
(A) Fluorescence changes (ΔF/F0) of selected candidate sensors labeled with Cy3 (red) and Alexa488 (green) in response to 200 nM ATP. (B) Absorption spectra of ATPOS with (solid line) or without 1 mM ATP (dashed line). (C) Time courses of the changes in fluorescence intensity (ΔF) of ATPOS upon addition of ATP at concentrations of 0, 0.5, 1.0, 1.5, and 2.0 μM (n = 5). (D) The concentration dependence of the observed rate constants. Observed rate constants determined by fitting the fluorescence changes of ATPOS upon ATP addition to single exponential equations (see Methods) were plotted as a function of ATP concentration. (E) A time course of fluorescence intensity (F) of ATPOS after dilution of ATP from 200 nM to 100 nM (n = 5).
Figure 2 with 1 supplement
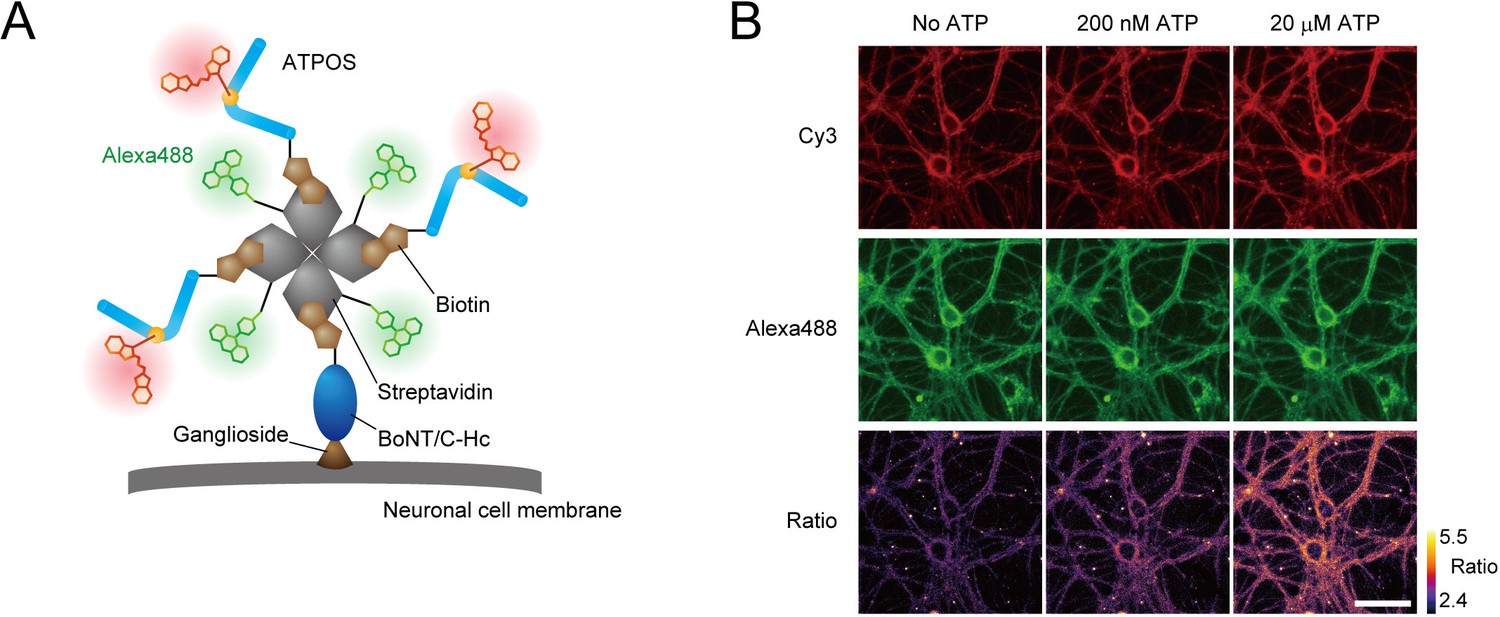
Anchoring of ratiometric ATPOS on the surface of cultured neurons.
(A) Strategy for anchoring of ratiometric ATPOS on neuronal surfaces. ATPOS is tethered to neuronal cells by BoNT/C-Hc, which binds to neuronal surface gangliosides. ATPOS and BoNT/C-Hc are coupled via a biotin-streptavidin linkage. Streptavidin labeled with Alexa488 is used for ratiometry. The scheme illustrates the ideal form of the ATPOS complex, assuming that a mixing molar ratio (3:1:1) of ATPOS, streptavidin and BoNT/C-Hc is preserved. The actual stoichiometry of the components may differ from that in the scheme. (B) Representative images of cultured neurons labeled with the ATPOS complex in the absence (left) or presence of 200 nM (middle) or 20 μM ATP (right). Scale bar, 50 μm.
Figure 2—figure supplement 1
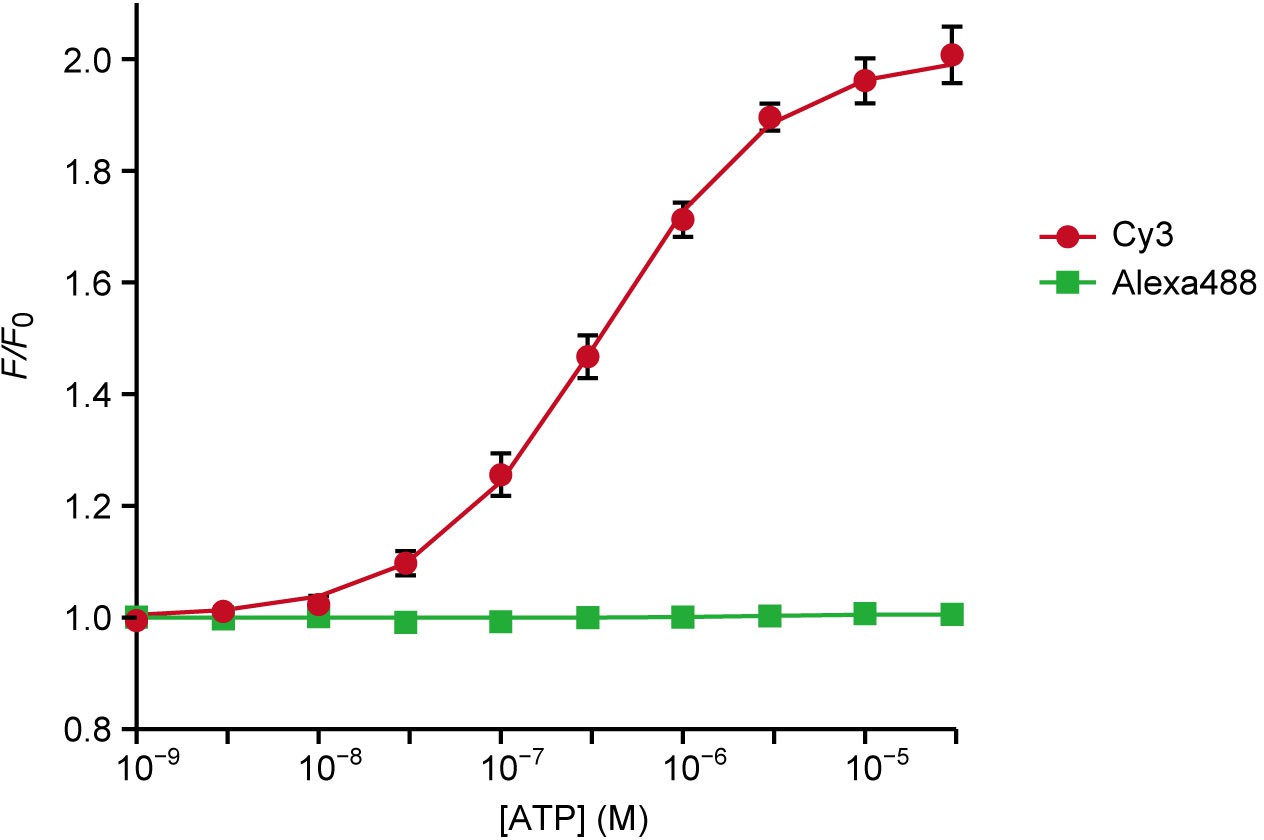
Sensitivity of ATPOS complex for ATP in vitro.
Dose-response curves of Cy3 (red) and Alexa488 (green) fluorescence intensities of ATPOS complex to ATP (n = 3). Plots were fitted with the Hill equation. Data are presented as mean ± SEM. Some error bars representing SEM are smaller than the symbols indicating the mean.
Figure 3 with 3 supplements

Imaging of extracellular ATP in mouse cerebral cortex.
(A) Schematic illustration of application of ATPOS to the mouse cerebral cortex: top (left) and side (right) views. ATPOS is pressure-injected with a fine glass pipette through a cranial window. (B) Representative images showing the ratiometric fluorescence response (R/R0) of ATPOS upon application of 10 mM ATP (top) or vehicle (bottom). The position of the glass pipette for ATP injection is depicted in the left panels. Time after the start of injection is presented above the images. Scale bar, 250 μm. (C) Averaged traces of the ratiometric fluorescence response (R/R0) of ATPOS upon application of 10 mM ATP (blue; n = 18 from five mice) or vehicle (gray; n = 11 from three mice). Magenta bar indicates the application of ATP or vehicle. Shaded regions represent SEM. (D) Averaged traces of the ratiometric fluorescence response (R/R0) of ATPOS upon application of 10 mM ATP (magenta bar) in the presence of bovine serum albumin (BSA) (light blue; n = 10 from three mice) or apyrase (dark blue; n = 14 from three mice). Shaded regions represent SEM. (E) The peak amplitudes of the ratiometric fluorescence response (R/R0) of ATPOS upon application of ATP (blue) or vehicle (gray) in the absence or presence of BSA (light blue) or apyrase (dark blue). Wilcoxon’s rank-sum test was performed. Data are presented as mean ± SEM.
Figure 3—figure supplement 1
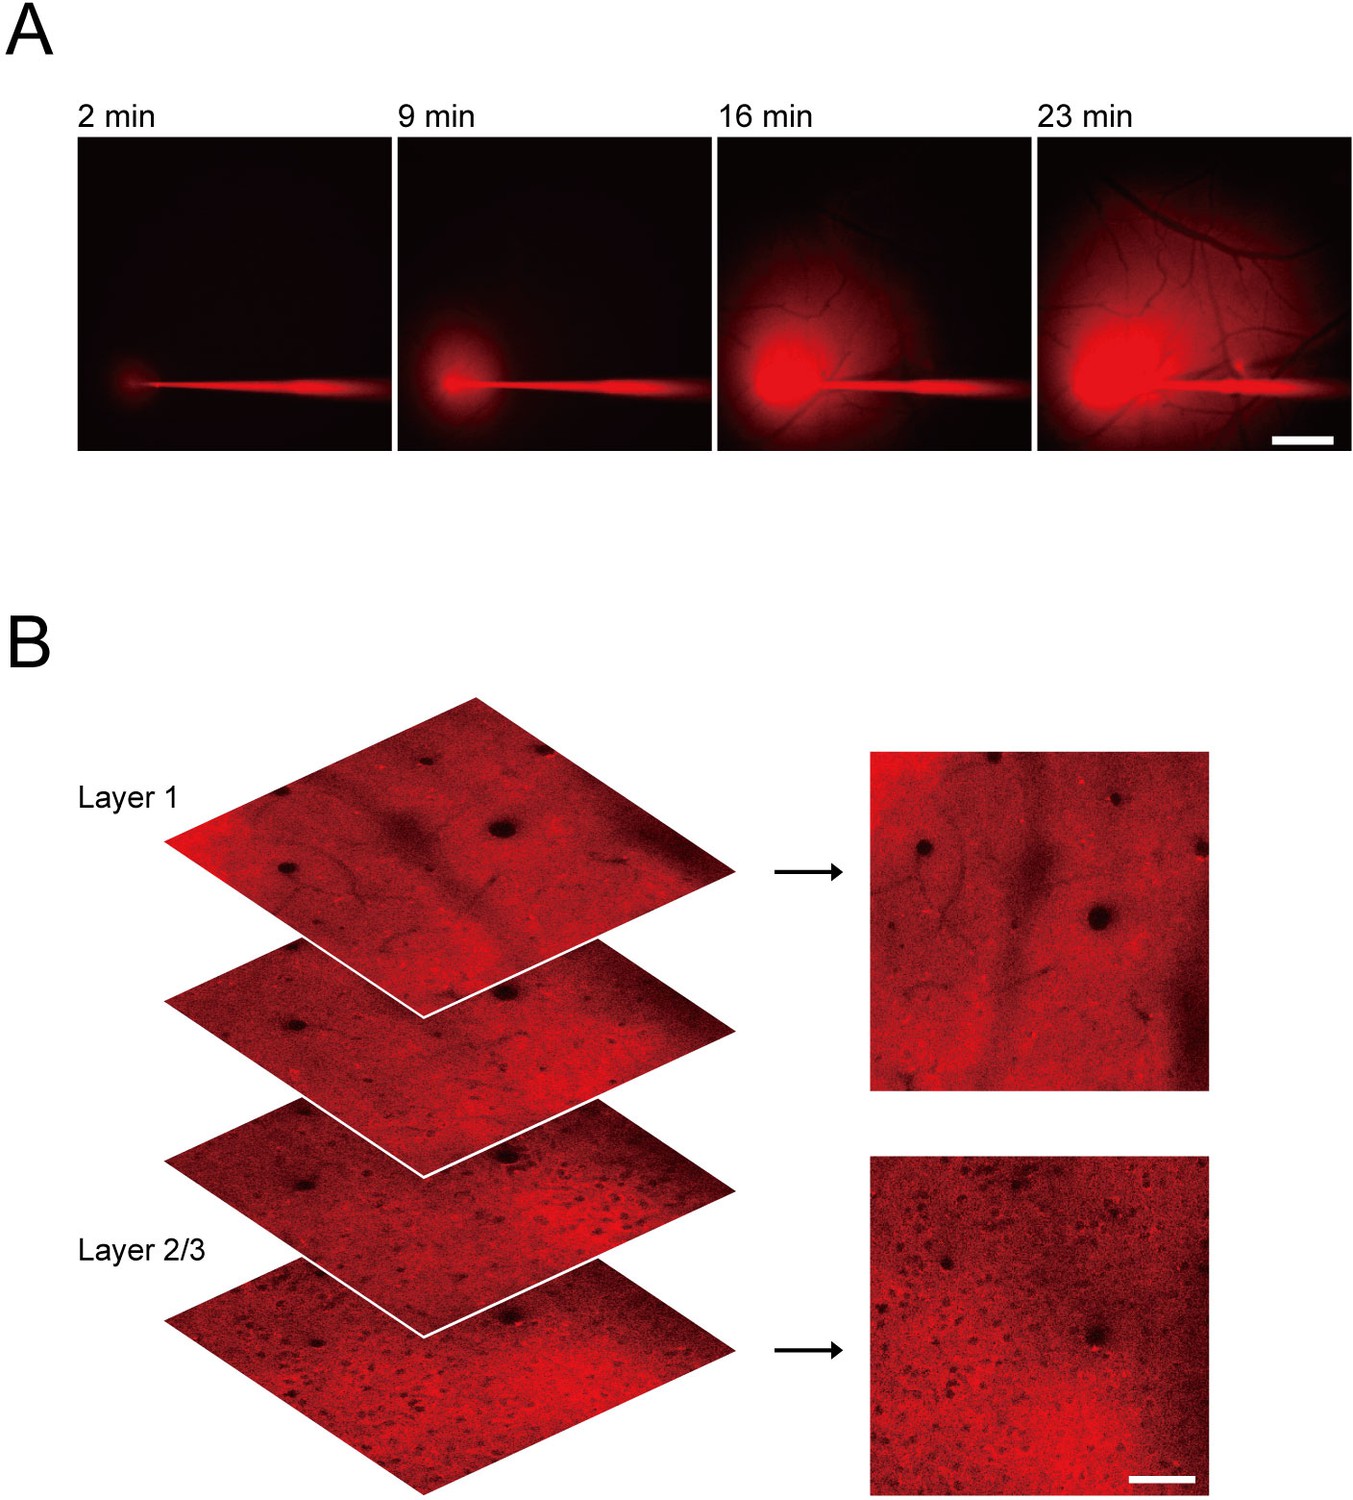
Application of ATPOS to the mouse cerebral cortex.
(A) Representative Cy3 fluorescence images during ATPOS injection into the cerebral cortex. Time after the start of injection is presented above the images. Scale bar, 500 μm. (B) Representative Cy3 fluorescence images showing the distribution of ATPOS at different layers of the cerebral cortex. Scale bar, 50 μm.
Figure 3—video 1
Ratiometric fluorescence response of ATPOS upon application of ATP.
The time relative to the start of ATP injection is presented. Scale bar, 250 μm.
Figure 3—video 2
Ratiometric fluorescence response of ATPOS upon application of vehicle.
The time relative to the start of vehicle injection is presented. Scale bar, 250 μm.
Figure 4 with 3 supplements
Imaging of extracellular ATP signaling during neuronal excitation.
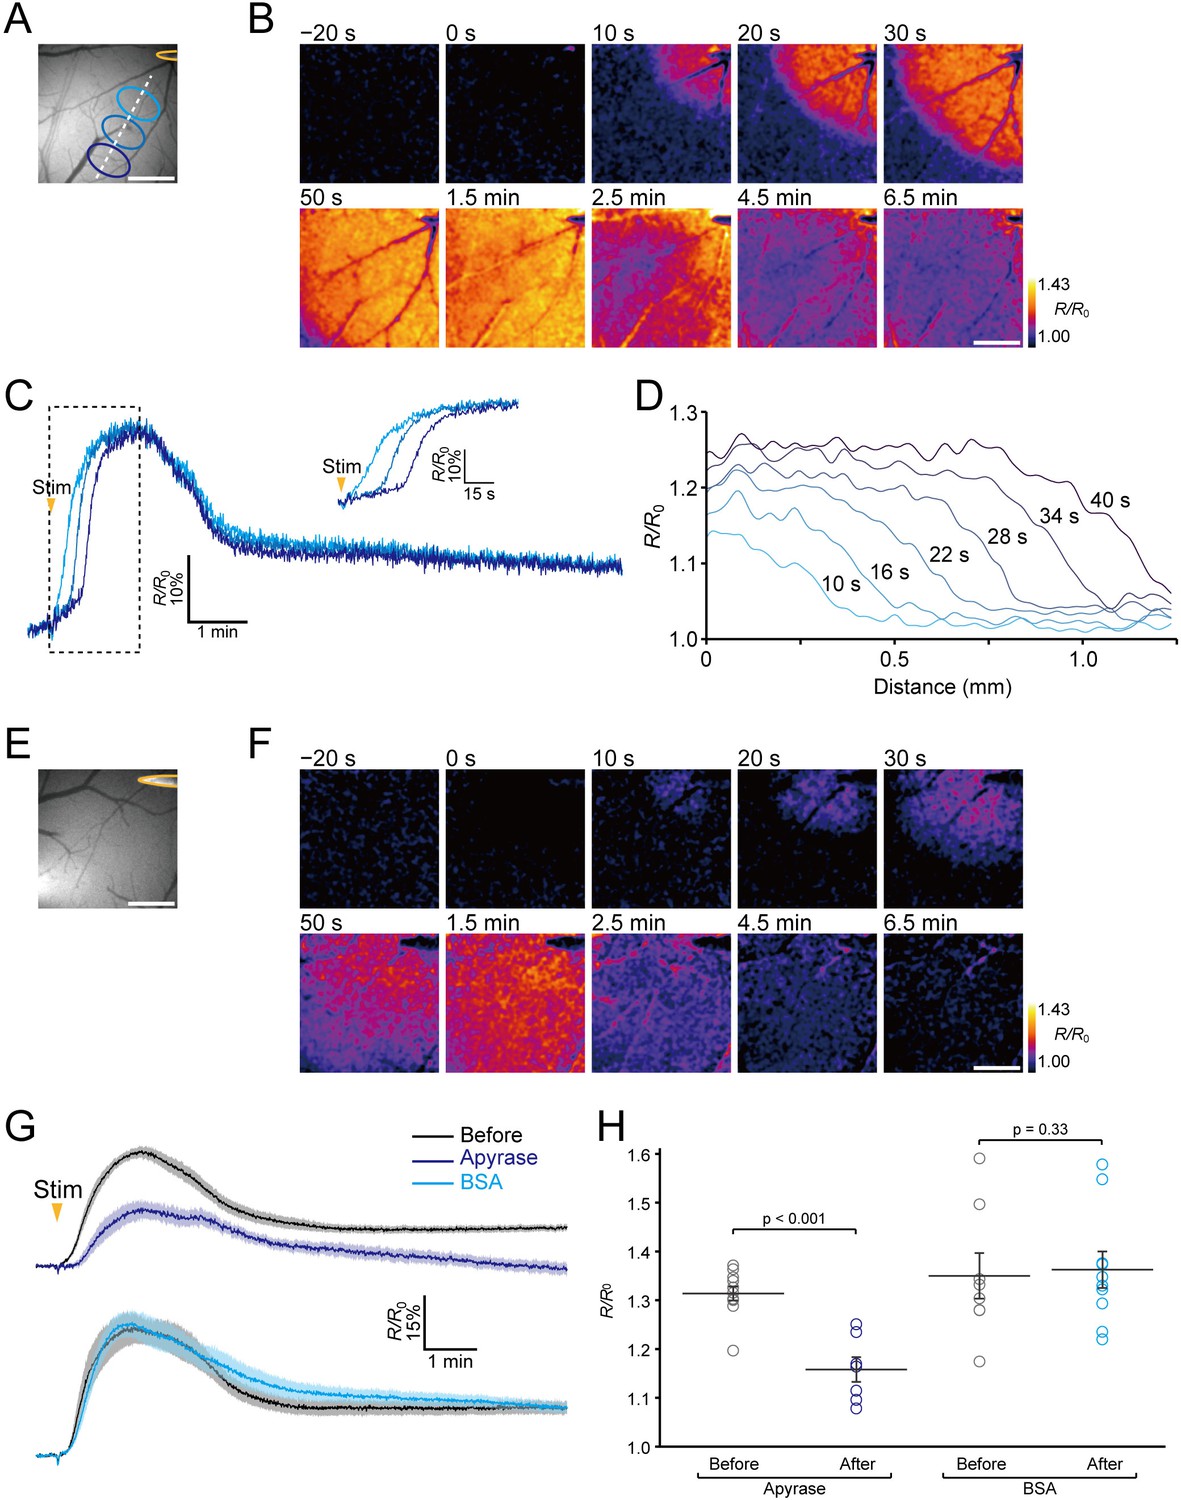
(A) The position of the stimulating electrode (yellow) and locations of ROIs. (B) Representative images of the ratiometric fluorescence response (R/R0) of ATPOS to electrical stimulation. The time after the initiation of stimulation is presented above the images. Scale bar, 500 μm. (C) Time courses of the ratiometric fluorescence response (R/R0) of ATPOS extracted from the ROIs depicted in (A). The inset shows a magnified view. (D) The spatial distribution of ratiometric fluorescence response (R/R0) of ATPOS along the line depicted in (A). The time relative to the stimulation onset is presented above the lines. (E) The position of the stimulating electrode. (F) Images of the ratiometric fluorescence response (R/R0) of ATPOS upon electrical stimulation in the presence of apyrase. Time after the initiation of stimulation is presented above the images. Scale bar, 500 μm. (G) Averaged traces of the ratiometric fluorescence response (R/R0) of ATPOS to electrical stimulation before (black; n = 11 from five mice) and after the application of apyrase (dark blue; n = 7 from five mice) (upper), and before (black; n = 8 from four mice) and after the application of BSA (light blue; n = 10 from four mice) (lower). Shaded regions represent SEM. (H) The peak amplitudes of the ratiometric fluorescence response (R/R0) of ATPOS upon electrical stimulation before (black) or after the application of apyrase (dark blue) or BSA (light blue). Wilcoxon’s rank-sum test was performed. Data are presented as mean ± SEM.
Figure 4—figure supplement 1
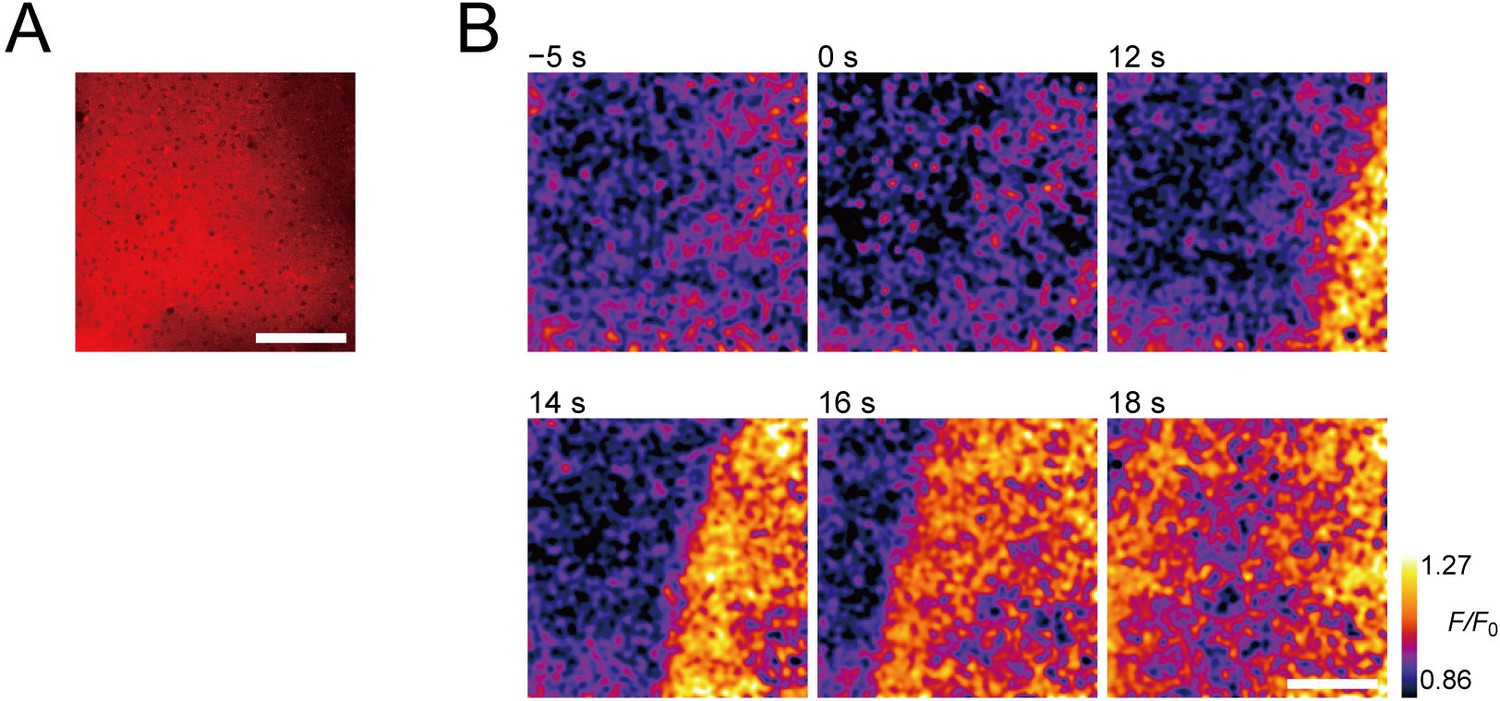
Two-photon imaging of extracellular ATP signaling during neuronal excitation.
(A) Representative Cy3 fluorescence image of layer 2/3 cerebral cortex stained with ATPOS. The stimulation electrode was located at the bottom right, but is out of the field of view. Scale bar, 100 μm. (B) Representative images showing the fluorescence response (F/F0) of ATPOS upon electrical stimulation. The time relative to the initiation of stimulation is presented above the images. Scale bar, 100 μm.
Figure 4—video 1
Ratiometric fluorescence response of ATPOS to electrical stimulation.
The time relative to the initiation of stimulation is presented. Scale bar, 500 μm.
Figure 4—video 2
Ratiometric fluorescence response of ATPOS to electrical stimulation in the presence of apyrase.
The time relative to the initiation of stimulation is presented. Scale bar, 500 μm.
Tables
Table 1
In vitro properties of ATPOS.
| λabs,max (nm) | λem,max (nm) | QY | |
|---|---|---|---|
| Cy3 | 550 | 570 | 0.04 |
| Cy3B | 558 | 572 | 0.67 |
| ATPOS (0 mM ATP) | 551 | 566 | 0.29 |
| ATPOS (1 mM ATP) | 552 | 564 | 0.62 |
Additional files
Download links
A two-part list of links to download the article, or parts of the article, in various formats.
Downloads (link to download the article as PDF)
Open citations (links to open the citations from this article in various online reference manager services)
Cite this article (links to download the citations from this article in formats compatible with various reference manager tools)
Real-time in vivo imaging of extracellular ATP in the brain with a hybrid-type fluorescent sensor
eLife 9:e57544.
https://doi.org/10.7554/eLife.57544


