Intrinsic control of muscle attachment sites matching
- Centre de Biologie du Développement (CBD), France
- Centre de Recherche sur la Cognition Animale (CRCA), France
- Centre de Biologie Intégrative (CBI), Université de Toulouse, CNRS, UPS, France
Figures
Figure 1 with 3 supplements
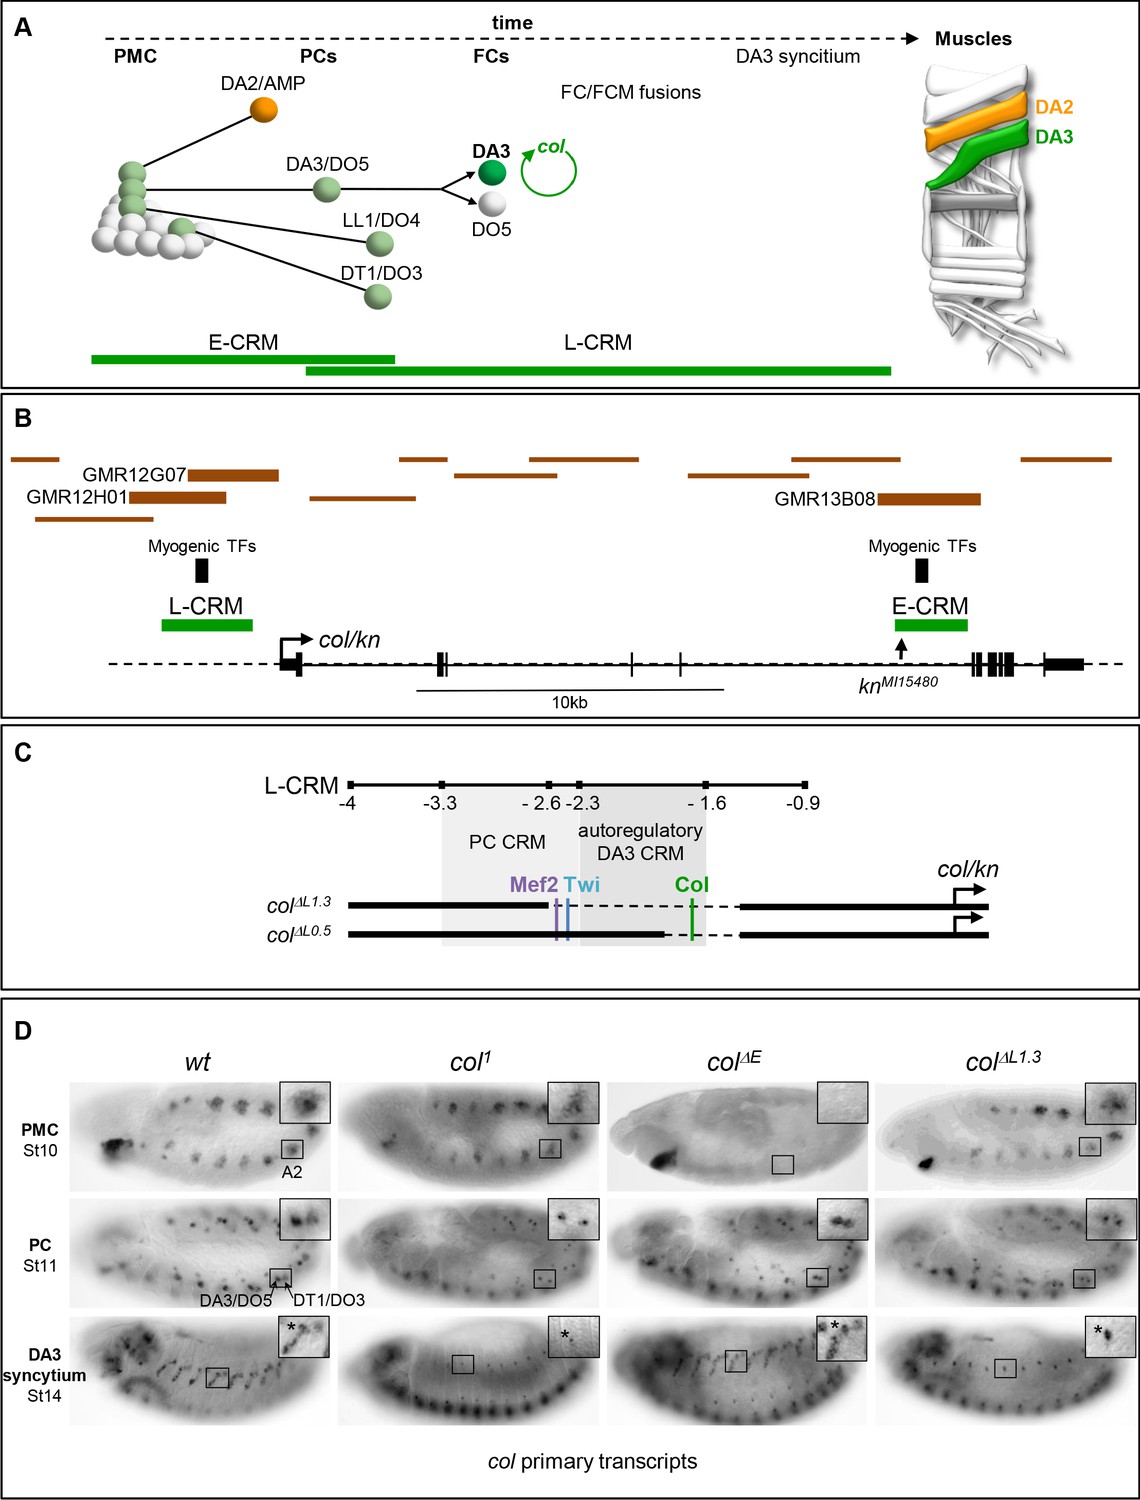
Col CRMs, CRM deletions and col transcription.
(A) Diagrammatic representation of the sequential emergence of 4 different PCs from the Col-expressing PMC (grey), division of the DA3/DO5 PC into 2 FCs and col auto-regulation in the DA3 lineage; the names of each PC and FC are indicated. Accumulation of Col protein is in green. The time windows of mesodermal early (E-CRM) and late (L-CRM) CRM activity are indicated by green lines. Right: muscle pattern of an abdominal segment highlighting DA2 (orange) and DA3 (green). (B) Schematic representation of the col transcribed region (http://flybase.org/cgi-bin/gbrowse2/dmel/?Search=1;name=FBgn0001319). The position of tested GMR and VT fragments are drawn as brown horizontal bars; the numbers are given for those active in DA3. The positions of clusters of in vivo Mef-2, Twi and Tin binding sites are indicated by vertical blue bars, the knMi15480 transposon insertion, used for the E-CRM deletion screening, by a vertical arrow. (C) Enlarged view of L-CRM indicating the juxtaposition of PC-specific and autoregulatory DA3-specific CRMs, Col, Mef2 and Twi binding sites, and the colΔL1.3 and colΔL0.5 deletions generated by CRISPR/cas9 genome editing. (D) Col transcription in wt and mutant embryos, genotypes indicated, visualised by in situ hybridisation to primary transcripts. A detail of the abdominal A2 segment (squared area) is shown in each panel. PMC col transcription is lost in colΔE embryos; stage 11, col transcription in the DA3/DO5 and DT1/DO4 PCs is detected in all strains; stage 14, DA3 syncytium transcription is lost in col1 and col ΔL1.3 embryos. * indicates col transcription in a multidendritic neuron (md).
Figure 1—figure supplement 1
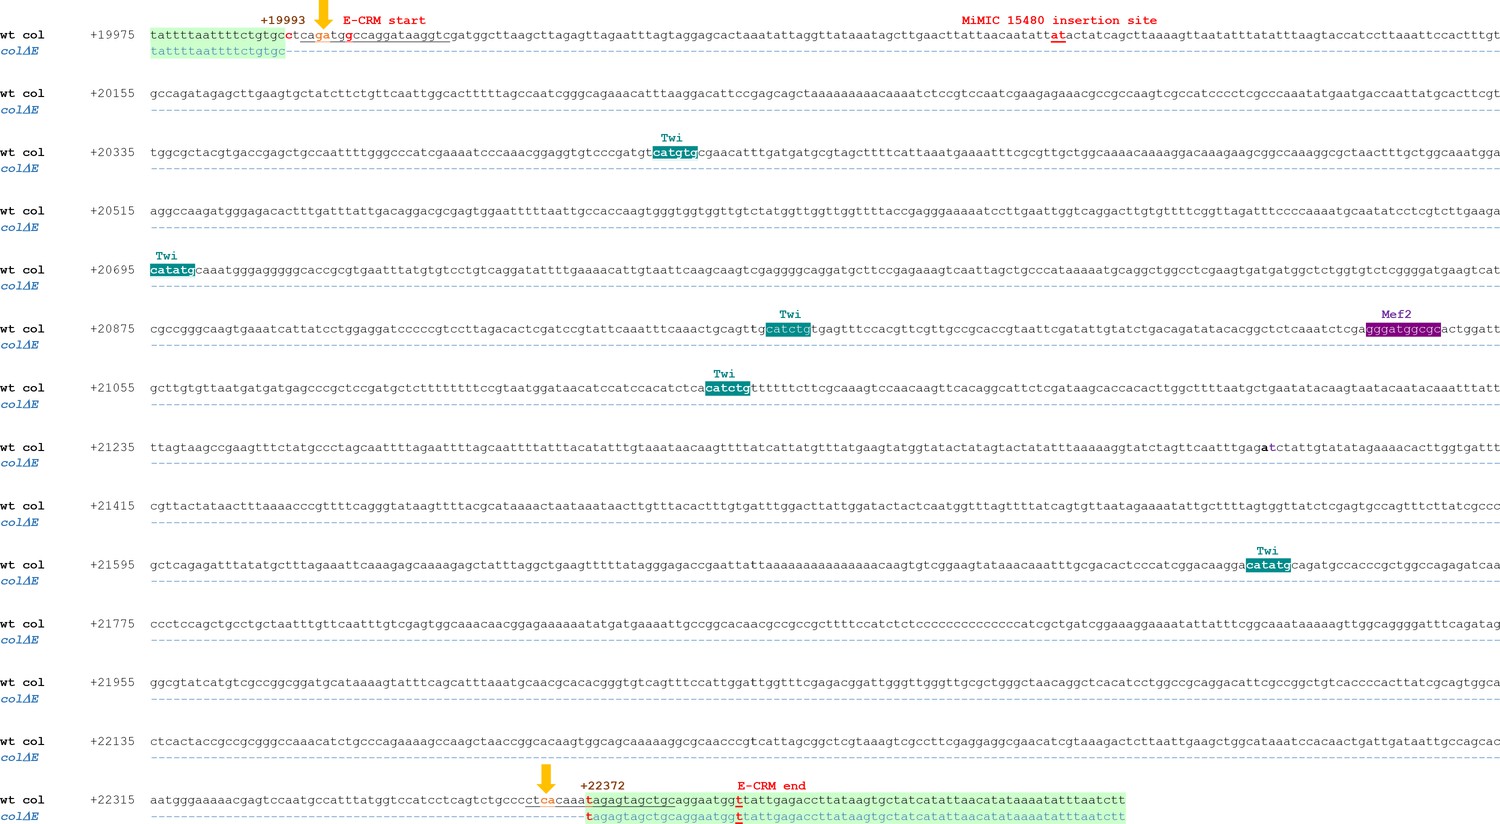
Genomic sequence of the E-CRM deletion.
Genomic sequence spanning the previously mapped E-CRM (start and end indicated in red) and the col ΔE deleted fragment (dashed blue line). The nucleotide positions of the col ΔE deletion endpoints (brown) are given relative to the col transcription start site. The predicted cleavage sites of the used sgRNAs (sequences underlined) are indicated by yellow arrows. The MiMIC 15480 used for the screening of the deletion is inserted between the red underlined nucleotides. Predicted binding sites for Twist (blue) and Mef2 (purple), conserved between Drosophila species.
Figure 1—figure supplement 2
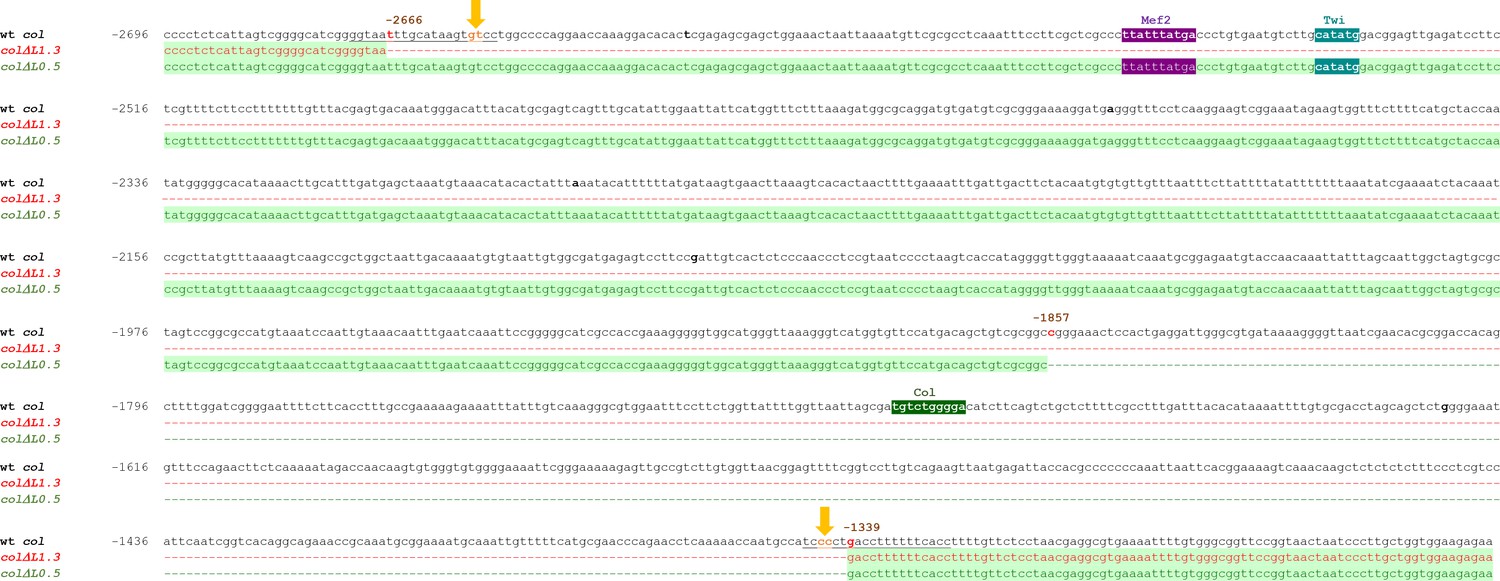
Genomic sequence of the L-CRM deletions.
Genomic sequence spanning the col ΔL1.3 (from −2666 to −1339) and col ΔL0.5 (from −1857 to −1339) deletions. Deleted fragments are represented by dashed lines and their coordinates given relative to col transcription start site. The predicted cleavage sites of the used sgRNAs (sequences underlined) are indicated by yellow arrows. Predicted binding sites for Twist (blue), Mef2 (purple), and Col (green), conserved between Drosophila species.
Figure 1—figure supplement 3
Mapping of a PC-specific CRM.
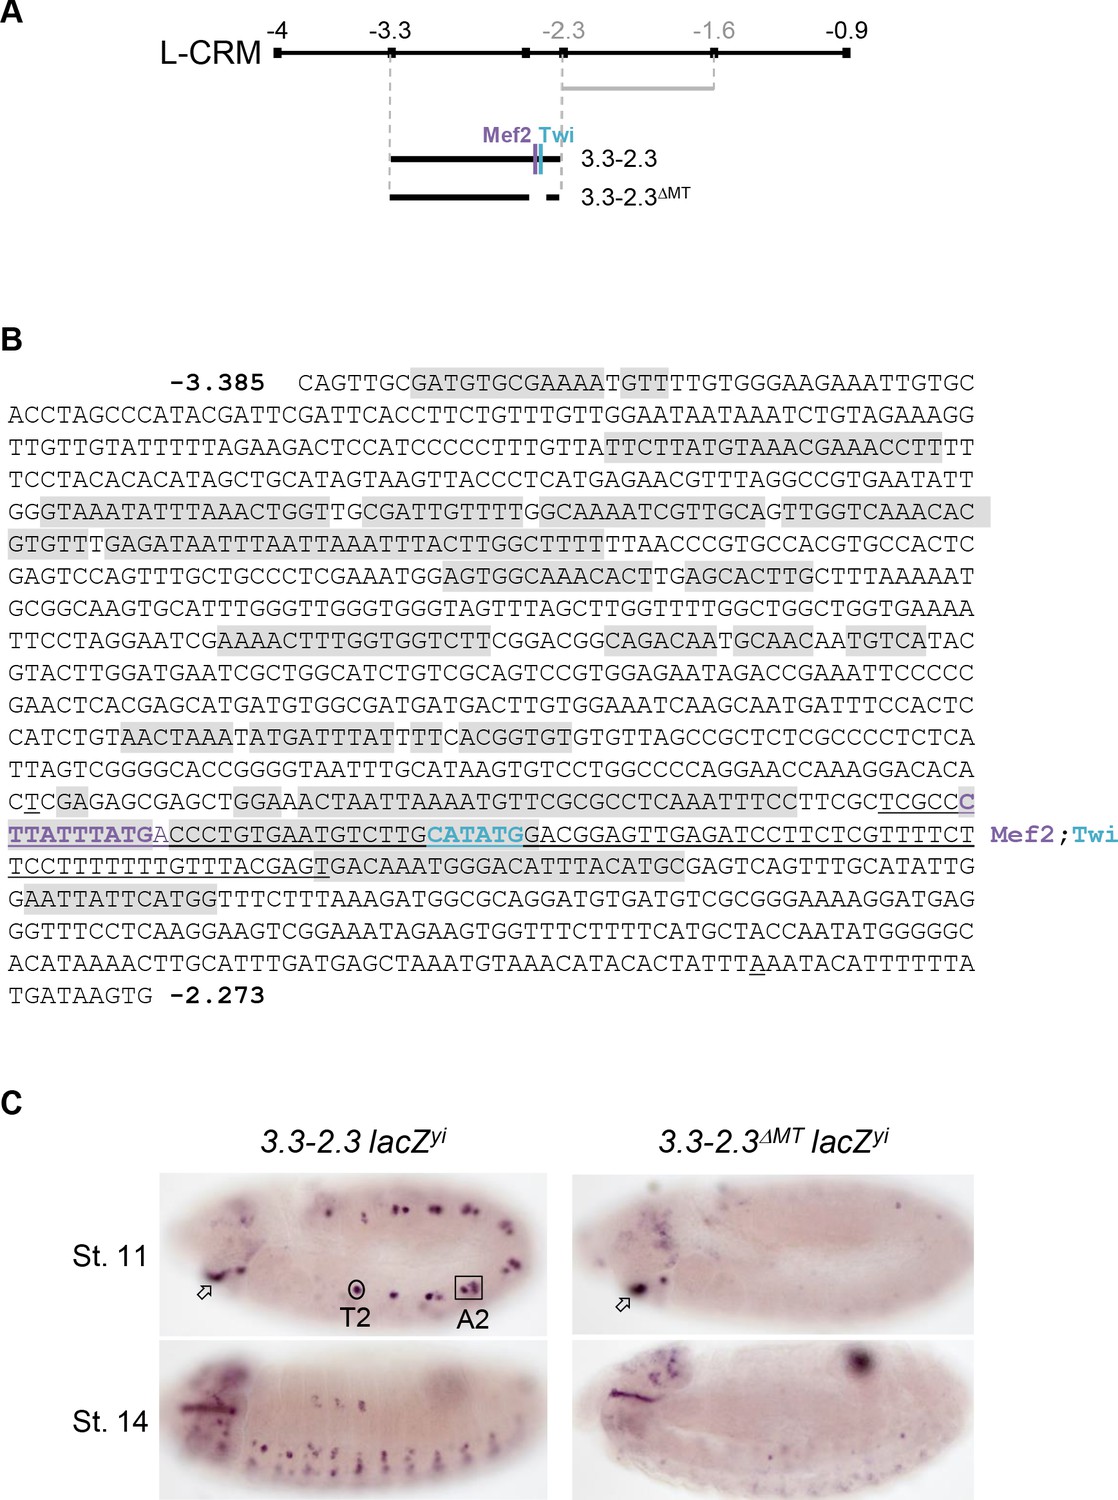
(A) Schematic representation of col L-CRM (see also Figure 1) indicating the positions of the −2.3 to −1.6 fragment (grey) previously shown to drive expression in the DA3 syncytium and new reporter constructs, −3.3–2.3 and −3.3–2.3 ΔMT with the position of conserved Mef2 and Twi binding sites. (B) Nucleotide sequence of the −3.3–2.3 fragment, positions −3385 to −2273. The >20 bp sequence motifs that are more than 90% conserved at the same relative positions in D. melanogaster, D. pseudobscura and D. virilis are shaded in grey. The 97 bp segment containing both Mef2 (purple) and Twi (blue) binding and deleted in 3.3–2.3ΔMT is underlined. (C) In situ hybridisation to primary reporter transcripts (yellow intron (yi) inserted in the lacZ coding sequence). The 3.3–2.3 fragment drives specific expression in the DA3/DO5 and DT1/DO4 PCs (circled in segment T2 and framed in A2) and the intercalary segment (arrow). Its activity in PCs is lost upon deletion of the region encompassing Mef2 and Twi binding sites (3.3–2.3ΔMT reporter).
Figure 2
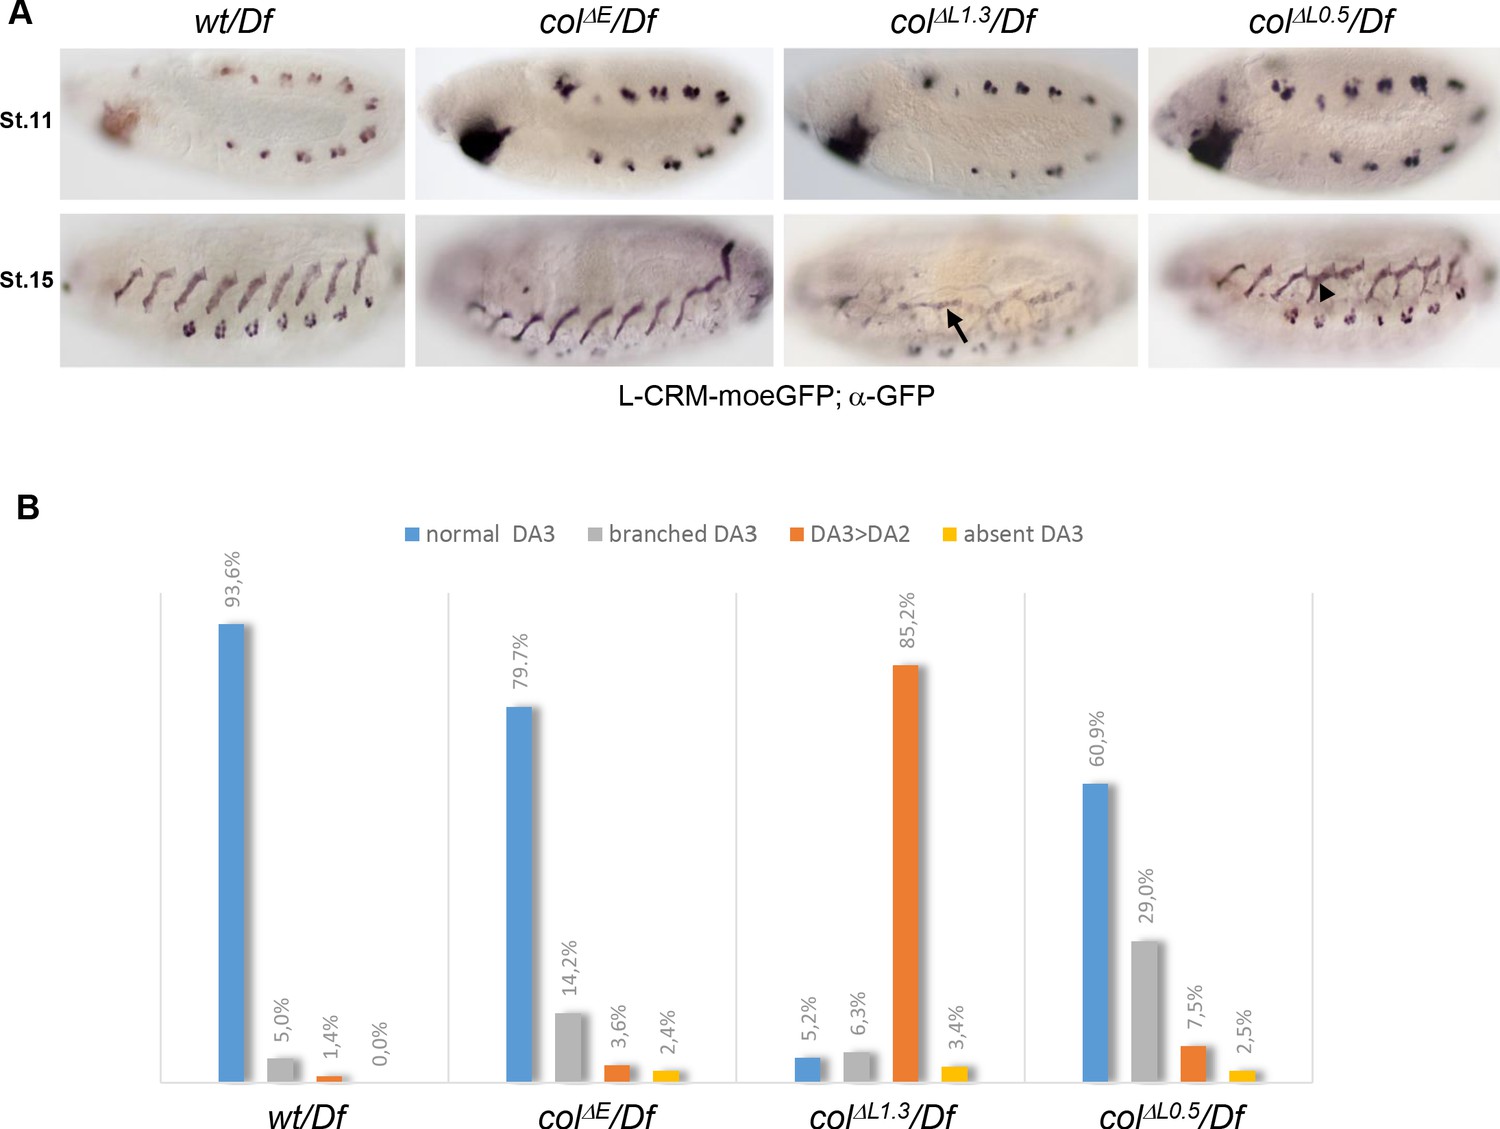
DA3 muscle transformations upon col-CRM deletions.
(A) L-CRM-moeGFP expression in stage 11 and 15 hemizygous embryos, as indicated. GFP expression in PCs at stage 11 is similar in all strains. DA3>DA2 transformations (arrow) and branched DA3 muscles (arrowhead) are observed in colΔL embryos. (B) Quantification of the relative proportions of normal DA3, branched DA3, DA3>DA2 transformation and absence of DA3 muscles in wt, colΔE, colΔL1.3 and colΔL0.5 hemizygous embryos. A minimum of 100 A1-A7 abdominal segments of stage 15–16 embryos were analysed for each genotype. (+/Df: n = 127 segments - 16 embryos; colΔE/Df: n = 170 segments - 23 embryos; colΔL1.3/Df: n = 190 segments - 27 embryos; colΔL0.5/Df: n = 103 segments - 13 embryos).
Figure 3 with 2 supplements
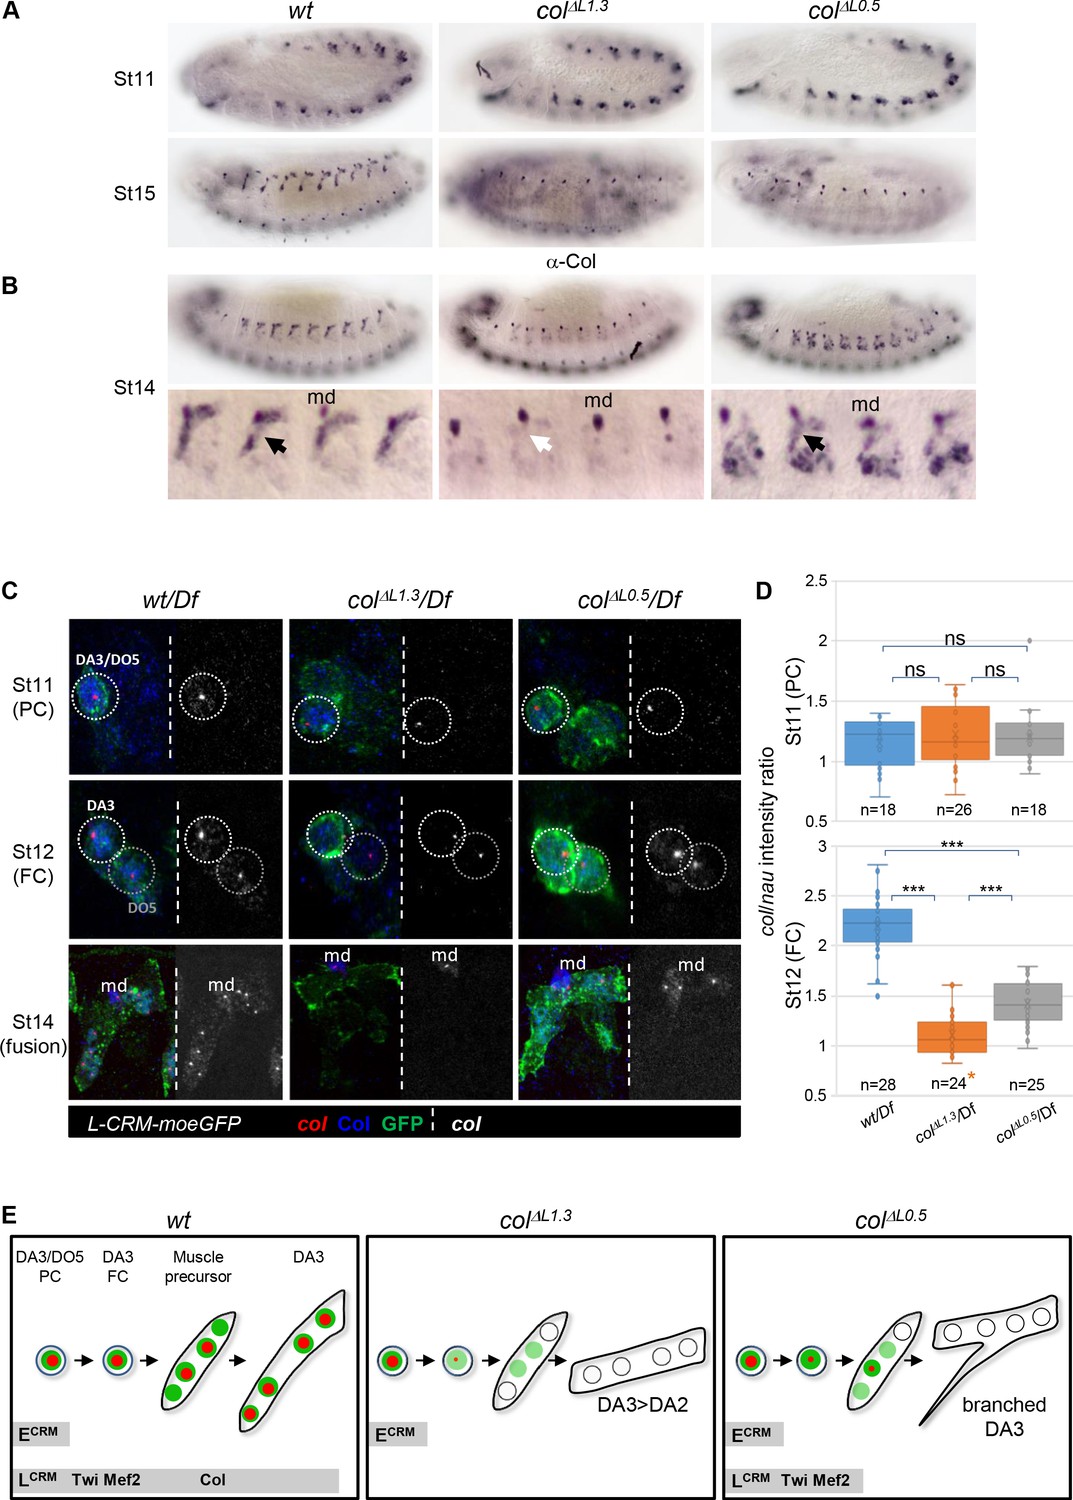
Identity reprogramming of syncytial nuclei controls the final muscle morphology.
(A) Col immunostaining of wt, colΔL1.3 and colΔL0.5 embryos, showing a normal pattern at stage 11 and complete absence of Col protein at stage 15 in both colΔL embryos. (B) Stage14 embryos with a close up view of 4 segments shows low amounts of Col protein (black arrow) in the growing DA3 muscle in colΔL0.5 and absence in col ΔL1.3 embryos (white arrow). Position of the multidendritic neuron (md) is indicated. (C) Col transcription (red dots), Col protein (blue) and L-CRM-moeGFP expression (green) in the DA3/DO5 PC, stage 11, DA3 FC, stage 12, and developing DA3 muscle, stage 14, in wt/Df, colΔL1.3/Df and colΔL0.5/Df; L-CRM-moeGFP embryos. In each panel, col transcripts are shown separately in black and white. col transcription ceases after FC stage in colΔL1.3 embryos and does not propagate to other syncytial nuclei in col ΔL0.5 embryos. (D) Quantification of col primary transcripts level in PC and FC nuclei; orange asterisk: col transcription in FCs is generally lost in colΔL1.3 embryos; quantification was done on a small fraction of FCs; n: number of PC or FC analysed, using 5 or six embryos at each stage 11 and 12; 15 colΔL1.3 embryos were used for the FC stage (Mean ± sem and ***: p<0.001). (E) Schematic representation of the dynamics of col transcription (red dots) and Col protein (green) in the DA3/DO5 PC, the DA3 FC, muscle precursor, and DA3, DA3>DA2 and branched DA3 muscles in wt, colΔ1.3 and col ΔL0.5 embryos, respectively. Temporal activity of E-CRM and L-CRM is represented by horizontal grey bars.
Figure 3—figure supplement 1
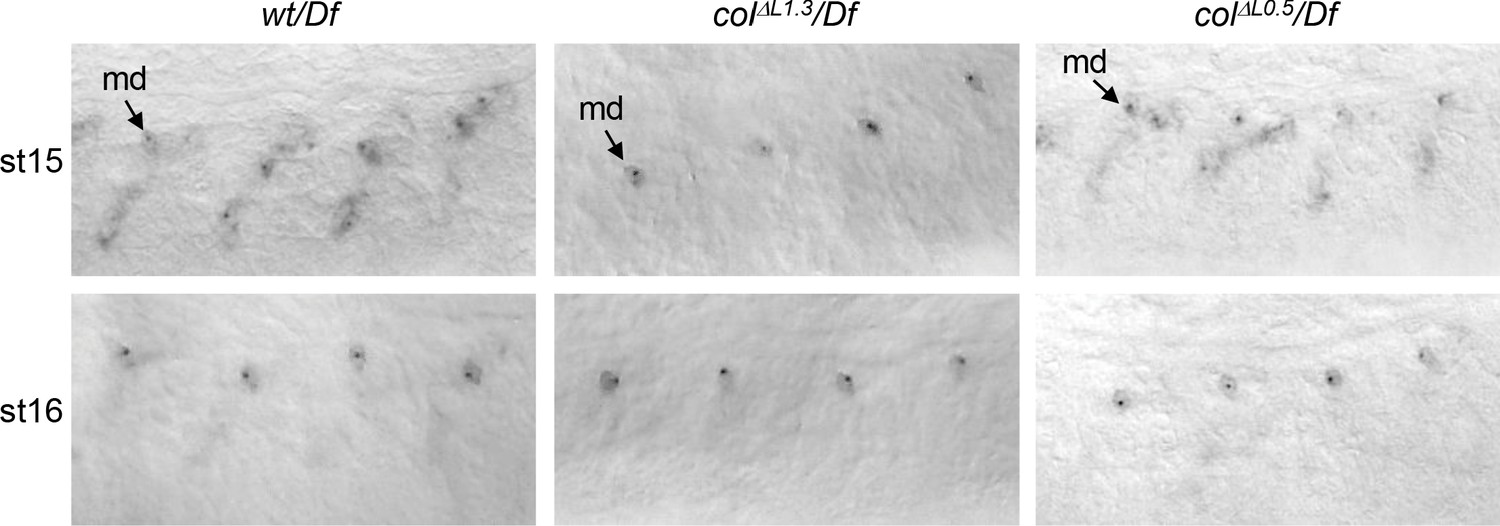
Col transcription in colΔL0.5 and colΔL1.3 embryos In situ hybridisation to col primary transcripts in stage 15 and 16 wt/Df, colΔL1.3/Df and colΔL0.5/Df embryos.
At stage 15, dots corresponding to col transcription are detected in syncytial DA3 nuclei in wt and colΔL0.5/Df embryos. At stage 16, col transcription is no more detected neither in control nor in L-CRM deletions, except in multidendritic (md) ddaC neurons, indicated by an arrow.
Figure 3—figure supplement 2
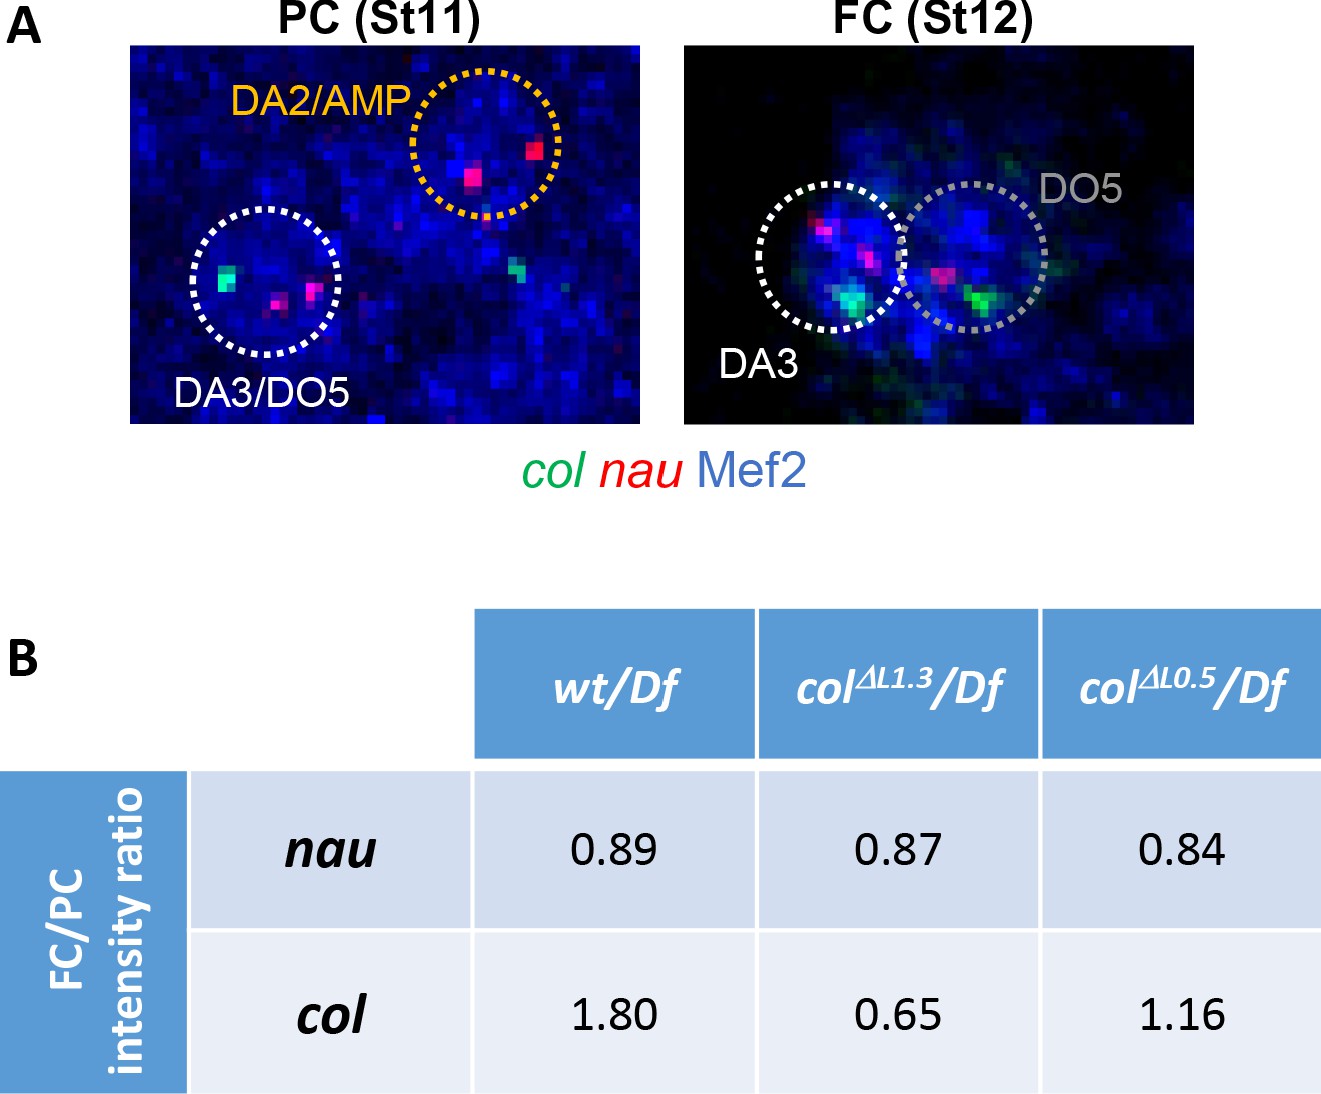
Nau expression is not affected in colΔL0.5 and colΔL1.3 embryos.
(A) DA3 col (green) and nau (red) transcription dots at the PC and FC stage. Nuclei are labelled by Mef2 immunostaining (blue) and ROIs (regions of interest) used for quantification are circled. One col and two nau dots are observed in heterozygous (wt/Df, colΔL1.3/Df and colΔL0.5/Df) embryos. (B) Calculated dot intensity ratios (mean intensity) between the FC and PC stages. Number of nuclei used to calculate the mean dot intensity: nau: wt PC n = 28, FC n = 19; colΔL1.3 PC n = 24, FC n = 26; colΔL0.5 PC n = 25, FC n = 18; for col: wt PC n = 19, FC n = 28; colΔL1.3 PC n = 26, FC n = 25; colΔL0.5 PC n = 18, FC n = 24. nau data indicate a slight decrease between the PC and FC stages in all three conditions. col data show increased transcription between the PC and FC stage in wt embryos.
Figure 4
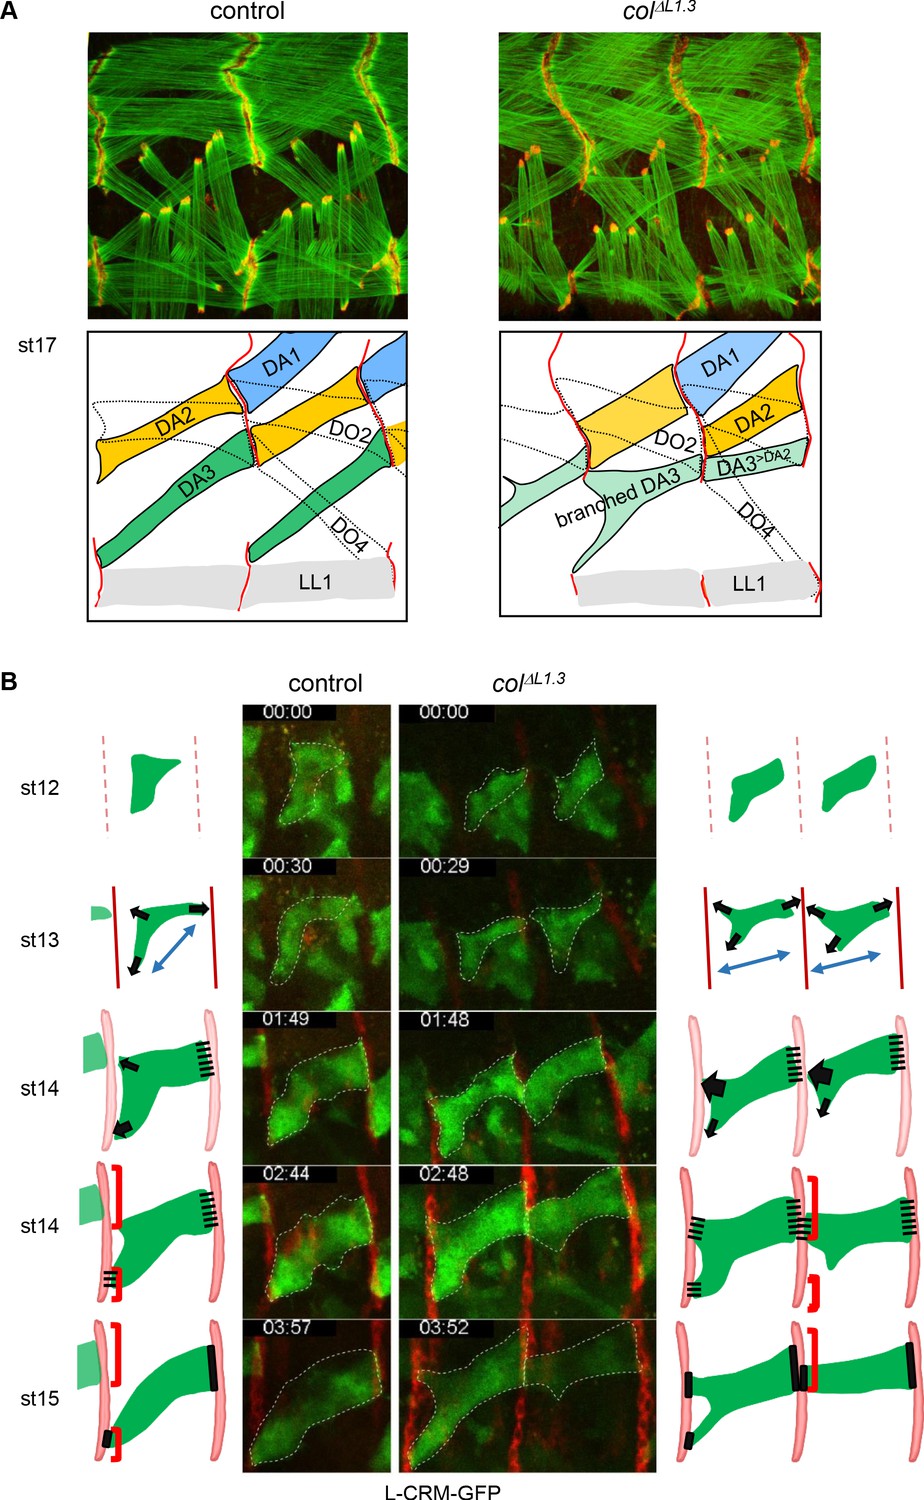
Multistep muscle attachment to selected tendon cells.
(A) F-actin (green) and Ilk-GFP (red) staining of stage 17 control and colΔL1.3 embryos, showing heterotypic and homotypic muscle attachment sites, respectively. A drawing illustrates muscle matching in control embryos and mismatching in col ΔL1.3 embryos, with DA1, DA2 and DA3 muscles coloured in blue, yellow and green, respectively and attachment sites as red lines. (B) Snapshots of live imaging DA3 muscle development, using L-CRM-moeGFP expression (green). Tendon cell precursors express stripe-Gal4; UAS-RFP (red). Embryos were filmed during 4 hr (Sup. Videos 1 and 2) and Z sections collected every ~2–2.5 min. The outlines of the developing muscles are schematised for each stage. In both control (left, one segment shown) and colΔL1.3 embryos (right, two segments shown), the posterior muscle end reaches the intersegmental border first. At stage 14, wt DA3 contacts both dorsal and lateral tendon cells at its anterior end. In colΔL1.3 embryos, the anterior dorsal projections fail to retract, leading to ectopic DA3>DA2 attachment and branched muscles.
Figure 5 with 2 supplements

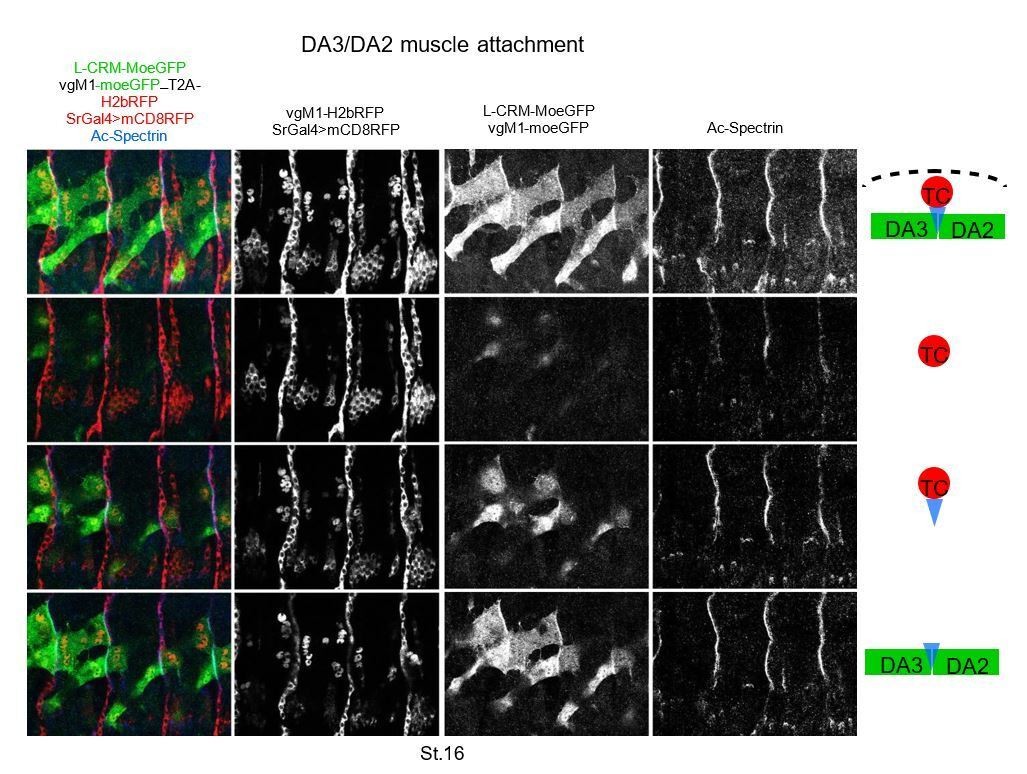
DA3 heterotypic and homotypic muscle attachment sites (iMAS) in wt and L-CRM mutants.
(A) Immunostaining of wt and colΔL1.3 VgM1-moeGFP-H2bRFP; srGal4 >mcd8 RFP; L-CRM-moeGFP embryos for GFP (green), RFP (red) and Spectrin (blue). DA3 (DA3>DA2) and DA2 muscles are indicated in each panel. At stage 14, the wt DA3 and colΔL1.3 DA3>DA2 attachment sites partly align over the intersegmental border (circled). Their dorsal surface closely contacts DA2 via numerous protrusions; at stage 15, likely because homotypic DA3/DA3 and DA2/DA2 repulsion, these protrusions are restricted away from intersegmental borders in wt embryos while maintained in colΔL1.3. At stage 16, stable heterotypic DA3/DA2 contacts in wt, and both homotypic DA3>DA2/DA3>DA2 and DA3>DA2/DA2 contacts are stabilised. Anti-Spectrin staining is shown in black and white on the right of each panel, to indicate the position of the dorsal iMASs. (B) Schematic drawings of DA muscle development (green) in wt and colΔL1.3embryos; interpreted from data in Figure 4 and supplementary videos. Arrows indicate attractive cues, broken lines repulsive cues, thin circles attachment initiation, thick circles, attachment stabilisation. DA3 MAS initiation starts earlier at its posterior than anterior end. Homotypic repulsion between muscles of same identity leads to DA3 posterior attachment to lateral tendon cells. Repulsion does not operate upon DA3>DA2 transformation, leading to stable homotypic DA3>DA2 and DA3>DA2/DA2 iMASs.
Figure 5—figure supplement 1
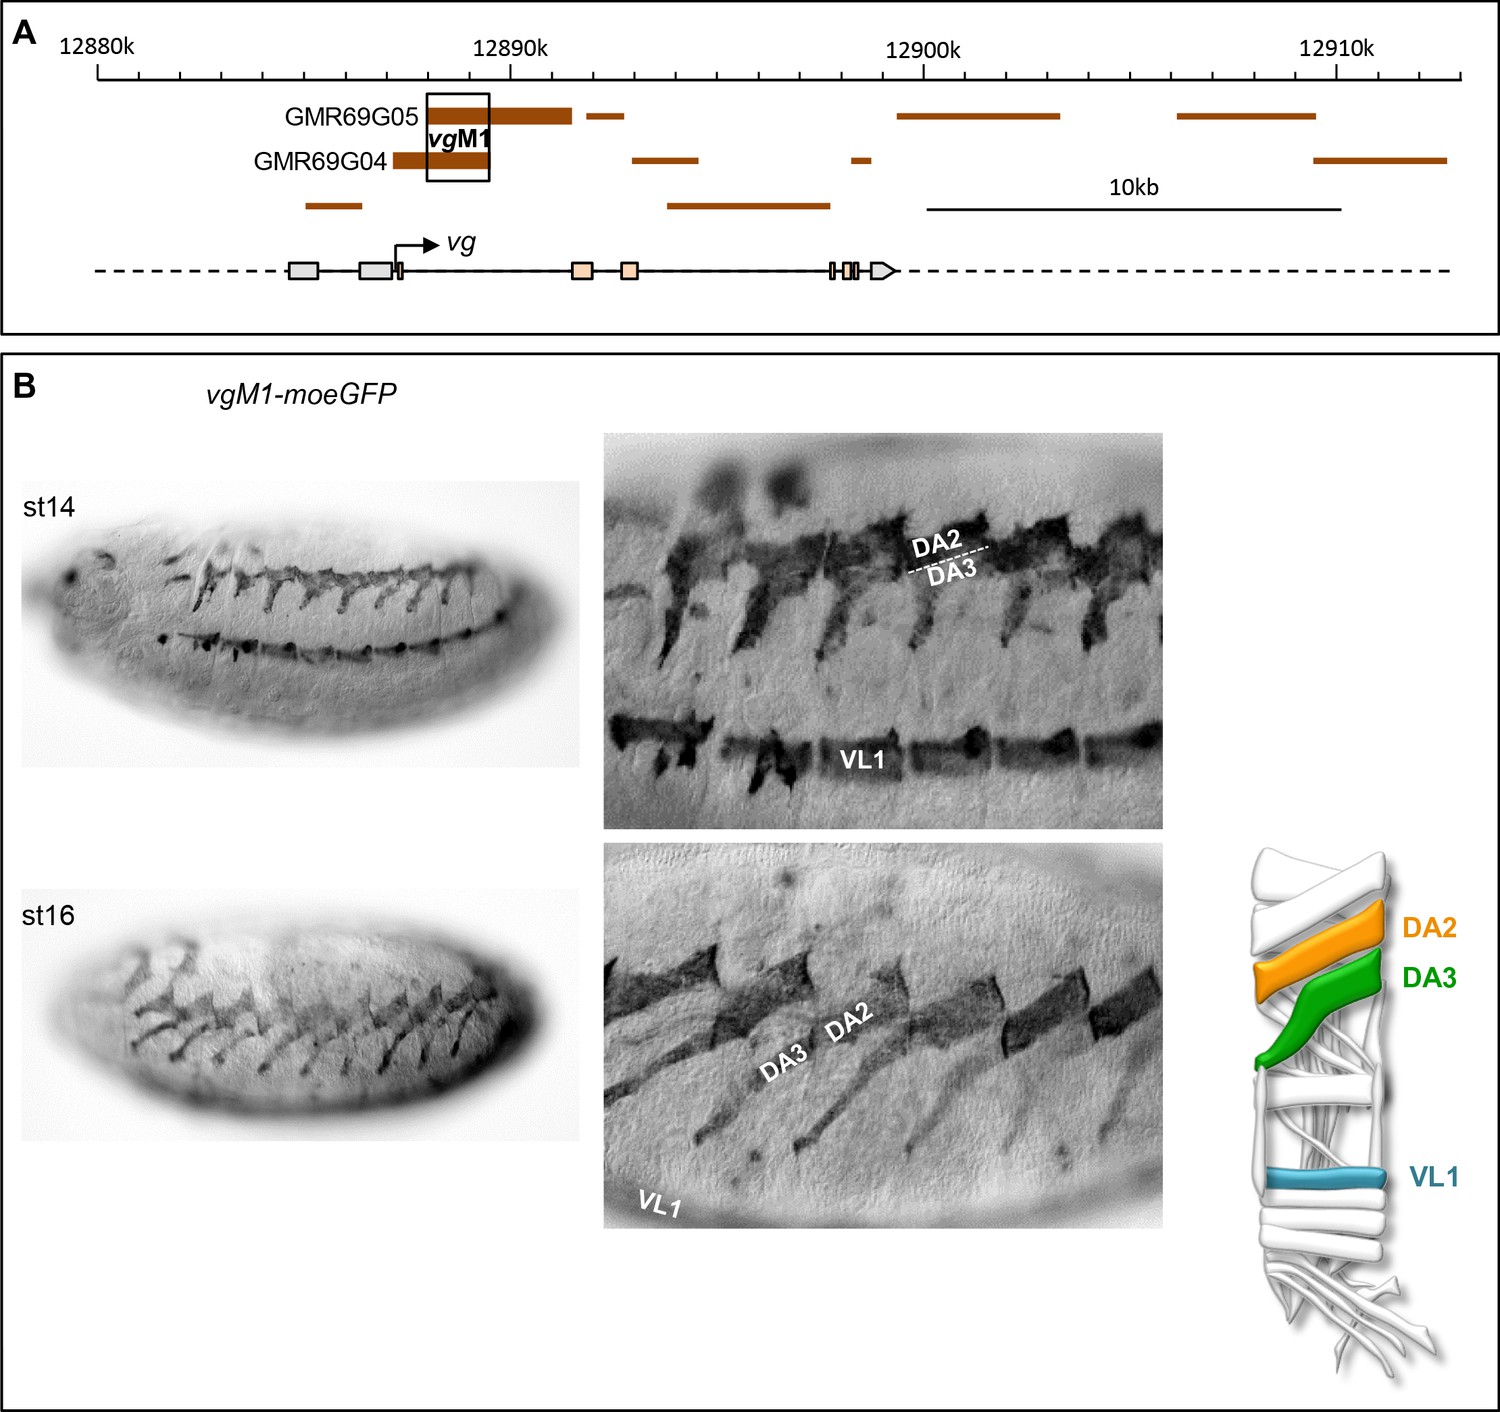
Identification of a vg CRM active in the DA2 and DA3 muscles.
(A) Schematic representation of the vestigial (vg) transcribed region (https://flybase.org/cgi-bin/gbrowse2/dmel/?Search=1;name=FBgn0003975). GMR fragments tested for their enhancer activity are drawn as brown horizontal bars; GMR69G04 and GMR69G05 are active in DA3 and DA2 muscles. The fragment of overlap between GMR69G04 and GMR69G05, positions 12889557–12891520 on Chr2R, is called vgM1 (B) vgM1-moeGFP expression in the DA2, DA3 and VL1 muscles in wild type embryos at stages 14 and 16 (schematised on the right); higher magnification views show the close apposition of the DA3 ventral and DA2 dorsal sufaces at stage 14 and their tandem arrangement at stage 16. Of note, vgM1 expression seems to be more robust in DA2 than DA3.
Figure 5—figure supplement 2
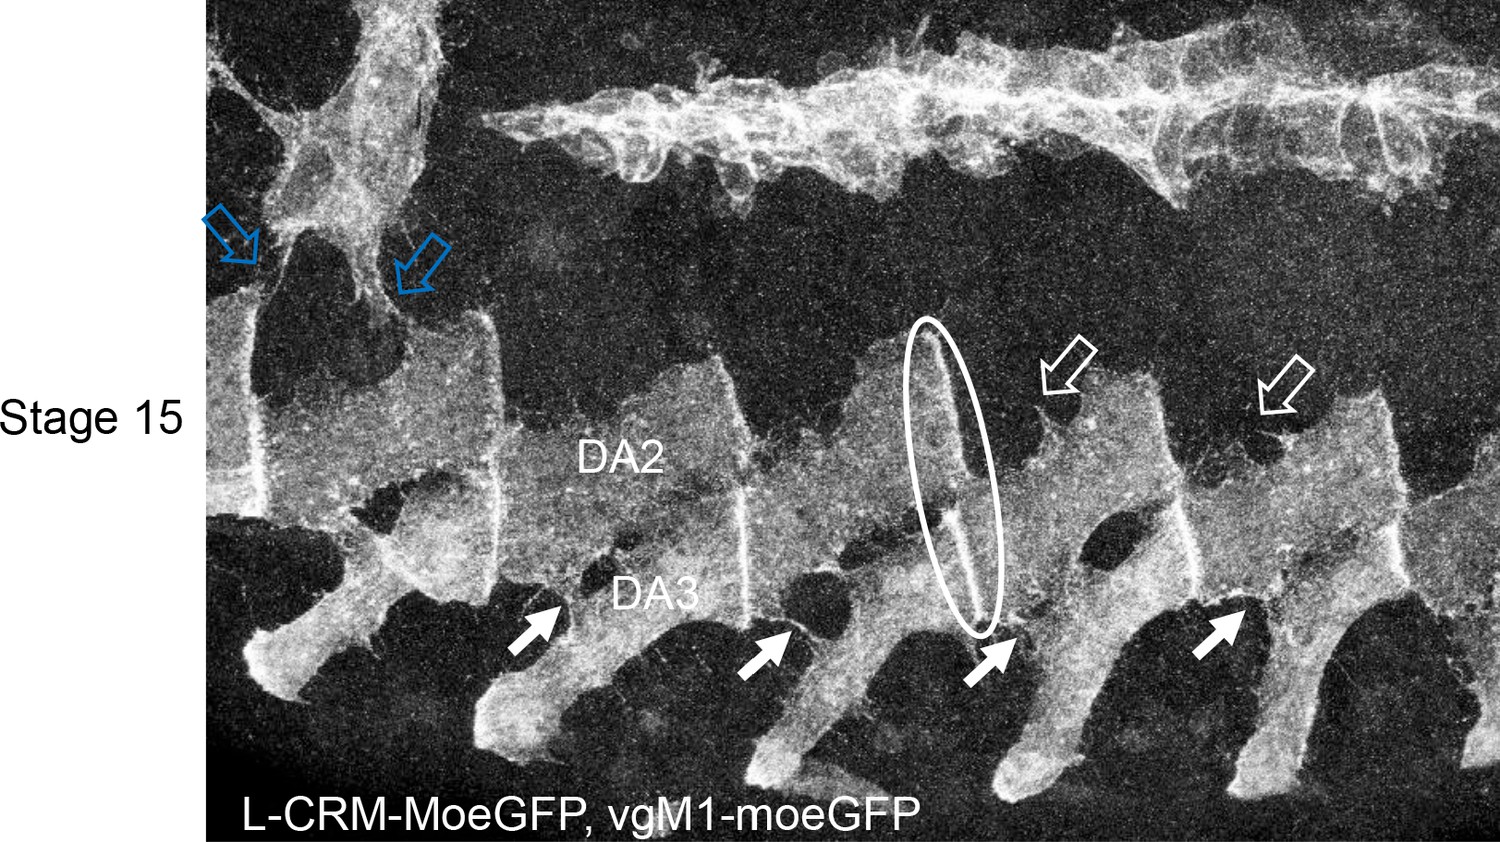
Interactions between the developing DA2 and DA3 muscles via dynamic protrusions Immunostaining of a stage 15 VgM1-moeGFP-H2bRFP; srGal4 >mcd8 RFP; L-CRM-moeGFP embryo.
Only the GFP channel is shown, in black and white, to highlight protrusions emanating from the DA3 and DA2 muscles which contact each other (white arrows). Similar protrusions are seen between the DA2 and DA1 muscle (open arrows) which expresses VgM1-moeGFP in the thoracic T2 muscle (blue open arrows). The DA3/DA2 and DA2/DA1 muscle-muscle attachments are circled in white at one segment boundary. The observed protrusions are very dynamic as observed in videos and schematised in Figure 5B.
Figure 6 with 1 supplement
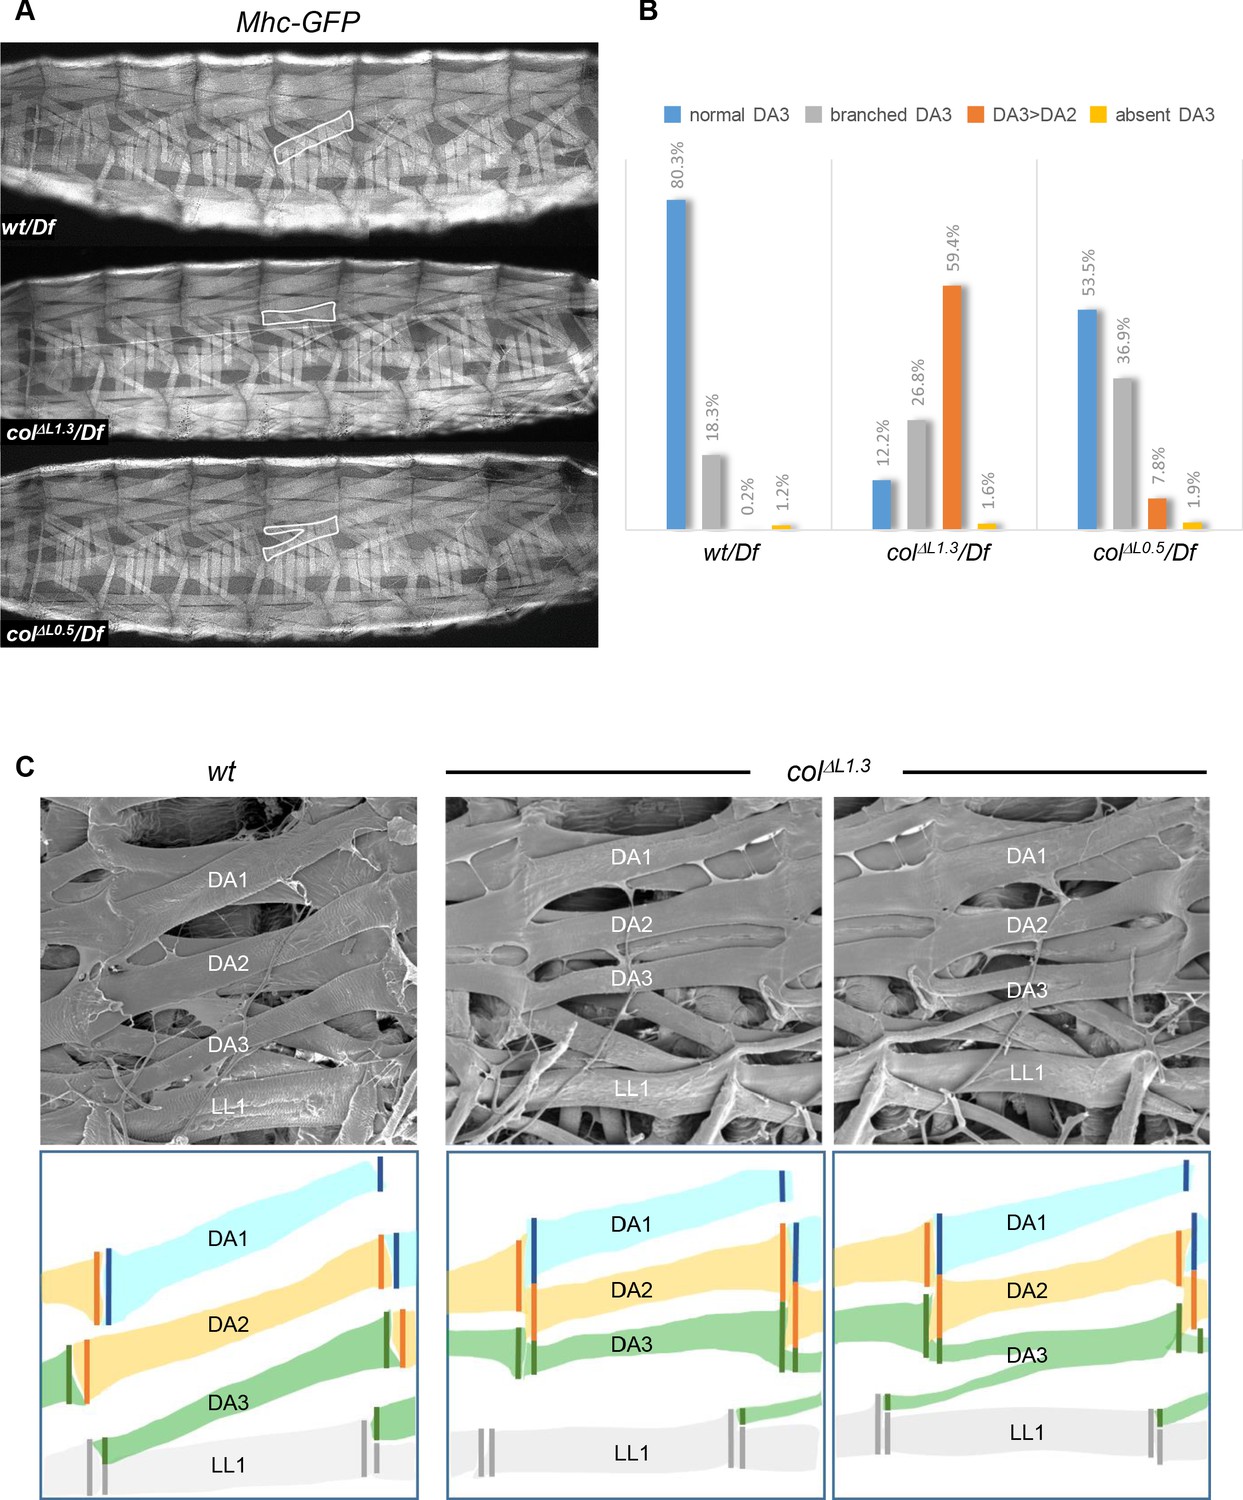
Muscle mismatching in L-CRM mutant larvae.
(A) Mhc-GFP expression in control, colΔL1.3/Df and colΔL0.5/Df live 3rd instar larvae; lateral views, anterior to the left. Examples of DA3, DA3>DA2 and DA3 branched muscles are circled in white. (B) Quantification of the relative proportions of DA3, branched DA3, DA3>DA2 and absence of DA3 muscles in A1 to A7 segments of wt/Df, colΔL1.3/Df and colΔL0.5/Df; Mhc-GFP larvae; (wt/Df, n = 375 segments/27 larvae; colΔL1.3/Df, n = 320/23; colΔL0.5/Df, n = 264/19). (C) Scanning electron microscopy of filleted larvae showing the dorsal and dorso-lateral muscles, schematically colour-coded below. In wt larvae, the DA muscles are parallel to each other within a segment with precise matching of the DA3/DA2 and DA2/DA1 MASs at each posterior segmental border. In colΔL1.3 larvae, DA3>DA2 muscles show homotypic, dorsal MASs and the DA3/LL1 connection is lost. The posterior MASs of branched DA3 is composite.
Figure 6—figure supplement 1
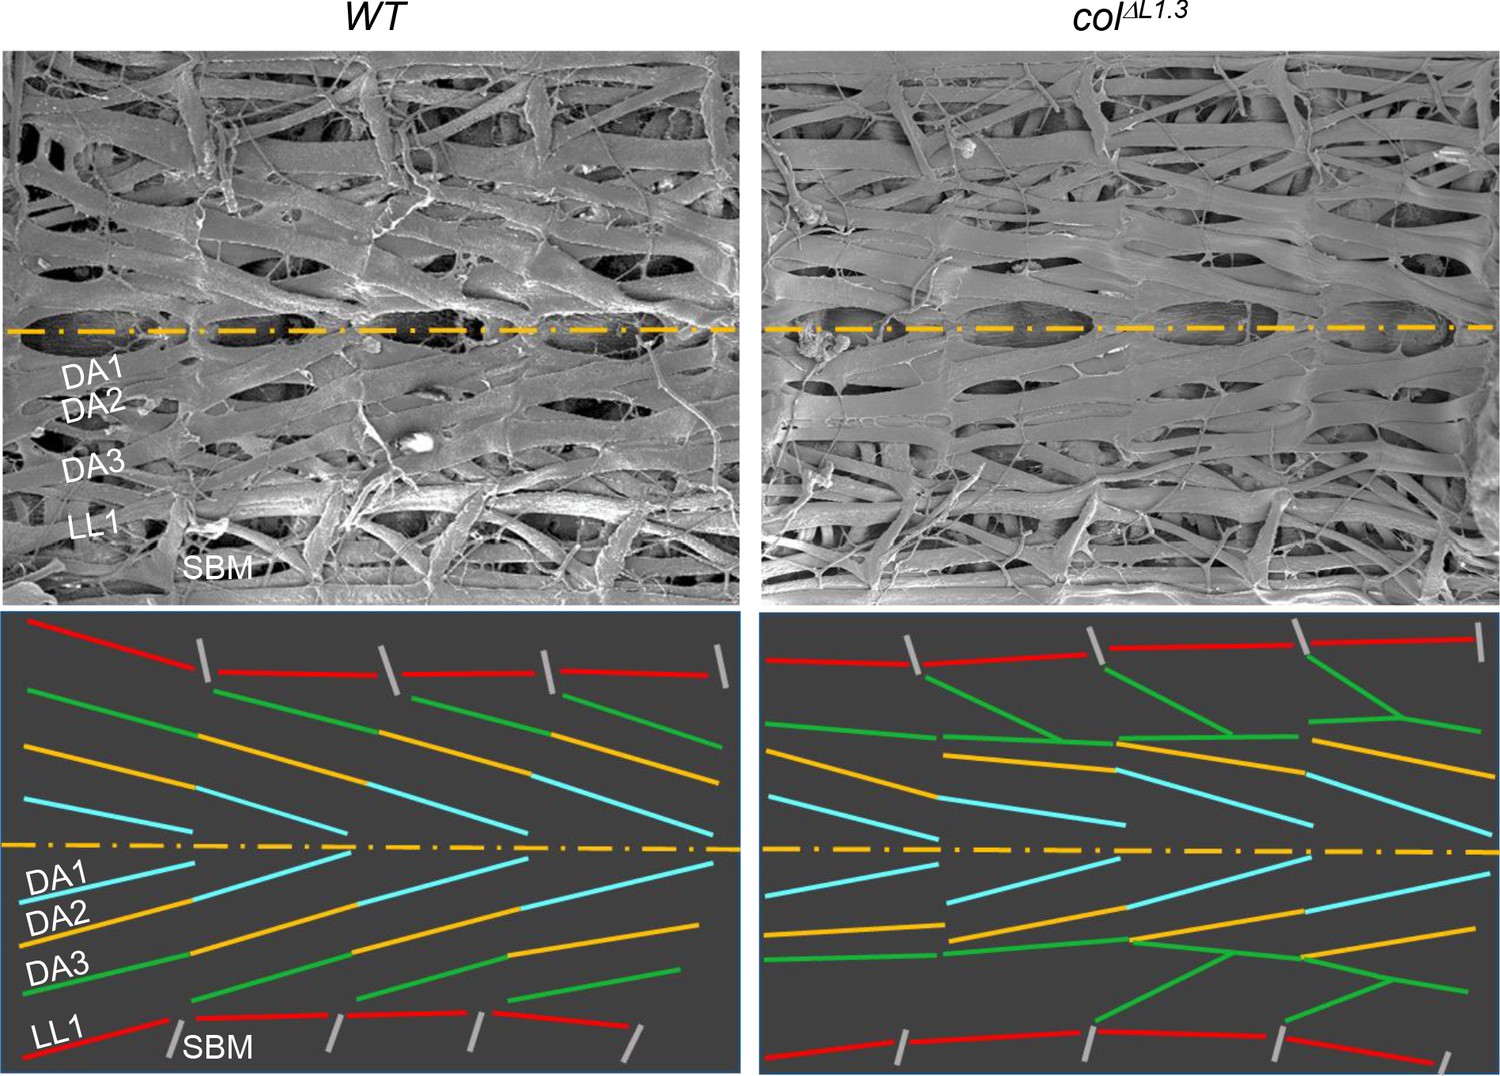
Scanning electron microscopy of wt and col ΔL1.3 internal muscles Larval fillets cut longitudinally along the ventral midline to expose the dorsal and dorso-lateral internal muscles.
The dorsal midline is represented by a yellow dashed line. Upper panels: four abdominal segments of wt and col ΔL1.3 L3 larvae. Lower panels: muscle orientations are schematised by coloured lines, DA1 blue, DA2 yellow, DA3 green, LL1 red and SBM grey. In a wild type larva, the DA1, DA2 and DA3 muscles are oriented parallel and draw a force line over three consecutive segments and straight tension lines between two adjacent segments. In colΔL1.3 larvae, DA3>DA2 and branched DA3 transformations these lines are broken due to the formation of homotypic DA3>DA2 MAS and either loss or reduction of the DA3/LL1 connection.
Figure 7 with 1 supplement
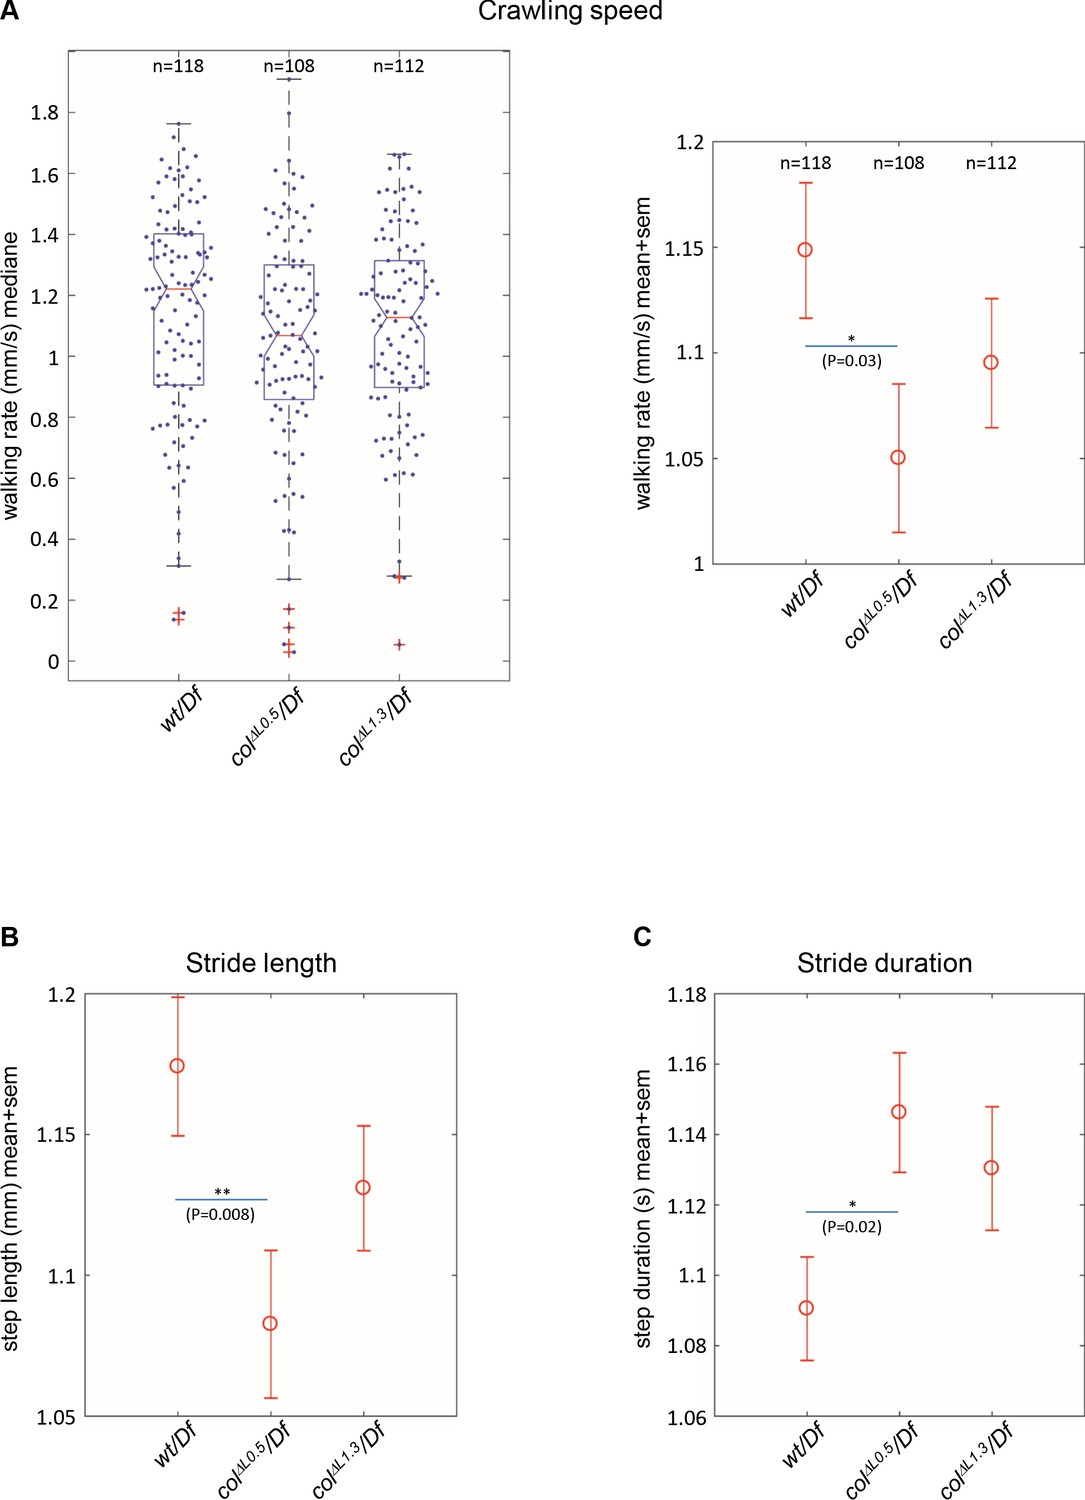
Branched muscles result in specific locomotion defects.
(A) Left, Tukey’s diagrams (box-plot graph) showing the walking rate in mm/s (crawling speed) of wt/Df (n = 118), colΔL0.5/Df (n = 108) and colΔL1.3/Df (n = 112) larvae. Each point represents the average measurement for one larva, recorded during 20 s. 50% of points are located within the Tukey’s diagram. The red line gives the median, the narrowed area, the confidence interval of the median (95%). Right, same data as left, showing the mean speed ± standard error of mean (SEM) for each genotypes. (B) Stride length in mm. (C) Stride duration in s. The number of larvae (n) tested for each genotype is indicated in (A). Only significant differences are indicated (*p<0.05 and **p<0.01).
Figure 7—figure supplement 1
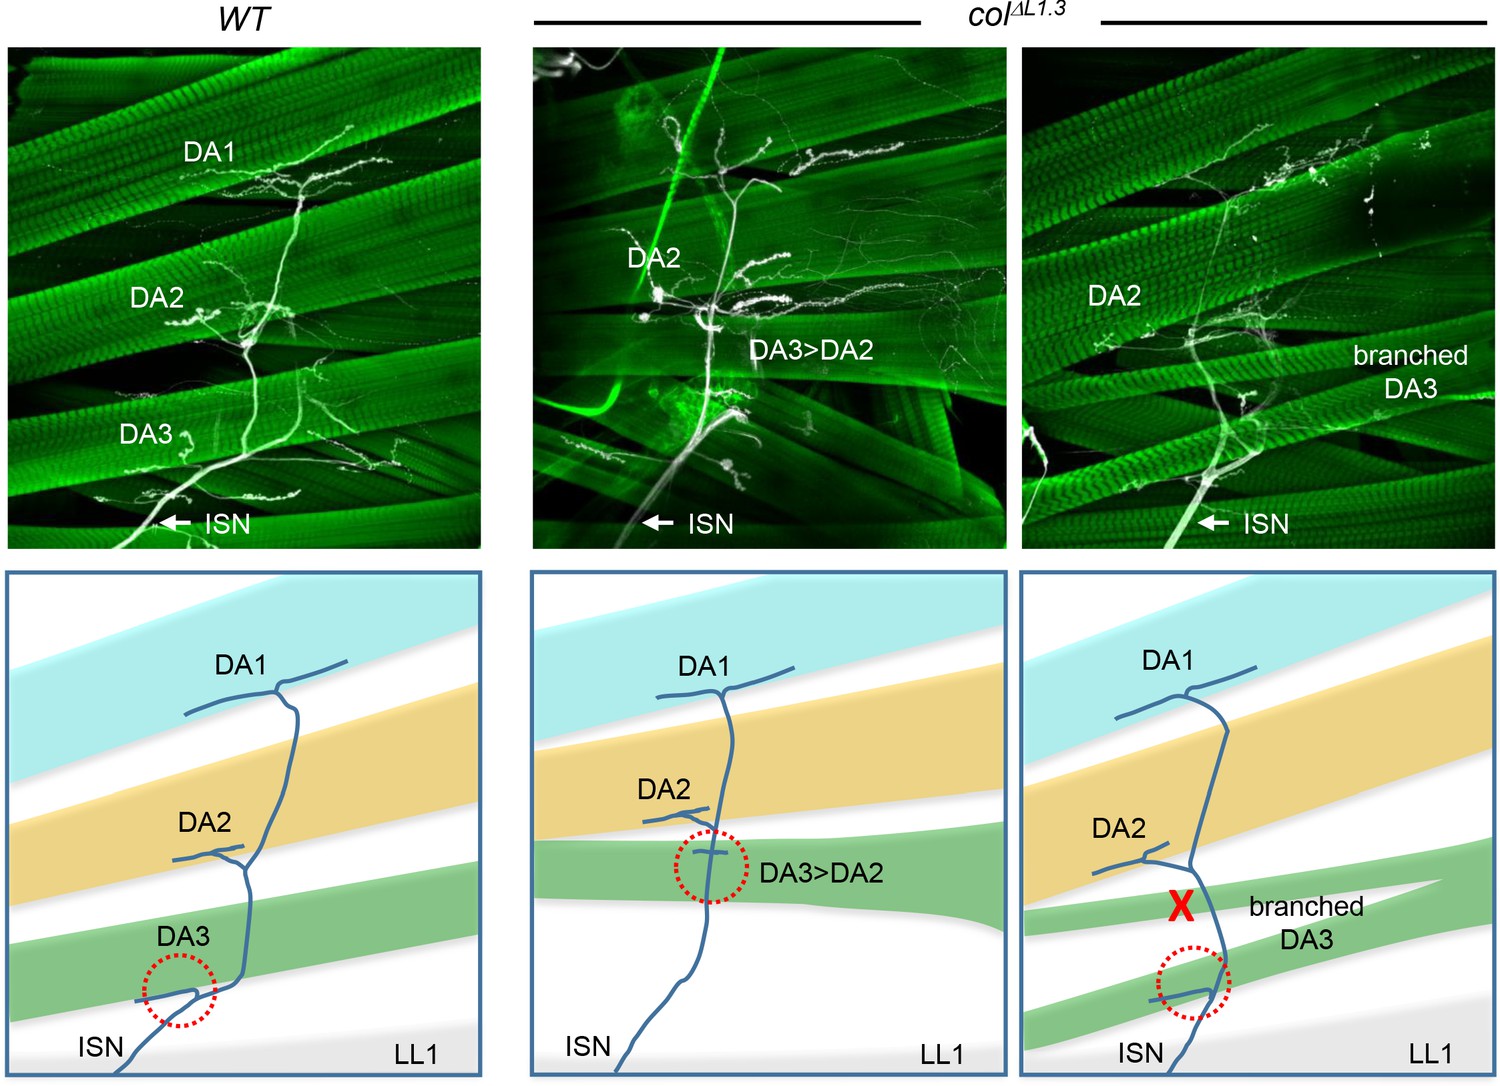
DA muscles innervation in L-CRM mutant larvae.
Phalloidin and anti-HRP staining of wt and colΔL1.3 3rd instar larval fillets, showing internal DA muscles (green) and intersegmental nerve (ISN) projections (white), schematically colour-coded below. ISN projection to the DA3 muscle is circled by a red dashed line. Absence of projection is indicated by a red cross.
Author response image 1
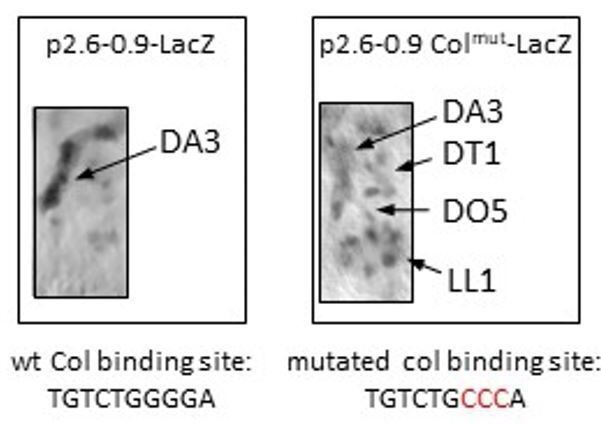
LacZ immunostaining of stage 14 embryos, carrying a late col CRM reporter (p2.
6-0.9LacZ). Left: The Col binding site is intact. LacZ expression is predominantly detected in the DA3 muscle. Right: The Col binding site is mutated (nucleotides in red). Low level of LacZ expression is detected in the DA3 as well as DT1, DO5 and LL1 muscles.
Author response image 2

Author response image 3
Videos
Video 1
Live-imaging of wt embryos.
The DA3 muscle is visualised by L-CRM-moeGFP (green) and tendon cell along the entire intersegmental border by stripe Gal4;UASmCD8RFP (red). Embryos were filmed during 4 hr. See also the legend of Figure 4.
Video 2
Live-imaging of colΔL1.3 embryos.
The DA3 muscle is visualised by L-CRM-moeGFP (green) and tendon cell along the entire intersegmental border by stripe Gal4;UASmCD8RFP (red). Embryos were filmed during 4 hr. See also the legend of Figure 4.
Tables
Key resources table
| Reagent type (species) or resource | Designation | Source or reference | Identifiers | Additional information |
|---|---|---|---|---|
| Strain, strain background (Drosophila melanogaster) | white[1118] | Bloomington Drosophila Stock Center | BDSC Cat# 3605, RRID:BDSC_3605 | |
| Strain, strain background (Drosophila melanogaster) | Df(2L)BSC429 | Bloomington Drosophila Stock Center | BDSC Cat# 24933, RRID:BDSC_24933 | |
| Strain, strain background (Drosophila melanogaster) | vasa-cas9VK00027 | Bloomington Drosophila Stock Center | BDSC Cat# 51324, RRID:BDSC_51324 | |
| Strain, strain background (Drosophila melanogaster) | sr-Gal4 | obtained from G. Morata, Madrid, Spain | ||
| Strain, strain background (Drosophila melanogaster) | Col1 | Our lab | Crozatier and Vincent, 1999 | |
| Strain, strain background (Drosophila melanogaster) | Mi{MIC}knMI15480/SM6a | Bloomington Drosophila Stock Center | BDSC Cat# 67516, RRID:BDSC_67516 | MiMic Line |
| Strain, strain background (Drosophila melanogaster) | GMR69G03 | Bloomington Drosophila Stock Center | BDSC Cat# 39500, RRID:BDSC_39500 | GMR line, GMR located in the Vg gene |
| Strain, strain background (Drosophila melanogaster) | GMR69G04 | Bloomington Drosophila Stock Center | #46616 | GMR line, GMR in the Vg gene |
| Strain, strain background (Drosophila melanogaster) | GMR69G05 | Bloomington Drosophila Stock Center | #39501 | GMR line, GMR in the Vg gene |
| Strain, strain background (Drosophila melanogaster) | GMR69G06 | Bloomington Drosophila Stock Center | #39502 | GMR line, GMR in the Vg gene |
| Strain, strain background (Drosophila melanogaster) | GMR69G07 | Bloomington Drosophila Stock Center | BDSC Cat# 47956, RRID:BDSC_47956 | GMR line, GMR in the Vg gene |
| Strain, strain background (Drosophila melanogaster) | GMR69G08 | Bloomington Drosophila Stock Center | BDSC Cat# 46617, RRID:BDSC_46617 | GMR line, GMR in the Vg gene |
| Strain, strain background (Drosophila melanogaster) | GMR69G09 | Bloomington Drosophila Stock Center | BDSC Cat# 46618 | GMR line, GMR in the Vg gene |
| Strain, strain background (Drosophila melanogaster) | GMR69G10 | Bloomington Drosophila Stock Center | BDSC Cat# 39503 | GMR line, GMR in the Vg gene |
| Strain, strain background (Drosophila melanogaster) | GMR69G12 | Bloomington Drosophila Stock Center | BDSC Cat# 46619 | GMR line, GMR in the Vg gene |
| Strain, strain background (Drosophila melanogaster) | GMR69G03 | Bloomington Drosophila Stock Center | BDSC Cat# 46620, RRID:BDSC_46620 | GMR line, GMR in the Vg gene |
| Strain, strain background (Drosophila melanogaster) | GMR12A09 | Bloomington Drosophila Stock Center | BDSC Cat# 47319 | GMR line, GMR in the Kn gene |
| Strain, strain background (Drosophila melanogaster) | GMR12G07 | Bloomington Drosophila Stock Center | BDSC Cat# 47854, RRID:BDSC_47854 | GMR line, GMR in the Kn gene |
| Strain, strain background (Drosophila melanogaster) | GMR12H01 | Bloomington Drosophila Stock Center | BDSC Cat# 48528, RRID:BDSC_48528 | GMR line, GMR in the Kn gene |
| Strain, strain background (Drosophila melanogaster) | GMR13A11 | Bloomington Drosophila Stock Center | BDSC Cat# 49248 | GMR line, GMR in the Kn gene |
| Strain, strain background (Drosophila melanogaster) | GMR13B06 | Bloomington Drosophila Stock Center | BDSC Cat# 48544, RRID:BDSC_48544 | GMR line, GMR in the Kn gene |
| Strain, strain background (Drosophila melanogaster) | GMR13B08 | Bloomington Drosophila Stock Center | BDSC Cat# 48546, RRID:BDSC_48546 | GMR line, GMR in the Kn gene |
| Strain, strain background (Drosophila melanogaster) | GMR13C09 | Bloomington Drosophila Stock Center | BDSC Cat# 48555, RRID:BDSC_48555 | GMR line, GMR in the Kn gene |
| Strain, strain background (Drosophila melanogaster) | GMR13C11 | Bloomington Drosophila Stock Center | BDSC Cat# 48556, RRID:BDSC_48556 | GMR line, GMR in the Kn gene |
| Strain, strain background (Drosophila melanogaster) | GMR13F08 | Bloomington Drosophila Stock Center | BDSC Cat# 48576, RRID:BDSC_48576 | GMR line, GMR in the Kn gene |
| Strain, strain background (Drosophila melanogaster) | GMR13F10 | Bloomington Drosophila Stock Center | BDSC Cat# 48578, RRID:BDSC_48578 | GMR line, GMR in the Kn gene |
| Strain, strain background (Drosophila melanogaster) | GMR47D05 | Bloomington Drosophila Stock Center | BDSC Cat# 47605, RRID:BDSC_47605 | GMR line, GMR in the Kn gene |
| Strain, strain background (Drosophila melanogaster) | GMR46H09 | Bloomington Drosophila Stock Center | BDSC Cat# 54712, RRID:BDSC_54712 | GMR line, GMR in the Kn gene |
| Antibody | anti-col (Mouse monoclonal) | Our lab | 1:50 Krzemień et al., 2007 | |
| Antibody | anti-LacZ (Mouse monoclonal) | Promega | Promega Cat# Z3781, RRID:AB_430877 | 1:1000 |
| Antibody | anti-spectrin (Mouse monoclonal) | Hybridoma Bank | DSHB Cat# 3A9 (323 or M10-2), RRID:AB_528473 | 1:200 |
| Antibody | anti-GFP (Rabbit polyclonal) | Biolabs | Torrey Pines Biolabs Cat# TP401 071519, RRID:AB_10013661 | 1:1000 |
| Antibody | anti-GFP (Chicken polyclonal) | Abcam | Abcam Cat# ab13970, RRID:AB_300798 | 1:500 |
| Antibody | Phalloidin-texas red | Thermofisher Scientific | Cat# Cat#T7471 | 1:500 |
| Antibody | Alexa fluor antibodies 488, 555 and 647 | Molecular probes | 1:300 | |
| Antibody | Alexa fluor 594 anti HRP | Jackson Immunological research | Jackson ImmunoResearch Labs Cat# 123-585-021, RRID:AB_2338966 | 1:300 |
| Antibody | Alexa fluor phalloidin | Thermofisher Scientific | Thermo Fisher Scientific Cat# A12381, RRID:AB_2315633 | 1:500 |
| Antibody | Biotinylated goat anti-mouse | Vector Laboratories | Vector Laboratories Cat# BA-9200, RRID:AB_2336171 | 1:2000 |
| Software, algorithm | ImageJ | Schneider et al., 2012 | ImageJ, RRID:SCR_003070 | https://imagej.nih.gov/ij/ |
| Software, algorithm | FIMTrack | Risse et al., 2014 | https://www.uni-muenster.de/PRIA/en/FIM/ | |
| Software, algorithm | MATLAB | MathWorks | MATLAB, RRID:SCR_001622 | https://www.mathworks.com/products/matlab-online.html |
| Other | FISH probes labelled with Quasar dye 670 (col) | Biosearch Technologies and this study | Kn first intron | |
| Other | FISH probes labelled with Quasar dye 570 (nau) | Biosearch Technologies and this study | Nau first and third introns |
Additional files
Download links
A two-part list of links to download the article, or parts of the article, in various formats.
Downloads (link to download the article as PDF)
Open citations (links to open the citations from this article in various online reference manager services)
Cite this article (links to download the citations from this article in formats compatible with various reference manager tools)
Intrinsic control of muscle attachment sites matching
eLife 9:e57547.
https://doi.org/10.7554/eLife.57547


