Intrinsic control of muscle attachment sites matching
- Centre de Biologie du Développement (CBD), France
- Centre de Recherche sur la Cognition Animale (CRCA), France
- Centre de Biologie Intégrative (CBI), Université de Toulouse, CNRS, UPS, France
Abstract
Myogenesis is an evolutionarily conserved process. Little known, however, is how the morphology of each muscle is determined, such that movements relying upon contraction of many muscles are both precise and coordinated. Each Drosophila larval muscle is a single multinucleated fibre whose morphology reflects expression of distinctive identity Transcription Factors (iTFs). By deleting transcription cis-regulatory modules of one iTF, Collier, we generated viable muscle identity mutants, allowing live imaging and locomotion assays. We show that both selection of muscle attachment sites and muscle/muscle matching is intrinsic to muscle identity and requires transcriptional reprogramming of syncytial nuclei. Live-imaging shows that the staggered muscle pattern involves attraction to tendon cells and heterotypic muscle-muscle adhesion. Unbalance leads to formation of branched muscles, and this correlates with locomotor behavior deficit. Thus, engineering Drosophila muscle identity mutants allows to investigate, in vivo, physiological and mechanical properties of abnormal muscles.
eLife digest
Each muscle in the body has a unique size, shape and set of attachment points. Animals need all of their muscles to have the correct identity to help maintain posture and control movement. A specific set of proteins, called transcription factors, co-ordinate and regulate gene activity in cells so that each muscle develops in the right way.
To create a muscle, multiple precursor cells fuse together to form a muscle fibre, which then elongates and attaches to specific sites. Correct attachment is critical so that the fibre is properly oriented. When this process goes wrong, for example in disease, muscle fibres sometimes attach to the wrong site; they become branched and cannot work properly.
Collier is a transcription factor protein that controls muscle identity in the fruit fly Drosophila melanogaster. However, like many transcription factors, Collier also has several other roles throughout the body. This made it difficult to evaluate the effect of the protein on the formation of specific muscles.
Here, Carayon et al. managed to selectively deactivate Collier in just one muscle per body section in the larvae of fruit flies. This showed that the transcription factor is needed throughout muscle development; in particular, it is required for muscle fibres to select the correct attachment sites, and to be properly oriented. Affected muscles showed an altered orientation, with branched fibres attaching to the wrong site. Even minor changes, which only affect a single muscle from each body segment, greatly impaired the movement of the larvae.
The work by Carayon et al. offers a new approach to the study of muscular conditions. Branched muscles are seen in severe human illnesses such as Duchenne muscular dystrophy. Studying the impact of these changes in a living animal could help to understand how this disease progress, and how it can be prevented.
Introduction
The musculature of each animal is composed of an array of body wall muscles allowing precision and stereotypy of movements. The somatic musculature of the Drosophila larva - about 30 distinct body wall muscles per each hemi-segment which are distributed in three layers, internal, median and external - is a model to study how a muscle pattern is specified and linked to locomotion behaviour. Each muscle is a single multinucleated fibre with a specific identity: size, shape, orientation relative to the dorso-ventral and antero-posterior body axes, motoneuron innervation and attachment sites to the exoskeleton via tendon cells located at specific positions. Intersegmental tendon cells, where a large fraction of muscles is attached, are distributed in three groups, dorsal, lateral and ventral (Bate, 1990; Volk and VijayRaghavan, 1994; Schweitzer et al., 2010; Armand et al., 1994). Internal muscles also attach to muscle(s) in the next segment, forming ‘indirect’ muscle attachment sites (iMAS) (Maartens and Brown, 2015).
Drosophila muscle development proceeds through fusion of a founder myoblast (founder cell, FC) with fusion-competent myoblasts (FCMs) (Deng et al., 2017). FCs originate from asymmetric division of progenitor cells (PCs) themselves selected from equivalence groups of myoblasts, called promuscular clusters (PMCs). Muscle identity ensues from the expression by each PC and FC of a specific combination of identity transcription factors (iTFs) (de Joussineau et al., 2012), established in three steps: First, different iTFs are activated in different PMCs, in response to positional information, and this expression is only maintained in PCs. Second, refinement of the iTF code occurs via cross-regulations between different iTFs in PCs and/or FCs and Notch signalling (Carmena et al., 1998; Carmena et al., 2002; Enriquez et al., 2010). Several PCs can be serially selected from a PMC and give rise to different muscle identities according to birth order, adding a temporal dimension to these regulations. A well-documented example is the distinction between DA2 and DA3 identities (Figure 1A; Dubois et al., 2016; Boukhatmi et al., 2012). Third, transcriptional activation of iTFs in syncytial nuclei after fusion correlates with the activation of identity ‘realisation’ genes acting downstream of some iTFs (Crozatier and Vincent, 1999; Knirr et al., 1999; Bataillé et al., 2010; Bataillé et al., 2017).
Figure 1 with 3 supplements see all
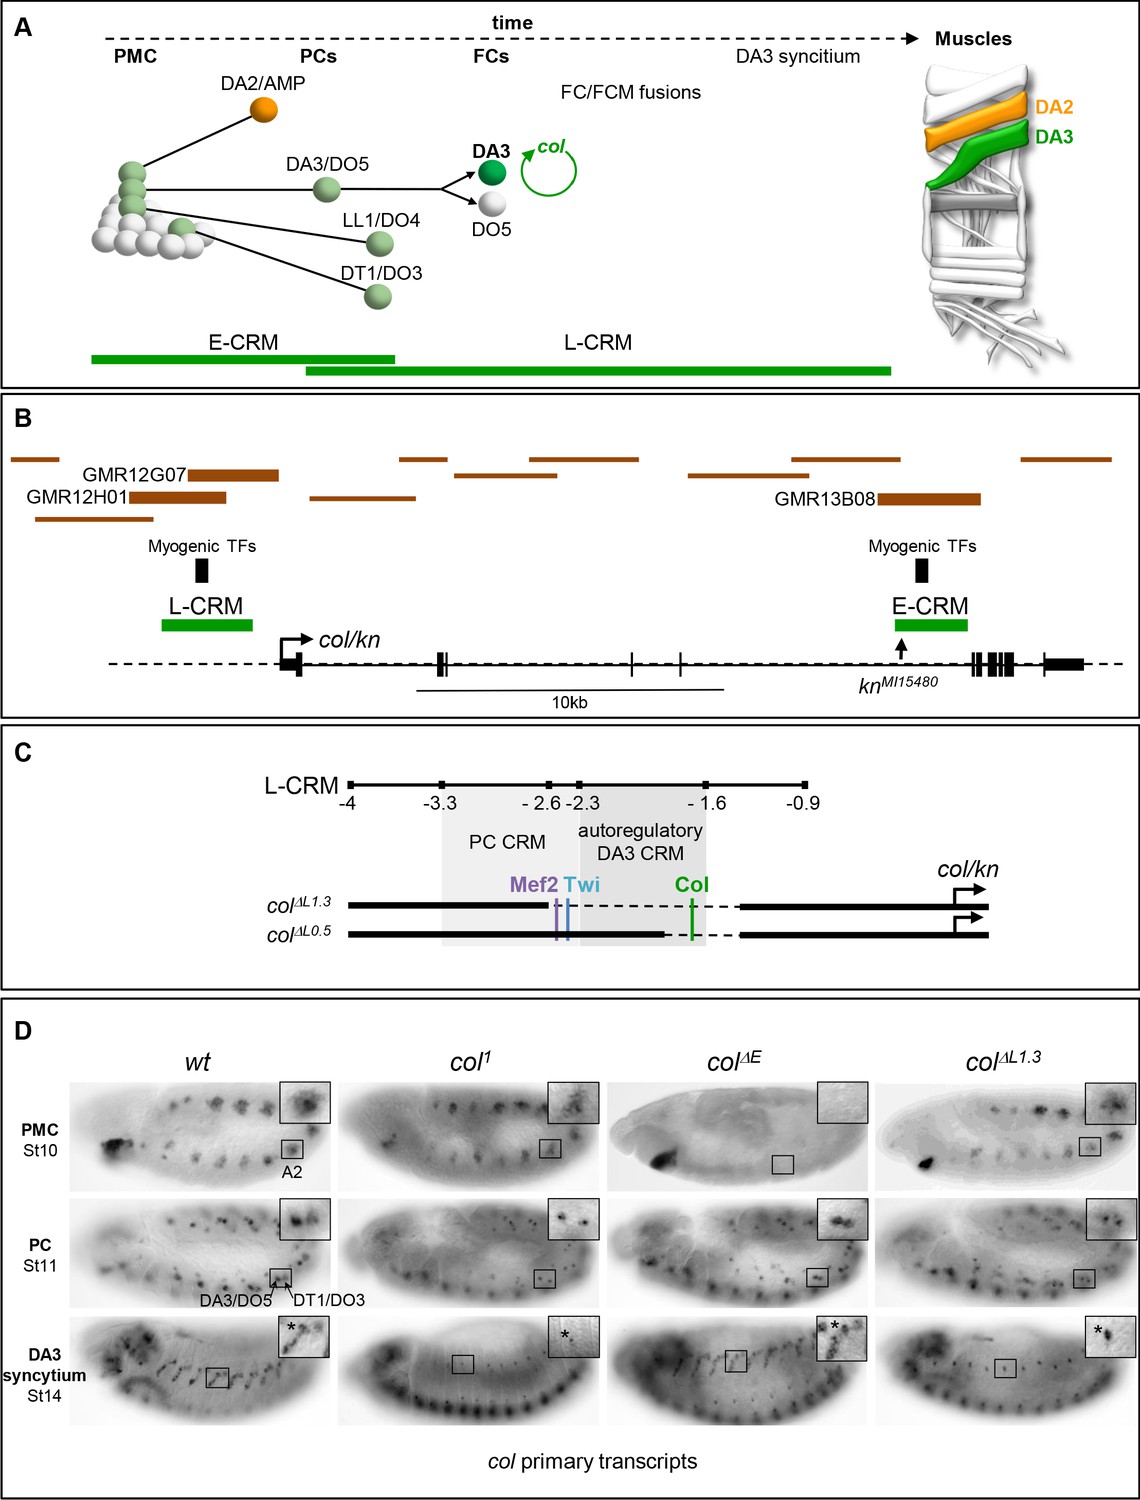
Col CRMs, CRM deletions and col transcription.
(A) Diagrammatic representation of the sequential emergence of 4 different PCs from the Col-expressing PMC (grey), division of the DA3/DO5 PC into 2 FCs and col auto-regulation in the DA3 lineage; the names of each PC and FC are indicated. Accumulation of Col protein is in green. The time windows of mesodermal early (E-CRM) and late (L-CRM) CRM activity are indicated by green lines. Right: muscle pattern of an abdominal segment highlighting DA2 (orange) and DA3 (green). (B) Schematic representation of the col transcribed region (http://flybase.org/cgi-bin/gbrowse2/dmel/?Search=1;name=FBgn0001319). The position of tested GMR and VT fragments are drawn as brown horizontal bars; the numbers are given for those active in DA3. The positions of clusters of in vivo Mef-2, Twi and Tin binding sites are indicated by vertical blue bars, the knMi15480 transposon insertion, used for the E-CRM deletion screening, by a vertical arrow. (C) Enlarged view of L-CRM indicating the juxtaposition of PC-specific and autoregulatory DA3-specific CRMs, Col, Mef2 and Twi binding sites, and the colΔL1.3 and colΔL0.5 deletions generated by CRISPR/cas9 genome editing. (D) Col transcription in wt and mutant embryos, genotypes indicated, visualised by in situ hybridisation to primary transcripts. A detail of the abdominal A2 segment (squared area) is shown in each panel. PMC col transcription is lost in colΔE embryos; stage 11, col transcription in the DA3/DO5 and DT1/DO4 PCs is detected in all strains; stage 14, DA3 syncytium transcription is lost in col1 and col ΔL1.3 embryos. * indicates col transcription in a multidendritic neuron (md).
The consequence of specific muscle identity defects on locomotion, a question of prime importance for progress on studying human myopathies which affect subsets of muscles, remains largely to be assessed. Genetically controlled muscle identity changes should, in principle, provide suitable models for studying locomotion deficits linked to muscle imbalance. However, mutations for known Drosophila iTFs are embryonic lethal and/or show pleiotropic phenotypes reflecting their multiple expression sites. Here, we took advantage of our previous characterisation of col expression in a single larval muscle, the DA3 muscle and of the two involved cis-regulatory modules (CRMs), early (E-CRM) and late (L-CRM), to generate muscle-specific mutants and circumvent lethality/pleiotropy of null mutants.
CRM deletions show that E-CRM and L-CRM act redundantly at the PC stage, emphasising that PC is a key stage in specification of muscle identity. L-CRM deletion results into loss of col transcription in DA3 FCs and morphological transformation of the DA3 into a DA2-like muscle. Removal of an auto-regulatory cis-module located in L-CRM specifically abolishes col activation in syncytial nuclei fusing with the DA3 FC. This leads to incomplete DA3 transformations and the formation of bifid/branched muscles of mixed DA3/DA2 morphology. In summary, our data show that i) the FC transcriptional program must be propagated to syncytial nuclei for a muscle to adopt a specific morphology; ii) the precise matching of muscle/muscle attachments over the intersegmental border, which leads to a staggered rows pattern, involves a process of selective adhesion controlled by iTFs; iii) branched muscles affect larval locomotion performance.
Branched muscles are typical of late, severe phases of human Duchenne Muscular Dystrophy (Chan and Head, 2011). Drosophila iTF CRM deletion could be an effective setting for creating muscle-specific transformations and branched muscles, as new paradigms to study myopathies specifically affecting subsets of muscles in humans.
Results
Redundant CRMs at the PC step ensure robustness of iTF transcription col transcription in myogenic lineages is first observed in a dorso-lateral PMC from which are sequentially selected several PCs (Dubois et al., 2016). It is subsequently maintained in two PCs, then one FC, the DA3 FC, and is activated in FCM nuclei recruited into the DA3 growing fibre (Crozatier and Vincent, 1999; Figure 1A). Two col CRMs containing embryonic in vivo binding sites for the master myogenic TFs, Mef-2 and Twist (Twi) (Sandmann et al., 2007; Zinzen et al., 2009) were previously identified, which reproduce this sequence of expression in reporter assays: E-CRM, which is active in the PMC and the DA3/DO5 and DT1/DO3 PCs, and L-CRM which is active in these same 2 PCs, the DA3 FC and DA3 syncytial nuclei (Enriquez et al., 2010; Dubois et al., 2007; Figure 1A; Figure 1—figure supplement 1 and Figure 1—figure supplement 2). With the prospect of using CRM deletions to generate muscle-specific mutants and to exclude the possible existence of additional, redundant enhancers (Cannavò et al., 2016), we conducted a systematic analysis of Gal4 reporter lines (Manning et al., 2012; Kvon et al., 2014) covering 36 kb of the col genomic region. A single reporter, GMR13B08, reproduces PMC Col expression and it overlaps E-CRM, and two reporters, GMR12G07 and GMR12H01, display DA3 expression and they both partly overlap L-CRM (Figure 1B and data not shown), attesting to the existence of only two col muscle CRMs.
The activity of E-CRM and L-CRM at different phases of muscle development raised the question of their respective roles in defining muscle identity. To address this question, we separately deleted each of them from the genome using the CrispR/Cas9 technology. Deletion of a 2,4 kb fragment removed the E-CRM. Two deletions within the L-CRM were generated: deletion of a 1.3 kb fragment removes the entire core region (Dubois et al., 2007) and deletion of a 0.5 kb fragment removes the Col autoregulation site (de Taffin et al., 2015; Figure 1C; Figure 1—figure supplement 1 and Figure 1—figure supplement 2). The corresponding mutant Drosophila strains are designated colΔE, colΔL1.3 and colΔL0.5, respectively. colΔL strains are homozygous viable and fertile. colΔE strain is homozygous female sterile, a sterility unrelated to col activity, since fertility is restored by placing colΔE over a deficiency (Df(2L)BSC429) (abbreviated Df in the rest of the text and figures) removing the entire col locus (data not shown). As a first step to determine the consequences of deleting either E-CRM or L-CRM, we compared col transcription between wt, col1 (a protein null mutant), colΔE and colΔL1.3 strains, using an intronic probe to detect nascent transcripts (Figure 1D). In col1 homozygous mutant embryos, col transcription is detected at the PMC and PC stages and lost at the FC stage, showing the key role of autoregulation in the maintenance of col transcription (Crozatier and Vincent, 1999; de Taffin et al., 2015). In colΔE embryos, we found that col is not activated in PMC cells, as could be expected. Yet, col transcription is detected in the DA3/DO5 and DT1/DO3 PCs, showing that inheritance of Col protein synthesised under E-CRM control is not required for activation of col transcription in PCs. A normal pattern is observed in the developing DA3 muscle, at stage 14. Reciprocal to E-CRM deletion, col is transcribed in PMC cells and the DA3/DO5 and DT1/DO3 PCs in colΔL1.3 embryos, but no more at stage 14, showing that L-CRM is required for col transcription maintenance.
Both E-CRM and L-CRM activity are detected in PCs. In absence of E-CRM, no Col protein is inherited from the PMC. Therefore, L-CRM activity in PCs cannot be due to col autoregulation. Analysis of new col-lacZyi reporter genes (Perry et al., 2010) revealed the existence of a PC-specific CRM located within the −3.3 to −2.3 fragment of L-CRM, i.e., which is separate from the autoregulatory CRM defined by the in vivo Col binding site and contains the in vivo binding sites for Mef2 and Twist (Figure 1C; Figure 1—figure supplement 3; Zinzen et al., 2009). Activity of this PC-specific CRM is transient and lost upon removal of Mef2 and Twist binding sites (Figure 1—figure supplement 3). Overall, we conclude that two CRMs separately drive col transcription in muscle PCs, suggesting that robust iTF expression at the PC stage is critical to confer a muscle its identity.
col CRM deletions lead to muscle transformation and branched muscles
Having deleted separately each col CRM allowed to assess the respective roles of iTF transcription before or after the PC step. To compare the different CRM deletions, we placed each of them over the deficiency Df chromosome. We introduced the L-CRM-moeGFP reporter to visualise the DA3 morphology at stage 15 (Enriquez et al., 2012). Control (+/Df) embryos display reporter expression in the DA3/DO5 and DT1/DO3 PCs at stage 11 and the DA3 muscle at stage 15 (Figure 2A). The same pattern is observed in PCs for all col-CRM deletion strains, consistent with transcript analyses (Figure 1D). L-CRM-moeGFP expression at stage 15 shows that the DA3 morphology is normal in about 80% of segments in colΔE/Df embryos (Figure 2A–B), and we did not pursue the analysis of this deletion strain. Low level GFP expression in colΔL1.3/Df embryos, consistent with col transcription data (Figure 1D), shows that the DA3 muscle is most often (85.2% of segments) transformed into a DA2-like muscle (designated below as DA3>DA2; Figure 2A–B), like in col null mutant embryos (Enriquez et al., 2012). In colΔL0.5/Df embryos, i.e, when only the autoregulation module has been deleted, a high number (29%) of branched muscles is observed (Figure 2A–B). Branched muscles correspond to incomplete transformations, with two stable anterior attachment sites, overlapping the DA3 and DA2 sites in wt embryos. The high ratios of either complete (DA3>DA2) or incomplete (branched) transformations in L-CRM deletion mutants demonstrate that an iTF CRM deletion strategy is effective for creating viable muscle-specific identity mutants and explore branched muscle properties.
Figure 2
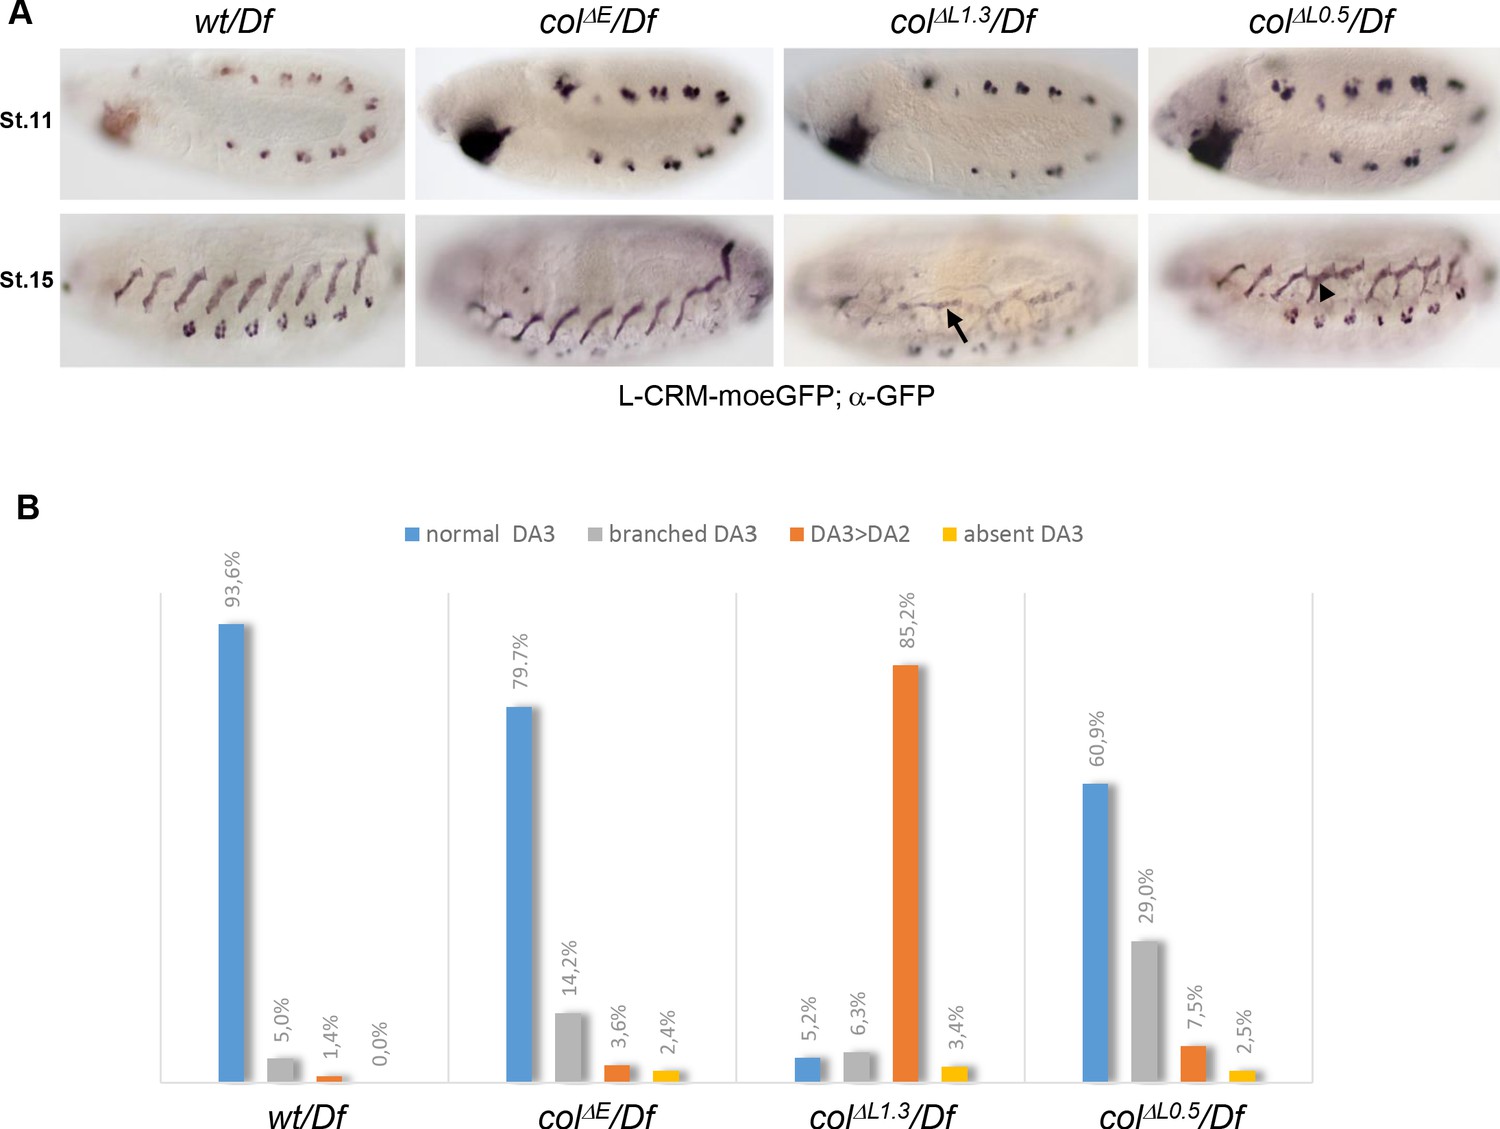
DA3 muscle transformations upon col-CRM deletions.
(A) L-CRM-moeGFP expression in stage 11 and 15 hemizygous embryos, as indicated. GFP expression in PCs at stage 11 is similar in all strains. DA3>DA2 transformations (arrow) and branched DA3 muscles (arrowhead) are observed in colΔL embryos. (B) Quantification of the relative proportions of normal DA3, branched DA3, DA3>DA2 transformation and absence of DA3 muscles in wt, colΔE, colΔL1.3 and colΔL0.5 hemizygous embryos. A minimum of 100 A1-A7 abdominal segments of stage 15–16 embryos were analysed for each genotype. (+/Df: n = 127 segments - 16 embryos; colΔE/Df: n = 170 segments - 23 embryos; colΔL1.3/Df: n = 190 segments - 27 embryos; colΔL0.5/Df: n = 103 segments - 13 embryos).
Re-programming of syncytial nuclei is required for muscle morphological identity
Complete vs incomplete transformations in colΔL1.3 versus colΔL0.5 deletions suggest that proper level and/or maintenance of iTF expression is crucial for proper muscle development. This led us to compare the pattern of Col protein in growing DA3 syncytium between wt, colΔL1.3 and colΔL0.5 embryos. In either deletion strain, Col is detected in PCs at stage 11 but not in muscles at stage 15 (Figure 3A). However, at stage 14, some Col protein is still detected in muscle precursors in colΔL0.5, not in colΔL1.3 embryos (Figure 3B). To trace the origin of this difference, we examined col transcription in the DA3 PC, FC and stage 14 syncytium using Df/hemizygous embryos which display one hybridisation dot per active nucleus (Figure 3C). In control wt/Df embryos, a dot is systematically detected in the DA3/DO5 PC (20/20 segments; five embryos analysed), the DA3 FC (20/20) and 80% of DA3 nuclei at stage 14 (6 of 7–8 nuclei per fibre on average; 27 segments). A dot is detected as well in the DA3/DO5 PC, in either colΔL1.3 (21/21) or colΔL0.5 (18/18) embryos, reflecting E-CRM activity (Figure 1D). In colΔL0.5 embryos, a col hybridisation dot is detected in the DA3 FC (19/19) and in one nucleus, likely the FC nucleus (11/21 segments), sometimes two nuclei at stage 14. In colΔL1.3 embryos, however, col transcription is only detected in a minor fraction of FCs (4/15) and is completely lost at stage 14 (0/6–7 nuclei per fibre on average; 24 segments). Patterns similar to stage 14 are observed at stage 15, while at stage 16, col transcription is detected neither in L-CRM deletion strains nor in control (Figure 3—figure supplement 1). Since col transcription at, and from, the PC stage appears to be nodal to DA3 identity, we measured the level of col transcripts relative to nautilus (nau), the Drosophila MyoD-MRF serving as internal reference (Figure 3D and Figure 3—figure supplement 2). As expected, similar levels of col transcription are found in the DA3 PC, in control (Mean ± sem: 1.22 ± 0.06; n = 18), colΔL1.3 (1.15 ± 0.04; n = 26) and colΔL0.5 embryos (1.19 ± 0.04; n = 18), which confirms handling by the E-CRM, with only a minor contribution from the L-CRM (Figure 1D). On the contrary, high level of col transcription in the DA3 FC in wt embryos (2.20 ± 0.05; n = 28) is dependent upon L-CRM activity, since a drop is observed in colΔL1.3 FCs (1.10 ± 0.04; n = 24), p<0.001. More precisely, it is dependent upon the presence of Mef2 and Twist binding sites since a basal level of transcription is still observed when only the col autoregulation module is deleted (colΔL0.5: 1.41 ± 0.04; n = 25). Quantification of col and nau transcripts shows that the col/nau increase between the PC and FC stages in wt embryo is due to increased col transcription while the level of nau is relatively constant and is unaffected in col L-CRM mutants (Figure 3—figure supplement 2). Together, the data suggest that binding of Mef2 and Twist is required to prime col transcription in the FC nucleus before autoregulation takes off (Figure 3E). Taken with one another, Col immunostaining, FISH data and col transcription quantification indicate that sustained col transcription in the FC nucleus in colΔL0.5 embryos (Figure 3C–D), provides enough Col protein for some uptake by other DA3 nuclei at stage 14, and this leads to their partial reprogramming to DA3 identity. Partial reprogramming could, in turn, explain the formation of branched muscles retaining some DA3 morphological characters. Moreover, the colΔL1.3 and colΔL0.5 expression data and deletion phenotypes show that both iTF transcription in the FC and reprogramming of ‘naïve’ syncytial nuclei contribute to ensure robust muscle morphological identity (Figure 3E).
Figure 3 with 2 supplements see all
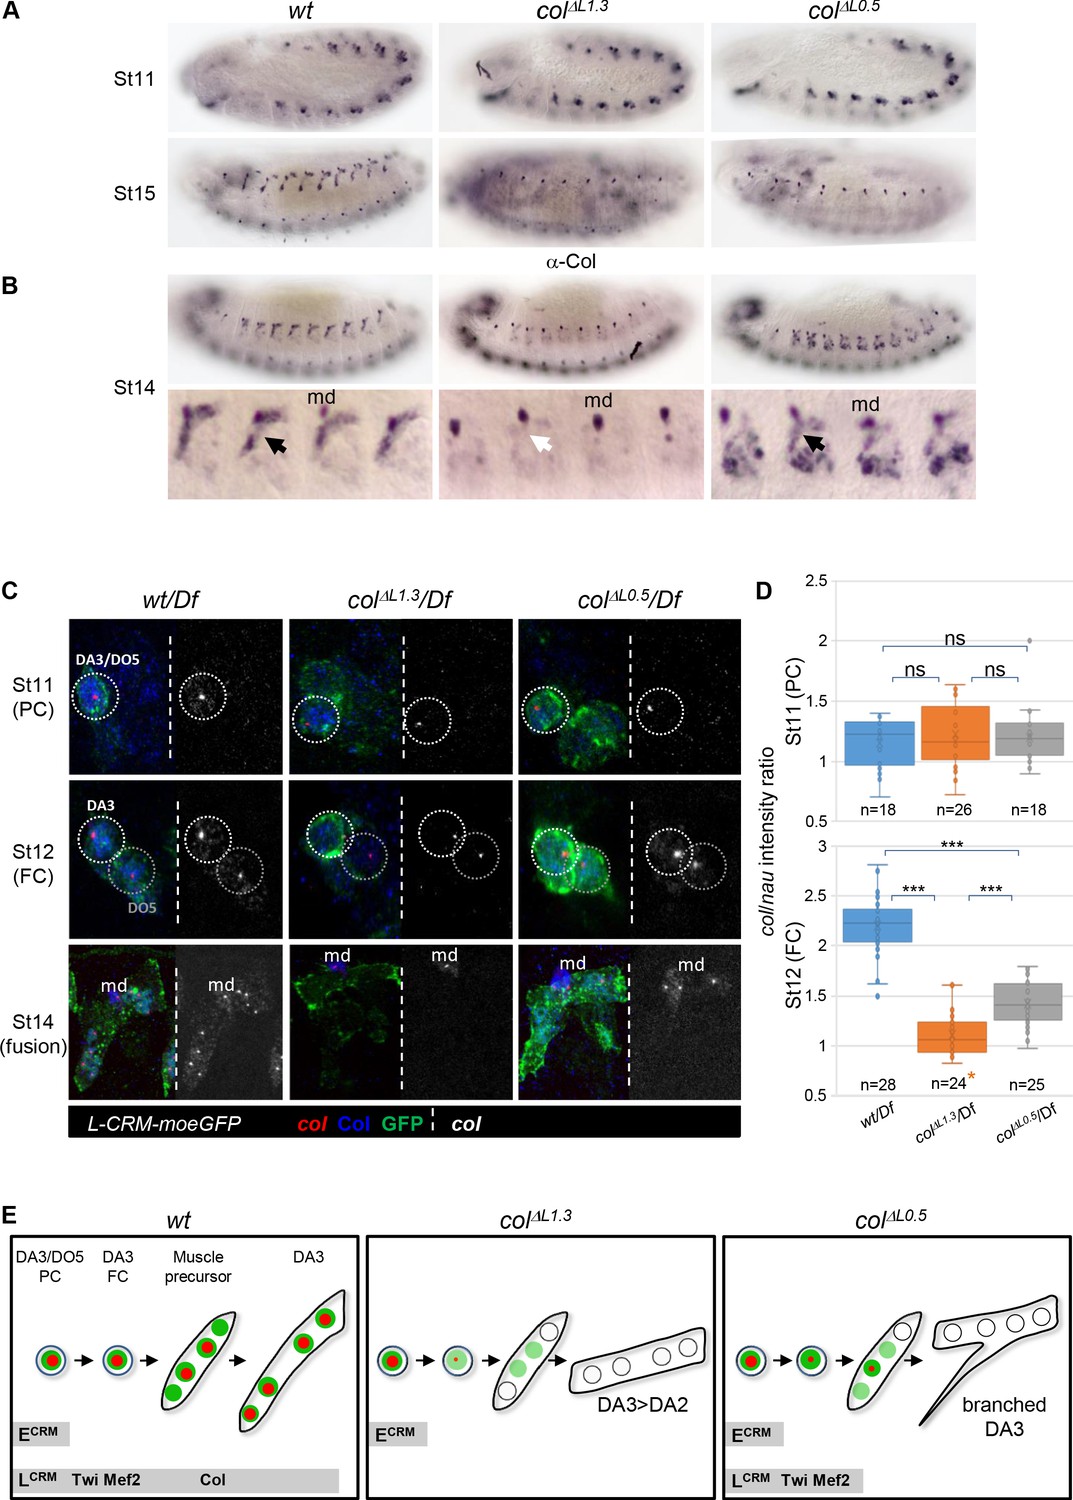
Identity reprogramming of syncytial nuclei controls the final muscle morphology.
(A) Col immunostaining of wt, colΔL1.3 and colΔL0.5 embryos, showing a normal pattern at stage 11 and complete absence of Col protein at stage 15 in both colΔL embryos. (B) Stage14 embryos with a close up view of 4 segments shows low amounts of Col protein (black arrow) in the growing DA3 muscle in colΔL0.5 and absence in col ΔL1.3 embryos (white arrow). Position of the multidendritic neuron (md) is indicated. (C) Col transcription (red dots), Col protein (blue) and L-CRM-moeGFP expression (green) in the DA3/DO5 PC, stage 11, DA3 FC, stage 12, and developing DA3 muscle, stage 14, in wt/Df, colΔL1.3/Df and colΔL0.5/Df; L-CRM-moeGFP embryos. In each panel, col transcripts are shown separately in black and white. col transcription ceases after FC stage in colΔL1.3 embryos and does not propagate to other syncytial nuclei in col ΔL0.5 embryos. (D) Quantification of col primary transcripts level in PC and FC nuclei; orange asterisk: col transcription in FCs is generally lost in colΔL1.3 embryos; quantification was done on a small fraction of FCs; n: number of PC or FC analysed, using 5 or six embryos at each stage 11 and 12; 15 colΔL1.3 embryos were used for the FC stage (Mean ± sem and ***: p<0.001). (E) Schematic representation of the dynamics of col transcription (red dots) and Col protein (green) in the DA3/DO5 PC, the DA3 FC, muscle precursor, and DA3, DA3>DA2 and branched DA3 muscles in wt, colΔ1.3 and col ΔL0.5 embryos, respectively. Temporal activity of E-CRM and L-CRM is represented by horizontal grey bars.
Muscle attachment: tendon attraction and muscle-muscle matching
We next investigated in more detail how ectopic muscle attachment sites at the origin of transformed and branched muscles are selected and stabilised. Double staining of ready-to-hatch (st17) wt embryos for F-actin and Ilk-GFP, a component of muscle attachment sites (Zervas et al., 2011; Sarov et al., 2016) shows that the DA3 posterior edge anchors to dorsal, and anterior edge to lateral intersegmental tendon cells (Figure 4A), giving its final acute shape (Bate, 1990). Moreover, the DA3 and DA2, as well as the DA2 and DA1 muscles precisely align with each other over each intersegmental border, forming heterotypic muscle-muscle attachment (iMAS; [Maartens and Brown, 2015]) at the origin of the staggered rows disposition of DA muscles. No DA3/DA3 (homotypic) iMAS surface is observed (Figure 4A). On the contrary, in colΔL1.3 embryos, the anterior edge of DA3>DA2 transformed muscles anchors to dorsal tendon cells instead of lateral intersegmental tendon cells, leading to a ‘dual DA3>DA2 morphology’, DA2-like at the anterior, and DA3 at the posterior edge. This dual identity leads to iMASs between adjacent DA3>DA2 muscles (Figure 4A). As a consequence, DA2 iMASs are shifted dorsally and the general pattern of DA muscles is affected.
Figure 4
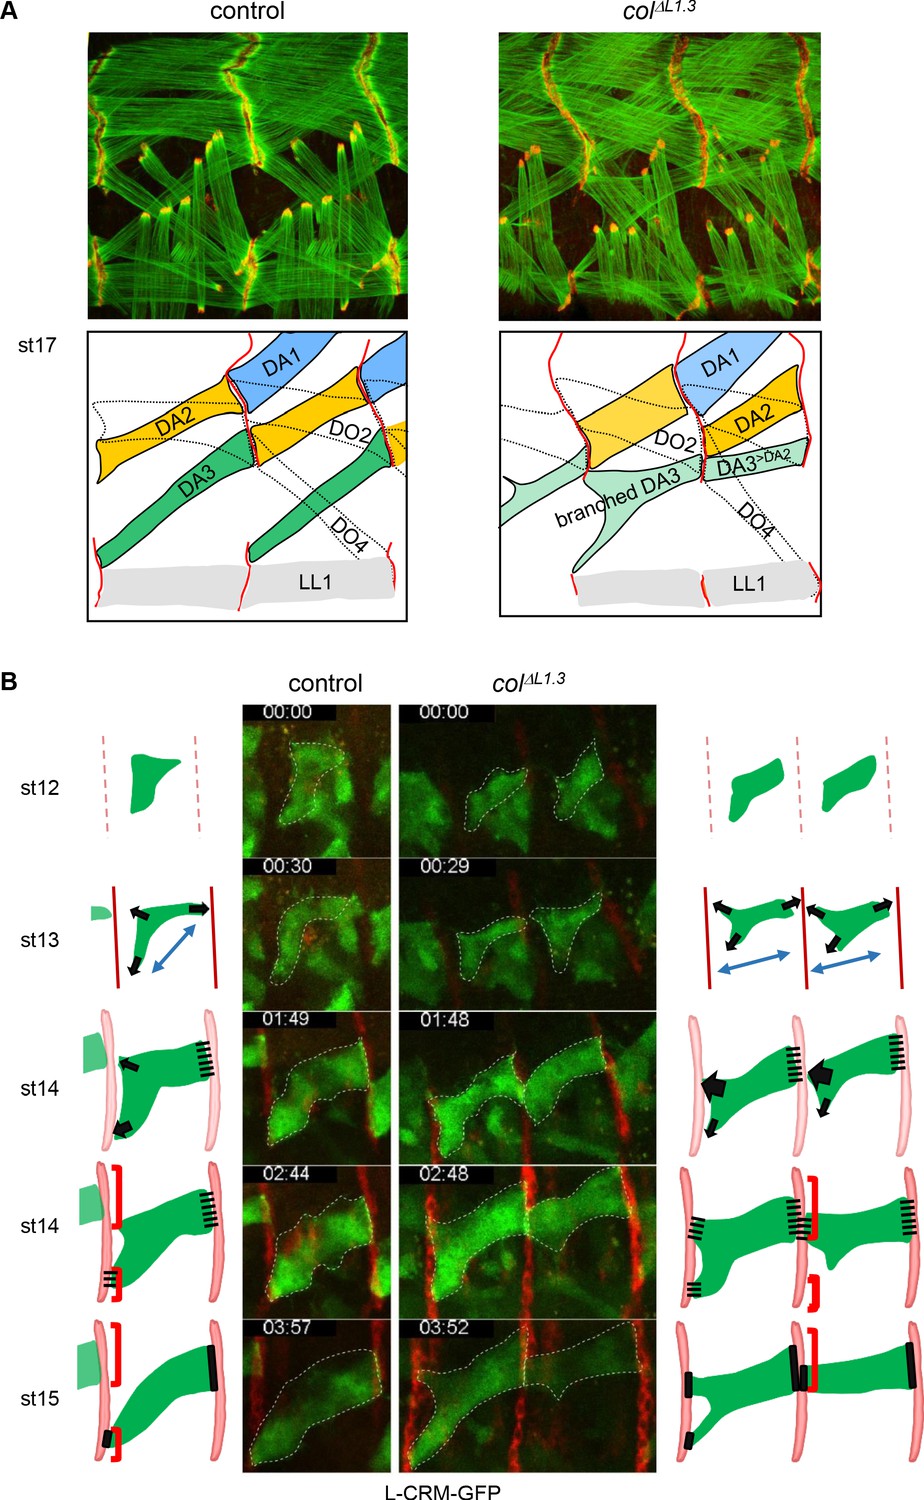
Multistep muscle attachment to selected tendon cells.
(A) F-actin (green) and Ilk-GFP (red) staining of stage 17 control and colΔL1.3 embryos, showing heterotypic and homotypic muscle attachment sites, respectively. A drawing illustrates muscle matching in control embryos and mismatching in col ΔL1.3 embryos, with DA1, DA2 and DA3 muscles coloured in blue, yellow and green, respectively and attachment sites as red lines. (B) Snapshots of live imaging DA3 muscle development, using L-CRM-moeGFP expression (green). Tendon cell precursors express stripe-Gal4; UAS-RFP (red). Embryos were filmed during 4 hr (Sup. Videos 1 and 2) and Z sections collected every ~2–2.5 min. The outlines of the developing muscles are schematised for each stage. In both control (left, one segment shown) and colΔL1.3 embryos (right, two segments shown), the posterior muscle end reaches the intersegmental border first. At stage 14, wt DA3 contacts both dorsal and lateral tendon cells at its anterior end. In colΔL1.3 embryos, the anterior dorsal projections fail to retract, leading to ectopic DA3>DA2 attachment and branched muscles.
To explore the dynamics of DA3 muscle attachment, we live-imaged wt and colΔL1.3 embryos, starting at stage 12 (defined as t0 in Videos 1 and 2). The DA3 muscle is visualised by L-CRM-moeGFP and tendon cell along the entire intersegmental border by stripe Gal4;UASmCD8RFP (Volohonsky et al., 2007). In wt embryos between stages 12 and 13 (Video 1; Figure 4B), the DA3 muscle precursor extends protrusions towards dorsal tendon cells, posteriorly, and both dorsal and lateral tendon cells, anteriorly, diverging from a bipolar extension scheme (Schnorrer and Dickson, 2004). At stage 14, the posterior DA3 edge makes contacts with dorsal tendon cells before the anterior edge(s) reaches the intersegmental border, a time gap previously observed during live-imaging of a ventro-lateral muscle (Gilsohn and Volk, 2010). In addition, numerous filopodia emanate from the DA3 dorsal surface and contact the DA2 ventral surface, contributing to give the DA3 muscle precursor its transient angled-shape. At late stage 14, the posterior DA3 attachment widens parallel to the intersegmental border. Its anterior attachment to lateral tendon cells in turn becomes stable, whereas dorsal anterior filipodia appear to be repelled from the intersegmental border where the DA3 muscle in the preceding segment is attached. Remaining filopodia are limited to the rims of DA3 anchoring, possibly suggesting a mechanism of homotypic repulsion. In colΔL1.3 embryos, the main axis of the DA3>DA2 muscle precursor elongation is more longitudinal than wt, already at stage 12 (Video 2; Figure 4B). At stage 13 and like in wt, many protrusions emanate from the DA3 dorsal surface, but unlike in wt, protrusions contacting dorsal tendon cells do not retract at later stages when they contact the DA3>DA2 muscle from the preceding segment. Rather, stabilisation of contacts made by these protrusions prefigures abnormal DA3>DA2/DA3>DA2 iMAS formation (Figure 4A). In some segments, contacts with lateral tendon cells are also stabilised, resulting into branched muscles. In summary, imaging of live wt embryos illustrates different steps involved in establishment of the acute DA3 orientation: posterior attachment to dorsal tendon cells at the same time as anterior exploration of dorsal and lateral tendon cell. This is followed by DA3 attachment to lateral, and retraction from dorsal tendon cells (Figure 4B, Video 1), cumulating into heterotypic DA3/DA2 iMAS stabilisation (Figure 4A and B). This retraction does not take place in colΔL1.3 embryos (Figure 4B and Video 2).
Video 1
Live-imaging of wt embryos.
The DA3 muscle is visualised by L-CRM-moeGFP (green) and tendon cell along the entire intersegmental border by stripe Gal4;UASmCD8RFP (red). Embryos were filmed during 4 hr. See also the legend of Figure 4.
Video 2
Live-imaging of colΔL1.3 embryos.
The DA3 muscle is visualised by L-CRM-moeGFP (green) and tendon cell along the entire intersegmental border by stripe Gal4;UASmCD8RFP (red). Embryos were filmed during 4 hr. See also the legend of Figure 4.
Muscle attachment: heterotypic adhesion
Further determining how DA3>DA2/DA3>DA2 homotypic attachment could interfere with the staggered rows pattern of DA muscles, required to visualise at the same time the DA3 and DA2 muscles and tendon cells contours. Vestigial (Vg) is expressed in DA muscles (Deng et al., 2010; Tixier et al., 2010). We screened the vg regulatory landscape and characterised one vg CRM active in the DA3 and DA2 (and VL1) muscles, VgM1 (Figure 5—figure supplement 1). Expressing together VgM1-mCD8GFP-H2bRFP, L-CRM-moeGFP and stripeGal4:UAS-mCD8RFP, and co-staining of stage 16 control embryos for α-Spectrin, a protein enriched at muscle attachment sites, shows that the posterior edge of DA3 precisely aligns with the anterior edge of DA2 (Figure 5A, Figure 5—figure supplement 1), suggesting heterotypic attractive cues. This attraction is already observed at stage 14, when the dorsal DA3 and ventral DA2 surfaces contact each other via numerous protrusions (Figure 5A and B; Figure 5—figure supplement 2). Strikingly, at stage 15, the contact zone gets away from intersegmental borders and the DA3/DA3 and DA2/DA2 homotypic connections disappear, to give way to heterotypic DA3/DA2 stable iMAS formation. In colΔL1.3 embryos, the initial steps, stages 14 and 15, are similar to wt, except for the absence of stable connection of DA3>DA2 to lateral tendon cells, as seen by live imaging (Video 2). At stage 16, DA3>DA2/DA3>DA2 and DA3>DA2/DA2 iMASs are privileged, while similar to control, no homotypic DA2/DA2 iMAS forms, suggesting homotypic repulsion (Figure 4; Figure 5A). Together, the data indicate that the precise pattern of iMASs and muscles is contributed by a combination of attractive and, possibly, repulsive cues downstream of muscle iTFs (Figure 5B).
Figure 5 with 2 supplements see all

DA3 heterotypic and homotypic muscle attachment sites (iMAS) in wt and L-CRM mutants.
(A) Immunostaining of wt and colΔL1.3 VgM1-moeGFP-H2bRFP; srGal4 >mcd8 RFP; L-CRM-moeGFP embryos for GFP (green), RFP (red) and Spectrin (blue). DA3 (DA3>DA2) and DA2 muscles are indicated in each panel. At stage 14, the wt DA3 and colΔL1.3 DA3>DA2 attachment sites partly align over the intersegmental border (circled). Their dorsal surface closely contacts DA2 via numerous protrusions; at stage 15, likely because homotypic DA3/DA3 and DA2/DA2 repulsion, these protrusions are restricted away from intersegmental borders in wt embryos while maintained in colΔL1.3. At stage 16, stable heterotypic DA3/DA2 contacts in wt, and both homotypic DA3>DA2/DA3>DA2 and DA3>DA2/DA2 contacts are stabilised. Anti-Spectrin staining is shown in black and white on the right of each panel, to indicate the position of the dorsal iMASs. (B) Schematic drawings of DA muscle development (green) in wt and colΔL1.3embryos; interpreted from data in Figure 4 and supplementary videos. Arrows indicate attractive cues, broken lines repulsive cues, thin circles attachment initiation, thick circles, attachment stabilisation. DA3 MAS initiation starts earlier at its posterior than anterior end. Homotypic repulsion between muscles of same identity leads to DA3 posterior attachment to lateral tendon cells. Repulsion does not operate upon DA3>DA2 transformation, leading to stable homotypic DA3>DA2 and DA3>DA2/DA2 iMASs.
Muscle strength lines in larvae
To investigate the impact of embryonic muscle patterning defects on Drosophila larval crawling, we first recorded the fraction of DA3, DA3>DA2 and branched muscles in 3rd instar wt and colΔLCRM larvae expressing GFP under control of the Myosin heavy chain (Mhc) promotor region (Figure 6A). It conforms to the statistics in late embryos (Figure 2B), except for an increased proportion of branched muscles, which could reflect under-evaluation of their number in embryos, due to threshold detection limit of L-CRM-moeGFP expression in thin fibres (Figure 6B). We then examined the pattern of MASs, using scanning electron microscopy (SEM) of dissected larval filets (Figure 6C; Figure 6—figure supplement 1). In wt larvae, as seen in stage 17 embryos (Figure 4A), the anterior edge of the DA3 muscle is anchored to a nodal lateral attachment site shared with the LL1 muscle, while its posterior edge aligns with the anterior edge of the DA2 muscle in the next posterior segment. Precise heterotypic DA2/DA1 iMASs are also visible over each intersegmental border. The regular alignment of the DA1, DA2 and DA3 muscles both draws strength lines spanning three adjacent segments, and regular tension surfaces between segments (Figure 6C; Figure 6—figure supplement 1). In colΔL1.3 larvae, the anterior DA3 muscle attachment has shifted from lateral to dorsal to form a DA3>DA2/DA3>DA2 homotypic iMAS (Figure 6C). This leads in turn to the formation of narrow, ectopic DA2/DA2 contacts and the DA1-DA2-DA3 strength line is distorted (Figure 6—figure supplement 1). In case of branched DA3 muscles, two strength lines co-exist (Figure 6C and Figure 6—figure supplement 1). In conclusion, SEM analyses of larval muscles show that loss of DA3 identity leads to ectopic iMASs between several dorsal internal muscles, distortion of the staggered ends architecture of DA muscles and of their alignment between consecutive segments.
Figure 6 with 1 supplement see all
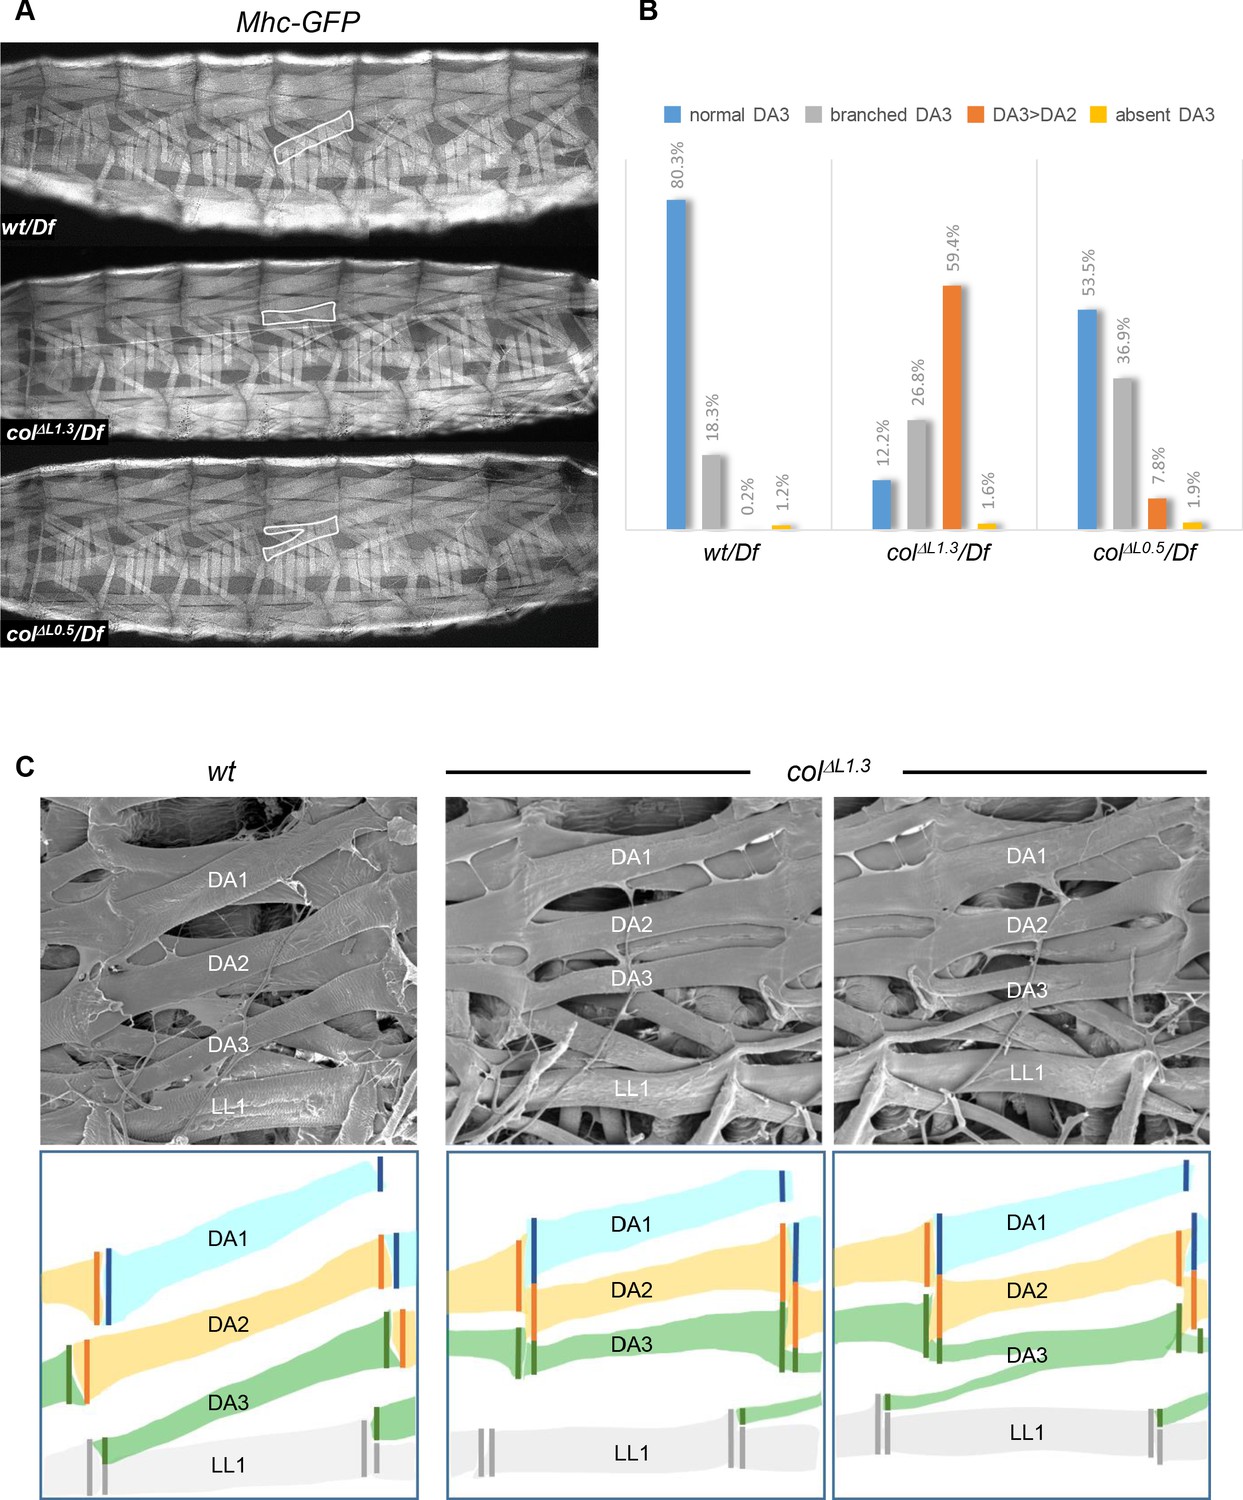
Muscle mismatching in L-CRM mutant larvae.
(A) Mhc-GFP expression in control, colΔL1.3/Df and colΔL0.5/Df live 3rd instar larvae; lateral views, anterior to the left. Examples of DA3, DA3>DA2 and DA3 branched muscles are circled in white. (B) Quantification of the relative proportions of DA3, branched DA3, DA3>DA2 and absence of DA3 muscles in A1 to A7 segments of wt/Df, colΔL1.3/Df and colΔL0.5/Df; Mhc-GFP larvae; (wt/Df, n = 375 segments/27 larvae; colΔL1.3/Df, n = 320/23; colΔL0.5/Df, n = 264/19). (C) Scanning electron microscopy of filleted larvae showing the dorsal and dorso-lateral muscles, schematically colour-coded below. In wt larvae, the DA muscles are parallel to each other within a segment with precise matching of the DA3/DA2 and DA2/DA1 MASs at each posterior segmental border. In colΔL1.3 larvae, DA3>DA2 muscles show homotypic, dorsal MASs and the DA3/LL1 connection is lost. The posterior MASs of branched DA3 is composite.
Branched muscles result in subtle locomotion defects
Drosophila larval crawling relies upon ordered abdominal body wall muscle contractions (Heckscher et al., 2012). The distorted muscle patterns observed in colΔL1.3 larvae raised the question of whether it impacted on locomotion. To address this question, we compared the locomotion of +/Df, colΔL1.3/Df and colΔL0.5/Df larvae using FIM (FTIR-based Imaging Method) and the FIMTrack software, which allows tracking simultaneously many larvae and quantitatively describing a variety of stereotypic movements (Risse et al., 2013; Risse et al., 2014; Risse et al., 2017). Here, we focused on three parameters: crawling speed, stride length, stride duration. We first recorded the ‘walking rate’, also called crawling speed, during the first 20 s, after larvae have been dropped on the agarose gel. At that time, larvae engage an ‘escape response’ corresponding to an active crawling phase (Figure 7A). Box-plot graphs (left) show intra-variability for each of the three genotypes. Beyond this variability, we observe, however, that colΔL0.5/Df larvae display a significantly reduced crawling speed on average 1.05 ± 0.034 mm/sec (n = 108), compared to 1.15 ± 0.031 mm/sec for +/Df controls (n = 118), (p=0.03) (Figure 7A). To further investigate the origin of this speed reduction, we measured two crawling speed parameters: stride length and stride duration (Figure 7B–C). A significantly shorter stride was measured for colΔL0.5/Df larvae (1.08 ± 0.025 mm) compared to control +/Df larvae (1.17 ± 0.024 mm), (p=0.008). Furthermore, stride duration was extended, from (1.09 ± 0.014 s) for +/Df larvae to 1.15 ± 0.017 s for colΔL0.5/Df larvae. For both crawling speed, stride length and stride duration, colΔL1.3/Df larvae (n = 112) display intermediate values. Yet, differences with either control or colΔL1.3/Df larvae fall below the significance threshold level, suggesting that mis-orientation of the DA3>DA2 muscle does not, by itself, significantly impair the efficiency of segment contraction. Since larval crawling integrates information provided by neuronal networks, relayed by synaptic connections between motoneurons (MNs) and muscles, the mobility phenotype of colΔL0.5/Df larvae could indicate defects motor innervation of DA3>DA2 muscles. The DA3 and DA2 muscles are innervated by the intersegmental nerve (ISN) which fasciculates motor axons reaching dorsal muscles (Hoang and Chiba, 2001; Landgraf and Thor, 2006). To examine the DA3>DA2 and branched DA3 innervation, we used anti-HRP and phalloidin staining to view ISN motoneuron projections and muscles, respectively (Figure 7—figure supplement 1). In wt embryos, the MN projection which innervates DA3 leaves the ISN ventral to the DA3 position and orients left such that the neuromuscular junction locates to the first anterior third of the muscle (100%; n = 28 segments). In case of a complete DA3>DA2 transformation, a MN projection is still observed (100%; n = 15 segments), which leaves the ISN at a more dorsal position than wt, reflecting the dorsal shift of the DA3>DA2, relative to DA3 muscle. In case of branched muscles, the lower branch is always innervated (100%, n = 30 segments). Only in 20% of the cases, the second, upper branch is also innervated.
Figure 7 with 1 supplement see all
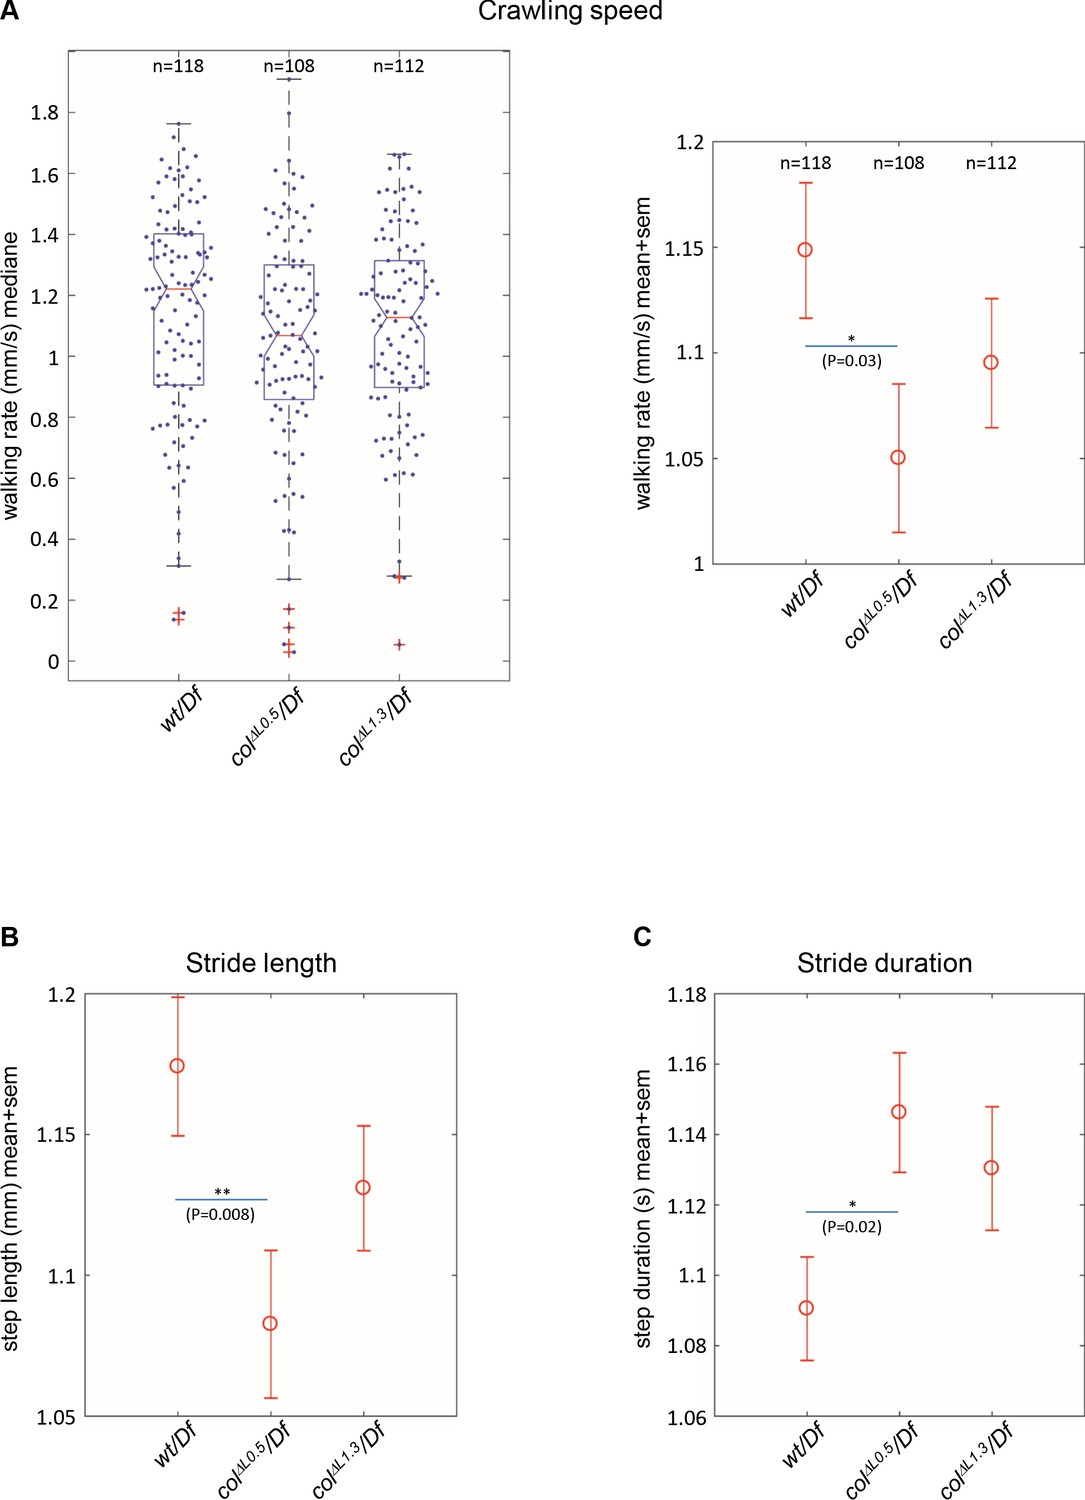
Branched muscles result in specific locomotion defects.
(A) Left, Tukey’s diagrams (box-plot graph) showing the walking rate in mm/s (crawling speed) of wt/Df (n = 118), colΔL0.5/Df (n = 108) and colΔL1.3/Df (n = 112) larvae. Each point represents the average measurement for one larva, recorded during 20 s. 50% of points are located within the Tukey’s diagram. The red line gives the median, the narrowed area, the confidence interval of the median (95%). Right, same data as left, showing the mean speed ± standard error of mean (SEM) for each genotypes. (B) Stride length in mm. (C) Stride duration in s. The number of larvae (n) tested for each genotype is indicated in (A). Only significant differences are indicated (*p<0.05 and **p<0.01).
These innervation data indicate that fully transformed DA3 muscles are innervated, but only one branch of branched muscles is, in most cases. It remains to be established whether this asymmetric innervation contributes to the reduced crawling speed of colΔL0.5 larvae.
Discussion
The stereotyped set of 30 somatic muscles in each abdominal segment which underlies Drosophila larval crawling has been thoroughly described many years ago (Bate, 1990; Bate and Rushton, 1993). One essential aspect laid out at that time was the concept of founder cell (FC), i.e., the assignment to form a distinctive muscle to a single founder myoblast able to recruit other myoblasts by fusion. The morphological identity of each muscle is foreseen by a specific pattern of iTF expression in its FC (Tixier et al., 2010; Frasch, 1999). Here, we engineered a CRM deletion strategy connecting iTF expression to the larval musculature architecture and locomotion.
iTF transcription in muscle PCs; redundant CRMs
Some iTFs are transiently transcribed during Drosophila muscle development, for example, Kr and nau, others such as col, ladybird and slouch/S59, at every step of the process (Dubois et al., 2016; Knirr et al., 1999; Bataillé et al., 2017; Dubois et al., 2007; Michelson et al., 1990; Jagla et al., 2002). Reporter analyses indicated that col transcription is controlled by two sequentially acting CRMs, of overlapping activity at the PC step, suggesting a handover mechanism between CRMs at this stage (Enriquez et al., 2012). However, deletion analyses show that L-CRM activity in PCs is not dependent, but redundant with E-CRM activity, and can be separated from col positive autoregulation that is specific to the DA3 lineage. This leads to a new model where iTF code refinement at each step of muscle identity specification, PMC >PC, PC >FC and FC >syncytial nuclei, is driven by a separate CRM. Distribution of the PC-identity information into two CRMs further supports the idea that iTF regulation at the PC stage is nodal to muscle identity specification (Carmena et al., 1998; Dubois et al., 2016; Enriquez et al., 2012; Jagla et al., 2002; Nose et al., 1998; Kumar et al., 2015). Our former analysis started to decrypt the combinatorial control of each dorso-lateral muscle identity, which involves at least eight different iTFs, in addition to Nau/MRF [Dubois et al., 2007]. Persistent, low level expression of Col protein in the DT1 and LL1 muscle precursors upon removal of the col autoregulatory module suggests the existence of both positively and negatively acting iTF-responsive elements in this module. Our present analysis concentrated on the DA3 lineage where col expression is maintained, whereas col is expressed in several PCs. Morphological transformations of other dorso-lateral muscles are observed at variable frequency in col protein null mutants (Enriquez et al., 2010), suggesting that E-CRM activity provides robustness to the combinatorial control of identity of these muscles and that robustness is likely also contributed by other iTFs (Dubois et al., 2016; Schnorrer and Dickson, 2004). PC/FC specific CRMs have only been functionally identified for a handful of muscle iTFs (Rivera et al., 2019). Computational predictions identified, however, several thousand putative muscle enhancers and uncovered extensive heterogeneity among the combinations of transcription factor binding sites in validated enhancers, beside sites for the core intrinsic muscle regulators Tin, Mef2 and Twi (Sandmann et al., 2007; Gisselbrecht et al., 2013; Cusanovich et al., 2018). Dissecting whether step-specific and redundant/distributed CRM configurations (Cannavò et al., 2016; Hong et al., 2008; Frankel et al., 2010) apply to many muscle iTFs and underlie the progressively refined control of final muscle patterns is a future step.
Distinctive muscle morphology requires identity reprogramming of fused myoblasts
The process by which iTFs determine the final morphological features of each muscle, is not fully understood. Fusing FCM nuclei generally adopt the iTF protein code of the FC nucleus, while propagation of iTF transcription and activation of realisation genes is muscle lineage-specific (Boukhatmi et al., 2012; Crozatier and Vincent, 1999; Knirr et al., 1999; Bataillé et al., 2010; Bataillé et al., 2017; Bourgouin et al., 1992). We have previously shown that Col protein import precedes activation of col transcription in fused FCM nuclei, and correlates with the activation of realisation genes, a sequence of events termed syncytial identity reprogramming (Bataillé et al., 2017; Dubois et al., 2007). Upon loss of col transcription in the DA3 FC (colΔ1.3 embryos), there is a complete DA3>DA2 transformation. When col transcription is maintained (colΔL0.5 embryos), in the DA3 FC but not propagated to other syncytial nuclei, there is an incomplete DA3 transformation into branched muscles. From this, two conclusions can be drawn: 1) Final selection of myotendinous connection sites is intrinsic to FC identity. 2) Identity reprogramming of syncytial nuclei is required for robustness of this selection and precise muscle patterns.
Identity shifts, a source of branched muscles
Live imaging of lateral-oblique and ventral transverse muscles development distinguished 3 phases of muscle elongation (Schnorrer and Dickson, 2004): 1) FC migration, stage 12, ending with the first FC/FCM fusion event and stretching of the muscle precursor along a given axis; 2) bipolar myotube elongation, characterised by the presence of extensive filopodia at both axis ends, in search for attachment sites, stages 13 to 15; 3) maturation of myotendinous attachment, stage 16. The formation of DA3>DA2 and branched muscles in CRM mutants recalls a transient exploration by the wt DA3 muscle precursor of both dorsal and lateral tendon cells, a process deviating from the bipolar migration/attachment scheme (Schweitzer et al., 2010; Enriquez et al., 2012; Schnorrer and Dickson, 2004; Bahri et al., 2009). Interestingly, ectopic Col expression in the DA2 muscle leads to reciprocal DA2>DA3 transformation as well as branched muscles (Boukhatmi et al., 2012). This indicates that selection of dorsal versus lateral tendon cells is a highly controlled process. A few molecules involved in targeted attachment of subsets of muscles to specific tendon cells have been identified: Kon tiki/Perdido, a single pass transmembrane protein and the PDZ protein DGrip for proper elongation of ventral longitudinal muscles (Schnorrer et al., 2007); the ArfGAp protein Git for sensing integrin signaling and halting elongation of Lateral Transverse (LT) muscles once their attachment site has been reached (Bahri et al., 2009; Richier et al., 2018). Robo/Slit signaling attracts muscles at segmental borders, the Slit ligand being expressed by tendons, and Robo and Robo2 receptors by elongating muscles. slit also acts as a short-range repellent contributing to the collapse of leading-edge filopodia when a muscle reaches the tendon extracellular matrix (Ordan and Volk, 2015; Ordan et al., 2015). In vivo imaging showed that the DA3 muscle fails to stop at the segment border in slit mutants and sometimes branches (Ordan et al., 2015). However, this is not observed in colΔLCRM; the DA3 slit branching pattern is rather similar to that frequently observed in nau mutants, with two posterior attachment sites in place of one (Dubois et al., 2016; Boukhatmi et al., 2012). Which realisation genes downstream of iTFs are responsible for the precision of DA attachment sites, that is, proper balancing attraction/repulsion cues, should be the focus of future studies.
Muscle staggered ends; heterotypic versus homotypic interactions?
In addition to attaching to tendon cells, it was previously shown that internal muscles attach to each other (Maartens and Brown, 2015; Bate and Rushton, 1993). Detailed imaging in both embryos and larvae shows that the DA3/DA2 and DA2/DA1 attachment sites precisely match over each segmental border, such that larval DA1, DA2, and DA3 align over three consecutive segments. Recording DA3 and DA3>DA2 muscle development by a combination of live imaging and immunostainings shows that DA3/DA2 matching in wt embryos results from both heterotypic DA3/DA2 attraction and, possibly, homotypic repulsion. Prior attachment of the posterior DA3 edge to dorsal tendon cells leads to retraction of filopodia issued from the homologous muscle in the next adjacent segment while stabilisation of heterotypic contacts results into DA3/DA2 iMAS formation over the intersegmental border. A similar process results in alignment of DA2 with DA1. Interestingly, DA3>DA2 establish both homotypic iMASs, and heterotypic iMASs with DA2, suggesting preserved attraction to tendon cells and partial loss of preferential heterotypic adhesion. Prior posterior attachment was previously observed during development of abdominal adult muscles (Currie and Bate, 1991). Whether this temporal sequence is instrumental in the precise matching of muscles over each segmental border and whether competition between muscles for the same tendon cells is also involved remain to be assessed. Cell matching is a widely used process during embryogenesis to construct complex tissue architecture. Selective filopodia adhesion has recently been shown to ensure precise matching between identical cardioblasts and boundaries between different cell identities in the Drosophila heart. In this case, homotypic matching is linked to differential expression by each cell type of the adhesion molecules, Fasciclin III and Ten-m (Zhang et al., 2018). Transcriptome analyses of specific muscles at different developmental times should allow to identify attractive and, possibly, repulsive molecules, acting in muscle precise matching.
Branched muscles impact on crawling speed
Drosophila larval crawling is a well-suited paradigm to link muscle contraction patterns and locomotor behaviour. Longitudinal, acute and oblique muscles within a larval segment contract together and, as they begin to relax, the contraction is propagated to the next segment, creating a peristaltic wave from tail to head (forward locomotion), or head to tail (backward locomotion) (Heckscher et al., 2012). The rhythmic movements of locomotion are part of behavorial routines that facilitate the exploration of an environment. Exploratory routines alternate straight line movement also called ‘active crawling phase’, with change of direction, the ‘reorientation phase’ (Günther et al., 2016; Berni et al., 2012; Lahiri et al., 2011). The active larval crawling phase requires an intense, prolonged muscular effort. In this study, we focused on crawling parameters during this phase. The crawling speed during the escape response is not significantly reduced in colΔL1.3/Df, compared to control +/Df larvae, indicating that muscle contraction is properly controlled and that a mechanical compensation mechanism for the DA3 mis-orientation could occur. However, it is significantly reduced in colΔL0.5/Df larvae. This seems paradoxical because the number of DA3>DA2 transformed muscles is higher in colΔL1.3/Df larvae. colΔL0.5/Df larvae present many branched muscles, however. While DA3>DA2 are always innervated, only one branch of branched muscles is, most of the time, raising the possibility that branched muscles do not contract properly, or with a gap in time (see Zarin et al., 2019). From these different observations, we can conclude: i) single muscle transformations only moderately impact crawling speed, raising the possibility of biomechanical compensation by other muscles; ii) branched muscles could be less efficient than fully transformed muscles. At this point, the reason why, – either mechanic weakness, improper innervation or impaired Ca2+ wave propagation, antagonistic force lines upon muscle contraction - may only be object of speculation.
The generation of branched muscles in Drosophila identity mutants is one important finding as branched muscle fibres accumulate in humans, following muscle regeneration after damage or in Duchenne muscular dystrophy patients (Chan and Head, 2011). It opens the possibility to investigate, in vivo, how physiological properties of branched fibres differ from morphologically normal fibres and associated mechanical instability in an otherwise normal muscle pattern.
Materials and methods
Key resources table
| Reagent type (species) or resource | Designation | Source or reference | Identifiers | Additional information |
|---|---|---|---|---|
| Strain, strain background (Drosophila melanogaster) | white[1118] | Bloomington Drosophila Stock Center | BDSC Cat# 3605, RRID:BDSC_3605 | |
| Strain, strain background (Drosophila melanogaster) | Df(2L)BSC429 | Bloomington Drosophila Stock Center | BDSC Cat# 24933, RRID:BDSC_24933 | |
| Strain, strain background (Drosophila melanogaster) | vasa-cas9VK00027 | Bloomington Drosophila Stock Center | BDSC Cat# 51324, RRID:BDSC_51324 | |
| Strain, strain background (Drosophila melanogaster) | sr-Gal4 | obtained from G. Morata, Madrid, Spain | ||
| Strain, strain background (Drosophila melanogaster) | Col1 | Our lab | Crozatier and Vincent, 1999 | |
| Strain, strain background (Drosophila melanogaster) | Mi{MIC}knMI15480/SM6a | Bloomington Drosophila Stock Center | BDSC Cat# 67516, RRID:BDSC_67516 | MiMic Line |
| Strain, strain background (Drosophila melanogaster) | GMR69G03 | Bloomington Drosophila Stock Center | BDSC Cat# 39500, RRID:BDSC_39500 | GMR line, GMR located in the Vg gene |
| Strain, strain background (Drosophila melanogaster) | GMR69G04 | Bloomington Drosophila Stock Center | #46616 | GMR line, GMR in the Vg gene |
| Strain, strain background (Drosophila melanogaster) | GMR69G05 | Bloomington Drosophila Stock Center | #39501 | GMR line, GMR in the Vg gene |
| Strain, strain background (Drosophila melanogaster) | GMR69G06 | Bloomington Drosophila Stock Center | #39502 | GMR line, GMR in the Vg gene |
| Strain, strain background (Drosophila melanogaster) | GMR69G07 | Bloomington Drosophila Stock Center | BDSC Cat# 47956, RRID:BDSC_47956 | GMR line, GMR in the Vg gene |
| Strain, strain background (Drosophila melanogaster) | GMR69G08 | Bloomington Drosophila Stock Center | BDSC Cat# 46617, RRID:BDSC_46617 | GMR line, GMR in the Vg gene |
| Strain, strain background (Drosophila melanogaster) | GMR69G09 | Bloomington Drosophila Stock Center | BDSC Cat# 46618 | GMR line, GMR in the Vg gene |
| Strain, strain background (Drosophila melanogaster) | GMR69G10 | Bloomington Drosophila Stock Center | BDSC Cat# 39503 | GMR line, GMR in the Vg gene |
| Strain, strain background (Drosophila melanogaster) | GMR69G12 | Bloomington Drosophila Stock Center | BDSC Cat# 46619 | GMR line, GMR in the Vg gene |
| Strain, strain background (Drosophila melanogaster) | GMR69G03 | Bloomington Drosophila Stock Center | BDSC Cat# 46620, RRID:BDSC_46620 | GMR line, GMR in the Vg gene |
| Strain, strain background (Drosophila melanogaster) | GMR12A09 | Bloomington Drosophila Stock Center | BDSC Cat# 47319 | GMR line, GMR in the Kn gene |
| Strain, strain background (Drosophila melanogaster) | GMR12G07 | Bloomington Drosophila Stock Center | BDSC Cat# 47854, RRID:BDSC_47854 | GMR line, GMR in the Kn gene |
| Strain, strain background (Drosophila melanogaster) | GMR12H01 | Bloomington Drosophila Stock Center | BDSC Cat# 48528, RRID:BDSC_48528 | GMR line, GMR in the Kn gene |
| Strain, strain background (Drosophila melanogaster) | GMR13A11 | Bloomington Drosophila Stock Center | BDSC Cat# 49248 | GMR line, GMR in the Kn gene |
| Strain, strain background (Drosophila melanogaster) | GMR13B06 | Bloomington Drosophila Stock Center | BDSC Cat# 48544, RRID:BDSC_48544 | GMR line, GMR in the Kn gene |
| Strain, strain background (Drosophila melanogaster) | GMR13B08 | Bloomington Drosophila Stock Center | BDSC Cat# 48546, RRID:BDSC_48546 | GMR line, GMR in the Kn gene |
| Strain, strain background (Drosophila melanogaster) | GMR13C09 | Bloomington Drosophila Stock Center | BDSC Cat# 48555, RRID:BDSC_48555 | GMR line, GMR in the Kn gene |
| Strain, strain background (Drosophila melanogaster) | GMR13C11 | Bloomington Drosophila Stock Center | BDSC Cat# 48556, RRID:BDSC_48556 | GMR line, GMR in the Kn gene |
| Strain, strain background (Drosophila melanogaster) | GMR13F08 | Bloomington Drosophila Stock Center | BDSC Cat# 48576, RRID:BDSC_48576 | GMR line, GMR in the Kn gene |
| Strain, strain background (Drosophila melanogaster) | GMR13F10 | Bloomington Drosophila Stock Center | BDSC Cat# 48578, RRID:BDSC_48578 | GMR line, GMR in the Kn gene |
| Strain, strain background (Drosophila melanogaster) | GMR47D05 | Bloomington Drosophila Stock Center | BDSC Cat# 47605, RRID:BDSC_47605 | GMR line, GMR in the Kn gene |
| Strain, strain background (Drosophila melanogaster) | GMR46H09 | Bloomington Drosophila Stock Center | BDSC Cat# 54712, RRID:BDSC_54712 | GMR line, GMR in the Kn gene |
| Antibody | anti-col (Mouse monoclonal) | Our lab | 1:50 Krzemień et al., 2007 | |
| Antibody | anti-LacZ (Mouse monoclonal) | Promega | Promega Cat# Z3781, RRID:AB_430877 | 1:1000 |
| Antibody | anti-spectrin (Mouse monoclonal) | Hybridoma Bank | DSHB Cat# 3A9 (323 or M10-2), RRID:AB_528473 | 1:200 |
| Antibody | anti-GFP (Rabbit polyclonal) | Biolabs | Torrey Pines Biolabs Cat# TP401 071519, RRID:AB_10013661 | 1:1000 |
| Antibody | anti-GFP (Chicken polyclonal) | Abcam | Abcam Cat# ab13970, RRID:AB_300798 | 1:500 |
| Antibody | Phalloidin-texas red | Thermofisher Scientific | Cat# Cat#T7471 | 1:500 |
| Antibody | Alexa fluor antibodies 488, 555 and 647 | Molecular probes | 1:300 | |
| Antibody | Alexa fluor 594 anti HRP | Jackson Immunological research | Jackson ImmunoResearch Labs Cat# 123-585-021, RRID:AB_2338966 | 1:300 |
| Antibody | Alexa fluor phalloidin | Thermofisher Scientific | Thermo Fisher Scientific Cat# A12381, RRID:AB_2315633 | 1:500 |
| Antibody | Biotinylated goat anti-mouse | Vector Laboratories | Vector Laboratories Cat# BA-9200, RRID:AB_2336171 | 1:2000 |
| Software, algorithm | ImageJ | Schneider et al., 2012 | ImageJ, RRID:SCR_003070 | https://imagej.nih.gov/ij/ |
| Software, algorithm | FIMTrack | Risse et al., 2014 | https://www.uni-muenster.de/PRIA/en/FIM/ | |
| Software, algorithm | MATLAB | MathWorks | MATLAB, RRID:SCR_001622 | https://www.mathworks.com/products/matlab-online.html |
| Other | FISH probes labelled with Quasar dye 670 (col) | Biosearch Technologies and this study | Kn first intron | |
| Other | FISH probes labelled with Quasar dye 570 (nau) | Biosearch Technologies and this study | Nau first and third introns |
Fly strains
Request a detailed protocolAll Drosophila melanogaster stocks and genetic crosses were grown using standard medium at 25°C. The strains used were white[1118], colLCRM 4–0.9 (Enriquez et al., 2010), col1 (Crozatier and Vincent, 1999), sr-Gal4 (obtained from G. Morata, Madrid, Spain). The 12 kn and 10 vg Janelia-Gal4 lines (GMR) (Pfeiffer et al., 2008), UAS-mcd8RFP, Mhc-GFP, Df(2L)BSC429, knMI15480 y1 w*; Mi{MIC}knMI15480/SM6a (BDSC_67516) (Nagarkar-Jaiswal et al., 2015), vasa-cas9VK00027 (BDSC_51324), Ilk-GFP (w1118; P{PTT-GB}IlkZCL3111) (BDSC_6831), lines were provided by the Bloomington Drosophila Stock Center. The col1 and Df(2L)BSC429 strains were balanced using CyO,{wgen11-lacZ} or CyO,{dfd-YFP} and homozygous mutant embryos or larvae identified by absence of lacZ or YFP expression, respectively.
CRM deletions generated by Crispr/Cas9
Request a detailed protocolGenomic col target sites were identified using http://tools.flycrispr.molbio.wisc.edu/targetFinder/ (Gratz et al., 2014). Prior to final selection of RNA guides (gRNA) for deletions of col CRMs, genomic PCR and sequencing of DNA from knMI15480 and vasa-cas9VK00027 flies was performed to check for polymorphisms in the targeted regions. Guides targeting E-CRM and L-CRM were inserted in the pCFD4: U6:3-gRNA vector (Addgene no: 49411) as described (Port et al., 2014); (see http://www.crisprflydesign.org/wp-content/uploads/2014/06/Cloning-with-pCFD4.pdf). All guides were verified by sequencing. The sequences of the oligonucleotides used to construct each gRNA expression plasmid are given in Figure 1—figure supplements 1 and 2. To delete the core region of L-CRM, vasa-cas9 embryos were microinjected with gRNAs in pCFD4 (200 ng/μl). To delete the E-CRM, knMI15480 embryos were injected with gRNA in pCFD4 (150 ng/μl) and pAct-Cas9U6 (400 ng/μl). Each adult hatched from an injected embryo was crossed to the balancer stock snaSco/CyO, {wgen11-LacZ} and 100–200 F1 fly were individually tested for either col CRM deletion by PCR on genomic DNA. A pre-screening for E-CRM deletion was based on the loss of yellow carried by Mimic knMI15480.
Reporter constructs
Request a detailed protocolThe yellow intron (yi), FlyBase ID #FBgn0004034 (position: 356918–359616) was inserted in the lacZ coding region between aa (Tyr 952) and aa (Ser 953) by standard PCR-based cloning position. The resulting fragment was cloned downstream of L-CRM inserted in a pAttB vector, and micro-injected in embryos for chromosomal insertion at position 68A4. VgM1-moeGFP was constructed by PCR amplification of the GMR69G04 and GMR69G05 overlap. The 1.4 kb amplicon (named VgM1) was inserted upstream of moeGFP to generate the pAttB VgM1-moeGFP construct. It was inserted at position 68A4 on the third chromosome.
Immunohistochemistry
Request a detailed protocolAntibody staining, in situ hybridisation with intronic probes and phalloidin staining were as described previously (Dubois et al., 2007). Primary antibodies were: mouse anti-Col (1/50; Boukhatmi et al., 2012; Dubois et al., 2007), anti-LacZ (1/1000; Promega), mouse anti α-Spectrin (1/200; Hybridoma Bank), rabbit anti-GFP (1/1000; Torrey Pines Biolabs), chicken anti-GFP (1/500; Abcam), Phalloidin-Texas RedX (1/500; Thermofisher Scientific). Secondary antibodies were: Alexa Fluor 488-, 555- and 647- conjugated antibodies (1/300; Molecular Probes) and biotinylated goat anti-mouse (1/2000; Vector Laboratories).
Motoneurons and muscles visualisation
Request a detailed protocolTo both visualise motoneuron axonal pathways and muscles, fillets of control and colΔL1.3 third instar larvae were incubated overnight with Alexa 594-conjugated anti-HRP (1/300; Jackson Immunological Research) and Alexa Fluor 488 Phalloidin (1/500; Thermofisher Scientific), at 4°C. To prepare fillets, third instar larvae placed in myorelaxant buffer (Yalgin et al., 2011), were cut longitudinally on the ventral side to expose the dorsal and dorso-lateral musculature. Fillets were then fixed 1 hr in 4% formaldehyde and washed in PBT.
In situ hybridisation
Request a detailed protocolIn situ hybridisation with Stellaris RNA FISH probes were done as described by the manufacturer for Drosophila embryos (https://www.biosearchtech.com). The FISH probe sets for col and nau were designed using the Stellaris probe designer (https://www.biosearchtech.com/stellarisdesigner) and labelled with Quasar 670 Dye (col) and Quasar 570 Dye (nau) (Stellaris Biosearch Technologies). One set of 48 oligonucleotides was designed against the first col intron to detect primary nuclear transcripts. Another set of 48 oligonucleotides was also designed against the first and third nau introns. When antibody staining and FISH were combined, the standard immuno-histochemistry protocol was performed first, with 1 U/μl of RNase inhibitor from Promega included in all solutions, followed by the FISH protocol. Confocal sections were acquired on Leica SP8 or SPE microscopes at 40x or 63x magnification, 1024/1024 pixel resolution. Images were assembled using ImageJ and Photoshop softwares.
Quantification of col transcription
Request a detailed protocolTo quantify the level of col nuclear transcripts in FCs and PCs, we calculated the ratio between col and nau hybridisation signals using intronic probes. Before using nau as internal reference we verified that nau transcription level is not modified in col L-CRM mutants. The same laser parameters were set for all intronic probes and at least five different embryos at each stage 11 and 12 were recorded. Optimal Z stacks were acquired at × 40. ImageJ was used to analyse the data. For each stack, a Sum slices projection was generated. Each region of interest (ROI), corresponding to a DA3 nucleus, was manually drawn, based on Mef-2 immunostaining. The same ROI served to determine the intensity of nau and col signals on the green and red channels, respectively (Figure 3—figure supplement 2A). A threshold was applied to each channel to remove background. Data plots and statistical analyses were performed with Prism 5.0 using unpaired t-test.
Phenotype quantification at embryonic and larval stages
Request a detailed protocolTo quantify embryonic phenotypes, L-CRM-moeGFP embryos were immunostained with a primary mouse anti-GFP (1/500) (Roche) and secondary biotinylated goat anti-mouse (1/2000) (VECTASTAIN ABC Kit). Stained embryos were imaged using a Nikon eclipse 80i microscope and a Nikon digital camera DXM 1200C. A minimum 100 A1-A7 abdominal segments of stage 15–16 embryos were analysed for each genotype. (+/Df: n = 127 segments - 16 embryos; colΔE/Df: n = 170 segments - 23 embryos; colΔL1.3/Df: n = 190 segments - 27 embryos; colΔL0.5/Df: n = 103 segments - 13 embryos). To quantify larval phenotypes, wandering L3 larva displaying Mhc-GFP reporter line were immobilised between slide and coverslip, and left and right larval sides imaged using Nikon AZ100 Macroscope at 5x magnification. Minimum 260 abdominal segments were analysed for each genotype. (+/Df: n = 375 segments - 27 larvae; colΔL1.3/Df: n = 320 segments - 23 larvae; colΔL0.5/Df: n = 264 segments - 19 larvae).
Live imaging embryonic muscle development
Request a detailed protocolEmbryos were bleach dechorionated and stage 12 embryos manually picked, laterally orientated and mounted on a coverslip coated with heptane glue to prevent drift during imaging. A drop of water was placed on the embryos to maintain their survival. Images were collected on a Leica TCS-SP8 confocal using a 25X water immersion lens. Sections were recorded every 130 to 150 s for the wt embryos and every 120 to 160 s for the colΔL1.3 embryos, and z-stacks collected with optical sections at maximum 1 µm interval. Image processing was performed with Fiji (http://fiji.sc/wiki/index.php/Fiji) and custom programming scripts in Fiji. The z-stacks projections were corrected in x and y dimensions by manual registration using a reference point tracking.
Scanning electron microscopy (SEM)
Request a detailed protocolTo prepare fillets, third instar wild type and homozygous colΔL1.3 larvae raised at 25°C were dissected in myorelaxant buffer, according to Gratz et al., 2014. Larvae were cut longitudinally on the ventral side to preserve and expose the dorsal and dorso-lateral musculature. Fillets were then fixed 1 hr in a 4% formaldehyde/2.5% glutaraldehyde mixture in 1X PBS, washed in water and dehydrated gradually in ethanol. Fillets were dried at the critical point (Leica EM CPD 300 critical point apparatus), covered with a platinum layer (Leica EM MED 020 metalliser) and imaged with a Quanta 250 FEG FEI scanning microscope.
Behavioral analysis
Request a detailed protocolWe conducted locomotion assays by tracking the trajectory of larvae using the FIM method (Risse et al., 2013). Wandering third instar larvae were gently picked up with a paintbrush and transferred to an agar plate. The larvae were then videotaped using a digital camera (Baumer VCXG53M); lentille (Kowa LM16HC); infrared filter (IF093SH35.5). Each video containing 5 to 10 larvae per run, on a 1% agarose gel, was recorded at five frames/sec for 20 s. Individual larva were tracked using the FIMTrack software (Risse et al., 2014), which provided the position across time of five points regularly spaced along the spine of each animal, from head to tail. Analysis was done by using MATLAB software. Peristalsis cycles were obtained using the derivative of the spine length (i.e., sum of the distance across successive point along the spine) through time, which provide a time series smoothly oscillating around zero. For each peristalsis cycle, we measured Stride length (centroid displacement across each cycle) and Stride duration (cycle duration). Walking rate was obtained by measuring the distance of the centroid (3rd spine point) across successive frame. These values were averaged for each individual across the 20 s of recording. Statistical comparisons between genotypes were computed using a linear model with GenoT as fixed effect, and individual larva as a statistical unit.
Data availability
All data generated or analysed during this study are included in the manuscript and supporting files.
References
-
A novel basic helix-loop-helix protein is expressed in muscle attachment sites of the Drosophila epidermisMolecular and Cellular Biology 14:4145–4154.https://doi.org/10.1128/MCB.14.6.4145
-
The embryonic development of larval muscles in DrosophilaDevelopment 110:791–804.
-
Myogenesis and muscle patterning in DrosophilaComptes Rendus De l'Academie Des Sciences. Serie III, Sciences De La Vie 316:1047–1061.
-
The role of branched fibres in the pathogenesis of duchenne muscular dystrophyExperimental Physiology 96:564–571.https://doi.org/10.1113/expphysiol.2010.056713
-
Requirement for the Drosophila COE transcription factor Collier in formation of an embryonic muscle: transcriptional response to notch signallingDevelopment 126:1495–1504.
-
The development of adult abdominal muscles in Drosophila myoblasts express twist and are associated with nervesDevelopment 113:91–102.
-
Diversification of muscle types in Drosophila: upstream and downstream of identity genesCurrent Topics in Developmental Biology 98:277–301.https://doi.org/10.1016/B978-0-12-386499-4.00011-2
-
Vestigial is required during late-stage muscle differentiation in Drosophila Melanogaster embryosMolecular Biology of the Cell 21:3304–3316.https://doi.org/10.1091/mbc.e10-04-0364
-
Acting on identity: myoblast fusion and the formation of the syncytial muscle fiberSeminars in Cell & Developmental Biology 72:45–55.https://doi.org/10.1016/j.semcdb.2017.10.033
-
Combinatorial coding of Drosophila muscle shape by Collier and NautilusDevelopmental Biology 363:27–39.https://doi.org/10.1016/j.ydbio.2011.12.018
-
Controls in patterning and diversification of somatic muscles during Drosophila embryogenesisCurrent Opinion in Genetics & Development 9:522–529.https://doi.org/10.1016/S0959-437X(99)00014-3
-
Quantifying and predicting Drosophila larvae crawling phenotypesScientific Reports 6:27972.https://doi.org/10.1038/srep27972
-
Single-cell analysis of Drosophila larval neuromuscular synapsesDevelopmental Biology 229:55–70.https://doi.org/10.1006/dbio.2000.9983
-
Cross-repressive interactions of identity genes are essential for proper specification of cardiac and muscular fates in DrosophilaDevelopment 129:1037–1047.
-
The role of the NK-homeobox gene slouch (S59) in somatic muscle patterningDevelopment 126:4525–4535.
-
Development and structure of motoneuronsInternational Review of Neurobiology 75:33–53.https://doi.org/10.1016/S0074-7742(06)75002-4
-
The many faces of cell adhesion during Drosophila muscle developmentDevelopmental Biology 401:62–74.https://doi.org/10.1016/j.ydbio.2014.12.038
-
Expression of a MyoD family member prefigures muscle pattern in Drosophila embryosGenes & Development 4:2086–2097.https://doi.org/10.1101/gad.4.12a.2086
-
Regional specification of muscle progenitors in Drosophila the role of the msh homeobox geneDevelopment 125:215–223.
-
Shadow enhancers foster robustness of Drosophila gastrulationCurrent Biology 20:1562–1567.https://doi.org/10.1016/j.cub.2010.07.043
-
Integrin signaling downregulates filopodia during muscle-tendon attachmentJournal of Cell Science 131:jcs217133.https://doi.org/10.1242/jcs.217133
-
FIM imaging and FIMtrack: two new tools allowing High-throughput and cost effective locomotion analysisJournal of Visualized Experiments 24:52207.https://doi.org/10.3791/52207
-
FIMTrack: an open source tracking and locomotion analysis software for small animalsPLOS Computational Biology 13:e1005530.https://doi.org/10.1371/journal.pcbi.1005530
-
REDfly: the transcriptional regulatory element database for DrosophilaNucleic Acids Research 47:D828–D834.https://doi.org/10.1093/nar/gky957
-
NIH image to ImageJ: 25 years of image analysisNature Methods 9:671–675.https://doi.org/10.1038/nmeth.2089
-
Diversification of muscle types: recent insights from DrosophilaExperimental Cell Research 316:3019–3027.https://doi.org/10.1016/j.yexcr.2010.07.013
-
A central role for epidermal segment border cells in the induction of muscle patterning in the Drosophila embryoDevelopment 120:59–70.
-
Immunohistological labeling of microtubules in sensory neuron dendrites, tracheae, and muscles in the Drosophila larva body wallJournal of Visualized Experiments : JoVE 10:3662.https://doi.org/10.3791/3662
-
A central multifunctional role of integrin-linked kinase at muscle attachment sitesJournal of Cell Science 124:1316–1327.https://doi.org/10.1242/jcs.081422
Article and author information
Author details
Funding
Centre National de la Recherche Scientifique
- Alexandre Carayon
- Laetitia Bataillé
- Gaëlle Lebreton
- Laurence Dubois
- Aurore Pelletier
- Yannick Carrier
- Antoine Wystrach
- Alain Vincent
- Jean-Louis Frendo
Centre de Biologie Integrative de Toulouse (AOCBI2018)
- Jean-Louis Frendo
AFM-Téléthon (Research grant 21887)
- Alain Vincent
Agence Nationale de la Recherche (13-BSVE2-0010-01)
- Alain Vincent
The funders had no role in study design, data collection and interpretation, or the decision to submit the work for publication.
Acknowledgements
We thank the Bloomington Stock Center for Drosophila strains, Matthias Landgraf (Cambridge University) for the gift of anti-HRP, Cristian Pasquaretta (CRCA) for his help in statistical analyses of locomotion behaviour, Patrick Arrufat (CRCA), Philippe Firmin and Claude Nexon (CBD) for their assistance in building the locomotion tracking table, Brice Ronsin, Toulouse RIO Imaging platform and Julien Favier, Drosophila embryos microinjection platform. We also thank Hadi Boukhatmi, Alice David, Bruno Monier and Serge Plaza for their critical reading of the manuscript. This work was supported by CNRS, Association Française contre les Myopathies (AFM) Research Grant 21887, ANR grant 13-BSVE2-0010-01 and Centre de Biologie Intégrative, AOCBI2018.
Copyright
© 2020, Carayon et al.
This article is distributed under the terms of the Creative Commons Attribution License, which permits unrestricted use and redistribution provided that the original author and source are credited.
Metrics
-
- 1,536
- views
-
- 176
- downloads
-
- 10
- citations
Views, downloads and citations are aggregated across all versions of this paper published by eLife.
Citations by DOI
-
- 10
- citations for umbrella DOI https://doi.org/10.7554/eLife.57547
Download links
A two-part list of links to download the article, or parts of the article, in various formats.
Downloads (link to download the article as PDF)
Open citations (links to open the citations from this article in various online reference manager services)
Cite this article (links to download the citations from this article in formats compatible with various reference manager tools)
Intrinsic control of muscle attachment sites matching
eLife 9:e57547.
https://doi.org/10.7554/eLife.57547


