PTPRG is an ischemia risk locus essential for HCO3–-dependent regulation of endothelial function and tissue perfusion
- Department of Biomedicine, Aarhus University, Denmark
- Department of Chemistry and Bioscience, Aalborg University, Denmark
Figures
Figure 1

Profiles of Ptprg transcriptional activity and mRNA levels demonstrate widespread expression across arterial, capillary, and venous endothelial cells and in diverse vascular beds including cerebral and coronary arteries.
(A) Histochemical staining for β-galactosidase activity reports the Ptprg transcriptional activity in PtprgLacZ/LacZ mice. The scale bars indicate 5 and 50 µm for the histological and whole-mount images, respectively, and all images within each category are displayed at the same magnification except for the image of the aorta where the scale bar corresponds to 150 µm. The 4-µm-thick longitudinal histological sections illustrate basilar and middle cerebral arteries where the lumen is collapsed, and endothelial cells (EC) from opposing walls meet at the center and are surrounded by their adjacent tunica media (M). The images are representative of tissue from 4 PtprgLacZ/LacZ mice and 2 WT mice. (B) Ptprg mRNA levels in arteries from WT mice displayed relative to the ribosomal S18 and β-actin reference genes (n = 11) and normalized to the average level in basilar arteries. (C–E) Single-cell RNA sequencing data analyzed for endothelial Ptprg expression in healthy murine brain (3482 cells), heart (3219 cells), skeletal muscle (m. soleus, 2457 cells), lung (3972 cells), and small intestine (974 cells). Data are averaged across each vascular bed (C), displayed as t-SNE plots of Ptprg transcript patterns (left images) and clustered vessel types (right images) (D), and divided and quantified according to vessel type in each tissue (E). The single-cell RNA sequencing data are from the online EC Atlas database (Kalucka et al., 2020). Data in panel B were compared after log-transformation using repeated-measures one-way ANOVA followed by Dunnett’s post-test. *p<0.05, **p<0.01, NS: not significantly different vs basilar arteries.
Figure 2
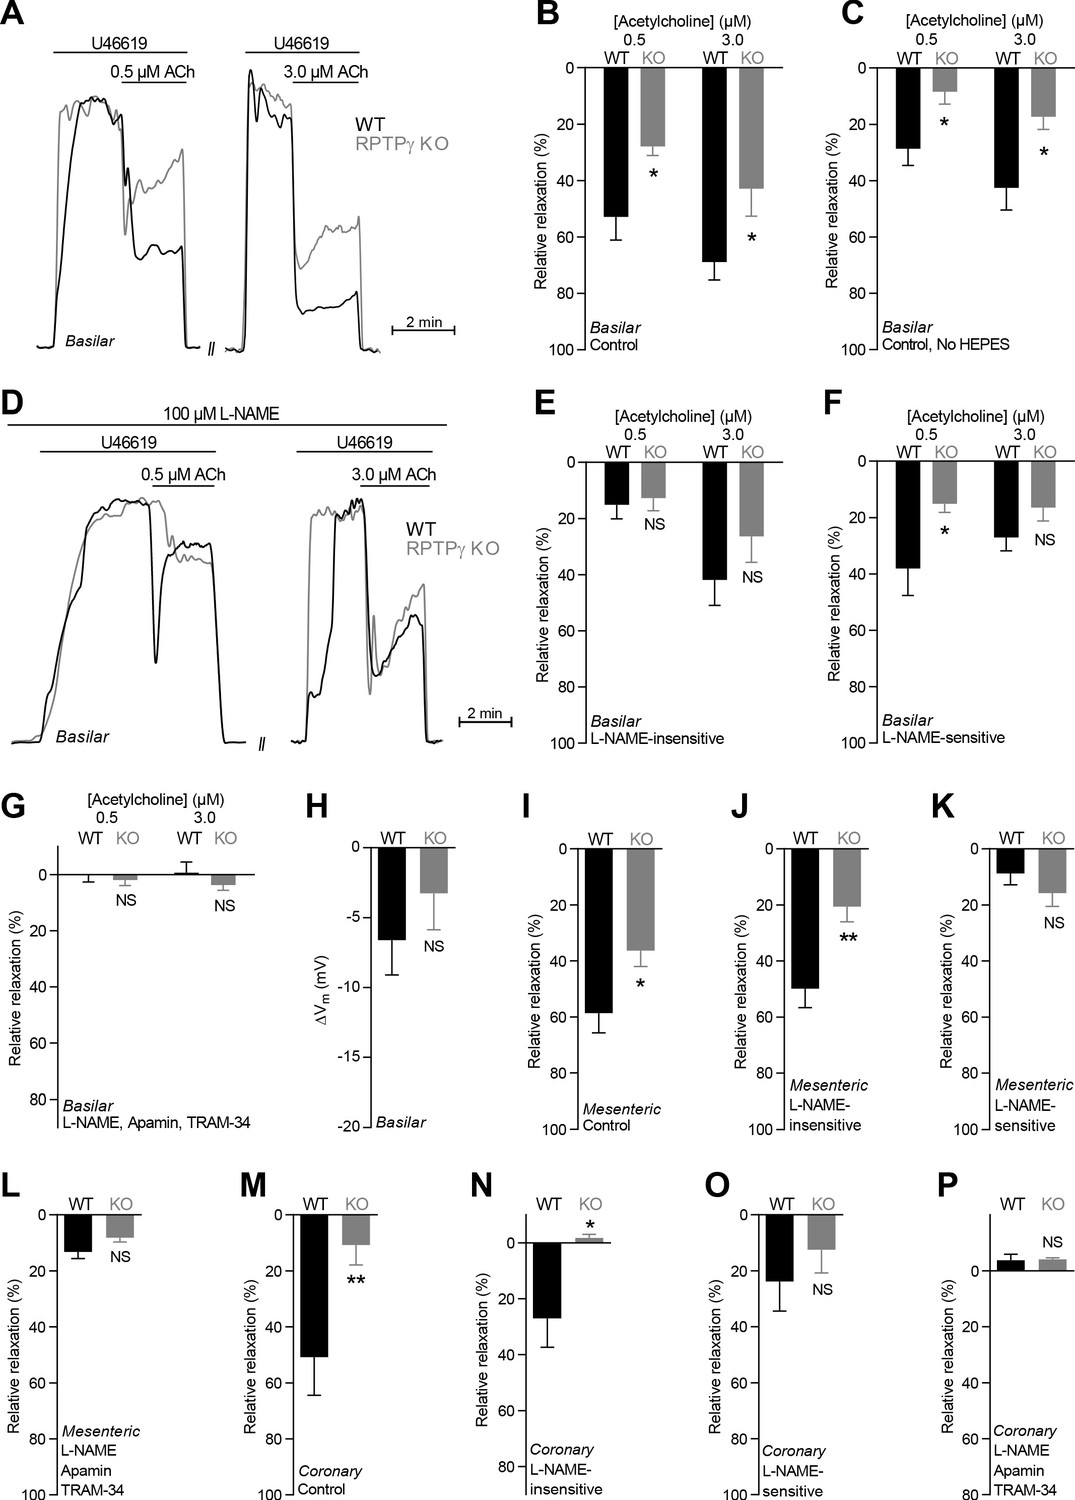
Acetylcholine (ACh)-induced endothelium-dependent vasorelaxation is compromised in basilar, mesenteric, and coronary arteries from RPTPγ KO mice when investigated in presence of CO2/HCO3–.
(A and D) Force recordings illustrating acetylcholine-induced vasorelaxation of U46619-contracted basilar arteries under control conditions (A) and after treatment with 100 µM L-NAME (D). The pre-contraction force development in response to U46619 was normalized in order to display relative relaxations. (B, I, and M) Acetylcholine-induced relaxations of basilar (B, n = 7–9), mesenteric (I, n = 11–13), and coronary (M, n = 7) arteries from RPTPγ KO and WT mice under control conditions, i.e. without inhibitors of endothelial function. For mesenteric and coronary arteries, we applied a concentration of 0.5 and 3.0 µM acetylcholine, respectively. (C) Experiment similar to that in panel B but performed in a CO2/HCO3–-containing solution without HEPES (n = 9–10). (E, J, and N) Acetylcholine-induced relaxations of basilar (E, n = 7–9), mesenteric (J, n = 11–13), and coronary (N, n = 7) arteries from RPTPγ KO and WT mice after treatment with 100 µM L-NAME. For mesenteric and coronary arteries, we applied a concentration of 0.5 and 3.0 µM acetylcholine, respectively. (F, K, and O) Acetylcholine-induced L-NAME-sensitive relaxations of basilar (F, n = 7–9), mesenteric (K, n = 11–13), and coronary (O, n = 7) arteries from RPTPγ KO and WT mice calculated as the difference in relaxations with and without 100 µM L-NAME. For mesenteric and coronary arteries, we applied a concentration of 0.5 and 3.0 µM acetylcholine, respectively. (G, L, and P) Acetylcholine-induced relaxations of basilar (G, n = 7–9), mesenteric (L, n = 11–13), and coronary (P, n = 7) arteries from RPTPγ KO and WT mice after treatment with 100 µM L-NAME, 50 nM apamin, and 1.0 µM TRAM-34. For mesenteric and coronary arteries, we applied a concentration of 0.5 and 3.0 µM acetylcholine, respectively. (H) Vascular smooth muscle cell membrane potential responses (ΔVm) to 3.0 µM acetylcholine in basilar arteries from RPTPγ KO and WT mice in presence of 100 µM L-NAME. Data were compared using two-way ANOVA followed by Sidak’s post-test (panel B, C, and E-G), non-parametric Mann-Whitney test (panel H, K-M, and O), unpaired two-tailed Student’s t-test (panel I and J) or unpaired two-tailed t-test with Welch’s correction (panel N and P). Comparisons in panel B and J were made after square root transformation. *p<0.05, **p<0.01, NS: not significantly different vs WT.
Figure 3
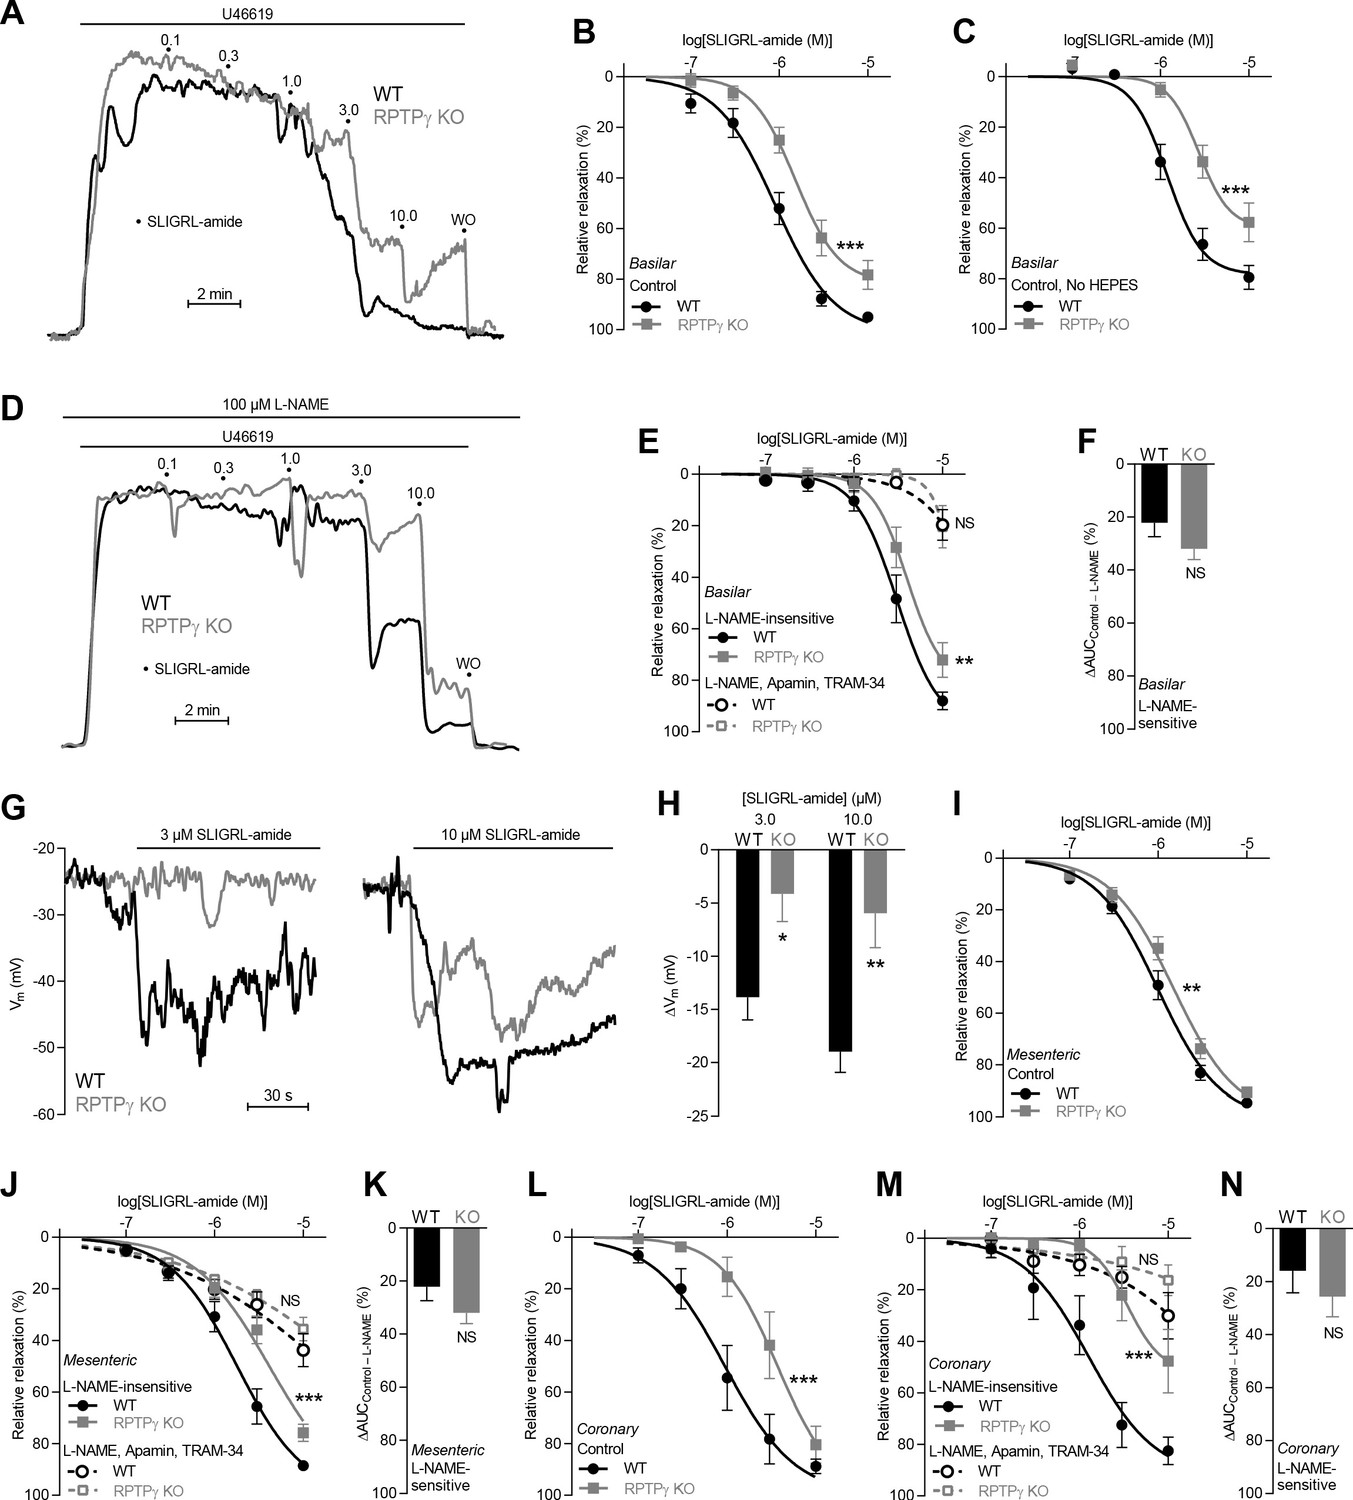
SLIGRL-amide-induced endothelium-dependent vasorelaxation is compromised in basilar, mesenteric, and coronary arteries from RPTPγ KO mice when investigated in presence of CO2/HCO3–.
(A and D) Force recordings illustrating SLIGRL-amide-induced vasorelaxation of U46619-contracted basilar arteries under control conditions (A) and after treatment with 100 µM L-NAME (D). The numbers indicate points of cumulative stepwise increases in SLIGRL-amide from 0.1 µM to 10.0 µM. WO indicates the point of washout. The pre-contraction force development in response to U46619 was normalized in order to display relative relaxations. (B, I, and L) SLIGRL-amide-induced relaxations of basilar (B, n = 12), mesenteric (I, n = 11), and coronary (L, n = 7) arteries from RPTPγ KO and WT mice under control conditions, that is without inhibitors of endothelial function. (C) Experiment similar to that in panel B but performed in a CO2/HCO3–-containing solution without HEPES (n = 8). (E, J, M) SLIGRL-amide-induced relaxations of basilar (E, n = 12), mesenteric (J, n = 11), and coronary (M, n = 7) arteries from WT and RPTPγ KO mice after treatment with 100 µM L-NAME alone or in combination with 50 nM apamin and 1.0 µM TRAM-34. (F, K, and N) SLIGRL-amide-induced L-NAME-sensitive relaxations of basilar (F, n = 12), mesenteric (K, n = 11), and coronary (N, n = 7) arteries from RPTPγ KO and WT mice calculated as the difference in area under the curve (AUC) between the concentration-response curves with and without L-NAME. (G and H) Original recordings (G) and summarized data (H, n = 8–9) from basilar arteries showing vascular smooth muscle cell membrane potential (Vm) responses to SLIGRL-amide in presence of 100 µM L-NAME. In panel B, C, E, I, J, L, and M, the relative relaxations were fitted to sigmoidal curves and compared using extra sum-of-squares F tests. In panel F, K, and N, the relative relaxations were compared by unpaired two-tailed Student’s t-test. In panel H, membrane potential responses were compared by two-way ANOVA followed by Sidak’s post-test. *p<0.05, **p<0.01, ***p<0.001. NS: not significantly different vs WT.
Figure 4
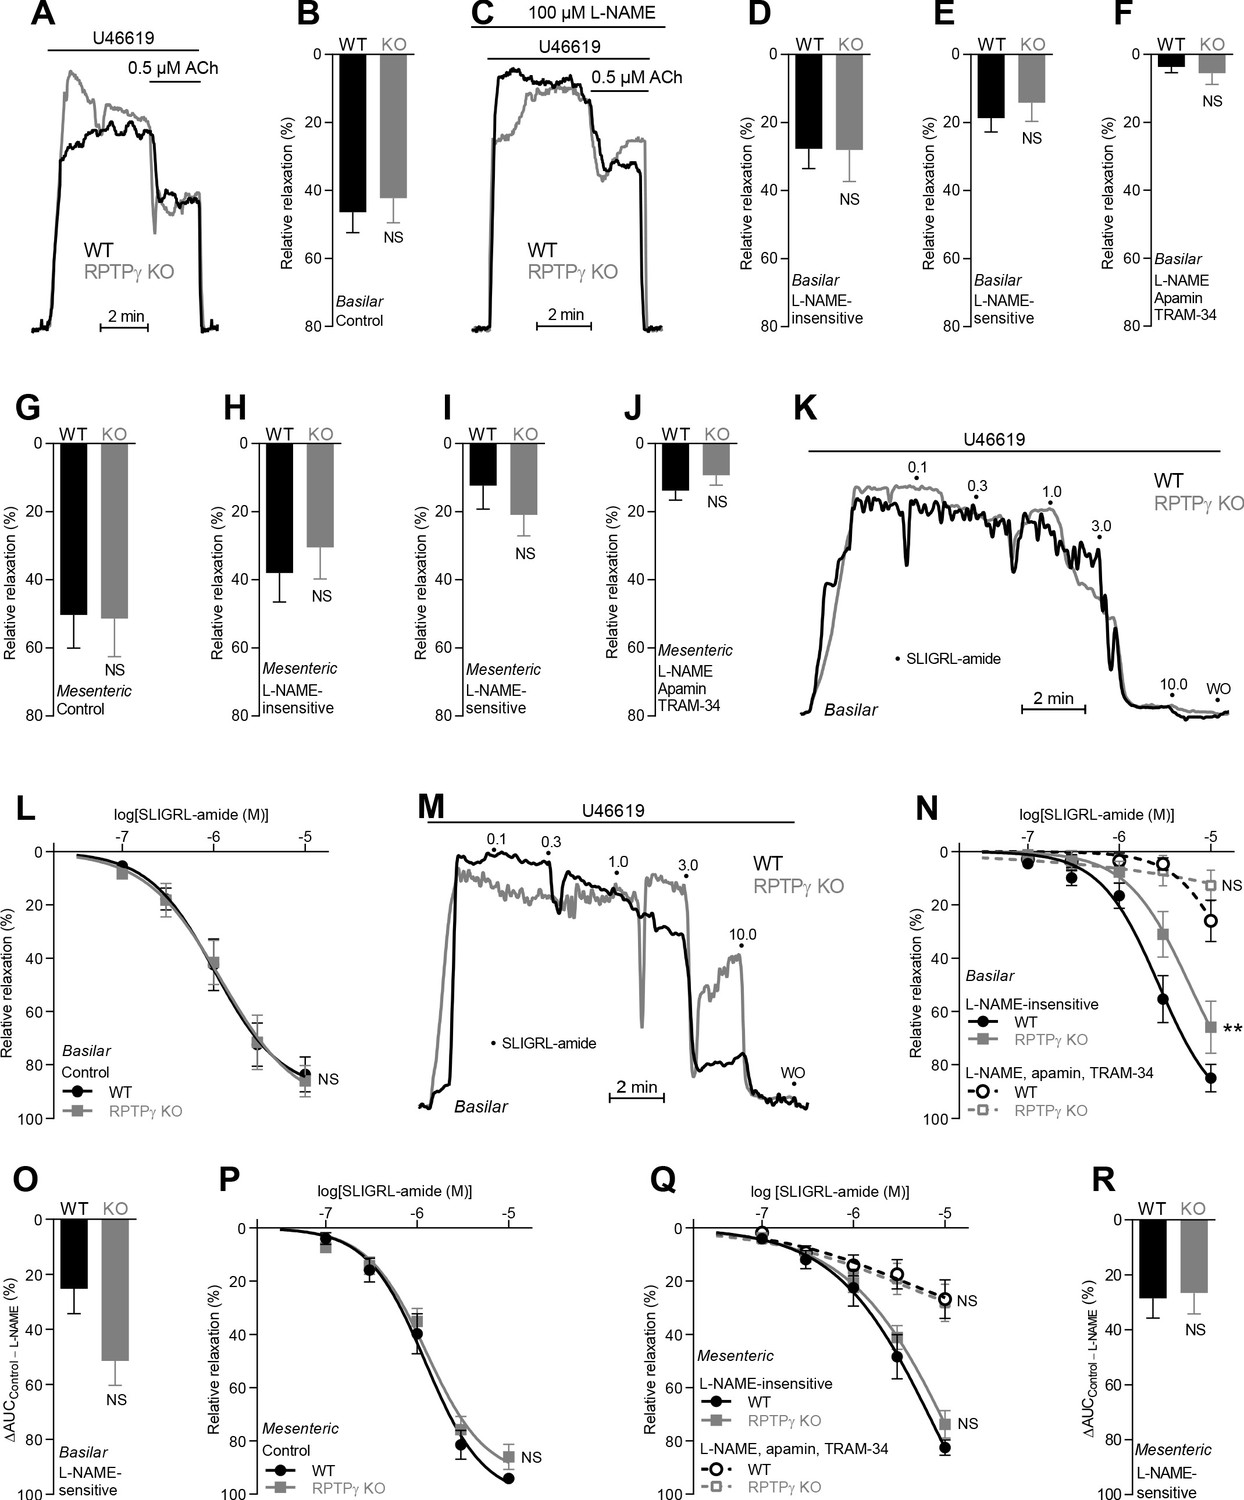
In absence of CO2/HCO3–, acetylcholine (ACh)- and SLIGRL-amide-induced endothelium-dependent vasorelaxation of basilar and mesenteric arteries is similar between RPTPγ KO and WT mice.
(A and C) Force recordings illustrating acetylcholine-induced vasorelaxation of U46619-contracted basilar arteries under control conditions (A) and after treatment with 100 µM L-NAME (C). The pre-contraction force development in response to U46619 was normalized in order to display relative relaxations. (B and G) Acetylcholine-induced relaxations of basilar (B, n = 11) and mesenteric (G, n = 6–7) arteries from RPTPγ KO and WT mice under control CO2/HCO3–-free conditions, that is, without inhibitors of endothelial function. (D and H) Acetylcholine-induced relaxations of basilar (D, n = 11) and mesenteric (H, n = 6–7) arteries from RPTPγ KO and WT mice in presence of 100 µM L-NAME under CO2/HCO3–-free conditions. (E and I) Acetylcholine-induced L-NAME-sensitive relaxations of basilar (E, n = 11) and mesenteric (I, n = 6–7) arteries from RPTPγ KO and WT mice calculated as the difference between relaxations with and without L-NAME. Experiments were performed in absence of CO2/HCO3–. (F and J) Acetylcholine-induced relaxations of basilar (F, n = 11) and mesenteric (J, n = 6–7) arteries from RPTPγ KO and WT mice after treatment with 100 µM L-NAME, 50 nM apamin, and 1.0 µM TRAM-34 under CO2/HCO3–-free conditions. (K and M) Force recordings illustrating SLIGRL-amide-induced vasorelaxation of U46619-contracted basilar arteries under control conditions (K) and after treatment with 100 µM L-NAME (M). The numbers indicate points of cumulative stepwise increases in SLIGRL-amide from 0.1 µM to 10.0 µM. WO indicates the point of washout. The pre-contraction force development in response to U46619 was normalized in order to display relative relaxations. (L and P) SLIGRL-amide-induced relaxations of basilar (L, n = 10) and mesenteric (P, n = 6–7) arteries from RPTPγ KO and WT mice under control CO2/HCO3–-free conditions, that is, without inhibitors of endothelial function. (N and Q) SLIGRL-amide-induced relaxations of basilar (N, n = 10) and mesenteric (Q, n = 6–7) arteries from RPTPγ KO and WT mice after treatment with 100 µM L-NAME alone or in combination with 50 nM apamin and 1.0 µM TRAM-34. The experiments were performed in absence of CO2/HCO3–. (O and R) SLIGRL-amide-induced L-NAME-sensitive relaxations of basilar (O, n = 10) and mesenteric (R, n = 6–7) arteries from RPTPγ KO and WT mice calculated as the difference in area under the curve (AUC) between the concentration-response curves with and without L-NAME. In panels A-J, we applied a concentration of 0.5 µM acetylcholine. Data in panels B, E, G-J, and O were compared by unpaired two-tailed Student’s t-tests, data in panels D and R by non-parametric Mann-Whitney test, and data in panel F by unpaired two-tailed t-test with Welch’s correction. In panels L, N, P, and Q, the relative relaxations were fitted to sigmoidal curves and compared using extra sum-of-squares F tests. Data in panel J were log-transformed before comparison. **p<0.01, NS: not significantly different vs WT.
Figure 5
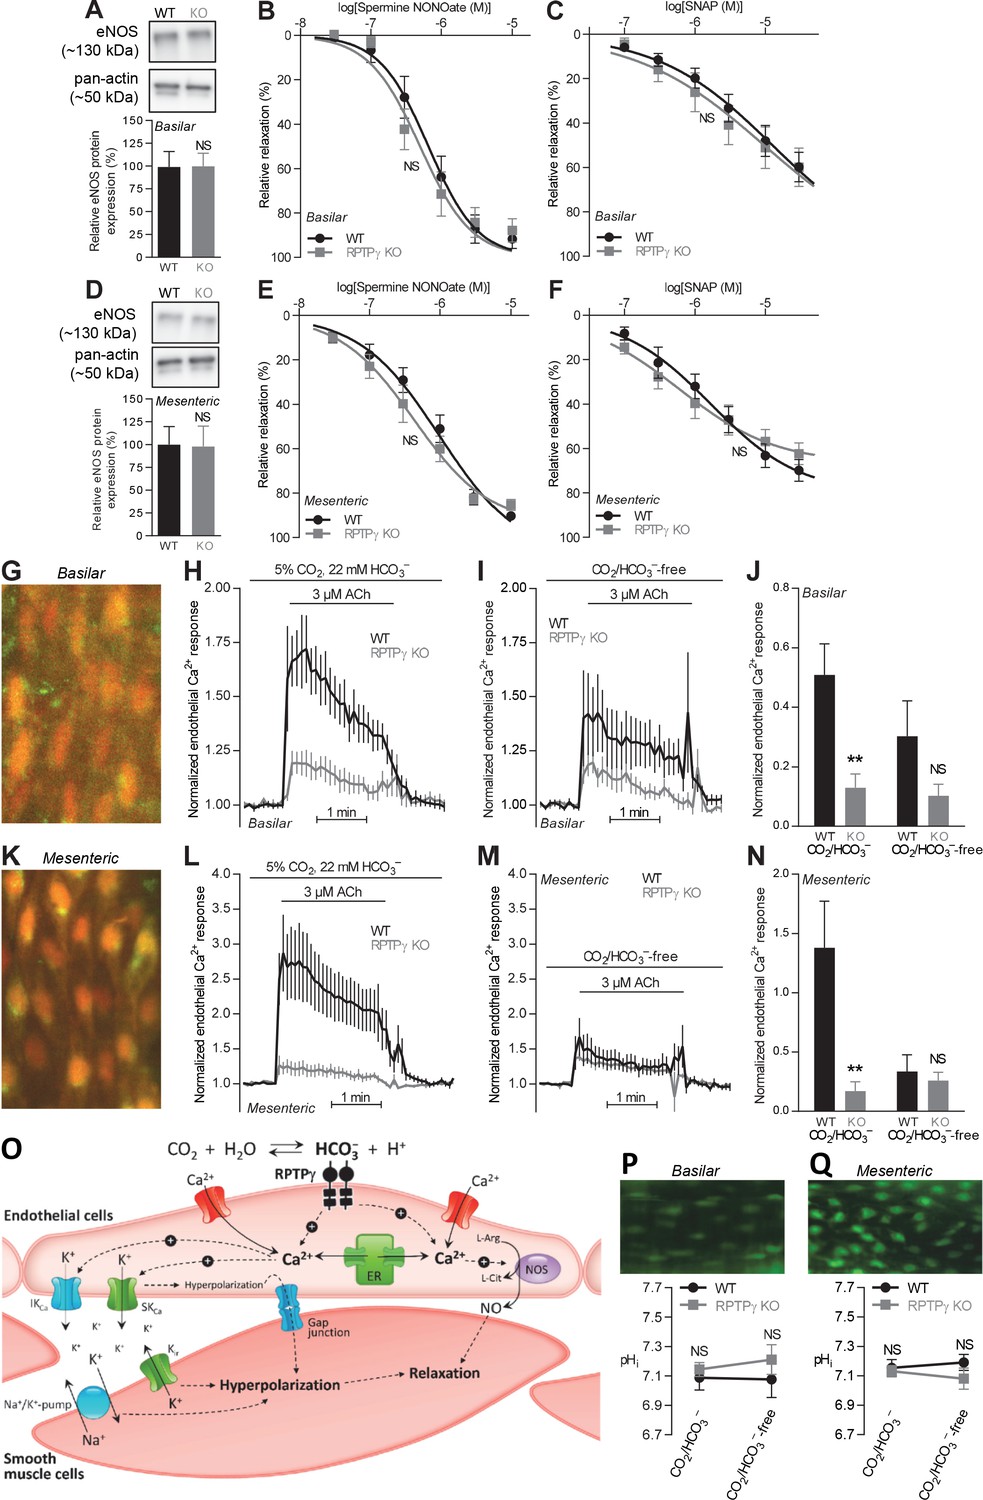
Acetylcholine (ACh)-induced endothelial intracellular Ca2+ responses are lower in arteries from RPTPγ KO than WT mice.
In contrast, expression of endothelial NO-synthase (eNOS), responses to NO-donors, and endothelial intracellular pH are unaffected in basilar and mesenteric arteries from RPTPγ KO compared to WT mice. (A and D). Expression of eNOS in basilar (A) and mesenteric (D) arteries from RPTPγ KO and WT mice (n = 5–6). Representative bands are shown next to results from densitometric analyses where the expression levels relative to pan-actin are normalized to the average level in arteries from WT mice. (B and E) Spermine NONOate-induced relaxations of basilar (B, n = 10–14) and mesenteric (E, n = 9) arteries from RPTPγ KO and WT mice. (C and F) SNAP-induced relaxations of basilar (C, n = 10–15) and mesenteric (F, n = 9) arteries from RPTPγ KO and WT mice. All experiments in panels B, C, E, and F were performed on arteries pre-contracted with U46619, in presence of CO2/HCO3–, and after treatment with 100 µM L-NAME, 50 nM apamin, and 1.0 µM TRAM-34. (G and K) Overlaid fluorescence images of endothelial cells in basilar (G) and mesenteric (K) arteries loaded by luminal perfusion with Fluo-4 (green) and Fura Red (red). (H, I, L, and M) Average traces of acetylcholine-induced endothelial intracellular Ca2+ responses in basilar (H and I) and mesenteric (L and M) arteries from RPTPγ KO and WT mice (n = 6–9) in presence (H and L) and absence (I and M) of CO2/HCO3–. The evaluation of endothelial Ca2+ responses was based on the F505-530/F>600 ratio normalized to the average ratio during the first two minutes of the individual recordings. (J and N) Summarized endothelial intracellular Ca2+ responses in basilar (J) and mesenteric (N) arteries upon acetylcholine stimulation (n = 6–9). The endothelial Ca2+ response was calculated as the average increase in normalized fluorescence during the 2 min acetylcholine exposure compared to the baseline value before activation. (O) Schematic illustration of how RPTPγ influences vasomotor functions of resistance arteries. (P and Q) Steady-state intracellular pH of endothelial cells in basilar (P) and mesenteric (Q) arteries from RPTPγ KO and WT mice (n = 5–7) in the presence and absence of CO2/HCO3–. In panels A and D, expression levels were compared with unpaired two-tailed Student’s t-tests. In panels B, C, E, and F, the relative relaxations were fitted to sigmoidal curves and compared using extra sum-of-squares F tests. In panels J and N, data were compared by two-way ANOVA followed by Sidak’s post-tests. In panels P and Q, data were compared by repeated-measures two-way ANOVA followed by Sidak’s post-tests. The data in panel N were log-transformed before comparisons. *p<0.05, **p<0.01, ***p<0.001, NS: not significantly different vs WT. ER, endoplasmic reticulum; Kir, inward-rectifier K+-channel; IKCa, intermediate-conductance K+-channel; NOS, NO-synthase; SKCa, small-conductance K+-channel; SNAP, S-nitroso-N-acetylpenicillamine.
Figure 6

Systemic blood pressure and heart rate are similar in WT and RPTPγ KO mice at rest.
In contrast, RPTPγ KO mice show elevated cerebrovascular perfusion during whisker stimulation, attenuated hyperventilation-induced blood pressure elevation, and diminished hyperventilation-induced reduction in cerebrovascular perfusion. (A) Resting mean arterial pressure (MAP) and heart rate (HR) measured by radiotelemetry in WT and RPTPγ KO mice (n = 6–7). Data were compared by unpaired two-tailed Student’s t-tests. (B) Mean arterial pressure under control conditions and during intake of 100 and 600 mg/kg/day L-NAME in the drinking water (n = 4–5). Data were square root-transformed and then compared by repeated-measures two-way ANOVA. (C) Changes in relative mean arterial blood pressure (ΔMAP, solid lines) and expiratory end-tidal CO2 fraction (FETCO2, dashed lines) during hyperventilation (n = 13). The steady-state values averaged over the last 30 s of the stimulation period were compared between WT and RPTPγ KO mice by unpaired two-tailed Student’s t-test (ΔMAP) or non-parametric Mann-Whitney test (FETCO2). In the anesthetized mice, the absolute mean arterial blood pressure prior to hyperventilation was 63 ± 5 mmHg in RPTPγ KO compared to 60 ± 3 mmHg in WT mice (p=0.63, unpaired two-tailed Student’s t-test). (D) Exemplar laser speckle images. The left image shows the second posterior bifurcation of the middle cerebral artery (arrows) that was used to locate the same region of interest (dotted square) in each experiment. The right image provides a 7.5% threshold response map from a whisker stimulation experiment in an RPTPγ KO mouse. (E and F) Relative cerebrovascular perfusion in the barrel cortex (dotted square in panel D) of RPTPγ KO and WT mice during whisker stimulation (E, n = 9) and during hyperventilation alone or combined with whisker stimulation (F, n = 8). The steady-state blood flow index averaged over the last minute of the intervention period was compared between WT and RPTPγ KO mice by unpaired two-tailed Student’s t-test (whisker stimulation) or unpaired two-tailed t-test with Welch’s correction (hyperventilation). *p<0.05, **p<0.01, NS: not significantly different vs WT. FETCO2 indicates the expiratory end-tidal CO2 fraction measured by capnography.
Figure 7
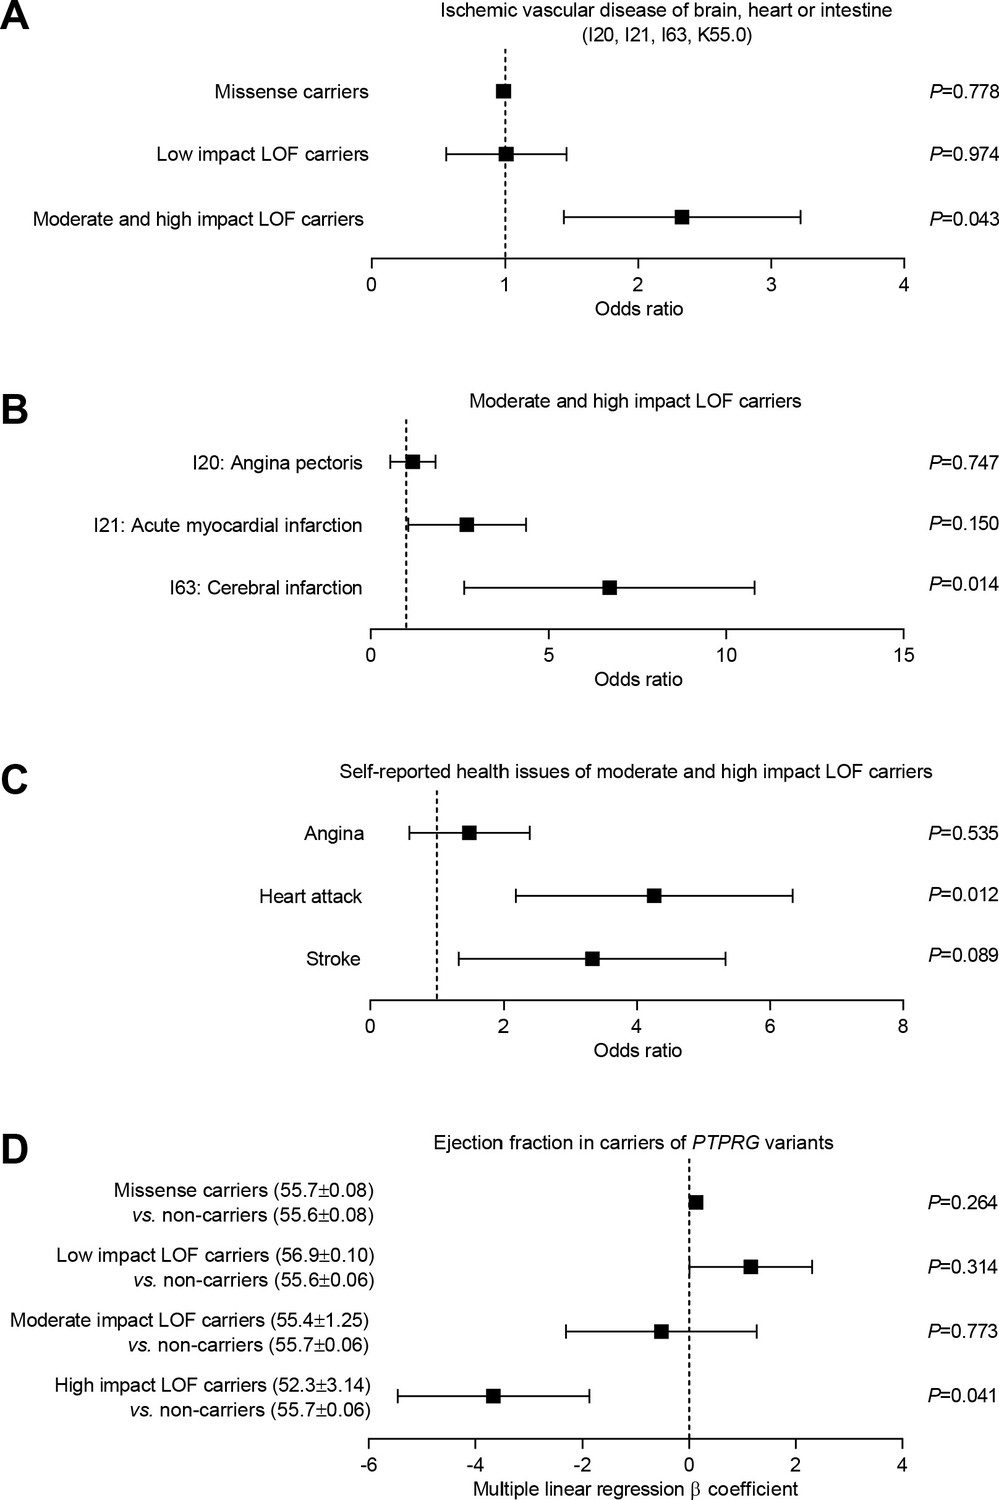
Burden analysis of loss-of-function variants in PTPRG reveals association with human ischemic vascular disease.
(A) Association of PTPRG missense variants (localized outside exon-intron boundary regions) and predicted loss-of-function (LOF) variants of low, moderate, and high impact with ischemic cerebral, coronary, and mesenteric vascular disease (aggregate of ICD-10 diagnosis codes I20, I21, I63, and K55.0). (B and C) Association of predicted moderate- and high-impact loss-of-function variants in PTPRG with diagnosed (B) and self-reported (C) coronary and cerebral ischemia. (D) Association between missense and loss-of-function variants in PTPRG and left ventricular ejection fraction. The p-values in panel A through C come from logistic regression analyses and the p-values in panel D from multiple linear regression analyses. In each case, we adjusted for sex, age, body mass index, genetic principal component, smoking status, dyslipidemia, diabetes, and hypertension.
Tables
Table 1
Arterial blood gas measurements from RPTPγ KO and WT mice (n = 7–9) under control conditions (normoventilation, FETCO2 = 3.5%) and after 2 min of hyperventilation (FETCO2 = 2%).
We compared data by repeated-measures two-way ANOVA. FETCO2, expiratory end-tidal CO2 fraction.
| Arterial blood gasses | WT | RPTPγ KO | ||
|---|---|---|---|---|
| Control, FETCO2 = 3.5% | ||||
| pHa | 7.28 ± 0.01 | 7.28 ± 0.01 | ||
| PaCO2 (mmHg) | 45.2 ± 1.2 | 46.2 ± 1.8 | ||
| [HCO3–]a (mM) | 20.4 ± 0.6 | 20.9 ± 0.8 | ||
| Hyperventilation, FETCO2 = 2% | ||||
| pHa | 7.38 ± 0.02 | 7.41 ± 0.01 | ||
| PaCO2 (mmHg) | 32.3 ± 0.9 | 32.3 ± 1.5 | ||
| [HCO3–]a (mM) | 19.0 ± 0.9 | 19.2 ± 0.8 | ||
| Statistics (repeated-measures two-way ANOVA) | p-Values | |||
| Genotype | Ventilation | Interaction | ||
| pHa | 0.40 | <0.001 | 0.19 | |
| PaCO2 | 0.90 | <0.001 | 0.06 | |
| [HCO3–]a | 0.69 | <0.001 | 0.47 | |
Additional files
Download links
A two-part list of links to download the article, or parts of the article, in various formats.
Downloads (link to download the article as PDF)
Open citations (links to open the citations from this article in various online reference manager services)
Cite this article (links to download the citations from this article in formats compatible with various reference manager tools)
PTPRG is an ischemia risk locus essential for HCO3–-dependent regulation of endothelial function and tissue perfusion
eLife 9:e57553.
https://doi.org/10.7554/eLife.57553


