Activity-dependent tuning of intrinsic excitability in mouse and human neurogliaform cells
- Laboratory of Cellular and Synaptic Physiology, Eunice Kennedy Shriver National Institute of Child Health and Human Development, National Institutes of Health, United States
- Surgical Neurology Branch, National Institutes of Neurological Disorders and Stroke, National Institutes of Health, United States
Figures
Figure 1 with 2 supplements
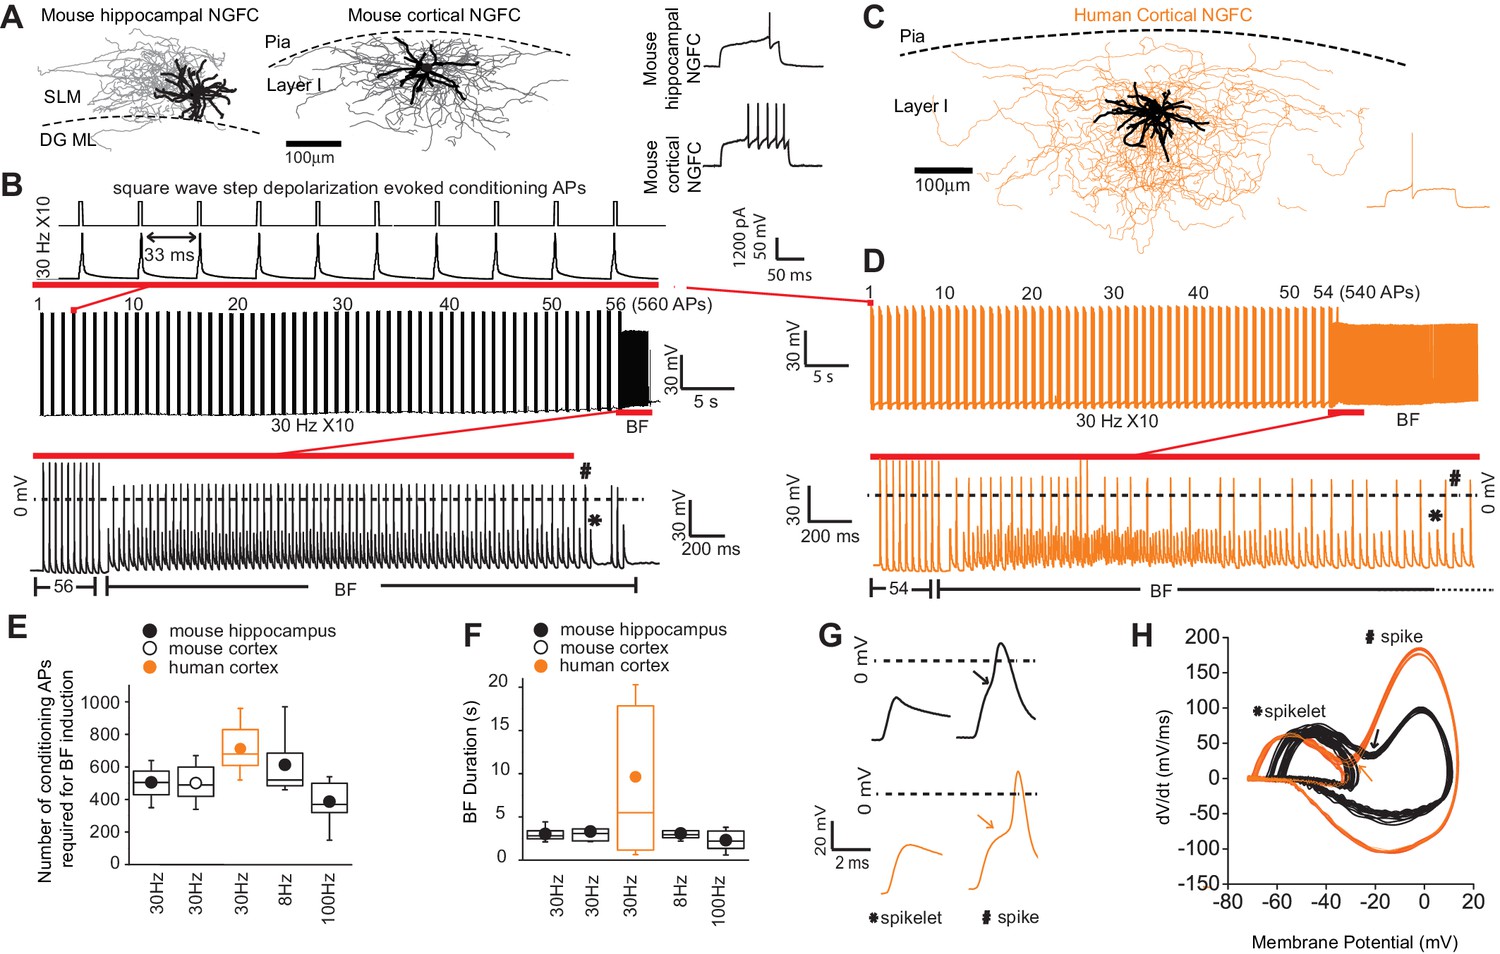
Barrage firing (BF) is evolutionary conserved in human NGFCs.
(A,C) Biocytin reconstruction of mouse (dendrites in black; axon in gray) and human NGFCs (dendrites in black; axon in orange) located in superficial regions of hippocampus (stratum lacunosum moleculare; SLM) and cortex (Layer I). (B,D) Single example trace showing the induction of barrage firing (BF) in mouse and human NGFCs upon delivery of action potentials via 1 ms depolarizing steps (typically 1000–1200 pA @ 30 Hz and 10 action potentials every second). (E,F) Box plots of pooled data depicting the minimum number of action potentials required for emergence of BF and its duration under differing frequencies of inducing action potentials (for the box plots, left to right, the n values are 68, 15, 12, 12 and 7, respectively) (G,H) Single example waveforms and corresponding phase plots of spikelets nested within full spikes (the latter defined as those overshooting 0 mV) observed during BF episodes in a single mouse and human NGFC. Black and orange data represent that derived from mouse and human NGFCs, respectively.
-
Figure 1—source data 1
Data plotted in Figure 1.
- https://cdn.elifesciences.org/articles/57571/elife-57571-fig1-data1-v2.xlsx
Figure 1—figure supplement 1
Privileged induction of barrage firing in mouse and human NGFCs.
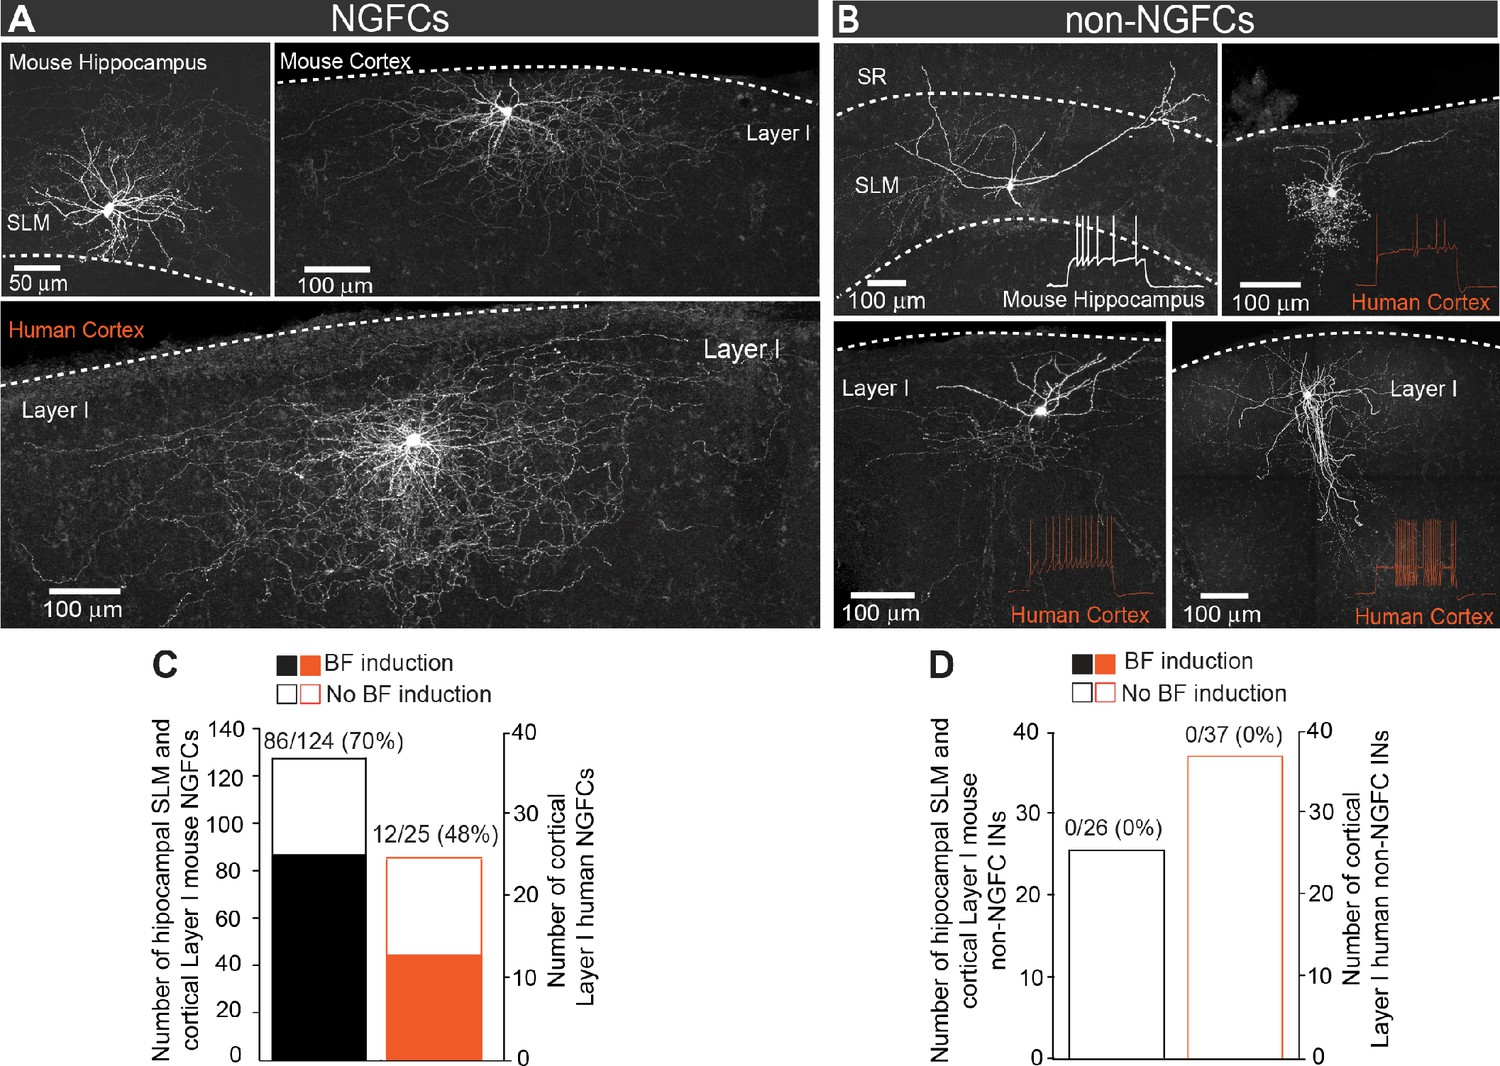
(A, B) Confocal mages of biocytin filled cortico-hippocampal NGFCs and non-NGFCs in stratum lacunosum-moleculare (SLM) and Layer I. Insets show firing patterns of non-NGFCs to suprathreshold current injections. Note: reconstructed drawings and corresponding firing patterns of NGFCs are depicted in main Figure 1A,B. (C) Histogram showing the prevalence in the ability to induce BF in mouse (black; n = 124) and human (orange; n = 25) NGFCs. (D) Histogram showing the inability to induce BF in mouse (black; n = 26) and human (orange; n = 33) non-NGFCs.
Figure 1—figure supplement 2

Induction of multiple barrage firing episodes in individual mouse and human NGFCs.
(A) Single trace example showing the inability to elicit prolonged BF episodes in single NGFC following immediate continuation of the induction protocol (30 × 10 Hz induction; see main Figure 1 for details of induction). (B) Single trace showing repeated BF episodes can by induced in a given NGFC following a determined elapsed period which in this example is 4.4 min. (C) Individual data plot showing the relationship between the duration of the inter-induction period and failure/success of eliciting a second BF episode (n = 61). (D) Line plots showing duration of BF for multiple subsequent BF episodes (BF1 thru BF4) in any given mouse or human NGFC. Plotted as combined mean for BF1,BF2 and BF3,BF4 (n = 16 and 6 for mouse and human NGFCs, respectively). (E) Corresponding box plots of the % change in the duration of BF elicited in any given NGFC induced by subsequent BF induction protocols (four induction protocols in each NGFC were delivered with inter induction interval greater than 1 min). Data are expressed as a percentage change in these parameters for the mean of BF3, BF4 vs. the mean of BF1, BF2 in each NGFC tested (n = 16 and 6 for mouse and human NGFCs, respectively). Paired t-test p values = 0.0077 and 0.162 for mouse and human NGFCs, respectively).
-
Figure 1—figure supplement 2—source data 1
Data plotted in Figure 1—figure supplement 2.
- https://cdn.elifesciences.org/articles/57571/elife-57571-fig1-figsupp2-data1-v2.xlsx
Figure 2
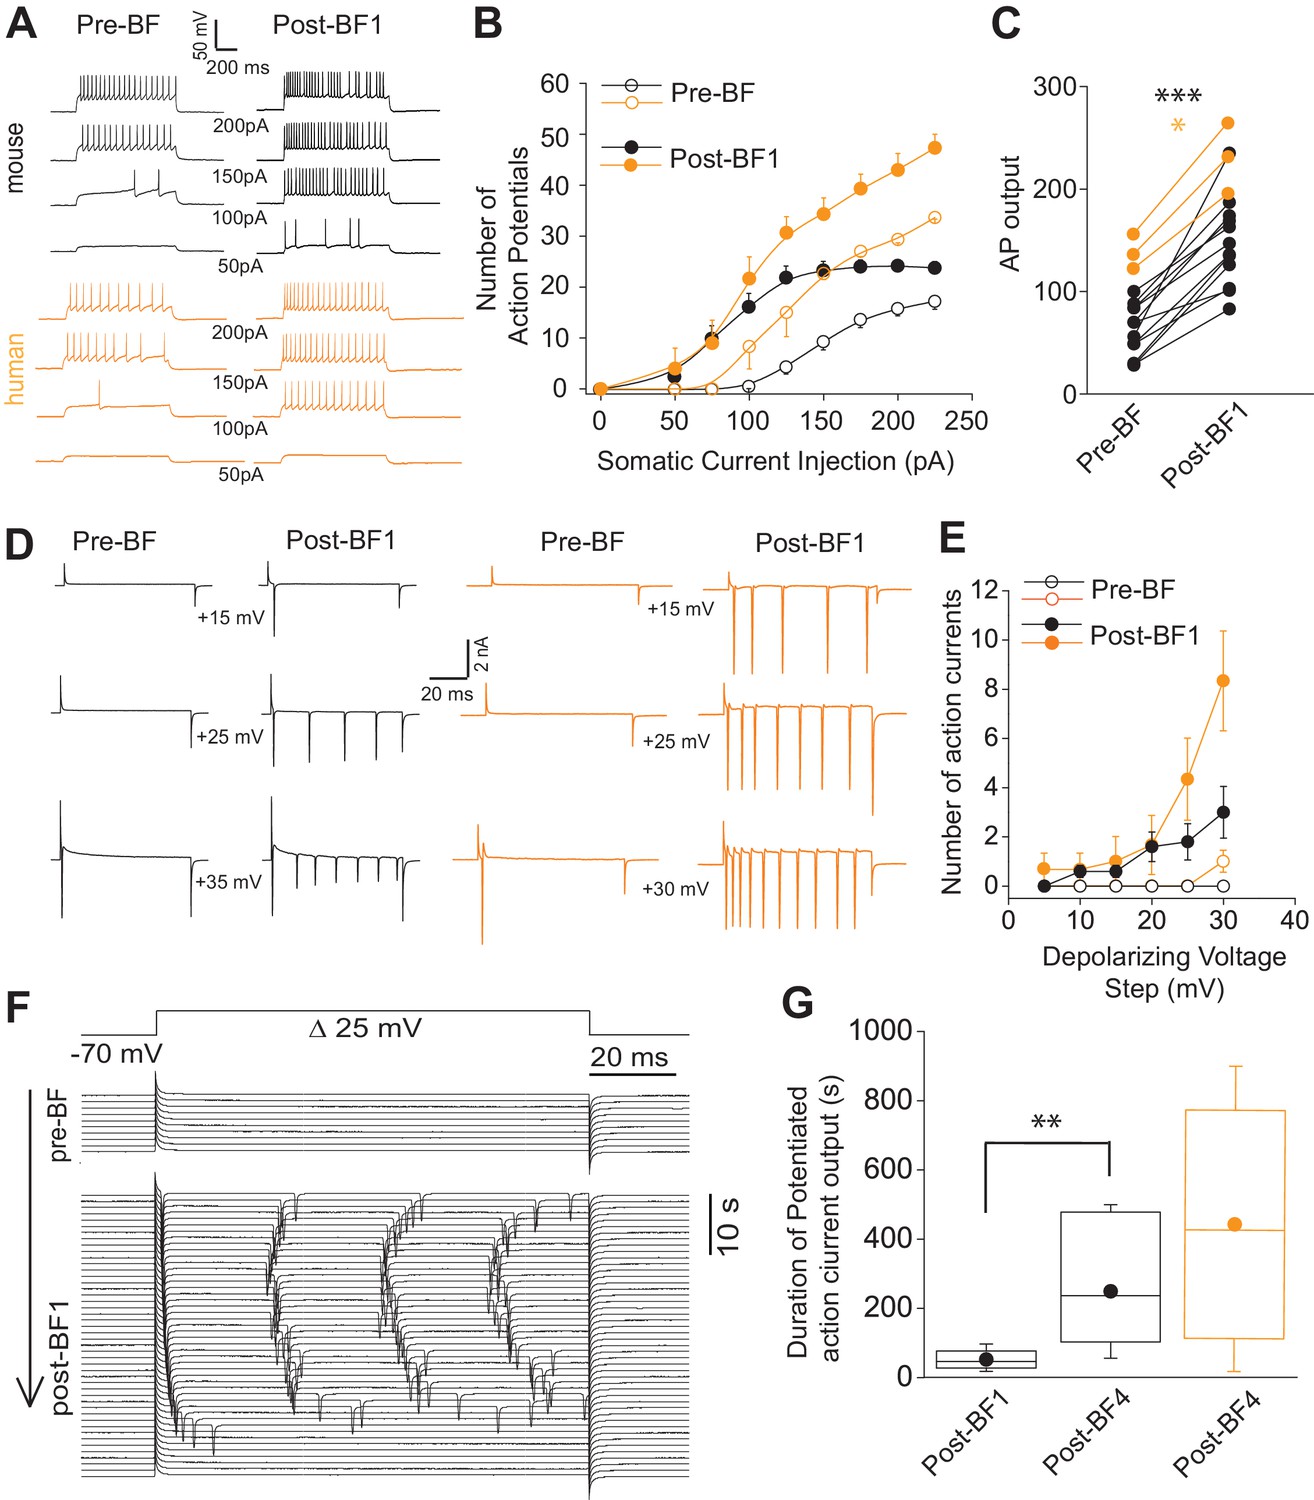
Short-term potentiation of somatic-depolarization driven excitability (STP-SE) in mouse and human NGFCs after cessation of BF.
(A) Single example voltage traces in response to increasing square wave somatic depolarizing current injections before and after induction of BF. Values under each pair of traces (Pre-BF and Post-BF) indicate the size of the 1 s duration current injection. (B) Pooled data input/output curves of action potential number in response to increasing amplitudes of depolarizing current injections (50 pA – 220 pA; 25 pA increments; n = 12 and 3 for mouse and human NGFCs, respectively). Mouse data are comprised of 8 hippocampal and four cortical NGFCs (C) Line plots of AP output before and after BF (calculated as the total sum of APs in response to all current injection steps) in individual mouse (n = 12; paired t-test; p=0.0000083) and human NGFCs (n = 3; paired t-test; p=0.012) tested. (D) Single example current traces from NGFCs in response to depolarizing voltage steps (magnitude of steps from a holding potential of −70 mV are indicated under each pair of traces) showing action current output before and after BF. (E) Pooled data showing input/output curves depicting number of action currents in response to depolarizing voltage steps (5 mV to 30 mV; 5 mV increments) before and after BF induction (n = 5 and 3 for mouse and human NGFCs, respectively). Mouse data are comprised of 3 hippocampal and two cortical NGFCs (F) Single example time course of action current output in response to 25 mV depolarizing voltage steps (sweep interval 10 s) under baseline conditions and after BF induction. (G) Box plots depicting the duration of increased action current output to 25 mV depolarizing voltage steps after a single BF episode (post-BF1) and after 4 BF episodes (post BF-4) in mouse (n = 11 and 4 for mouse and human NGFCs, respectively; paired t-test, p=0.007). Mouse data are comprised of 8 hippocampal and three cortical NGFCs.
-
Figure 2—source data 1
Data plotted for Figure 2.
- https://cdn.elifesciences.org/articles/57571/elife-57571-fig2-data1-v2.xlsx
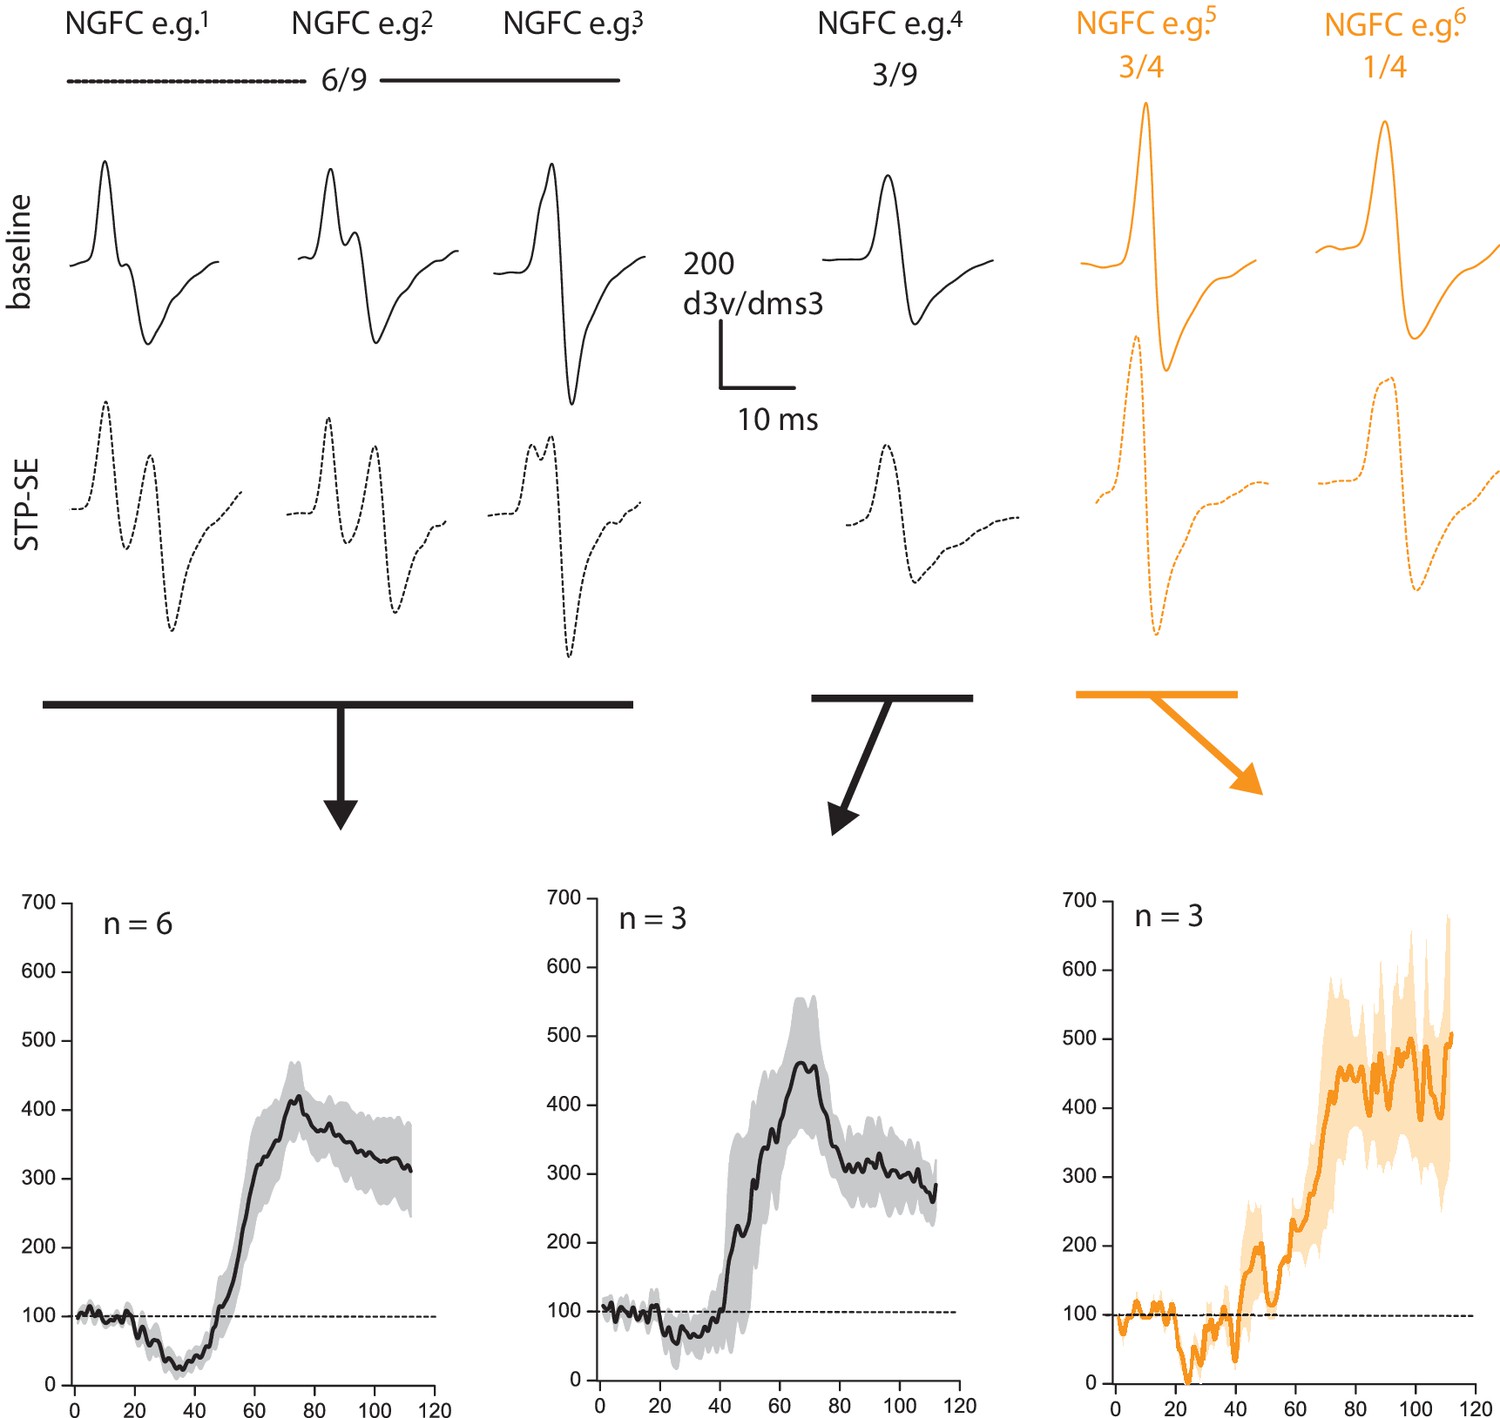
Figure 3 with 1 supplement
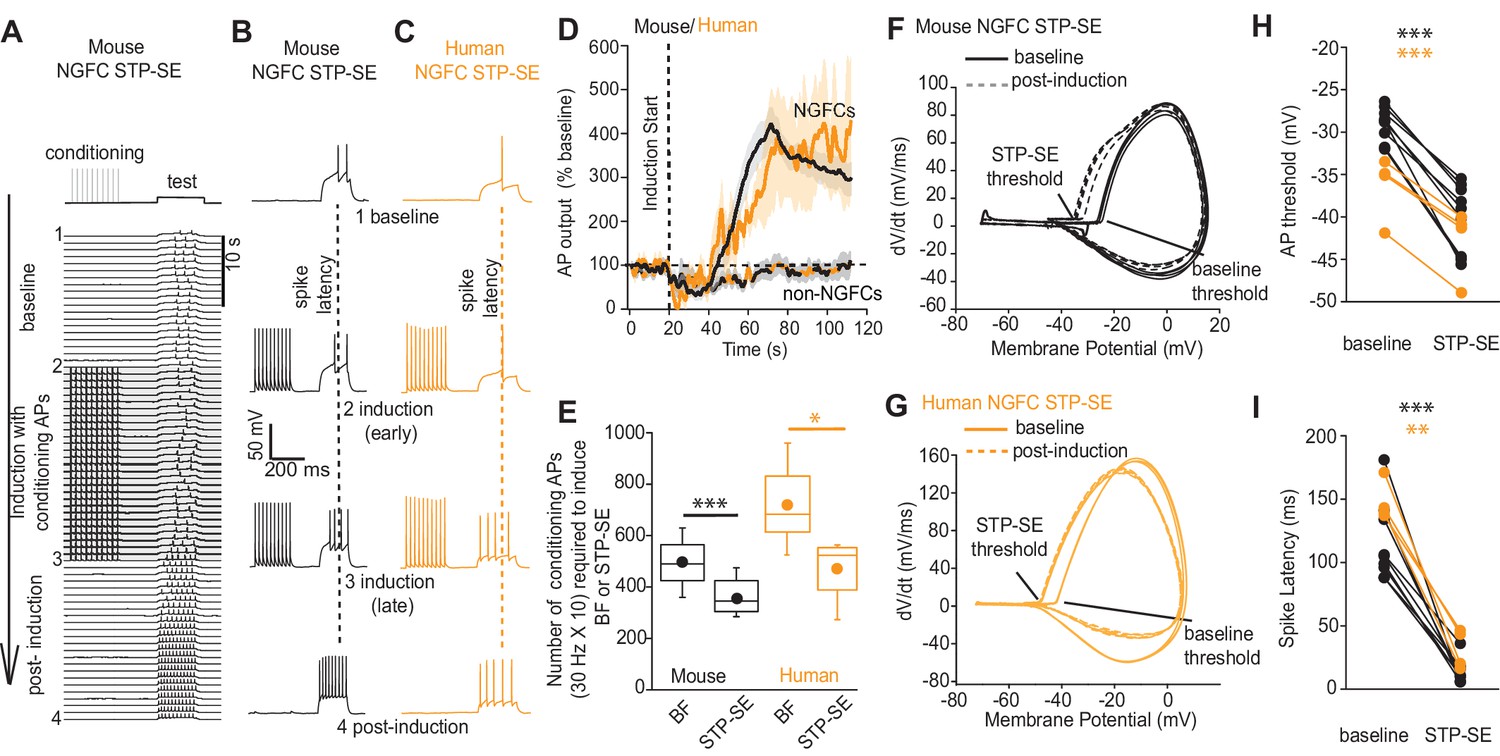
STP-SE in mouse and human NGFCs occurs in the absence of BF.
(A–C) Single example time course of the conditioning protocol employed to elicit STP-SE in mouse and human NGFCs. Action potential output was elicited to a test rheobase depolarizing current injection (300 ms; typically 100 pA - 140 pA; baseline) in the absence (baseline) and during conditioning action potentials (induction; 10 depolarizing steps of 2 ms width; 1000 pA - 1200 pA). Conditioning action potentials were terminated upon visualization of a marked loss in 1st spike latency (doted vertical lines) invariably accompanied by increased action potential output in response to the test depolarizing current injection (post-induction). (D) Pooled time course of action potential output (measured as number of action potentials in response to the test rheobase current injection) during the entire STP-SE induction protocol. Vertical dotted line indicates the commencement of induction with its termination occurring at varying times for each tested cell. Time course plots are from mouse (black) and human (orange) NGFCs displaying STP-SE (n = 9 and 4 for mouse hippocampal and human cortical NGFCs, respectively). For NGFCs (n = 7 and 2 for mouse hippocampal and human cortical NGFCs, respectively) and non-NGFCs (n = 4 and 3 for mouse and human non-NGFCs, respectively) that did not show STP-SE data were pooled between species (dashed black and orange line). (E) Box plots comparing number of conditioning action potentials required for BF (note these data are replotted from Figure 1E; n = 68 and 12, for mouse hippocampal and human cortical NGFCs, respectively) and STP-SE (n = 9 and 4, for mouse hippocampal and human NGFCs, respectively). Paired t-test p-values were 0.0004 and 0.031 for mouse and human, respectively. (F,G) Phase plots of action potential output to the test depolarizing test pulse during baseline (solid lines) and after induction of STP-SE (dotted lines) in single example mouse and human NGFCs. (H,I) Line plots demonstrating hyperpolarization of action potential threshold and reduction of spike latency following induction of STP-SE in mouse hippocampal and human NGFCs. Paired t-test p-values for comparisons of mouse AP threshold and latency (baseline vs. STP-SE) were 0.0000028 and 0.000025, respectively (n = 9). Paired t-test p-values for comparisons of human AP threshold and latency (baseline vs. STP-SE) were 0.000085 and 0.003, respectively (n = 4).
-
Figure 3—source data 1
Data plotted for Figure 3.
- https://cdn.elifesciences.org/articles/57571/elife-57571-fig3-data1-v2.xlsx
Figure 3—figure supplement 1
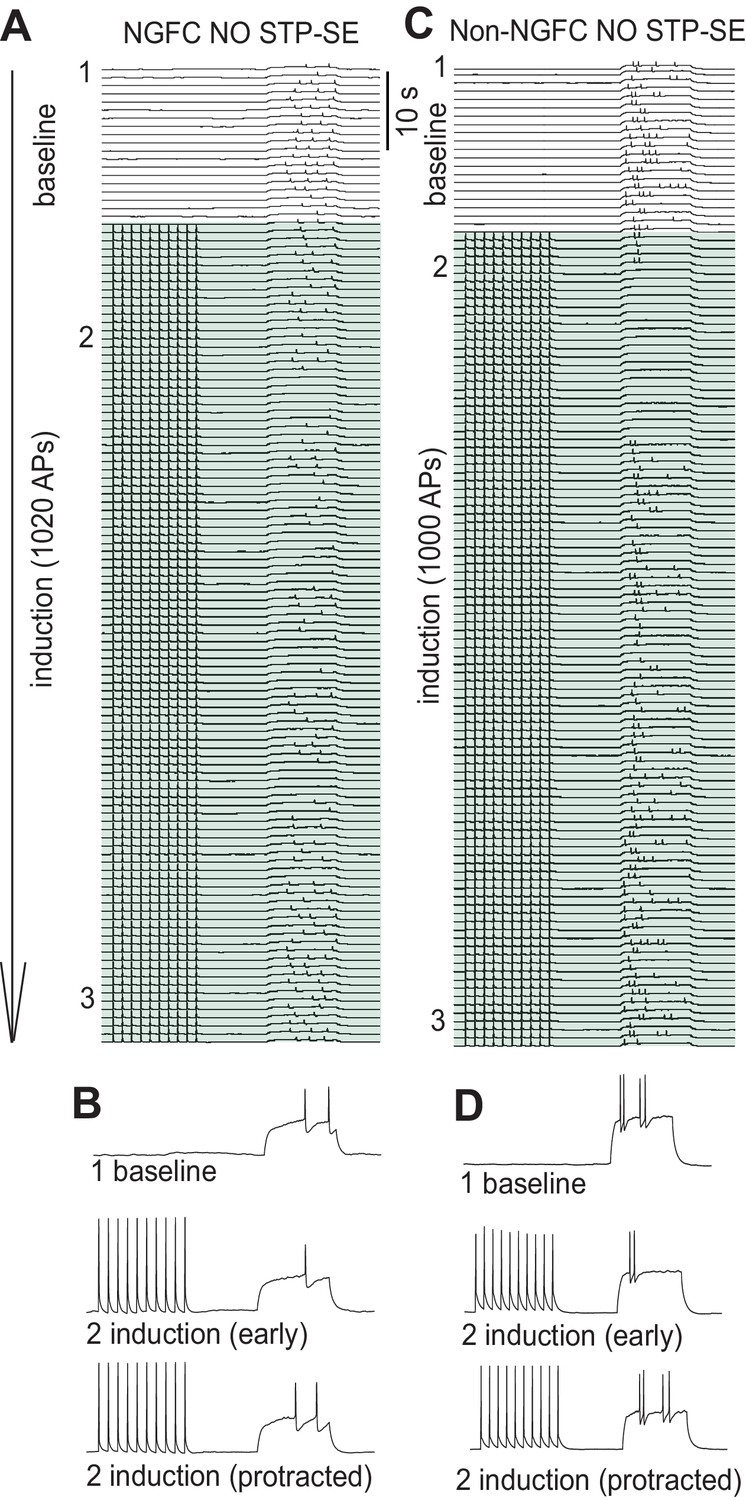
Inability to induce STP-SE in a subpopulation of NGFCs and all non-NGFCs tested.
(A-D) Time course traces demonstrating the inability of a single example mouse NGFC and non-NGFC to express STP-SE. Traces in B and D are magnified for clarity at the time points in the induction protocol as indicated.
Figure 4
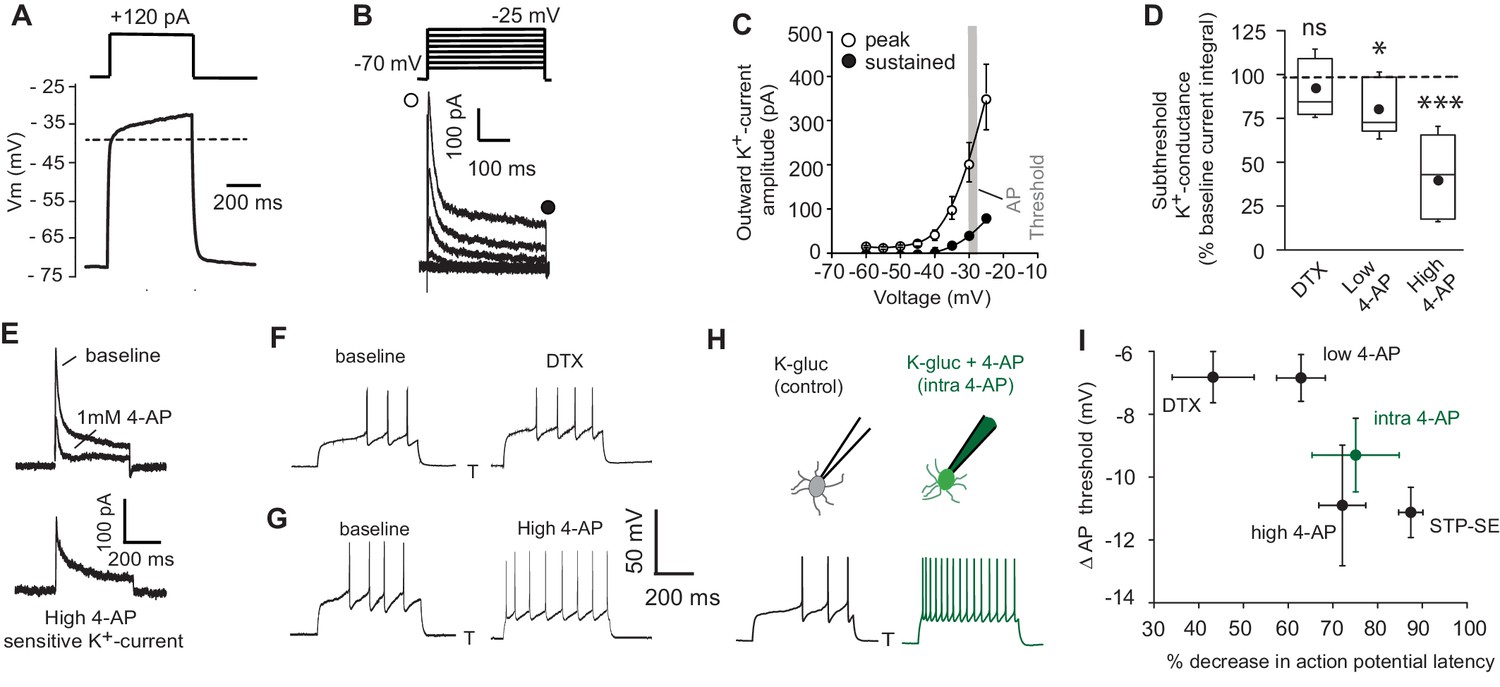
Pharmacological block of a subthreshold transient K+-conductance mimics the AP latency and threshold modulation seen in STP-SE.
(A) Single example voltage trace to a depolarizing current injection (120 pA) in the presence of 1 μm TTX and 200 μm NiCl2 to block voltage gated Na+ and low-threshold activated Ca2+ channels, respectively. (B) Representative voltage-gated outward K+-currents activated in response to a series of predominantly subthreshold depolarizing voltage steps. Transient (open circle) and sustained (closed circle) components are labeled (C) Pooled data of the current-voltage curve of outward peak and sustained K+-currents with gray shaded area depicting the mean action potential threshold measured in NGFCs (n = 6). (D) Box plot data depicting the pharmacological sensitivity of the subthreshold outward conductance to a subthreshold voltage step (−30 mV) by 100–200 nM DTX, 100 μm (low 4-AP) and 1–3 mM 4-AP (high 4-AP; n = 5, 7 and 11, respectively). p-values for DTX and high 4-AP datasets (Wilcoxin signed rank test) and paired t-test for low 4-AP were 0.44, 0.00098 and 0.02, respectively. (E) Single trace example of the pharmacological isolation of high 4-AP sensitive subthreshold outward K+-current elicited in NGFCs characterized by a transient, inactivating time course. (F,G) Single trace examples showing the effect of DTX and high 4-AP on action potential output upon rheobase current step injections (120 pA). (H) Single trace examples comparing the effect of action potential output to a rheobase current injection performed with K+-gluconate intracellular solution without (control; left trace) or with added 4-AP (intra-4-AP; right green trace; 3 mM). (I) Pooled data showing a comparison of the effects of DTX (n = 10), low 4-AP (n = 9), high 4-AP (n = 12), intra-4-AP (3 mM; n = 7) and STP-SE (n = 9) on action potential latency and threshold in relation to that seen with STP-SE (n = 9).
-
Figure 4—source data 1
Data plotted for Figure 4.
- https://cdn.elifesciences.org/articles/57571/elife-57571-fig4-data1-v2.xlsx
Figure 5

Functional availability of IKA modulates intrinsic excitability and induction requirements of STP-SE.
(A) Single trace examples showing the effect of DTX (top traces), high 4-AP (middle traces) and with K+-gluconate intracellular solution without (control; bottom left trace) vs. 4-AP (intra-4-AP; bottom right green trace; 3 mM) on action potential output upon 1.5 x threshold current step injections (B) Pooled data showing the effects of STP-SE (n = 8), DTX (100–200 nM; n = 8), low 4-AP (100 μm; n = 9), high 4-AP (1 mM; n = 7) on intrinsic excitability measured the total number of action potentials to a series of depolarizing current injections. p-values from unpaired t-tests comparing increase in intrinsic excitability between STP-SE vs. DTX, STP-SE vs. low-4AP or STP-SE vs. high-4AP = 0.011, 0.045 and 0.38, respectively. (C) Pooled data comparing intrinsic excitability of NGFCs to series of depolarizing current injections with control intracellular K+-gluconate (n = 7; black trace) or K+-gluconate with added 4-AP (interleaved experiments; intra 4-AP 3 mM; n = 7; green trace). (D) Effect of high 4-AP (1 mM) on voltage response of NGFC to a subthreshold current injection step (120 pA). (E) Single trace examples illustrating recovery of subthreshold IKA current following successive depolarizing voltage steps of the same amplitude (typically 120 pA). (F) Corresponding action potential output of NGFCs to pairs of temporally separated threshold current injections (200 ms) shown previously in (E) to result in a range of IKA inactivation. (G) Pooled data showing comparison between the level of IKA inactivation induced measured as ratio of peak amplitude of IKA (n = 6) and ratio of latency (n = 6) of the first action potential between the two successive depolarizing voltage/current steps, respectively. (H) Pooled data showing relationship between the level of IKA inactivation induced (n = 6) and increase in action potential output (n = 6), the latter measured as percentage increase in number of action potentials of between the two successive depolarizing current steps. (I) Pooled time course of action potential output (measured as number of action potentials in response to the test rheobase current injection as percentage of baseline) during the entire STP-SE induction protocol in NGFCs with either control intracellular K+-gluconate (n = 7; black plot) or K+-gluconate with added 4-AP (interleaved experiments; intra 4-AP 3 mM; n = 7; green plot). Vertical dotted line indicates the commencement of induction with its termination occurring at varying times for each tested cell. (J) Box plot showing number of conditioning APs required for expression of STP-SE with control or intra-4AP K+-gluconate solution (interleaved experiments; n = 5 for both conditions; unpaired t-test p value = 0.00005).
-
Figure 5—source data 1
Data plotted for Figure 5.
- https://cdn.elifesciences.org/articles/57571/elife-57571-fig5-data1-v2.xlsx
Figure 6 with 2 supplements
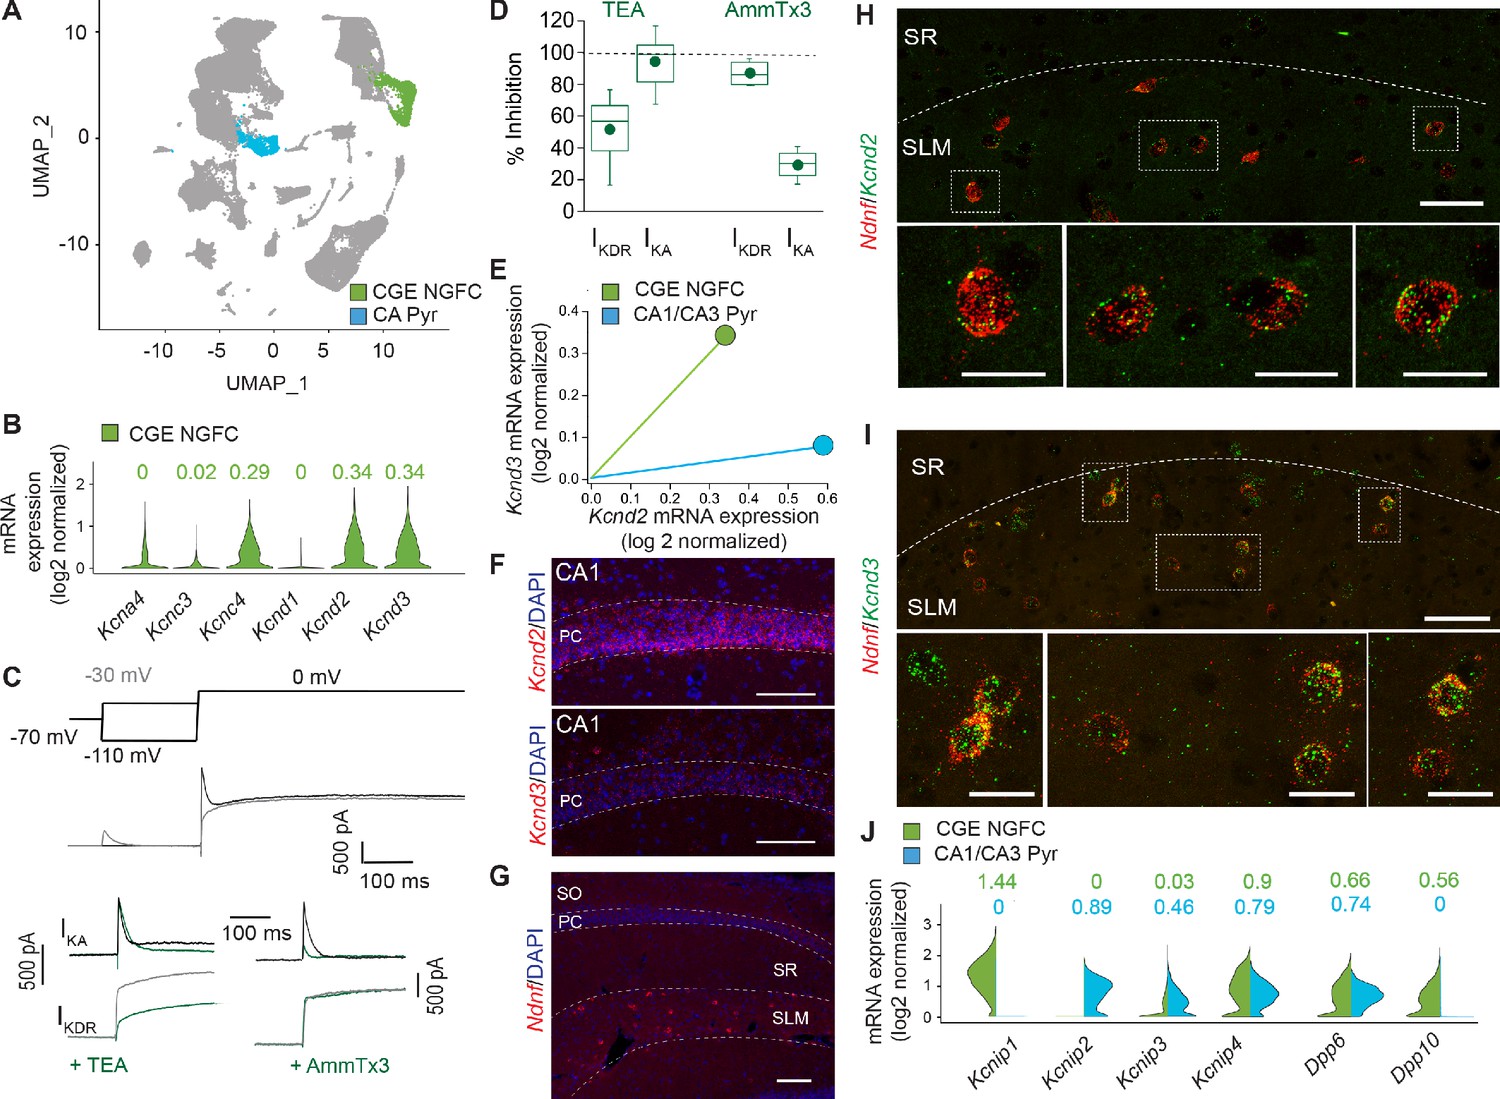
IKA in NGFCs is predominantly mediated by Kv4-subunit containing channels.
(A) Uniform Manifold Approximation and Projection (UMAP) plot of RNAseq data publicly available from the Allen Brain Institute (see Materials and methods for details) highlighting clusters corresponding to CGE-NGFCs (green; 3626 cells) and hippocampal pyramidal cells (blue; 2530 cells). (B) Violin plots depicting comparison of mRNA levels in CGE-NGFCs that encode for subunits of IKA channels. Median values are depicted above each plot. (C) Top, middle; Voltage steps and corresponding single current traces illustrating the protocol employed to isolate IKA and IKDR. Bottom; Single traces illustrating the effects of TEA (2–10 mM) and AmmTx3 (500 nM) on the isolated IKA and IKDR. (D) Box plots depicting inhibition of IKA and IKDR by TEA (n = 8) and AmmTx3 (n = 4). (E) Scatterplot of median expression levels of Kcnd2 vs. Kcnd3 mRNA in CGE-NGFCs and hippocampal pyramidal cells. (F) Representative confocal images of Kcnd2 and Kcnd3 transcript expression in CA1 pyramidal cells revealed by RNAscope (see Materials and methods for details; scale bar = 100 μm) (G) Representative confocal image of the distribution of putative NGFCs (via expression of Ndnf mRNA transcripts) in CA1 SLM (scale bar = 100 μm). (H,I) Representative confocal images of mRNA expression of Kcnd2 and Kcnd3 in putative NGFCs (Ndnf-expressing) in CA1 SLM. (Scale bars = 50 μm for top panels; 20 μm for bottom panels) (J) Split-violin plots depicting comparison in the expression levels of mRNA transcripts encoding known auxiliary subunits of Kv4-containing channels (KChIPs and DPLPs) in CGE-NGFCs (green) vs. hippocampal pyramidal cells (blue).
-
Figure 6—source data 1
Data plotted for Figure 6.
- https://cdn.elifesciences.org/articles/57571/elife-57571-fig6-data1-v2.xlsx
Figure 6—figure supplement 1
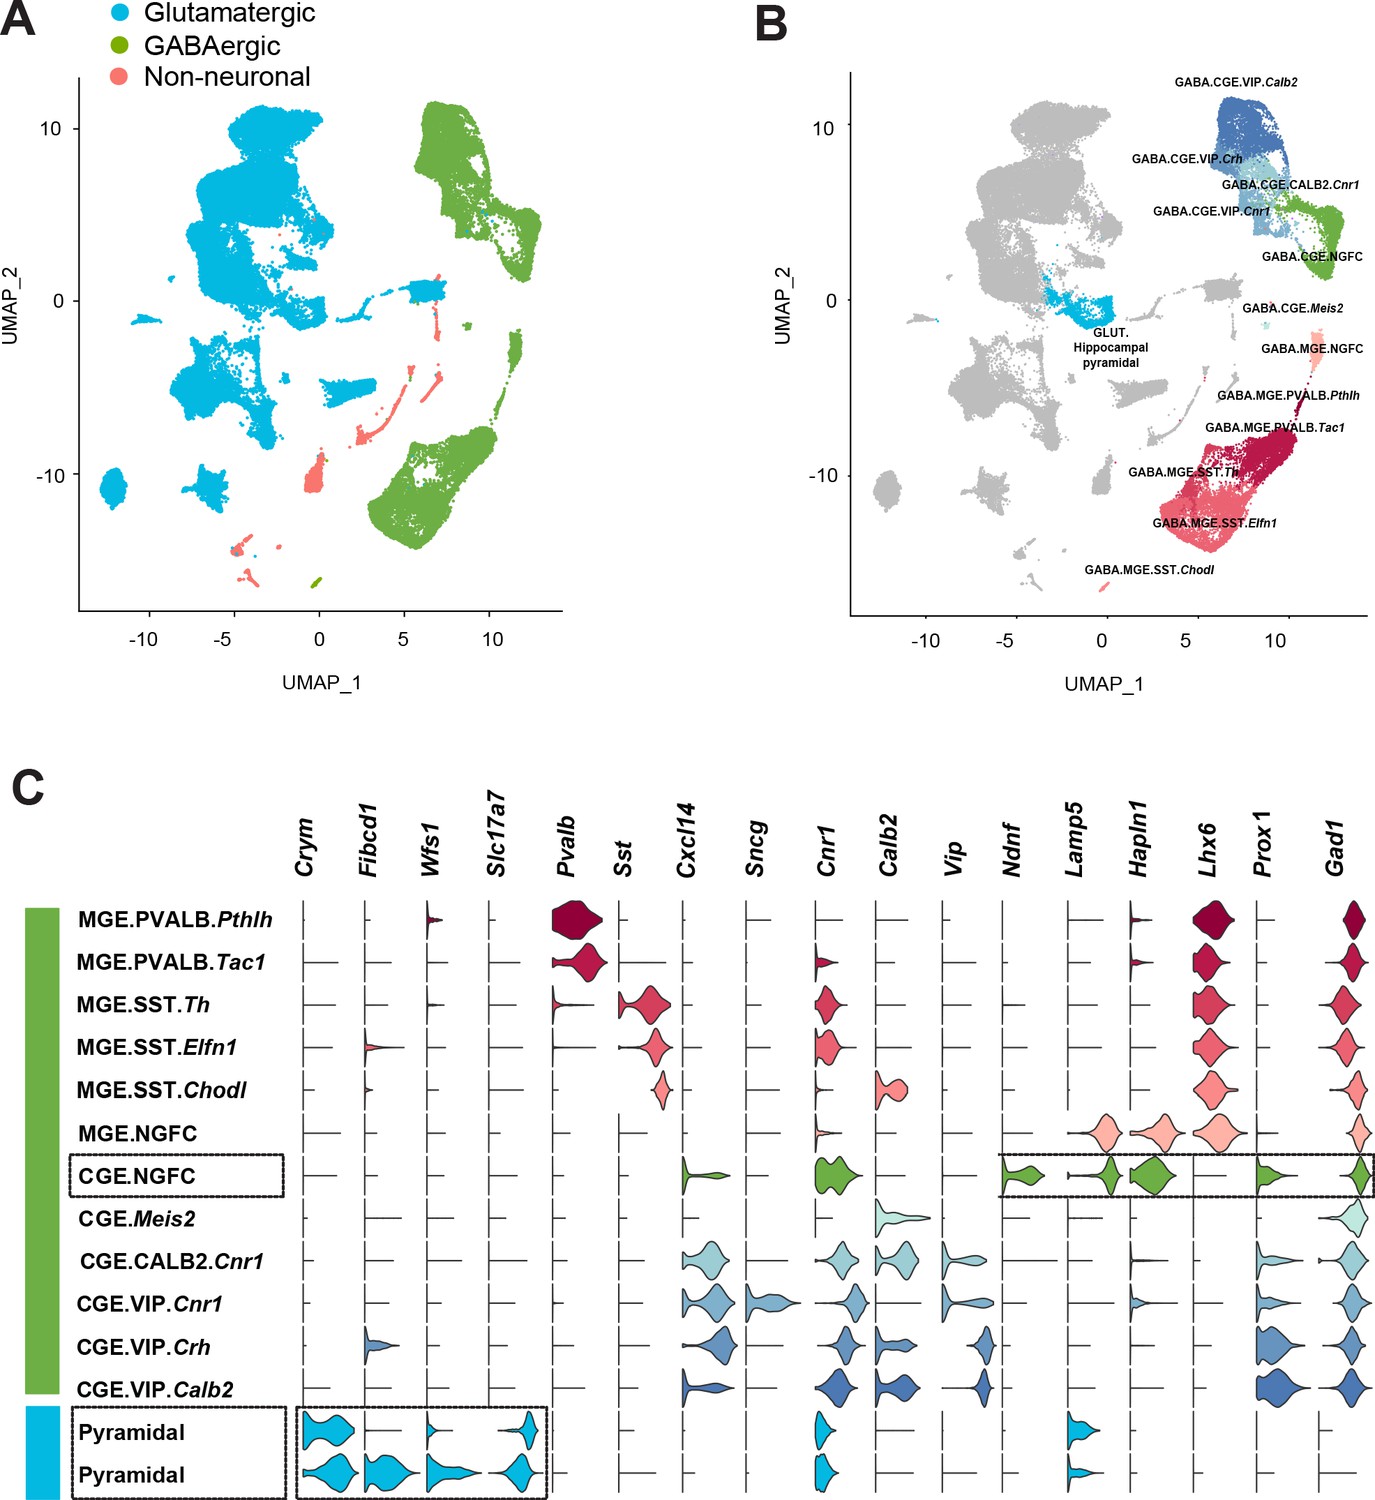
Delineation of mouse cortico-hippocampal cell clusters obtained from publicly available Allen Brain Institute scRNAseq data.
(A) Uniform Manifold Approximation and Projection (UMAP) dimension reductionality of ~76,000 single-cell transcriptomes, depicting the clustering of broad cell types. (B) Clustering of CGE and MGE-derived GABAergic interneuron subtypes. Cell clusters were colored and annotated post hoc based on their transcriptional profile identities (see Materials and methods). (C) Violin plots showing the distribution of expression levels of established cell type-enriched marker genes across GABAergic interneuron subtypes (see Materials and methods). Boxed regions illustrate the CGE-NGFCs (3626 cells) and hippocampal pyramidal cell (2530 cells) clusters delineated via the combined expression of the specific genes highlighted (see Materials and methods).
-
Figure 6—figure supplement 1—source data 1
Data plotted for Figure 6—figure supplement 1.
- https://cdn.elifesciences.org/articles/57571/elife-57571-fig6-figsupp1-data1-v2.xlsx
Figure 6—figure supplement 2
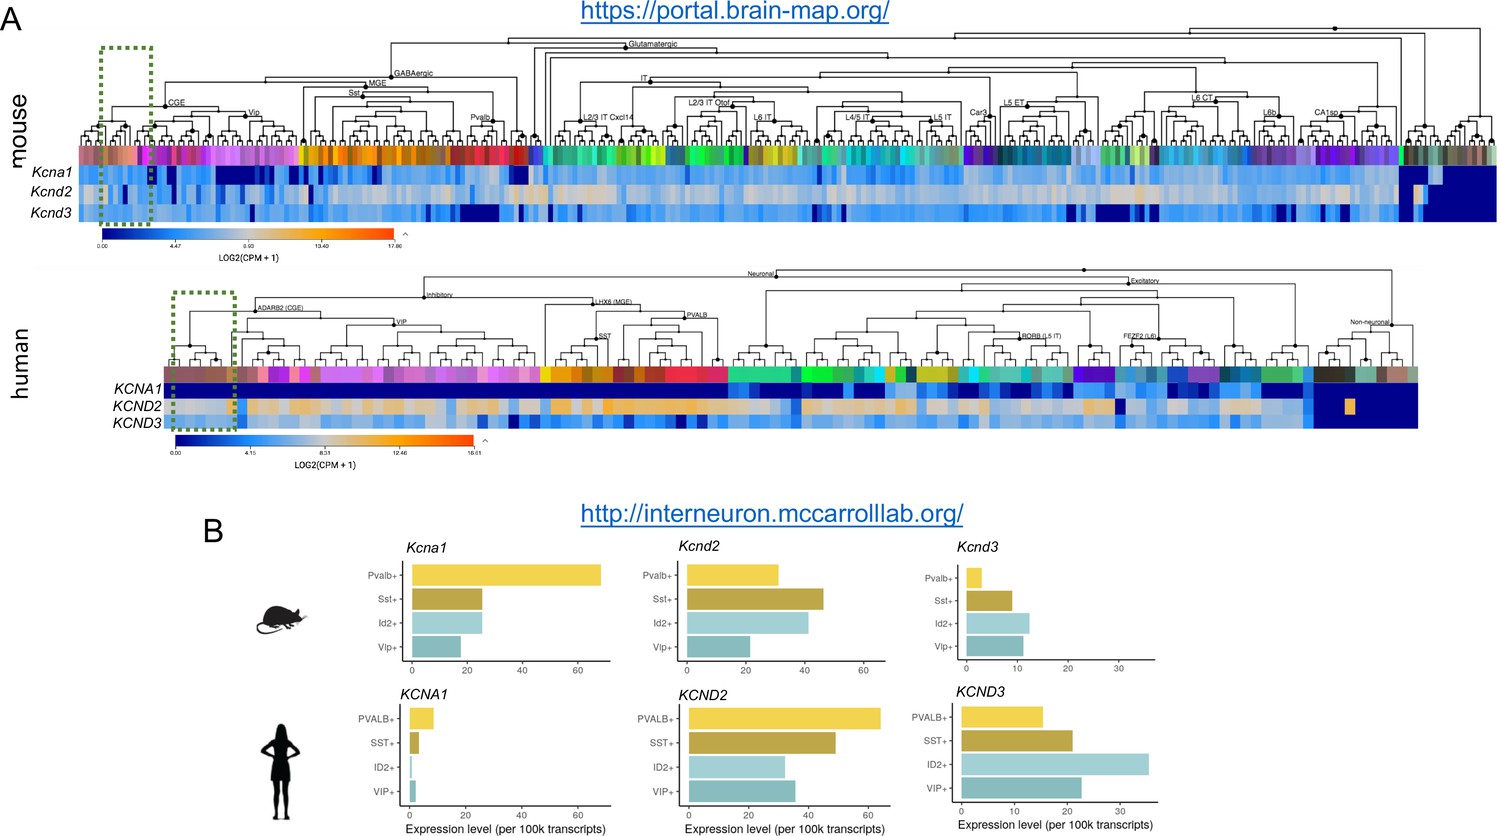
Comparison of subthreshold Kv1 and Kv4 subunit gene expression between mouse and human NGFCs and other IN subtypes.
(A,B) mRNA expression levels of Kcna1, Kcnd2 and Kcnd3 in neural cell types. Data are from publicly available resources from the Allen Brain Institute and the McCarroll Laboratory, Harvard Medical School. Green shaded box in (A) denotes the cluster corresponding to human cortical NGFCs. ID2+ cells in (B) corresponds to a subpopulation of human cortical NGFCs. Panel (A), top: 2019, 2020 Allen Institute for Brain Science. Mouse Transcriptomic Cell Types Database – Whole cortex and hippocampus – smart-seq with 10X-smart-seq taxonomy. Available from http://celltypes.brain-map.org/rnaseq/mouse_ctx-hip_smart-seq. Panel (B) is used with permission from Drs. McCarroll and Krienen (http://interneuron.mccarrolllab.org/).
© 2019 Allen Institute for Brain Science. All rights reserved. Panel (A), bottom: Human Transcriptomic Cell Types – Multiple cortical areas – smart-seq. Available from http://celltypes.brain-map.org/rnaseq/human_ctx_smart-seq. This panel is not available under the terms of a Creative Commons Attribution License and further reproduction of this panel would need to comply with the Allen Institute Terms of Use (https://alleninstitute.org/legal/terms-use/) and Citation Policy (https://alleninstitute.org/legal/citation-policy/).
Figure 7 with 1 supplement

STP-SE manifests as an increase in afferent recruitment of NGFCs via enhanced E-S coupling.
(A) Single traces showing the effect of AmmTx3 (500 nM) on EPSC (top traces) and corresponding EPSP (bottom trace) in a hippocampal NGFC in response to electrical stimulation of SLM afferent fibers (2 × 30 Hz). (B) Box plots of EPSC amplitudes (EPSC1 vs. EPSC2) under baseline conditions and after AmmTx3 treatment (n = 7; p values for EPSC1 and EPSC2 comparisons are 0.11 and 0.27, respectively). (C) Box plots of paired pulse ratio (EPSC2 peak amplitude/EPSC1 peak amplitude) under baseline conditions and after AmmTx3 treatment (n = 7; p value = 0.36). (D) Box plots of EPSP summation measured as absolute Vm at peak of EPSP1 and EPSP2 under baseline conditions and after AmmTx3 treatment (n = 7;=7; p values for EPSP1 and EPSP2 comparisons are 0.005 and 0.016, respectively)). (E–G) Single trace examples depicting a time course of E-S coupling (SLM afferent stimulation delivered at 5 × 30 Hz) during baseline conditions and after STP-SE induction. (H) Line plot depicting increased E-S coupling measured as spike probability during 10 sweeps of baseline vs. 10 sweeps immediately after STP-SE induction (n = 9; p value = 0.002). (I) Box plot illustrating duration of enhanced E-S coupling following STP-SE induction (n = 9).
-
Figure 7—source data 1
Data plotted for Figure 7.
- https://cdn.elifesciences.org/articles/57571/elife-57571-fig7-data1-v2.xlsx
Figure 7—figure supplement 1
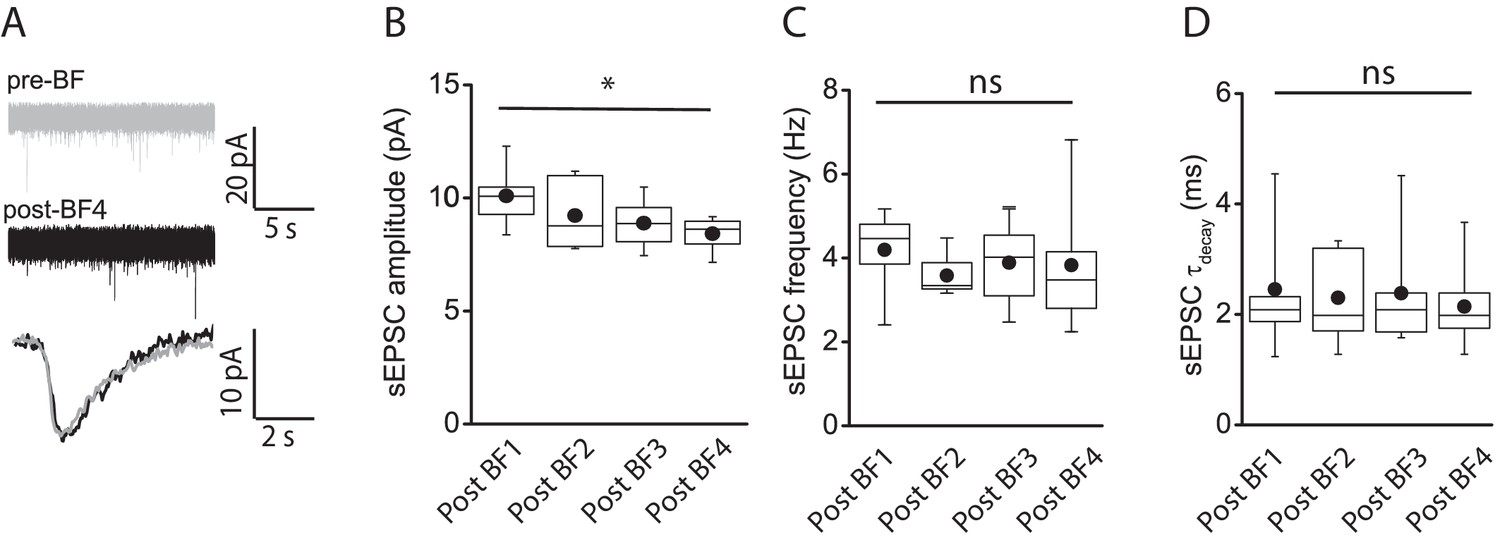
E-S coupling potentiation not attributed to modulation of spontaneous EPSC parameters.
(A) Traces showing spontaneous AMPA-receptor-mediated EPSCs (top) under baseline conditions (gray) and immediately after cessation of a 4th BF episode (post-BF4; black) elicited in a given NGFC. Bottom trace shows overlaid ensemble average of AMPA-receptor-mediated EPSCs during baseline and after 4th BF episode. (B,C,D) Box plots of AMPA-receptor-mediated sEPSC amplitude, frequency and decay time constant measured under baseline (n = 6) and immediately following cessation of BF, BF2, BF3 and BF4 (n = 6) episodes. Paired t-test p-values for comparison of sEPSC amplitude, frequency and tau decay between post-BF1 vs. post-BF4 were 0.02, 0.64 and 0.95, respectively.
-
Figure 7—figure supplement 1—source data 1
Data plotted for Figure 7—figure supplement 1.
- https://cdn.elifesciences.org/articles/57571/elife-57571-fig7-figsupp1-data1-v2.xlsx
Author response image 1
No change in absolute peak of action potentials before and during STP-SE.
Black and orange data are from mouse (n = 9) and human(n = 4) NGFCs, respectively.
Author response image 2
Single example illustrating a reversal in the modulation of AP output following STP-SE induction.
Author response image 3
Changes in electrotonic distance of AIS is not a prerequisite for heightened intrinsic excitability observed during STP-SE.
Values above 2nd derivative plots denote numbers of NGFCS displaying the changes highlighted. Black and orange data are from mouse (n = 9) and human(n = 4) NGFCs, respectively.
Additional files
Download links
A two-part list of links to download the article, or parts of the article, in various formats.
Downloads (link to download the article as PDF)
Open citations (links to open the citations from this article in various online reference manager services)
Cite this article (links to download the citations from this article in formats compatible with various reference manager tools)
Activity-dependent tuning of intrinsic excitability in mouse and human neurogliaform cells
eLife 9:e57571.
https://doi.org/10.7554/eLife.57571


