Natural variation in autumn expression is the major adaptive determinant distinguishing Arabidopsis FLC haplotypes
- Cell and Developmental Biology, John Innes Centre, United Kingdom
- Computational and Systems Biology, John Innes Centre, United Kingdom
- Department of Natural Sciences, Mid Sweden University, Sweden
- Department of Biology, Lund University, Sweden
- Crop Genetics, John Innes Centre, United Kingdom
Figures
Figure 1 with 2 supplements

Field experimental setup.
(A) Map showing locations of field sites (dots) and the origins of five of the accessions (flowers) used in this study. These accessions, with the addition of Col-0, represent the five major and one intermediate (Löv-1) FLC haplotypes identified by Li et al., 2014. The lab genotype Col FRI was also used in this study as a vernalization-requiring reference. (B–D) Temperature profiles experienced by plants at the three field sites, North Sweden – Ramsta (B), South Sweden – Ullstorp (C) and Norwich, UK (D) (Source data 1, as from Hepworth et al., 2018 and Antoniou-Kourounioti et al., 2018). Flowers above temperature profile indicate the median time of bolting of each of the natural accessions and of Col FRI (legend at bottom left corner). Black dots below temperature profile indicate the timepoints when plant material was collected for expression analysis. Black arrows below temperature profiles indicate time of transfer to greenhouse with long-day, warm conditions to assess degree of vernalization based on bolting time.
Figure 1—figure supplement 1
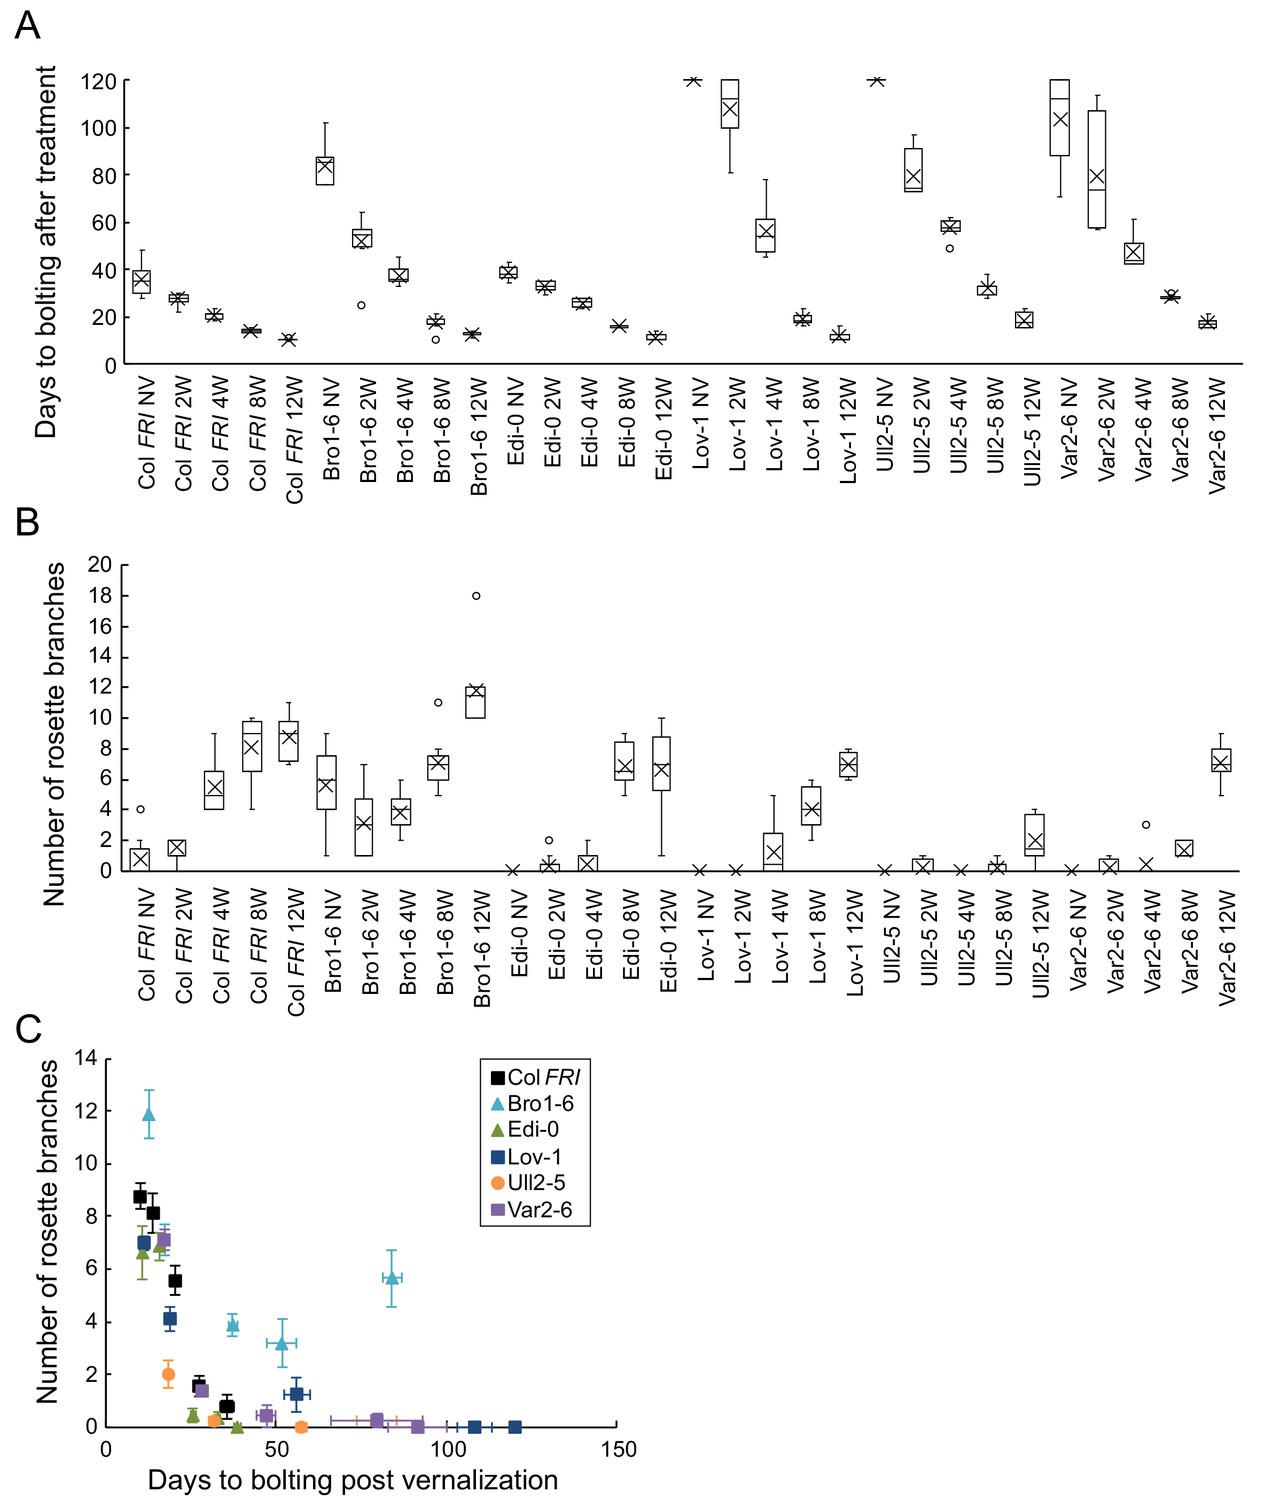
Increased vernalization reduces time to bolting, variability in bolting time, and increases rosette branch production in different accessions.
(A) Time to bolting for accessions in a heated, lit greenhouse without vernalization (NV) or after weeks of vernalization at constant 5°C (nW). (B) Number of rosette branches for plants shown in A. Median (central line), mean (cross), interquartile range (box), range (whiskers) and outliers (circles, values more than 1.5 times the interquartile range outside of the interquartile range). Plants that did not flower within 120 days of transfer not shown, see Source data 7. (C) Means per genotype and vernalization length treatment of rosette branch data presented in A and B, plotted against days to bolting. Error bars show s.e.m.
Figure 1—figure supplement 2
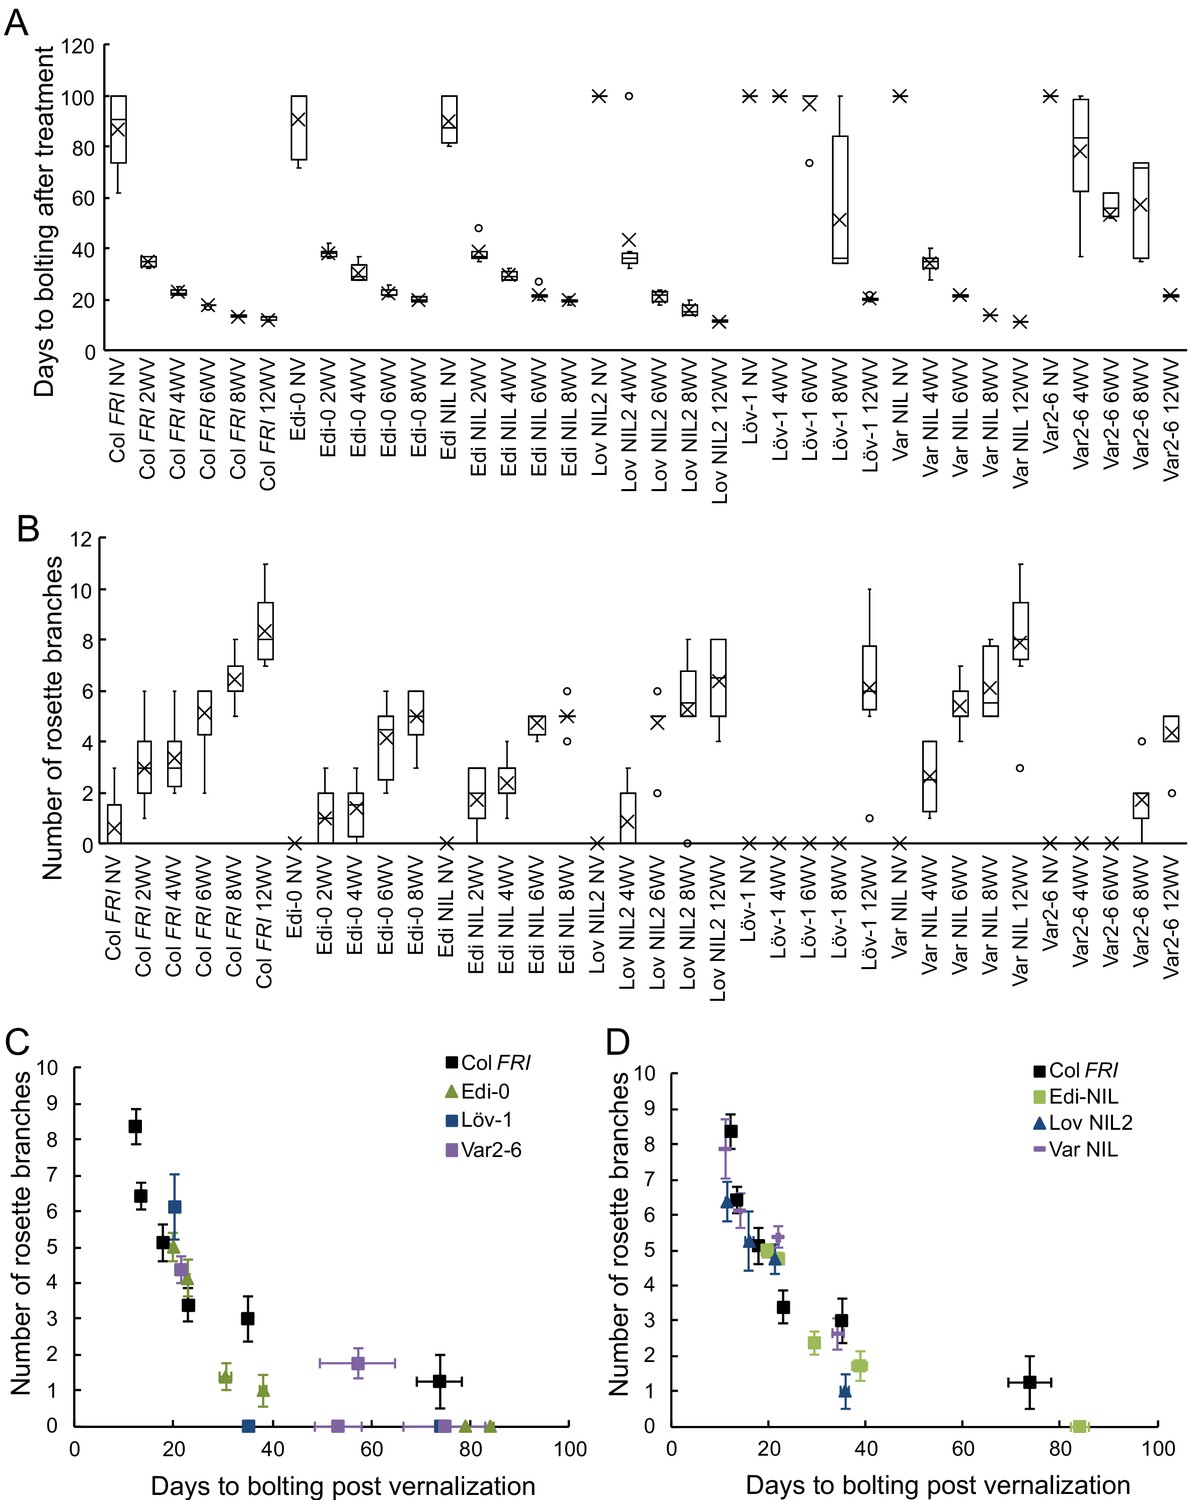
Increased vernalization reduces time to bolting and increased branch production with subtly different effects depending on FLC haplotype in the Col FRI background.
(A) Time to bolting for selected accessions and NILs in a heated, lit greenhouse without vernalization (NV) or after weeks of vernalization at constant 5°C (nW). (B) Number of rosette branches for plants shown in C. Median (central line), mean (cross), interquartile range (box), range (whiskers) and outliers (circles, values more than 1.5 times the interquartile range outside of the interquartile range). Plants that did not flower within 120 days of transfer not shown, see Source data 7. (C, D) Means per genotype and vernalization length treatment of rosette branch data presented in A and B, plotted against days to bolting for; (C) accessions only and (D) NILs only. Error bars show s.e.m.
Figure 2 with 3 supplements
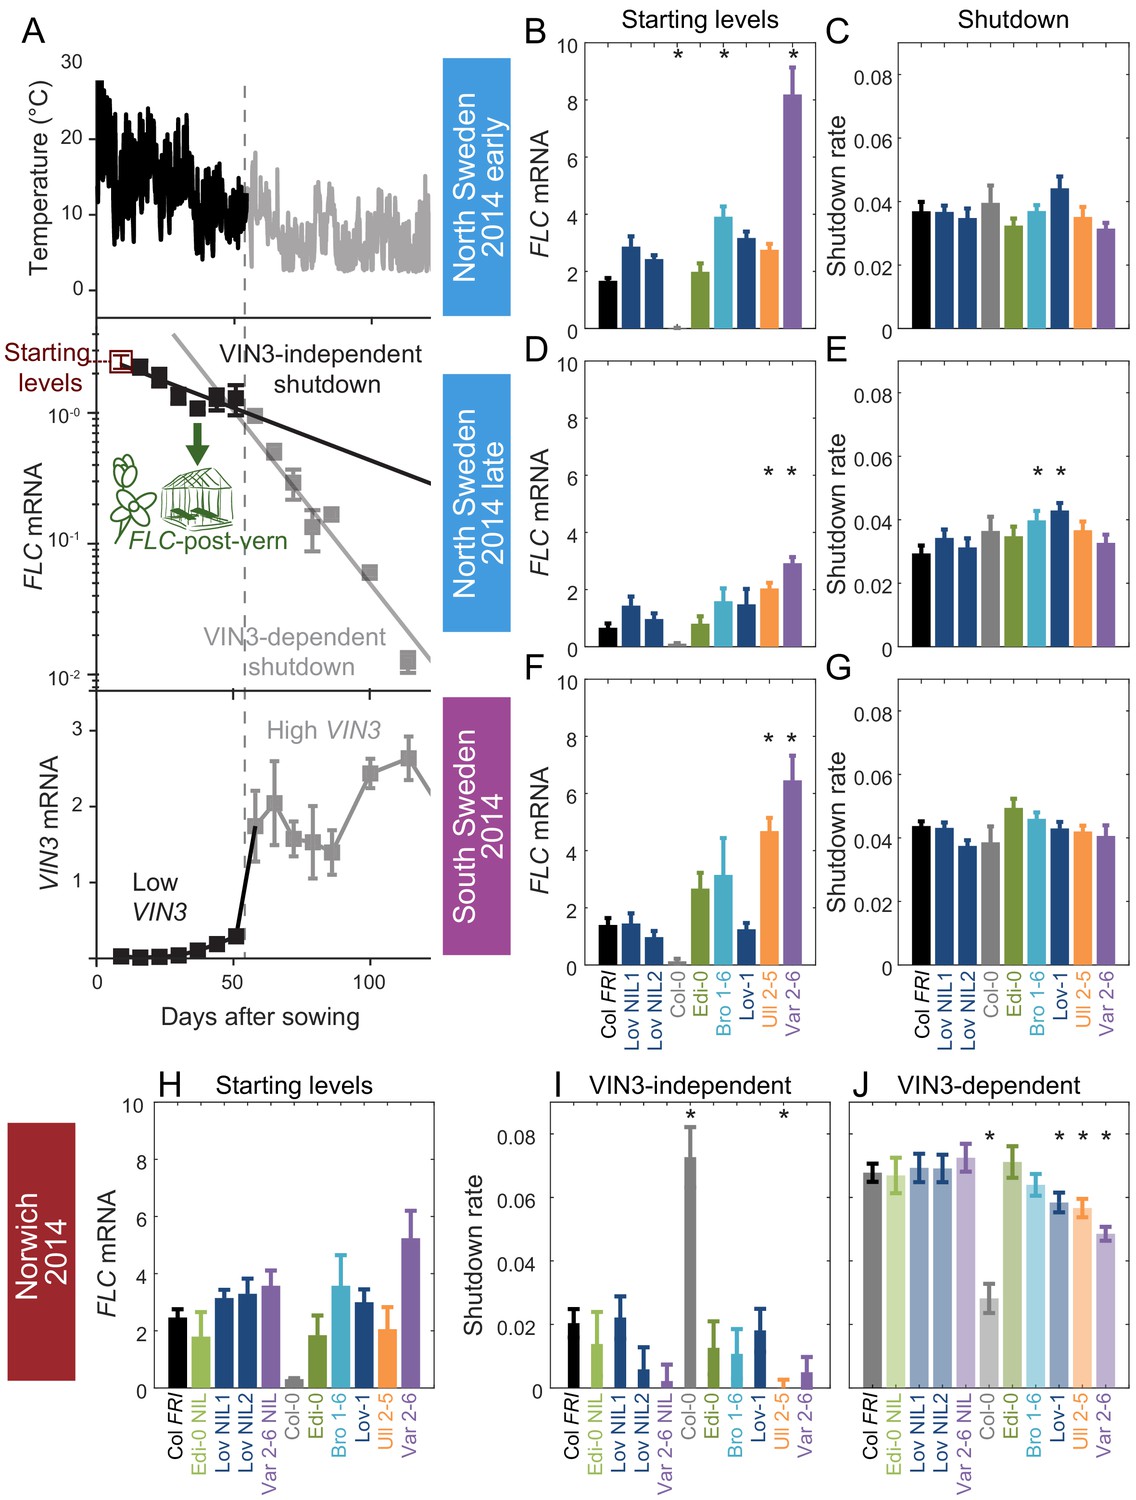
Downregulation in 2014–5 in Norwich, North Sweden (two plantings) and South Sweden for all NILs and accessions.
(A) Experimental data for Col FRI in Norwich 2014–5, showing the temperature profile (top), FLC (middle) and VIN3 (bottom) expression. Different shades indicate the separation of the VIN3-dependent (grey) and -independent (black) phases of FLC silencing (Hepworth et al., 2018) and equivalent times in VIN3 and temperature profiles (as in Figure 1D). Expression data were normalised to the control sample for 2014–5 (see Materials and methods). N = 6 except where samples were lost to death or degradation (see Materials and methods and Source data 2). Error bars show standard error of the mean (s.e.m). The initial measurement in the field (Starting levels), the rate of downregulation before induction of VIN3 expression (VIN3-independent, estimated from the slope of the fitted line) and the rate of downregulation after VIN3 induction (VIN3-dependent) are the three features that were analysed and compared for each genotype and treatment in the next panels, based on the data of Figure 2—figure supplement 1. A new feature is also shown, the FLC-post-vern, that is measured based on the flowering time from plants transferred to glasshouses with inductive conditions and how that relates to the FLC levels at the time of the transfer. (B–J) FLC downregulation analysed as level at first time point (Starting levels), and rate of downregulation (Shutdown – combining early and later timepoints for FLC data – see Materials and methods) for North (B–E) and South Sweden (F–G), or rate of downregulation before (VIN3-independent, dark bars) and after (VIN3-dependent, translucent bars) VIN3 induction for Norwich (H–J). Features of genotypes that are significantly different to the reference line Col FRI are indicated by * (for Starting levels, ANOVA with Dunnett’s post-hoc test, for Shutdown rates, Satterthwaite’s t-tests on REML Linear mixed model). p-values for all comparisons are given in Supplementary file 1. Rates of downregulation are given in units of ‘a.u. per day’, where the arbitrary units (a.u.) correspond to the normalised concentration of FLC mRNA, measured by qPCR. VIN3 induction started at ~58 days in Norwich (Figure 2—figure supplements 2–3). Expression data were normalised to the control sample for 2014–5 (see Materials and methods). N = 6 except where samples were lost to death or degradation (see Materials and methods and Source data 2). Error bars show s.e.
Figure 2—figure supplement 1
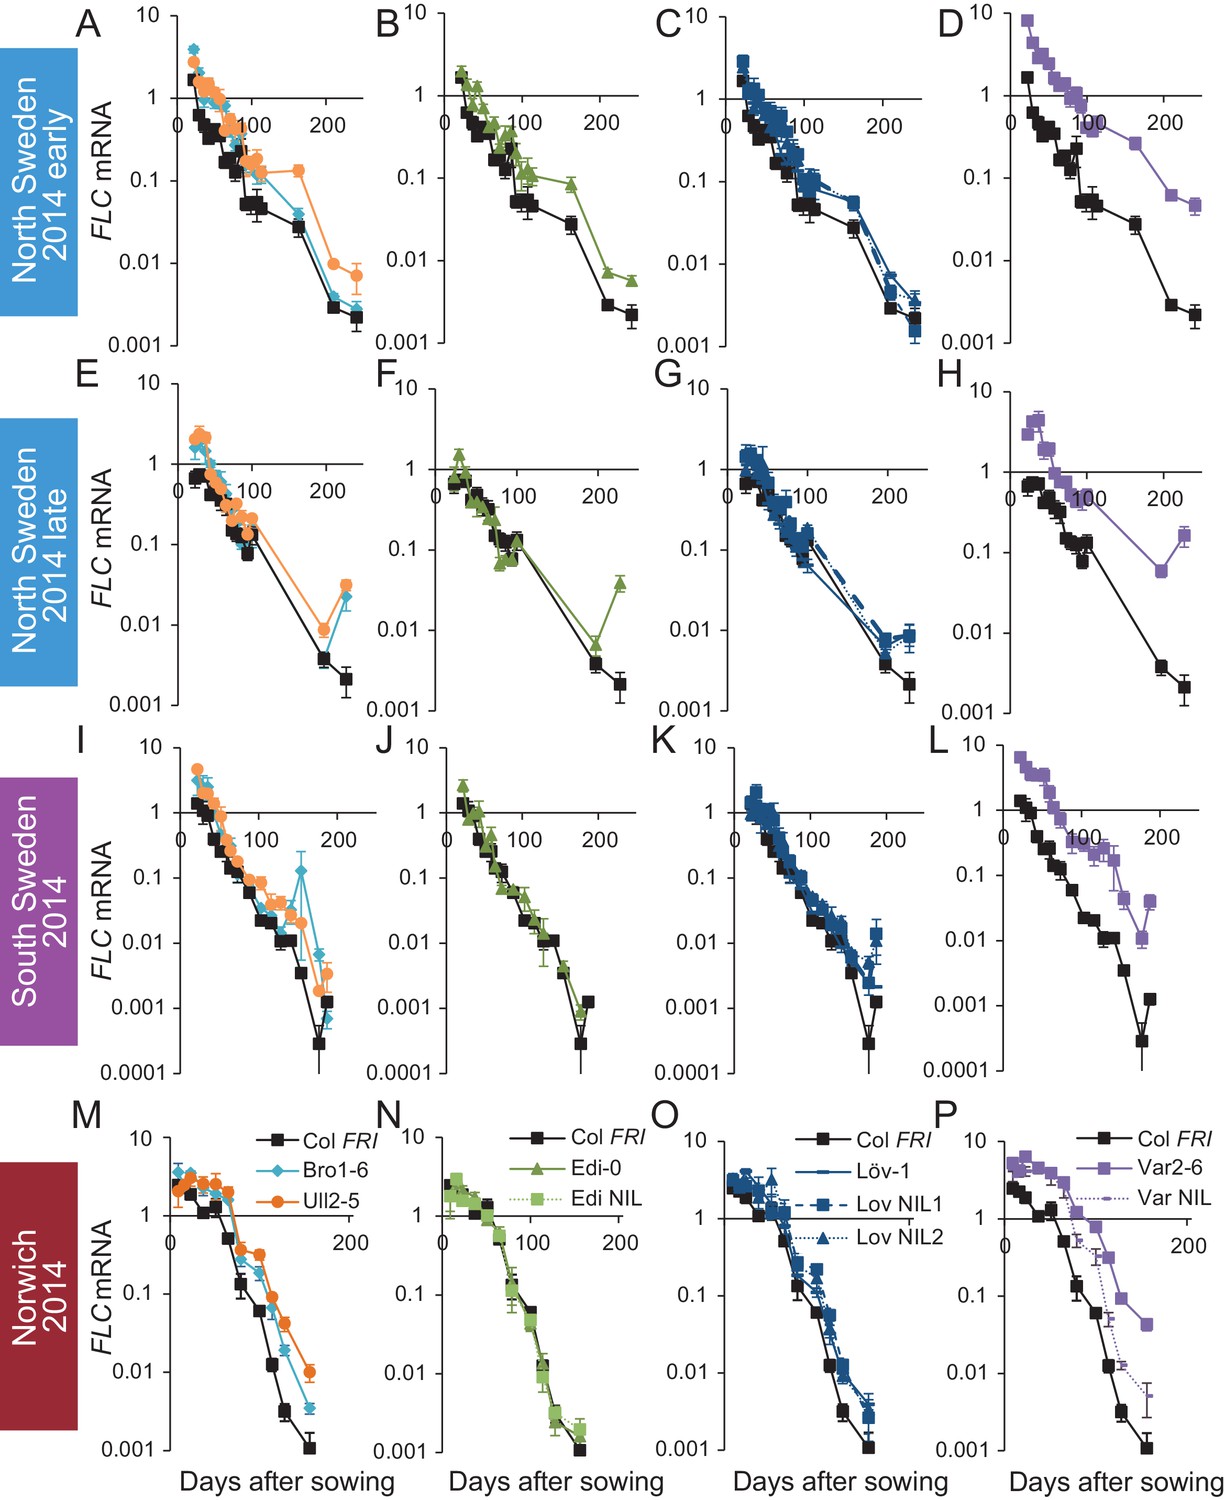
FLC downregulation in accessions and NILs in Norwich, North Sweden and South Sweden 2014–5.
Expression normalised to control sample for 2014–5 (see Materials and methods). (A–D) Norwich, (E–H) South Sweden, (I–L) North Sweden first planting, (M–P) North Sweden second planting. N = 6 except where samples were lost to death or degradation (see Materials and methods and Source data 2). Error bars show s.e.m.
Figure 2—figure supplement 2
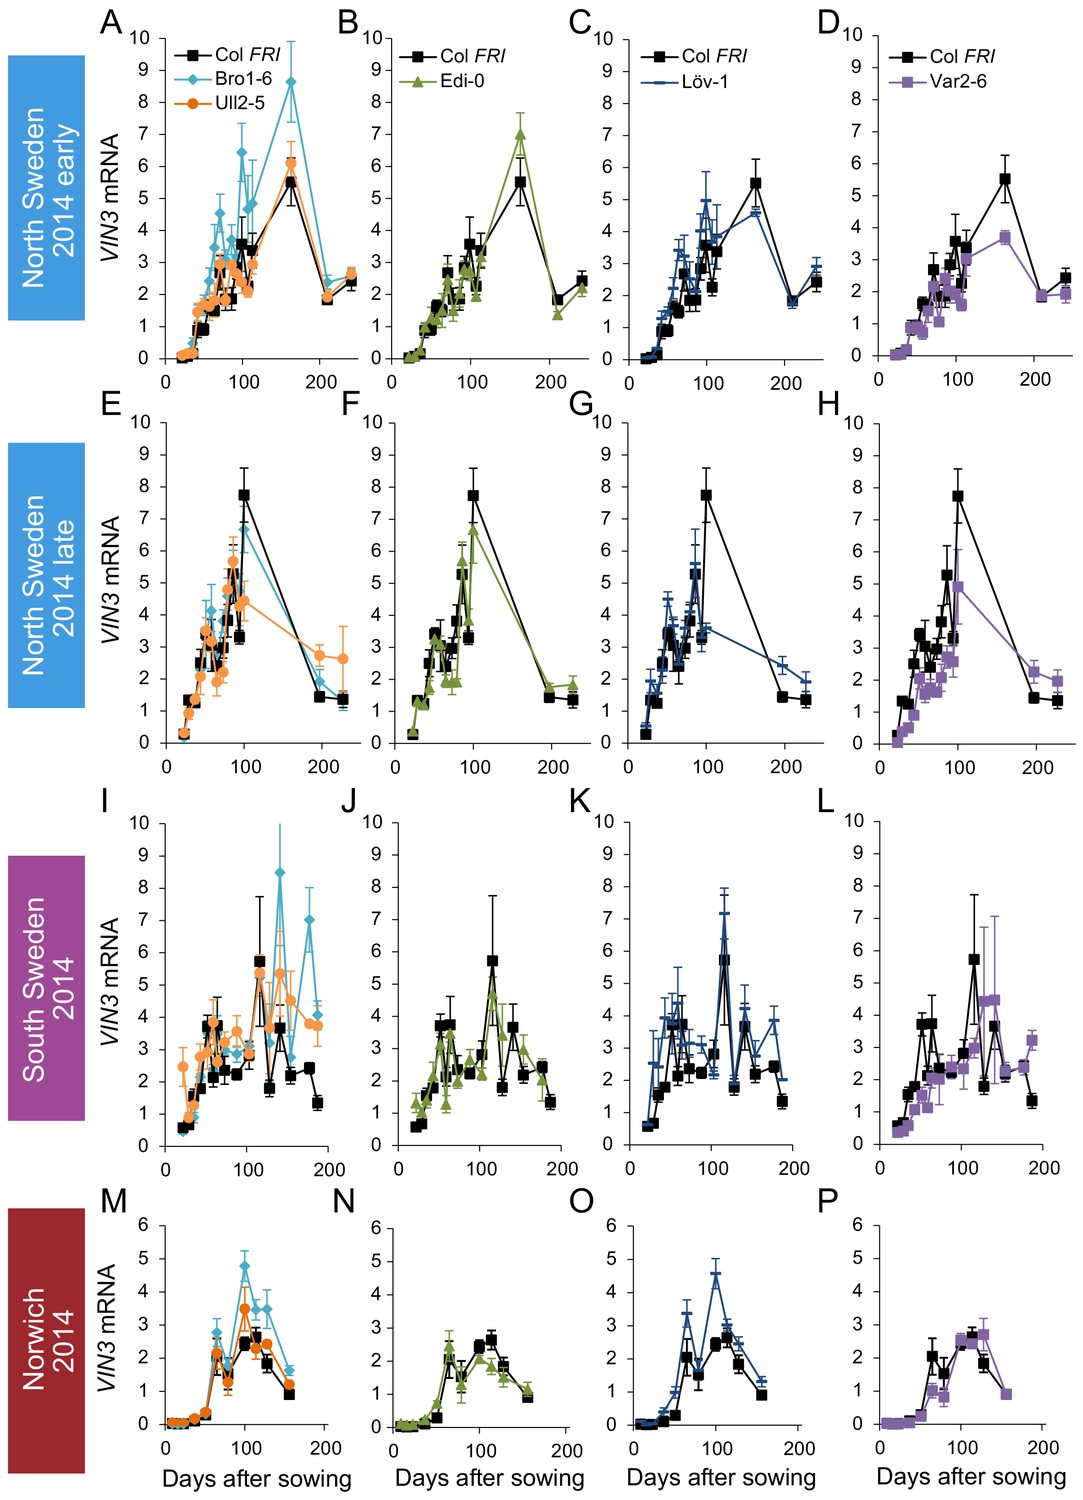
VIN3 upregulation in accessions in Norwich, North Sweden and South Sweden 2014–5.
VIN3 expression normalised to control sample for 2014–5 (see Materials and methods). N = 6 except where samples were lost to death or degradation (see Materials and methods and Source data 2). Error bars show standard error of the mean (s.e.m).
Figure 2—figure supplement 3
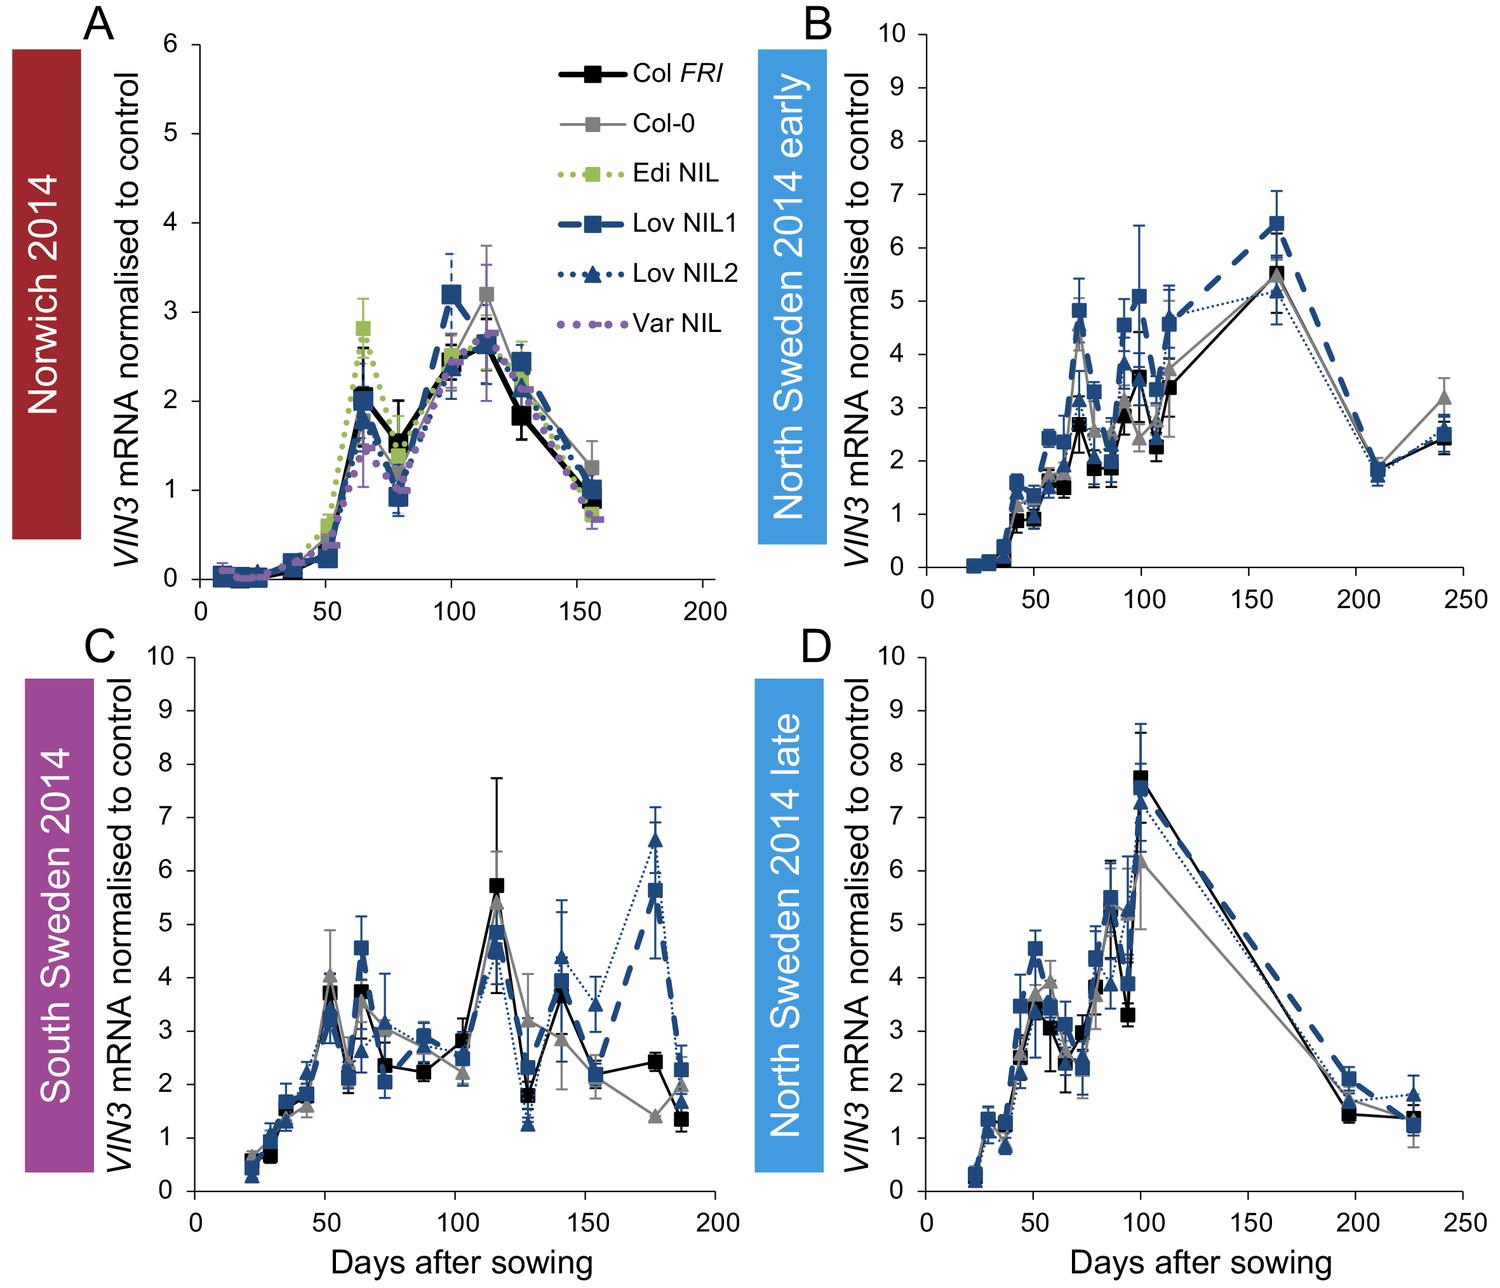
Expression of VIN3 in NILs with the Col-0 VIN3 allele in the field in 2014–2015.
(A) Norwich, (B) North Sweden first planting, (C) South Sweden, (D) North Sweden second planting. N = 6 except where samples were lost to death or degradation (see Materials and methods and Source data 2). Error bars show s.e.m.
Figure 3 with 3 supplements
Downregulation in 2016 in Norwich and North Sweden for NILs and accessions show similar patterns of response to the first year.
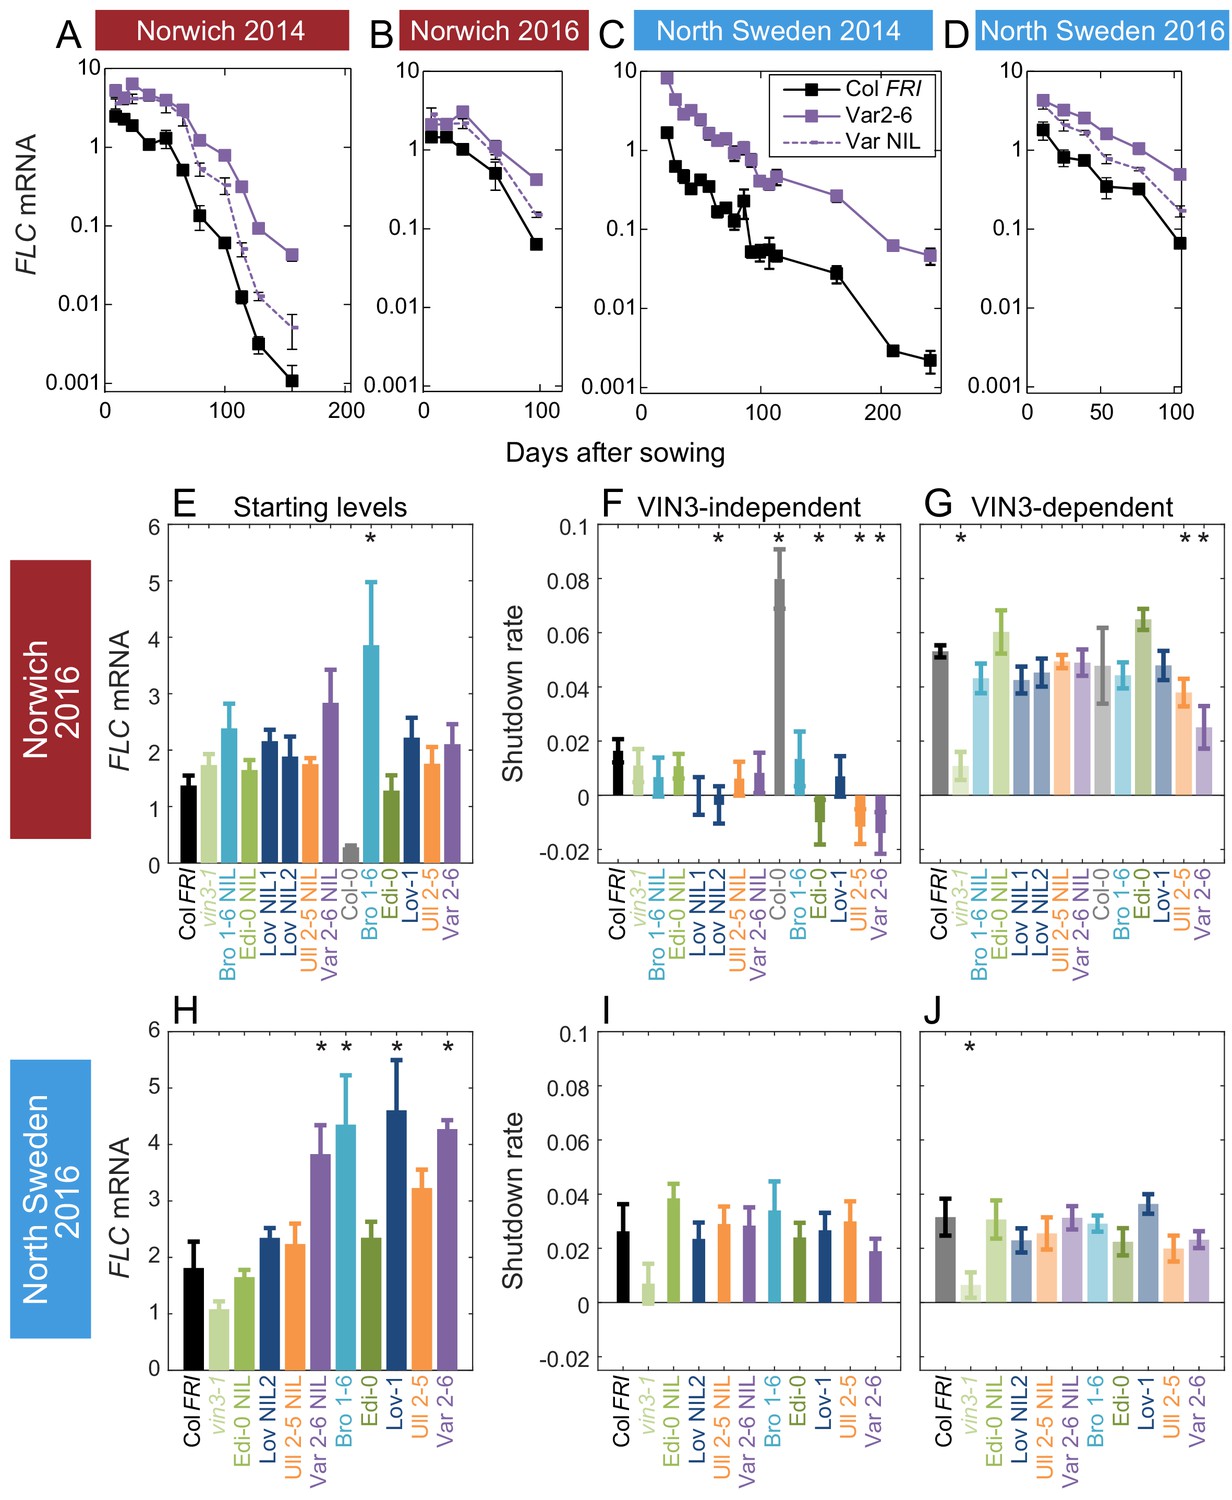
(A–D) FLC downregulation in Col FRI, Var2-6 and the Var NIL, as measured for Norwich and North Sweden in the winters of 2014–5 and 2016–7. (E–J) FLC downregulation as Starting level and VIN3-independent and dependent rates. Features of genotypes that are significantly different to the reference line Col FRI are indicated by * (for Starting levels, ANOVA with Dunnett’s post-hoc test, for Shutdown rates, Satterthwaite’s t-tests on REML Linear mixed model). p-values for all comparisons are given in Supplementary file 1. VIN3 induction started at: Norwich 2016, ~48 days, North Sweden 2016,~46 days, see (Figure 3—figure supplement 1) Expression data were normalised to the corresponding control sample (2016–7, see Materials and methods). N = 6 except where samples were lost to death or degradation (see Materials and methods and Source data 3). Rates of downregulation are given in units of ‘a.u. per day’, where the arbitrary units (a.u.) correspond to the normalised concentration of FLC mRNA. Error bars of bar plots show s.e., of line graphs show s.e.m.
Figure 3—figure supplement 1
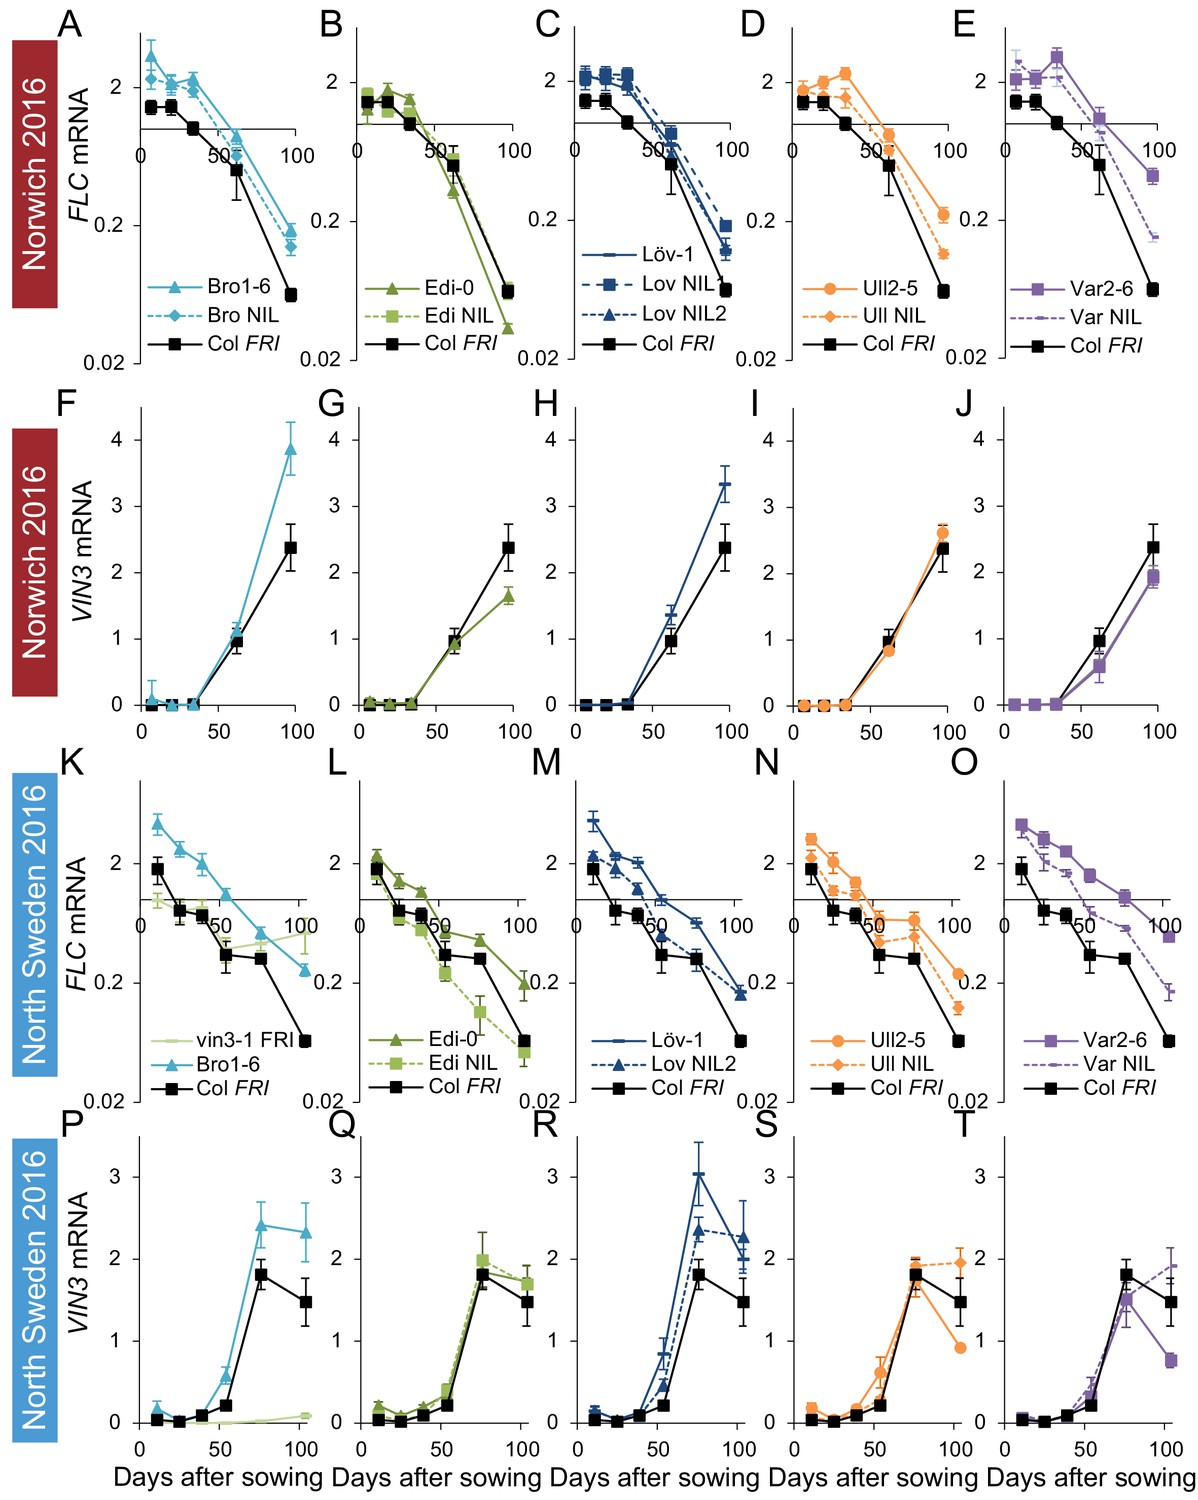
FLC downregulation and VIN3 upregulation in accessions in Norwich and North Sweden in autumn/winter 2016.
Expression normalised to control sample for 2016–7 (see Materials and methods). (A–E) Norwich FLC mRNA, (F–J) Norwich VIN3 mRNA, (K–O) North Sweden FLC mRNA, (P–T) North Sweden VIN3 mRNA. N = 6 except where samples were lost to death or degradation (see Materials and methods and Source data 3). Error bars show s.e.m.
Figure 3—figure supplement 2
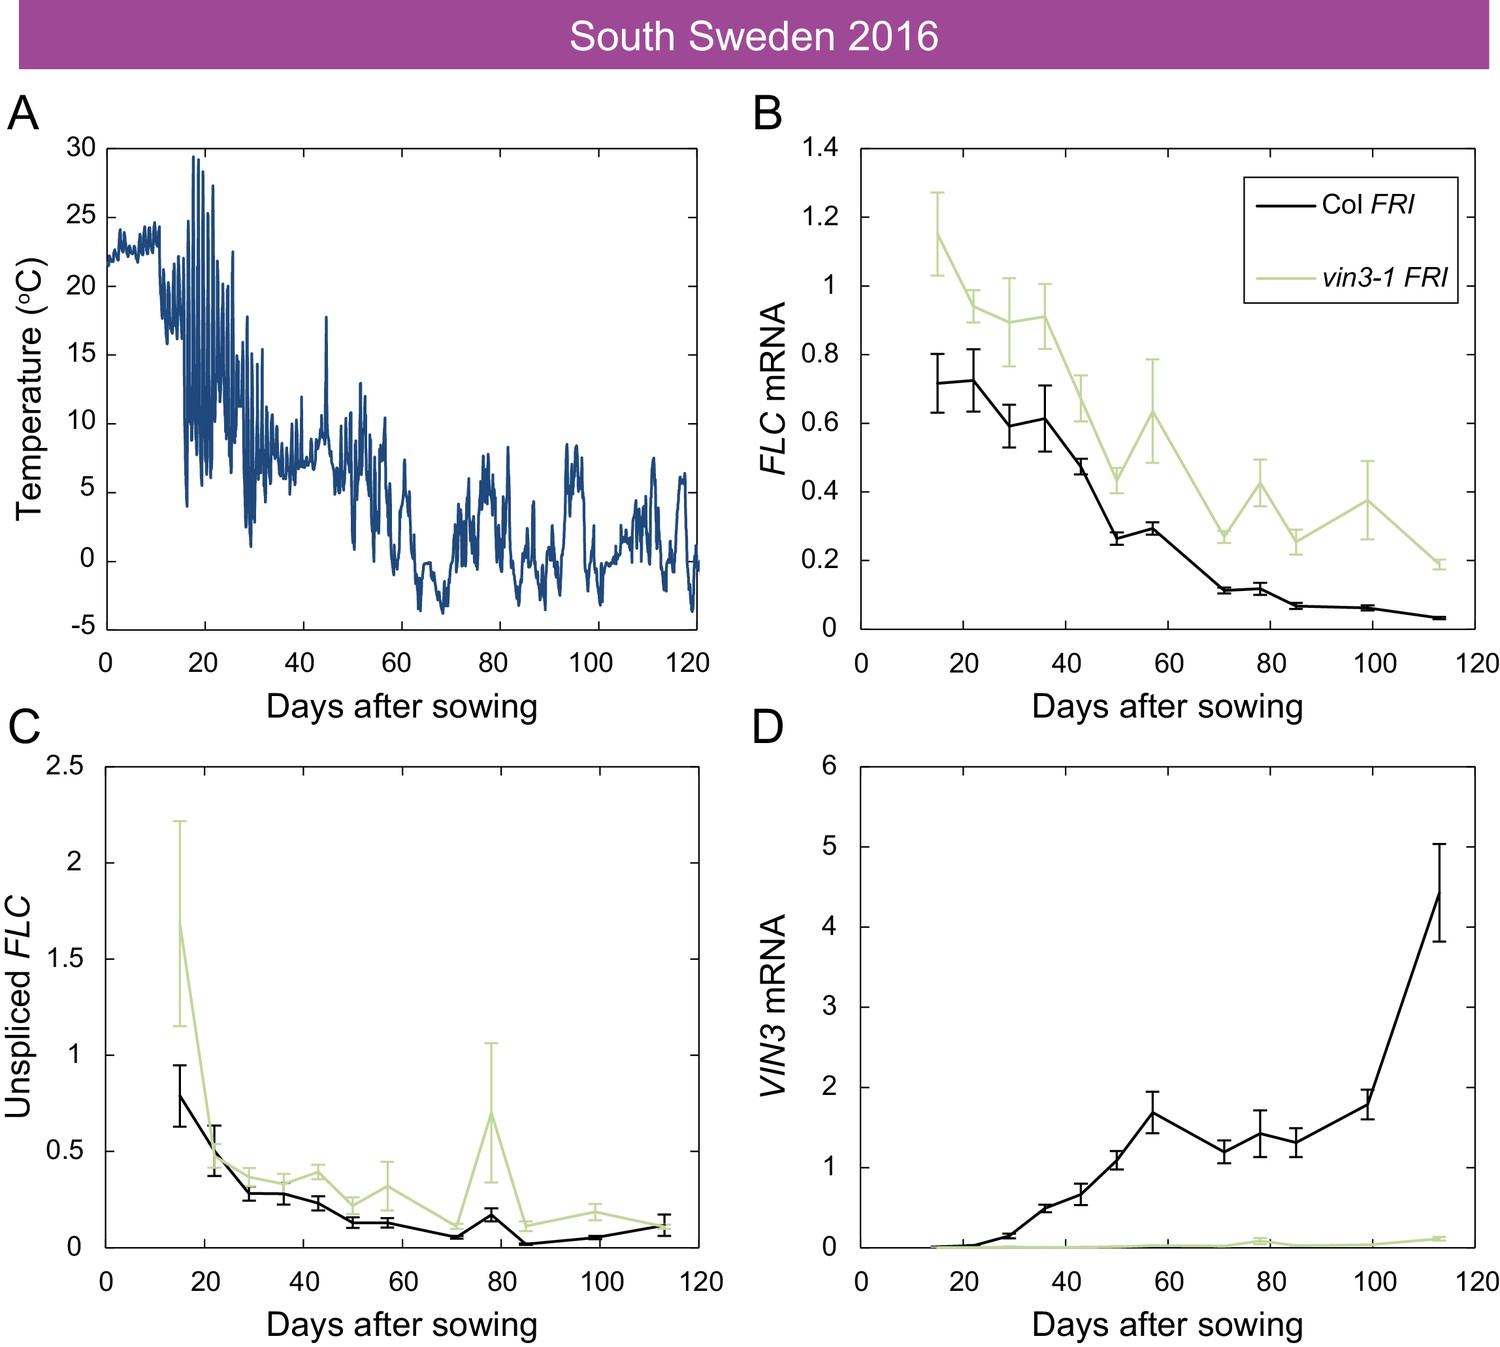
Downregulation of FLC and upregulation of VIN3 in South Sweden in 2016.
(A) Hourly temperature readings from plant level in South Sweden 2016. (B) FLC mRNA levels in the Col FRI and vin3-1 FRI accessions over autumn, with vin3-1 showing less repression, especially later in the season. (C) Unspliced FLC levels. (D) VIN3 mRNA levels, with vin3-1 FRI showing no induction. Expression normalised to control sample for 2016–7 (see Materials and methods). N = 6 except where samples were lost to death or degradation (see Materials and methods and Source data 3). Error bars show s.e.m.
Figure 3—figure supplement 3
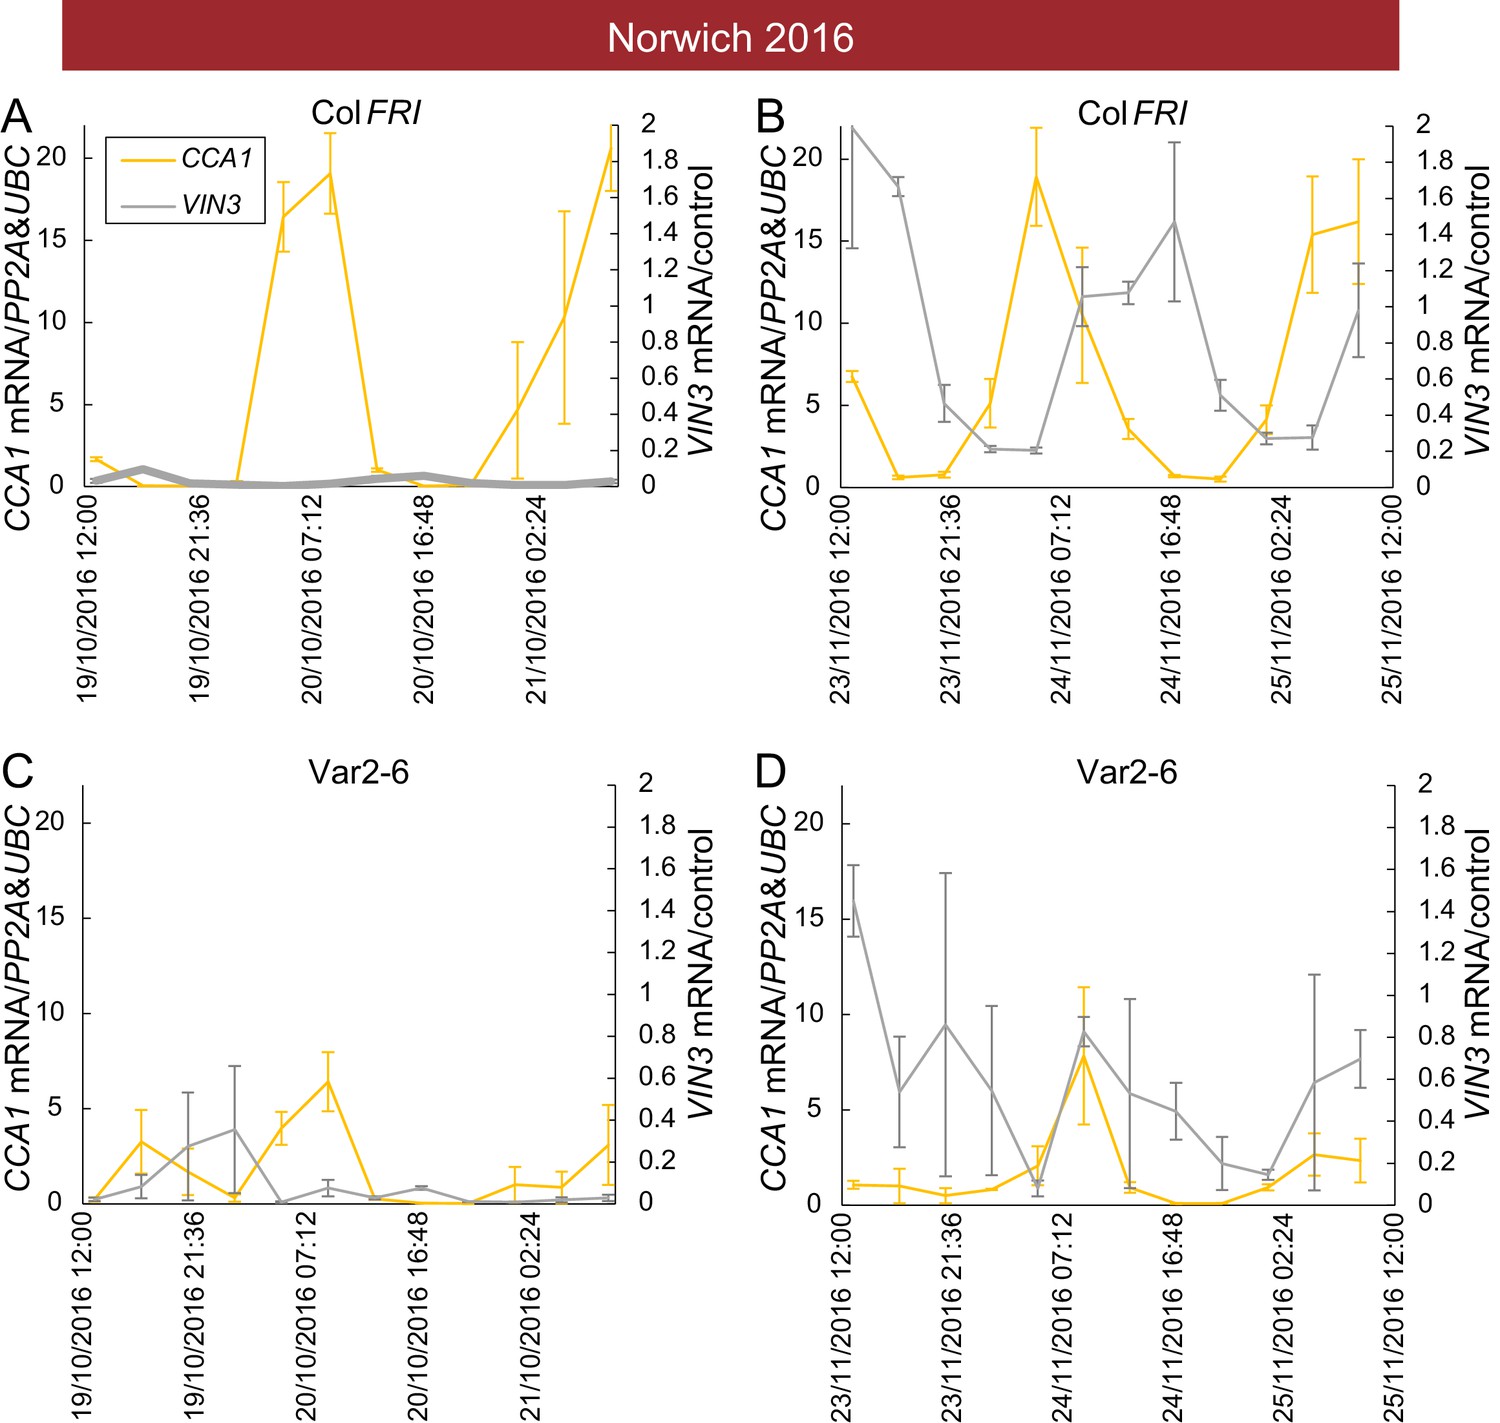
Low VIN3 upregulation in Var2-6 is correlated with perturbation of the circadian clock.
VIN3 and CCA1 expression measured over 48 hr in the field glasshouse in Norwich in 2016 in Col FRI and the Var2-6 accession. CCA1 shows a circadian pattern throughout autumn in Col FRI, as does VIN3 when it is upregulated later in the year. In Var2-6, CCA1 expression is low, as is VIN3 expression later in the year. (A) Expression in Col FRI in October. (B) Expression in Col FRI in November. (C) Expression in Var2-6 in October. (D) Expression in Var2-6 in November. N = 3, Source data 3. Error bars show s.e.m.
Figure 4 with 2 supplements
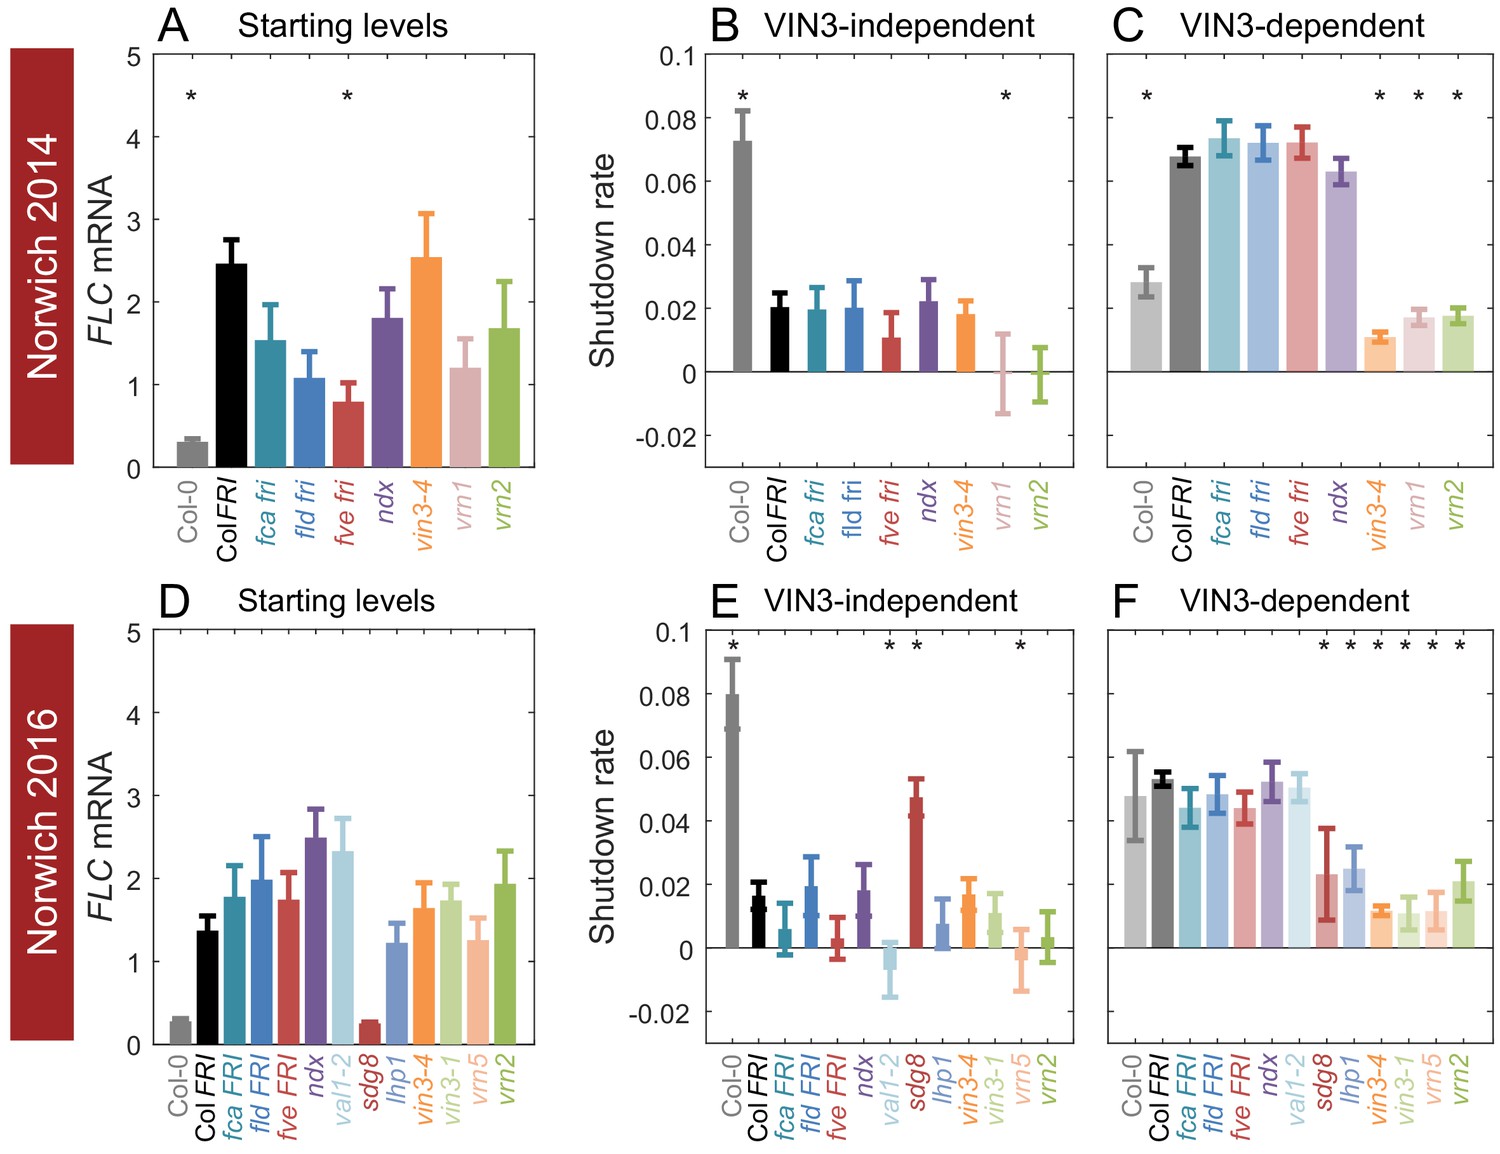
Starting levels and rates of downregulation of FLC in mutants and transgenics in field conditions in Norwich, UK.
(A–F) FLC downregulation analysed as level at first time point (Starting levels, A, D), rate of downregulation before induction of VIN3 expression (VIN3-independent, dark bars, B, E) and rate of downregulation after VIN3 induction (VIN3-dependent, translucent bars, C, F). Features of genotypes that are significantly different to the reference line Col FRI are indicated by * (for Starting levels, ANOVA with Dunnett’s post-hoc test, for Shutdown rates, Satterthwaite’s t-tests on REML Linear mixed model). p-values for all comparisons are given in Supplementary file 1. Rates of downregulation are given in units of ‘a.u. per day’, where the arbitrary units (a.u.) correspond to the normalised concentration of FLC mRNA. VIN3 induction started at: Norwich 2014, ~58 days, see (Figure 4—figure supplement 1); Norwich 2016, ~48 days, see (Figure 4—figure supplement 2). All mutants are in the Col FRI background unless otherwise stated. Expression data were normalised to the corresponding control sample (for 2014–5 or 2016–7, see Materials and methods). N = 6 except where samples were lost to death or degradation (see Materials and methods and Source data 2 and 3). Error bars show s.e.
Figure 4—figure supplement 1
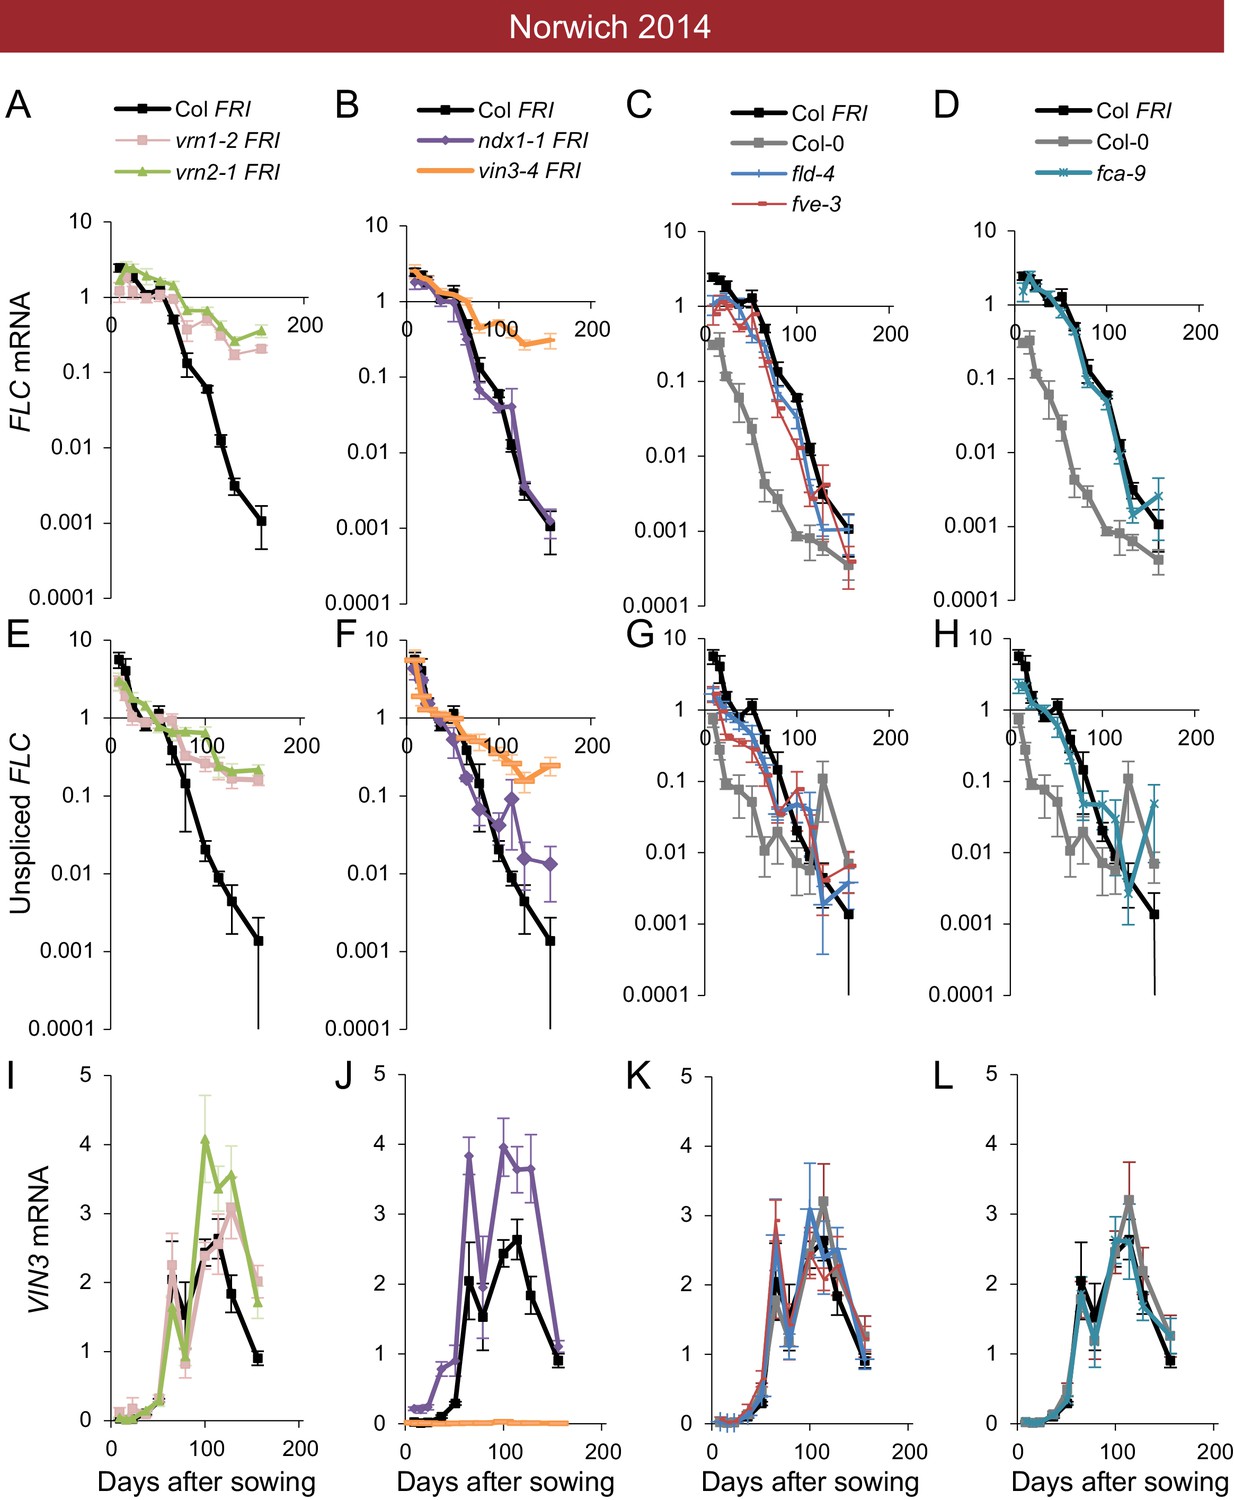
Expression of FLC and VIN3 in all mutants in the field in Norwich 2014–2015.
Expression normalised to control sample for 2014–5 (see Materials and methods). (A–D) FLC mRNA, (E–H) unspliced FLC transcript, (I–L) VIN3 mRNA. N = 6 except where samples were lost to death or degradation (see Materials and methods and Source data 2). Error bars show s.e.m.
Figure 4—figure supplement 2
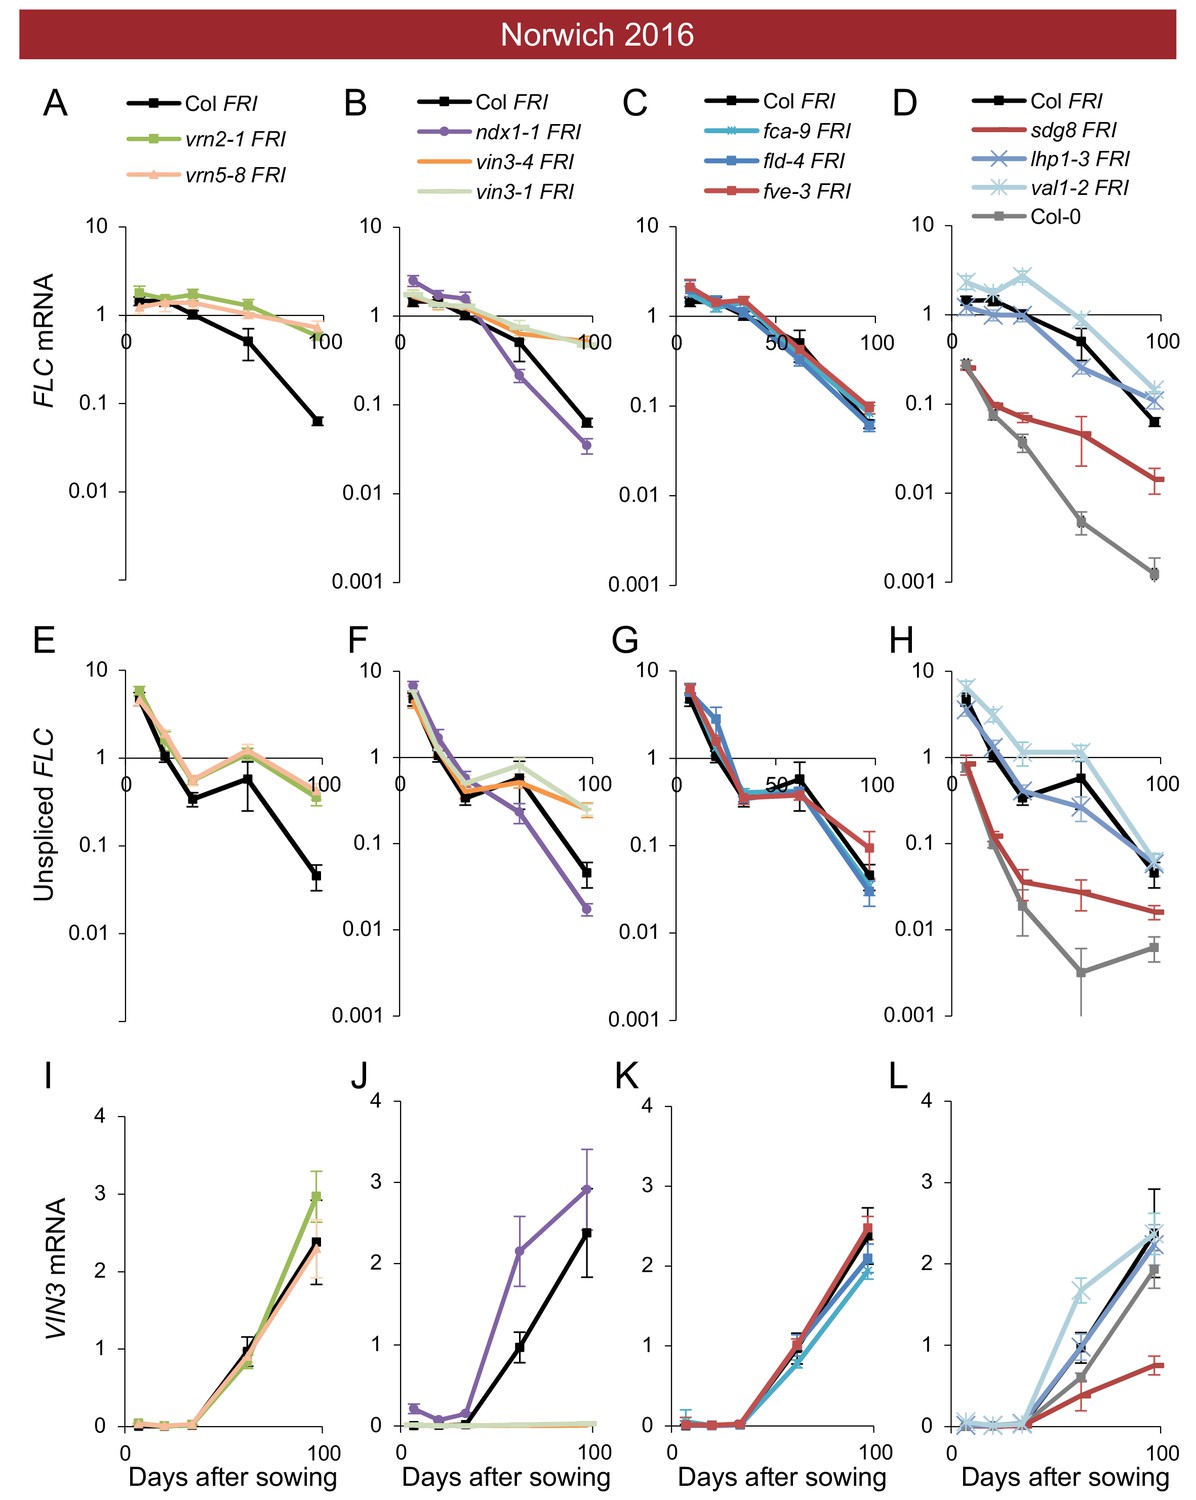
Expression of FLC and VIN3 in all mutants in the field in Norwich 2016–2017.
Expression normalised to control sample for 2016–7 (see Materials and methods). (A–D) FLC mRNA, (E–H) unspliced FLC transcript, (I–L) VIN3 mRNA. N = 6 except where samples were lost to death or degradation (see Materials and methods and Source data 2). Error bars show s.e.m.
Figure 5
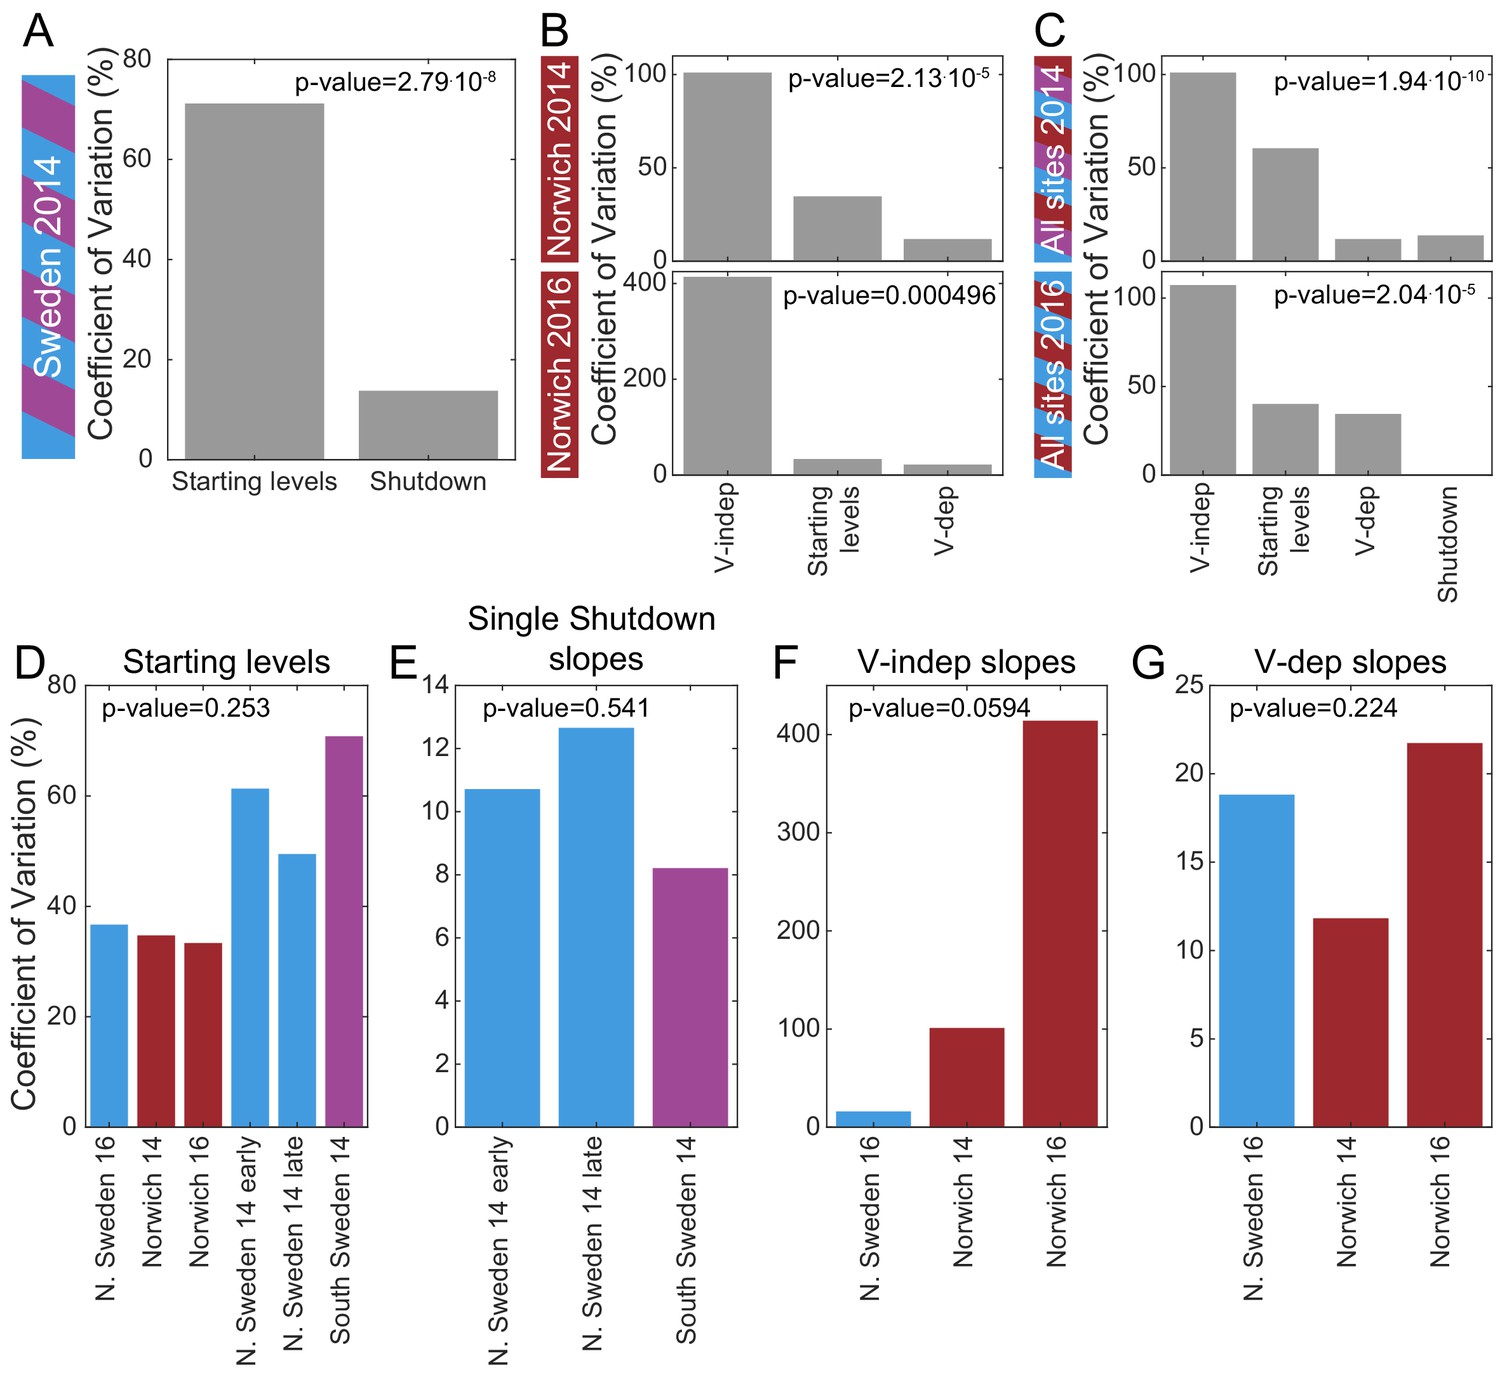
Mechanistic sources of natural variation in FLC levels across sites and years.
(A) The coefficient of variation for the rates of shutdown and for the starting levels in all Sweden experiments in the first year. (B) Similarly in Norwich 2014 (top) and 2016 (bottom) but separately for the VIN3-independent (V-indep) and VIN3-dependent (V-dep) shutdown rates. (C) Comparison of the variability of the starting levels and the shutdown rates, separating V-dep and V-indep where appropriate, combining data from all sites in 2014 (top) and 2016 (bottom). ‘Shutdown’ refers to the combined V-dep/V-indep shutdown rate that was fitted in Sweden 2014, and so is not present in the 2016 results. (D) The coefficients of variation of the starting levels for each site/year. (E) The coefficients of variation of the single shutdown rates for the different plantings and sites in Sweden in 2014. (F–G) Similarly, for Sweden 2016 and Norwich in both years, separating the V-indep rates (F) and V-dep (G). Data from Source data 2 and 3.
Figure 6 with 7 supplements
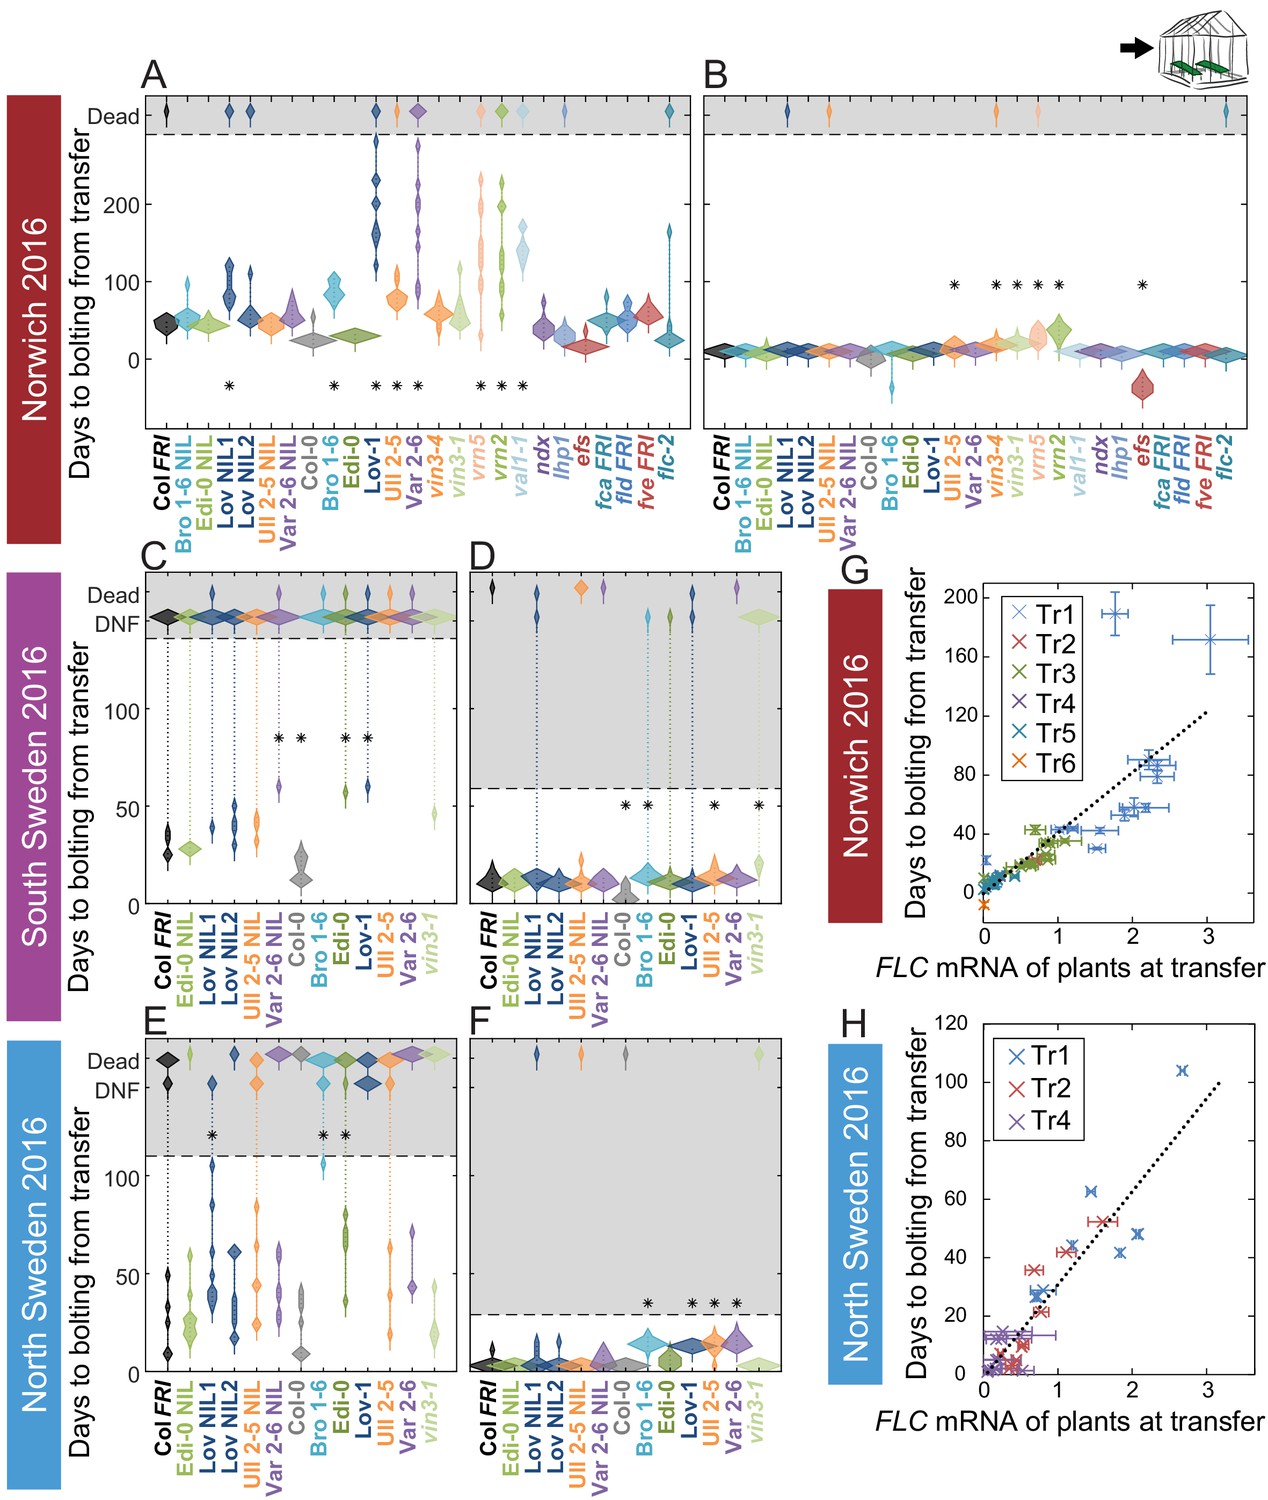
Vernalization requirement for FLC downregulation is saturated in natural winters.
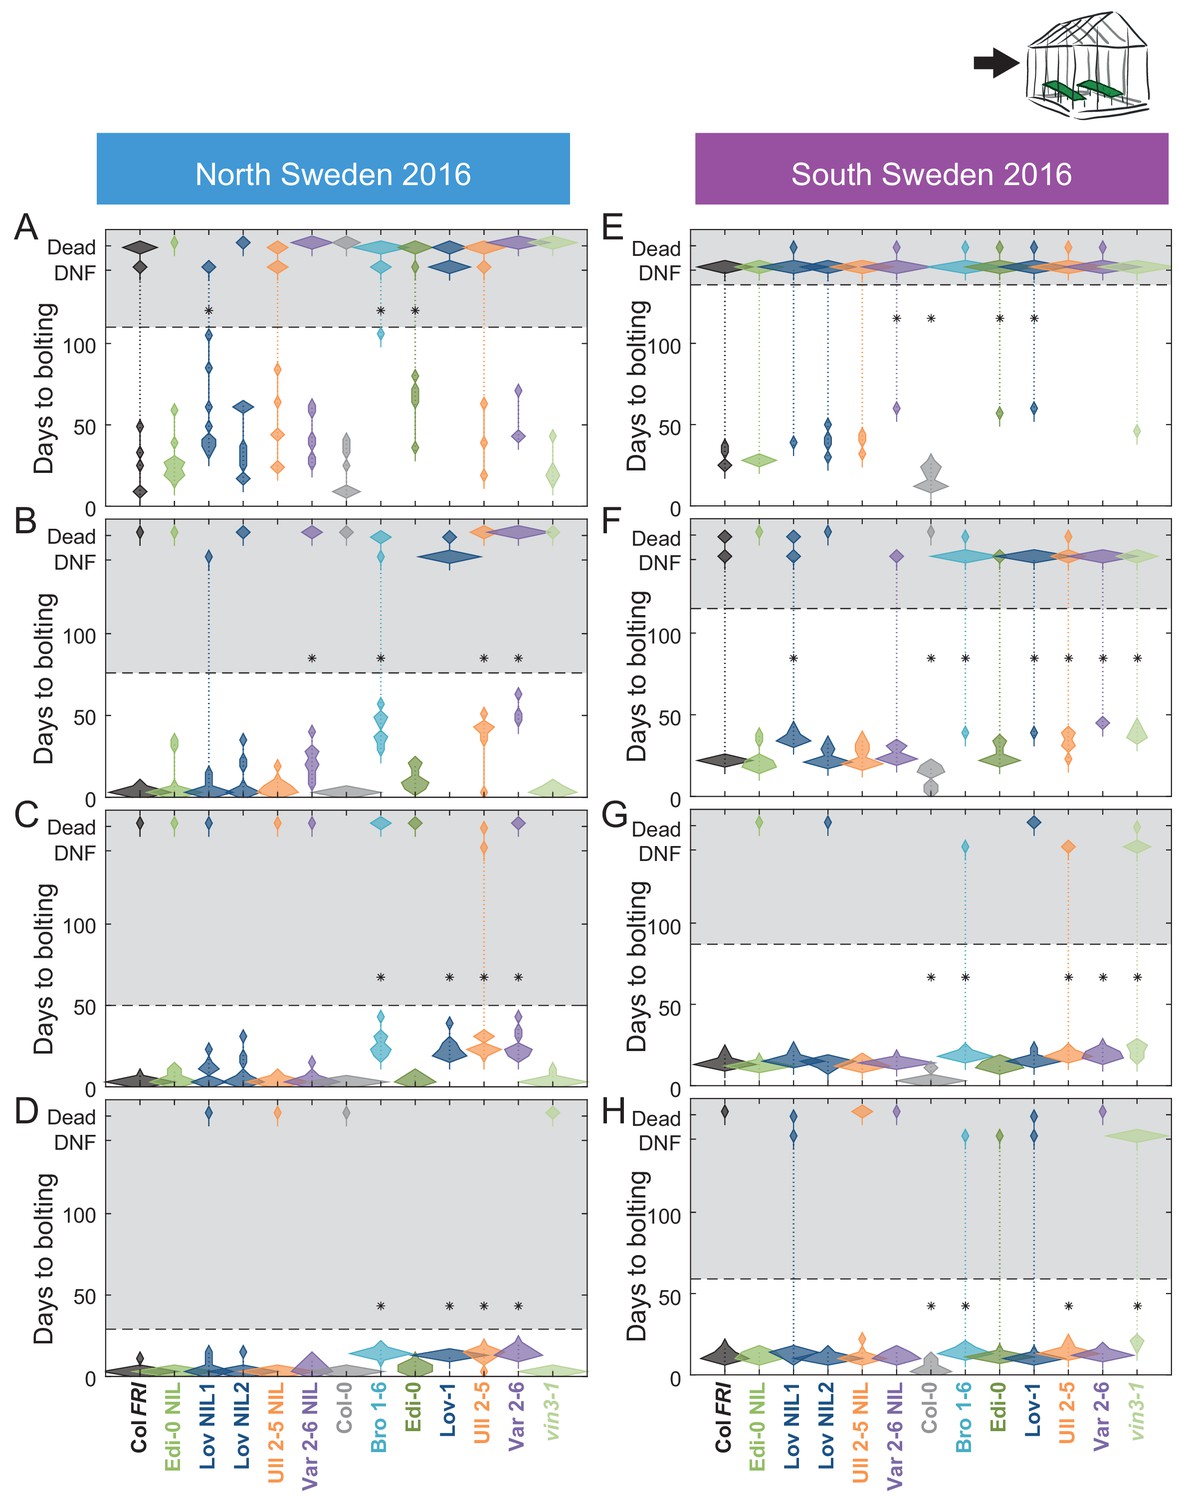
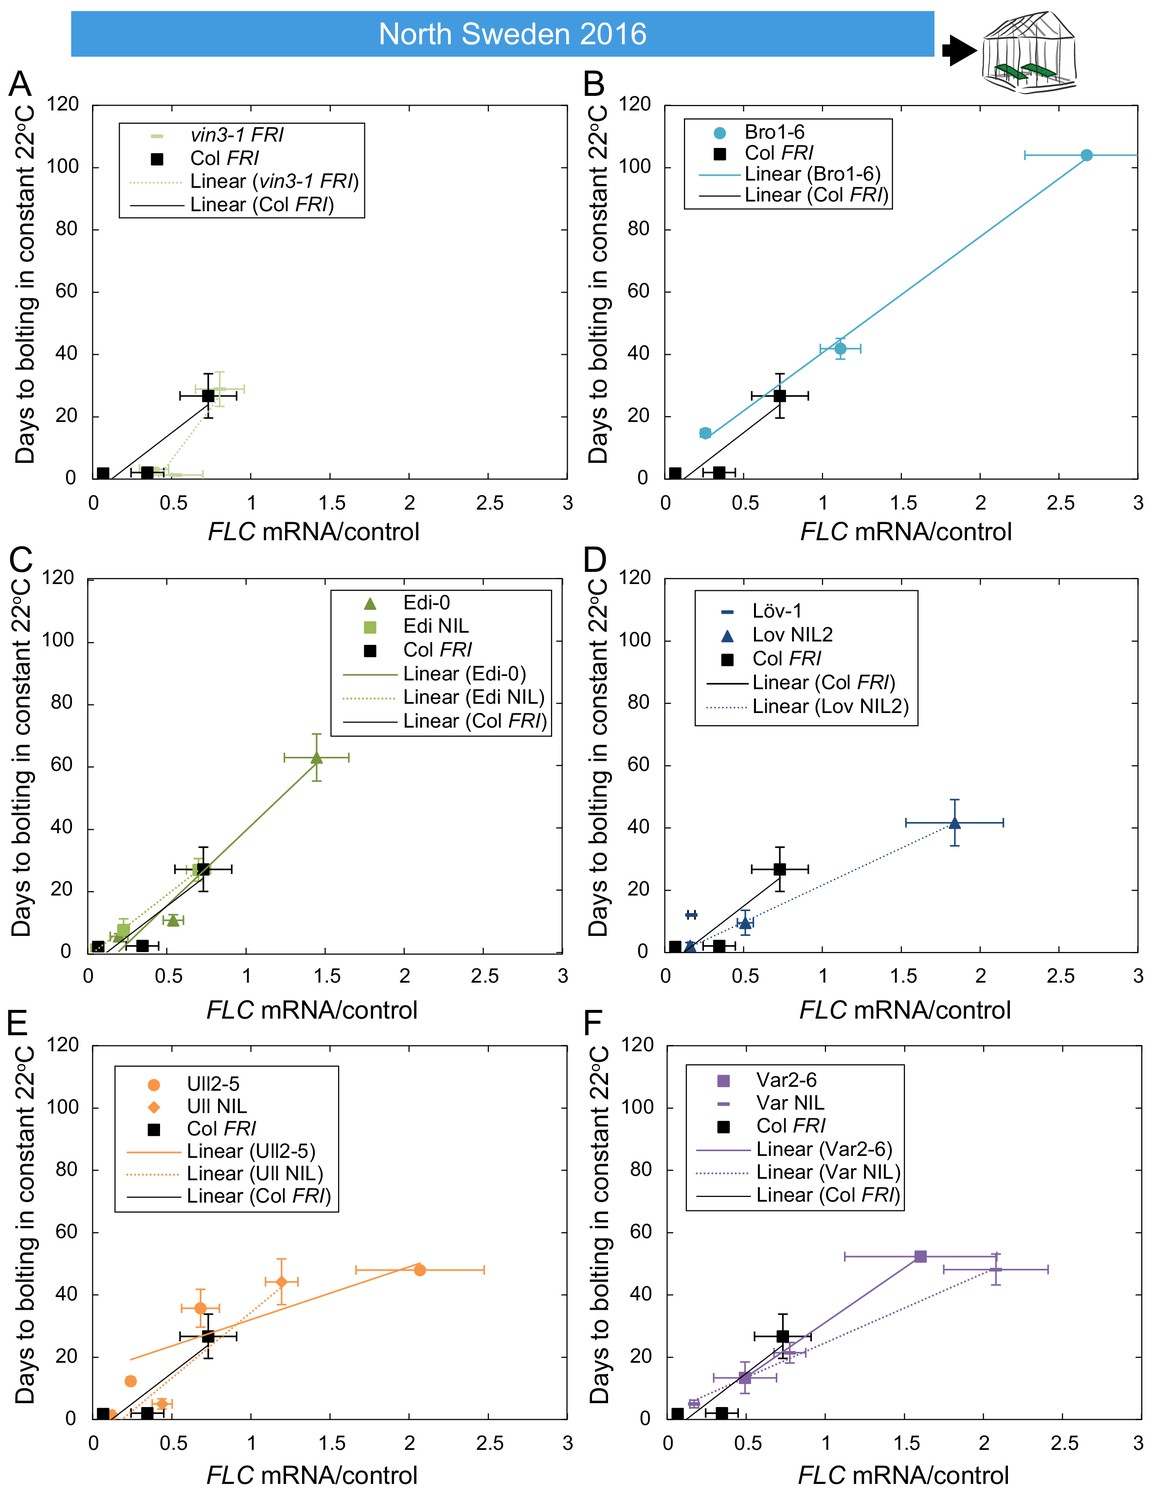
(A–F) Bolting time for accessions and NILs after transfer to floral-induction conditions from ‘natural’ winter 2016–7, in (A) Norwich 21/10/16 (B) Norwich 21/12/16 (C) South Sweden 01/10/2016 (D) South Sweden 17/12/16 (E) North Sweden 06/09/2016 (F) North Sweden 24/11/2016. Plants that did not flower by 14/02/17 (C, D) or 23/12/16 (E, F) are shown as DNF and dead plants are indicated. Plots show the histogram of numbers of plants as the width of violin plots. A line connects the measurements to indicate the range. Flowering time of genotypes that are significantly different to the reference line Col FRI are indicated by * (ANOVA with Dunnett’s post-hoc test). p-values for all comparisons are given in Supplementary file 3. (G–H) North Sweden 2016 transfers for accessions and NILs, (G) mean time to bolting after transfer to floral-inductive conditions plotted against mean FLC expression per genotype at transfer, Norwich 2016–7, linear regression R2 = 0.68, p<0.001. (H) Mean time to bolting after transfer to floral-inductive conditions plotted against mean FLC expression per genotype at transfer, North Sweden 2016–7. Genotypes that did not bolt within 205 days not shown, linear regression R2 = 0.85, p<0.001. N = 12 plants except where plants died or (E, H) did not bolt within 205 days (Source data 5). Error bars for G and H show s.e.m.
Figure 6—figure supplement 1
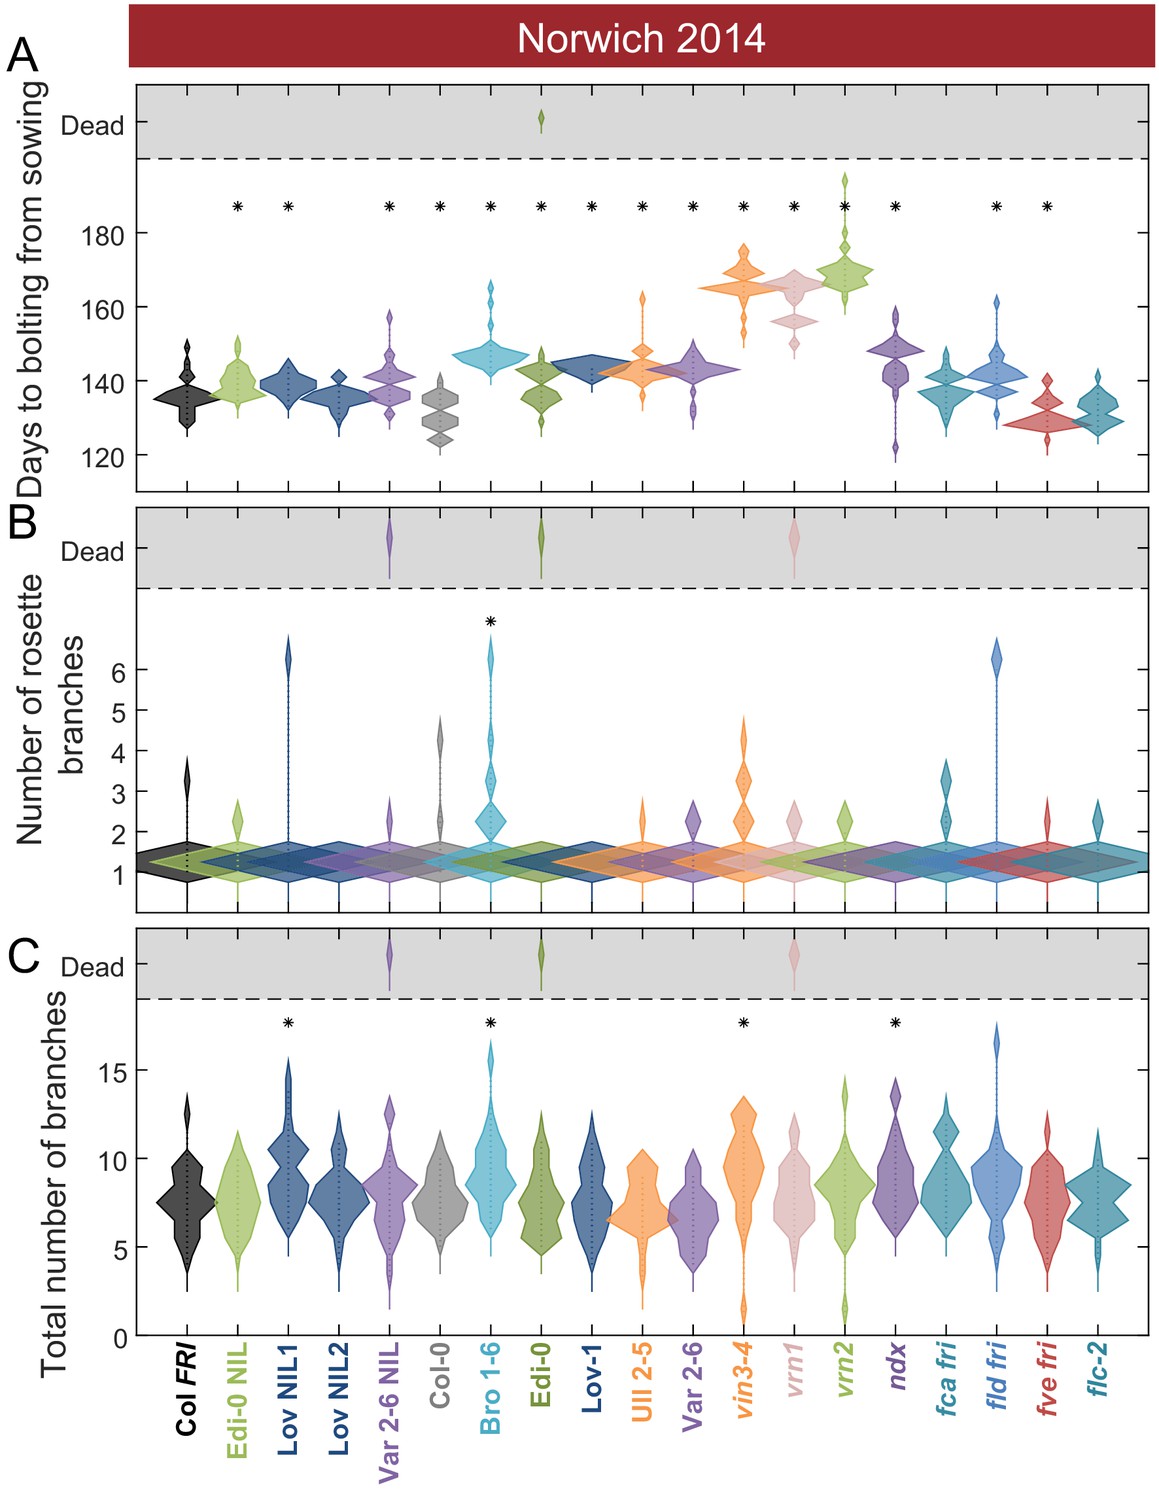
Flowering after winter in Norwich 2014–5 in the field was largely synchronous.
(A) Time to bolting for each genotype in the ‘field’ glasshouse in Norwich 2014–5 experiment. (B) Number of rosette branches for plants shown in A. (C) Number of rosette and cauline branches for plants shown in A. Plots A-C show the histogram of numbers of plants as the width of violin plots. A line connects the measurements to indicate the range. N = 36, except where plants did not germinate, Source data 4. Features of genotypes that are significantly different to the reference line Col FRI are indicated by * (ANOVA with Dunnett’s post-hoc). p-values for all comparisons are given in Supplementary file 3.
Figure 6—figure supplement 2
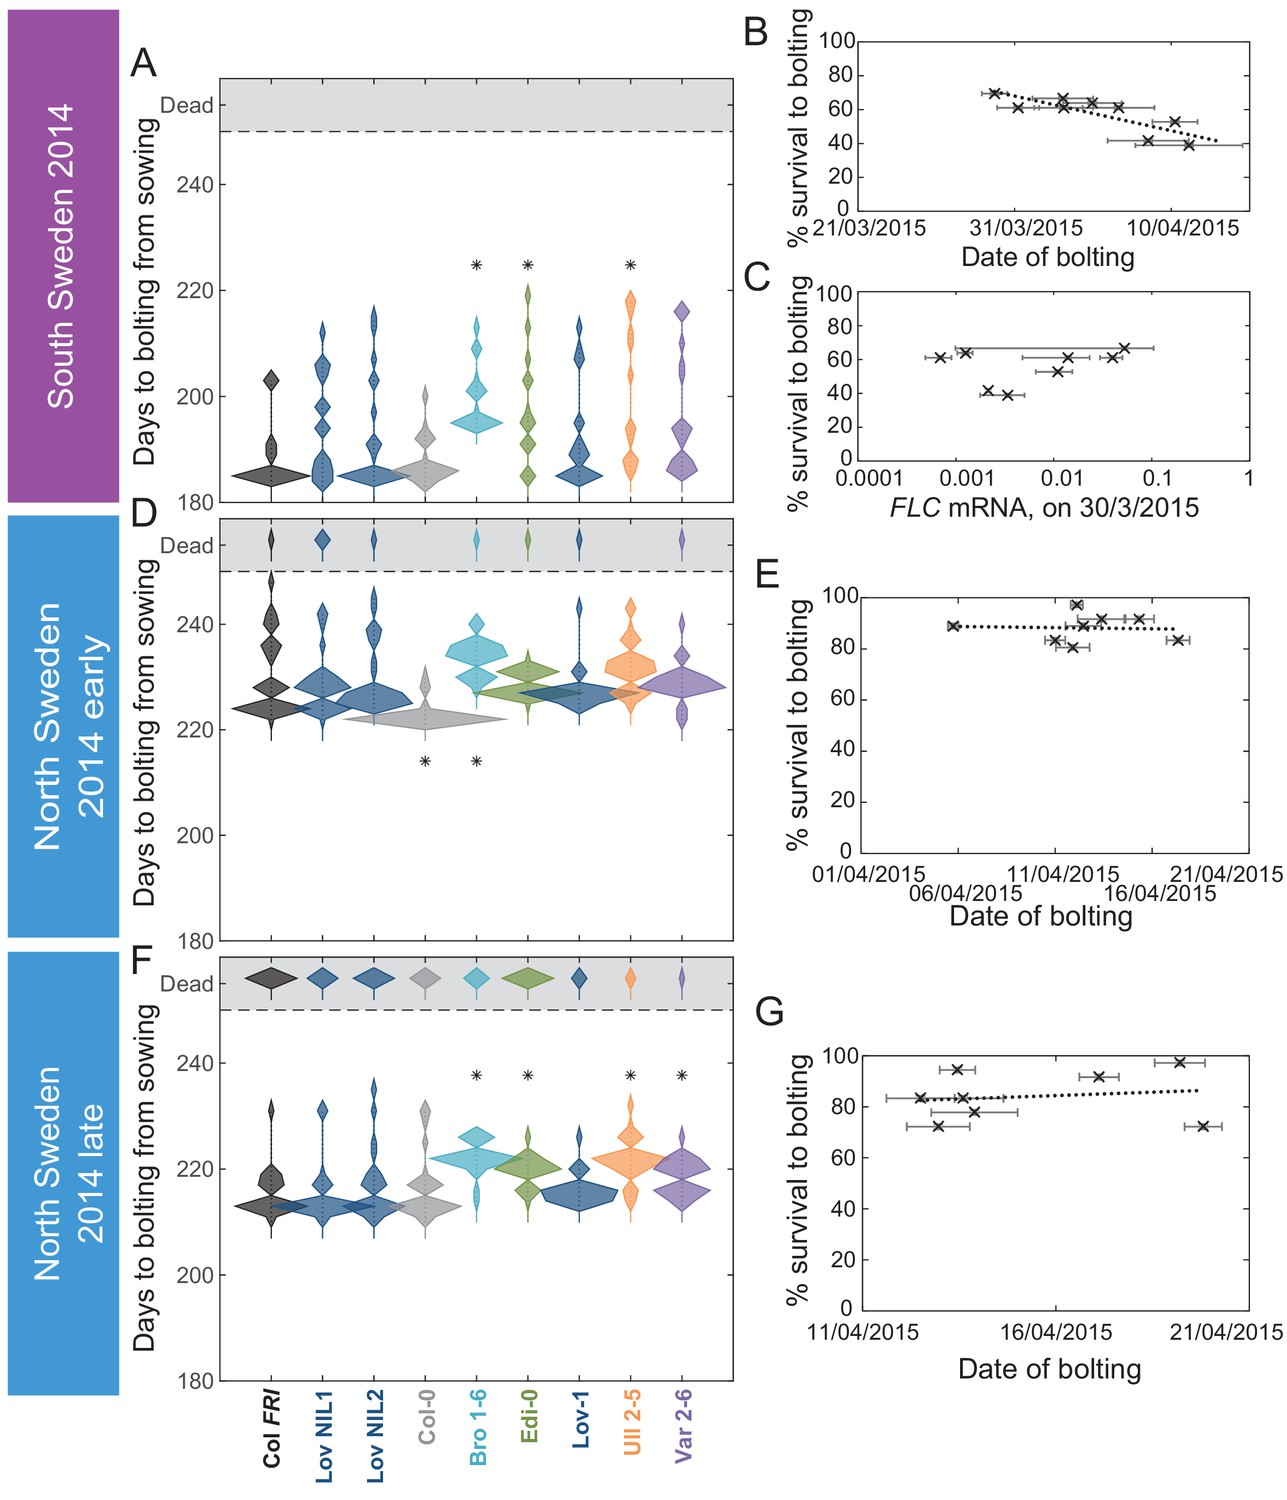
The transition to flowering after natural winters in South and North Sweden 2014–5 in the field was largely synchronous, while later bolting had a negative effect on survival only in South Sweden.
(A, D, F) Time to bolting for each genotype, showing the histogram of numbers of plants as the width of violin plots. A line connects the measurements to indicate the range. Flowering time of genotypes that are significantly different to the reference line Col FRI are indicated by * (ANOVA with Dunnett’s post-hoc). p-values for all comparisons are given in Supplementary file 3. (B, E, G) Percentage of germinated plants of each genotype surviving to date of bolting, plotted against the mean date of bolting for that genotype. (B) South Sweden, Generalised Linear Models (GLMs) for binomial distribution, survival vs. date of bolting, p=0.0416. (C) South Sweden, percentage survival vs. mean FLC mRNA per genotype (normalised to control sample for 2014–5) on 30th March, GLM for binomial distribution, ns. (E, G) GLM for binomial distribution, ns. N = 36, except where plants died before flowering, Source data 4. Error bars on scatter plots show s.e.m.
Figure 6—figure supplement 3
Bolting after transfer to warm, long-day conditions from winter in the field 2016–7 saturates at different rates in different genotypes in Sweden.
Bolting time from sequential transfers to long-day warm conditions from the field, for each genotype and transfer. Plots show the histogram of numbers of plants as the width of violin plots. A line connects the measurements to indicate the range. Flowering time of genotypes that are significantly different to the reference line Col FRI are indicated by * (ANOVA with Dunnett’s post-hoc). p-values for all comparisons are given in Supplementary file 3. (A–D) North Sweden, transfer dates: 06/09/2016, 04/10/2016, 01/11/2016, 24/11/2016, experiment ended on 23/12/16. (E–H) South Sweden, transfer dates: 01/10/2016, 22/10/2016, 19/11/2016, 17/12/2016, experiment ended on 14/02/17. N = 12, except where plants died before flowering, Source data 5.
Figure 6—figure supplement 4
Bolting after transfer to warm, long-day conditions from winter in the field 2016–7 saturates at different rates in Norwich.
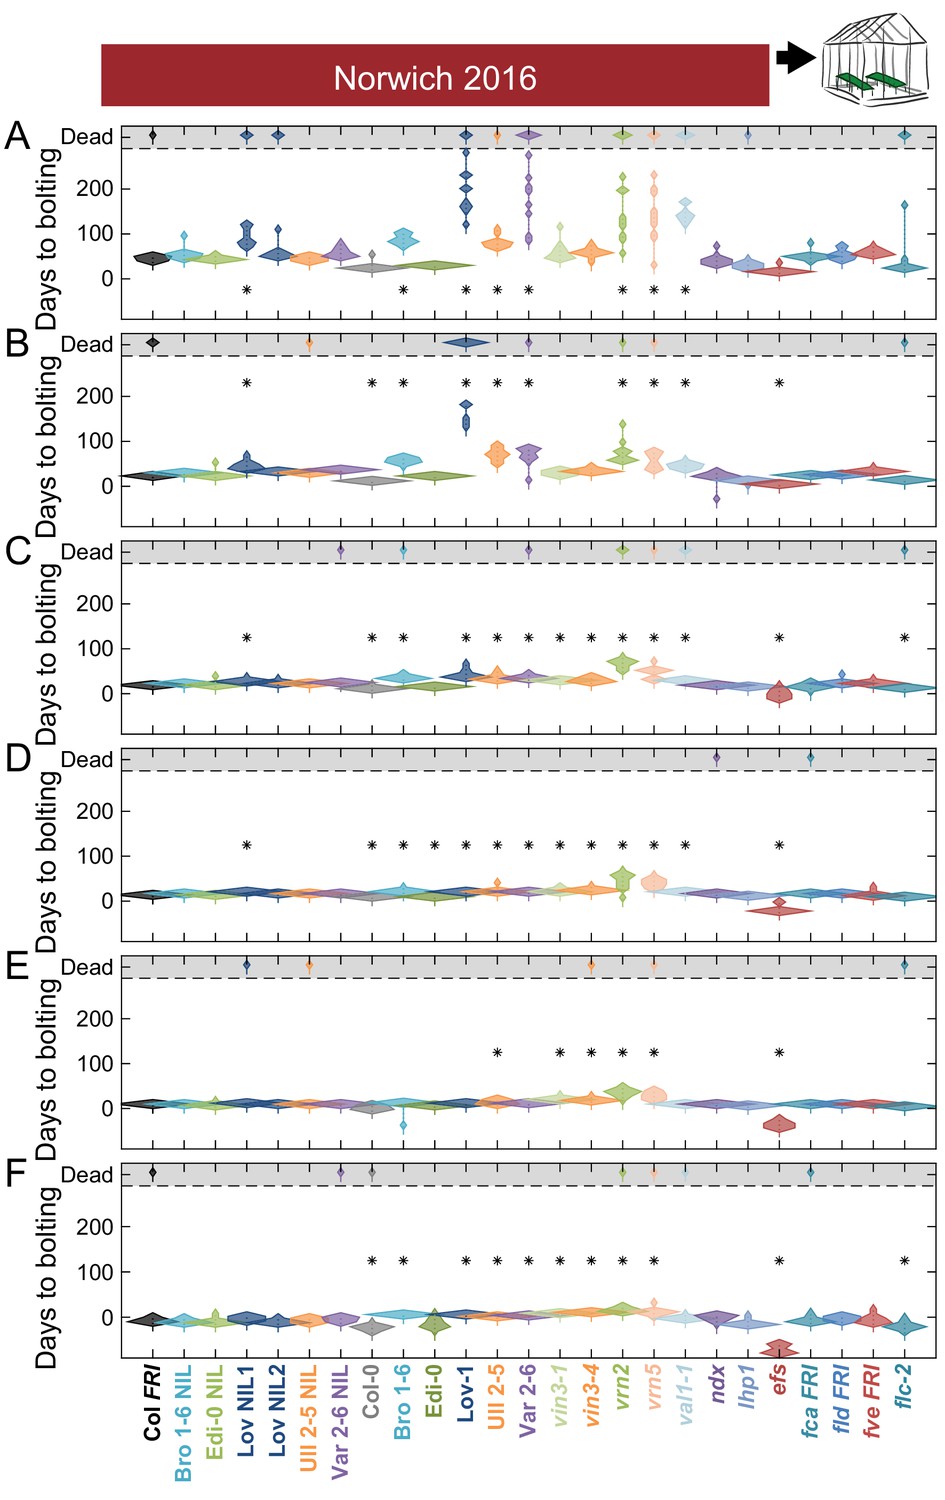
Bolting from sequential transfers to long-day warm conditions from the field, for each genotype and transfer. The experiment was run until all plants died. Plots show the histogram of numbers of plants as the width of violin plots. A line connects the measurements to indicate the range. Flowering time of genotypes that are significantly different to the reference line Col FRI are indicated by * (ANOVA with Dunnett’s post-hoc). p-values for all comparisons are given in Supplementary file 3. Transfers dates are (A) 21/10/2016, (B) 03/11/2016, (C) 17/11/2016, (D) 30/11/2016, (E) 21/12/2016, (F) 26/01/2017. N = 12, except where plants died before flowering, Source data 5.
Figure 6—figure supplement 5
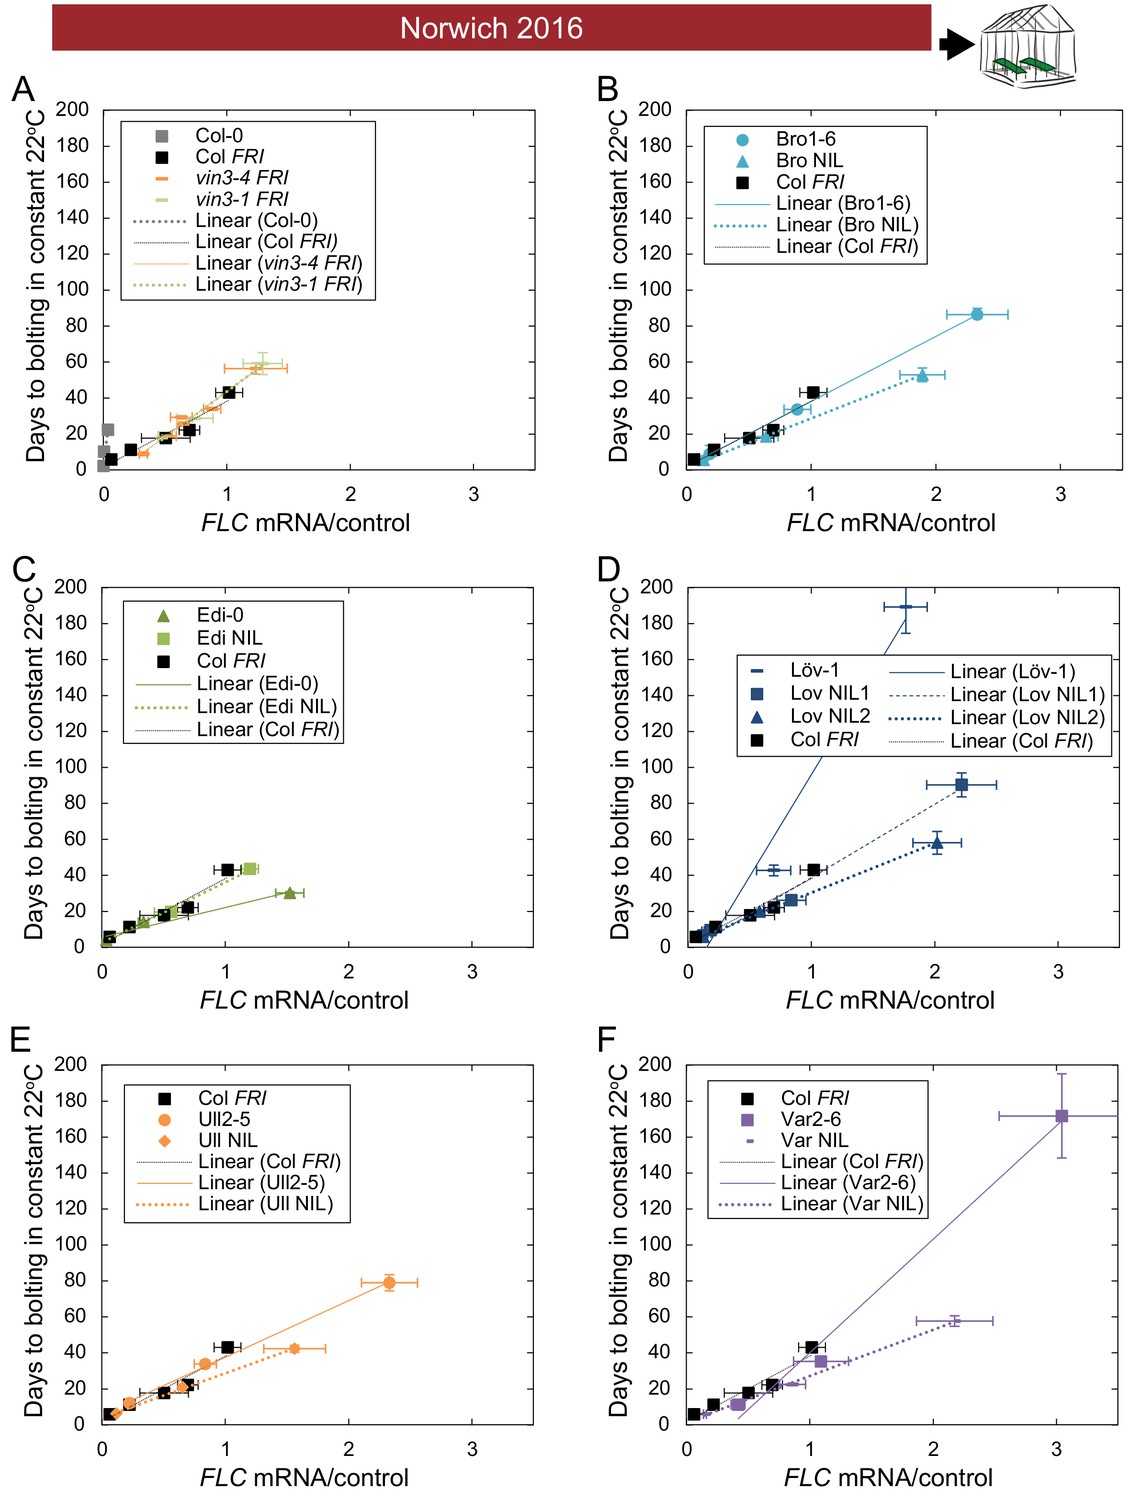
The relationship between time to floral transition and FLC expression at the end of cold (Norwich winter 2016–7) varies among accessions, both due to trans effects and due to the FLC alleles themselves.
(A–F) Mean time to bolting of plants moved to a greenhouse lit for 16 hr, and maintained at 22°C/18°C light/dark, plotted against the mean FLC mRNA expression from plants sampled in the Norwich field condition greenhouse on the day of transfer, with linear regression lines plotted for each genotype (the slope ‘m’ being the ‘post-vern’ value, with the y-intercept being the effect on days to bolt if the plants had no detectable FLC, see Table 1). For all accessions and NILs over 3–6 transfers at different times during the winter, R2 = 0.68 for linear regression, p<0.001. N = 6 for expression data, N = 12 for bolting data, except where plants died, Source data 3 and 5. Error bars show s.e.m.
Figure 6—figure supplement 6
The relationship between time to floral transition and FLC expression at the end of cold in North Sweden winter 2016–7.
Mean time to bolting of plants moved to a greenhouse lit for 16 hr, and maintained at 22°C, plotted against the mean FLC mRNA expression from plants sampled in the North Sweden field on or adjacent to the day of transfer, with linear regression lines plotted for each genotype (the slope ‘m’ being the ‘post-vern’ value, with the y-intercept being the effect on days to bolt if the plants had no detectable FLC, see Table 1). (A–F) For all accessions and NILs over 3–6 transfers at different times during the winter, R2 = 0.68 for linear regression, p<0.001. For D, there is no regression for Löv-1 as no Löv-1 plants from the first two transfers flowered within the 120 days of the experiment. N = 12 for bolting data, except where plants died, Source data 3 and 5. Error bars show s.e.m.
Figure 6—figure supplement 7
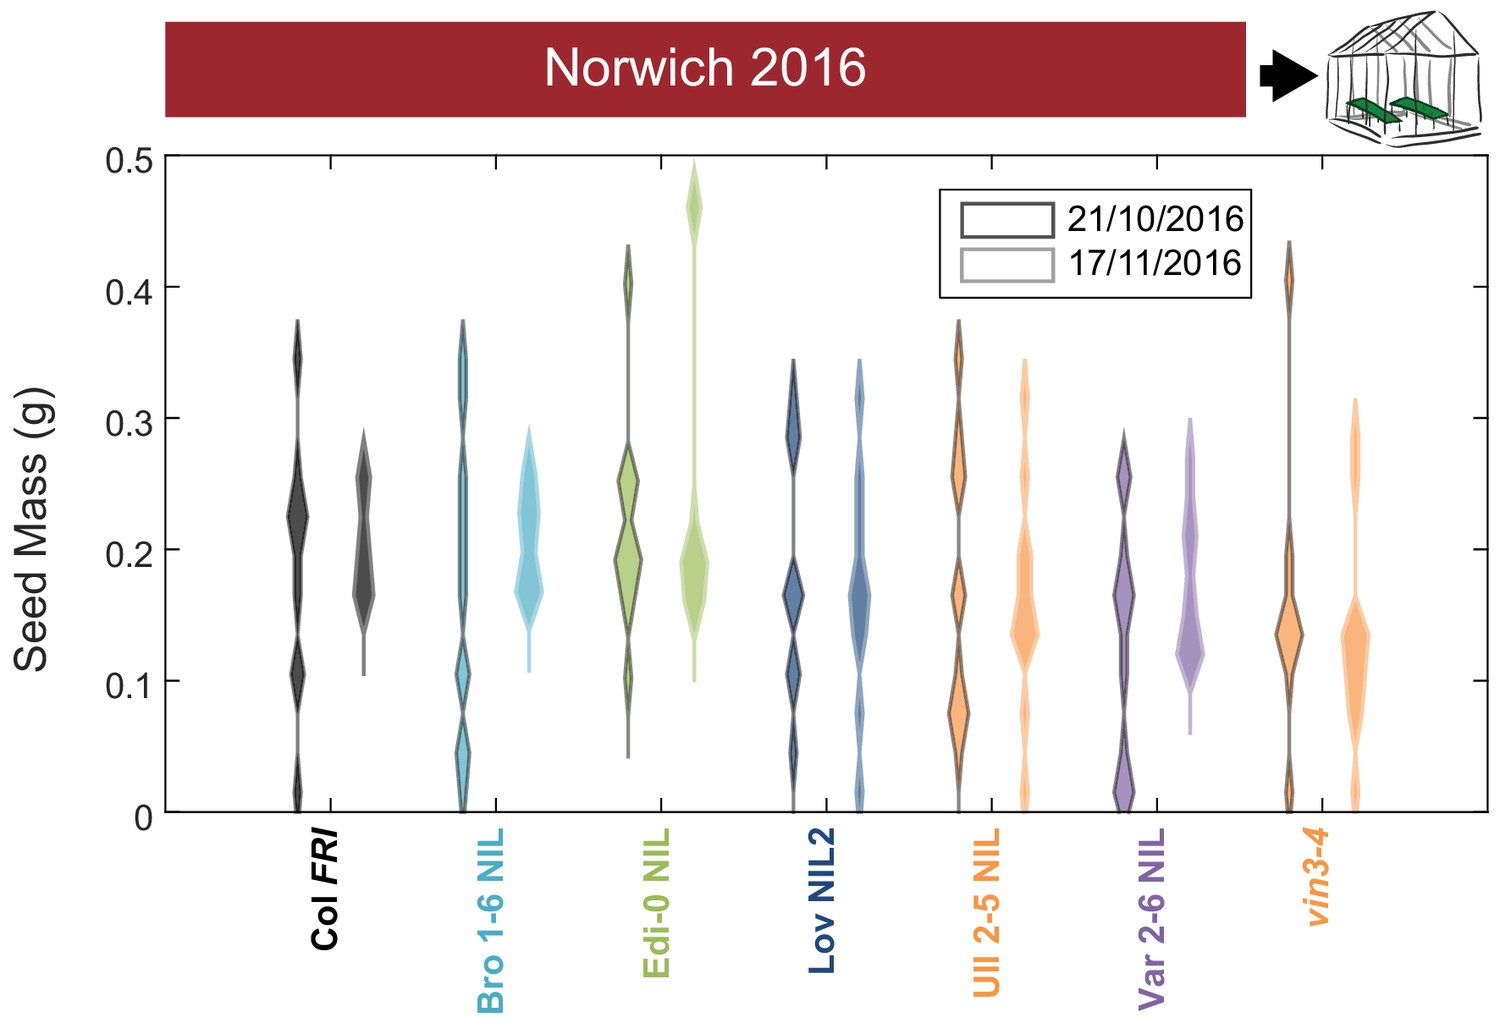
Increased vernalization increases the amount and reduces the variability of seed set.
Total seed mass for Col FRI, NILs and the vin3-4 FRI mutant after transfer to floral-induction conditions from ‘natural’ winter in Norwich 2016–7 on 21/10/16 and 17/11/16 (flowering time in Figure 6—figure supplement 4A, C). Plots show the histogram of numbers of plants as the width of violin plots. The time to bolt per plant negatively correlated with seed mass produced, p<0.001, Kenward-Roger’s t-test on REML Linear mixed model with date of transfer as a random factor. N = 12 for transfer 21/10/2016, N = 8–12, mode = 12 for transfer 17/11/2015 due to losses, see Source data 5.
Figure 7 with 2 supplements
High FLC reduces precocious bolting in North Sweden in warm years.
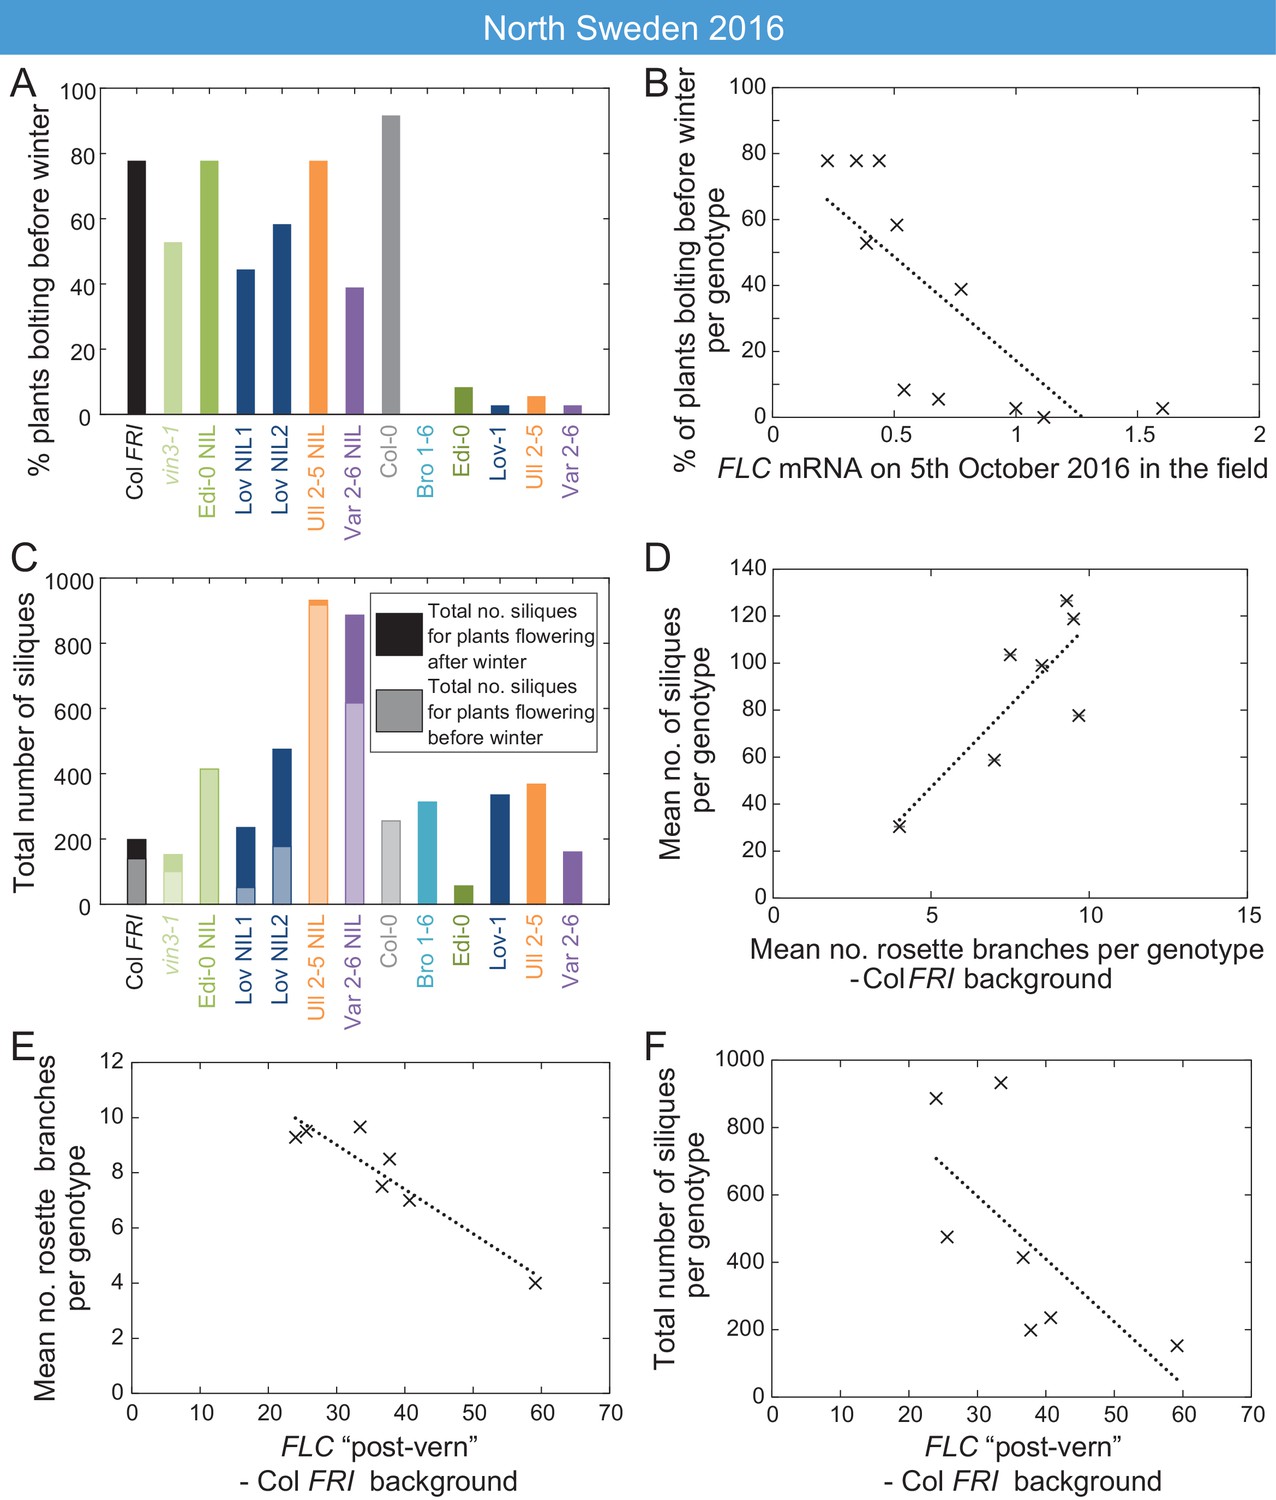
(A) Percentage of plants bolting before winter in the North Sweden 2016 experiment by genotype. Plants in the field were less likely to flower precociously before winter (18th November 2016) if they are accessions from more northerly latitudes or, to a lesser degree, if they are FLC introgression lines containing FLC haplotypes from SV accessions. (B) The percentage of plants transitioning to flowering before winter per genotype negatively correlated with FLC expression (normalised to control) on 5th October (R2 = 0.59, p=0.0058). (C) Total number of siliques produced per genotype, showing contribution from plants that bolted before winter and plants that bolted after. Within the Col FRI genetic background there was no overall penalty in average silique number for surviving plants bolting before vs. after winter (92 and 77 per plant respectively, not significant in Mann-Whitney U test). (D) Mean silique production in plants surviving to set seed positively correlated to their mean rosette branch production for Col FRI genetic background genotypes (NILs and vin3-4; R2 = 0.56, p-value=0.002). (E) Rosette branch production of Col FRI genotypes surviving to set seed is strongly negatively correlated with the FLC post-vern value for that genotype as from Table 1 (R2 = 0.86, p-value<0.002). (F) Total number of siliques produced by Col FRI background genotypes plotted against FLC post-vern, linear regression for post-vern effect alone, R2 = 0.35, p-value=0.1. N = 36 plants sown (A–C), n for surviving plants (D–F) varies per genotype, see Source data 6.
Figure 7—figure supplement 1
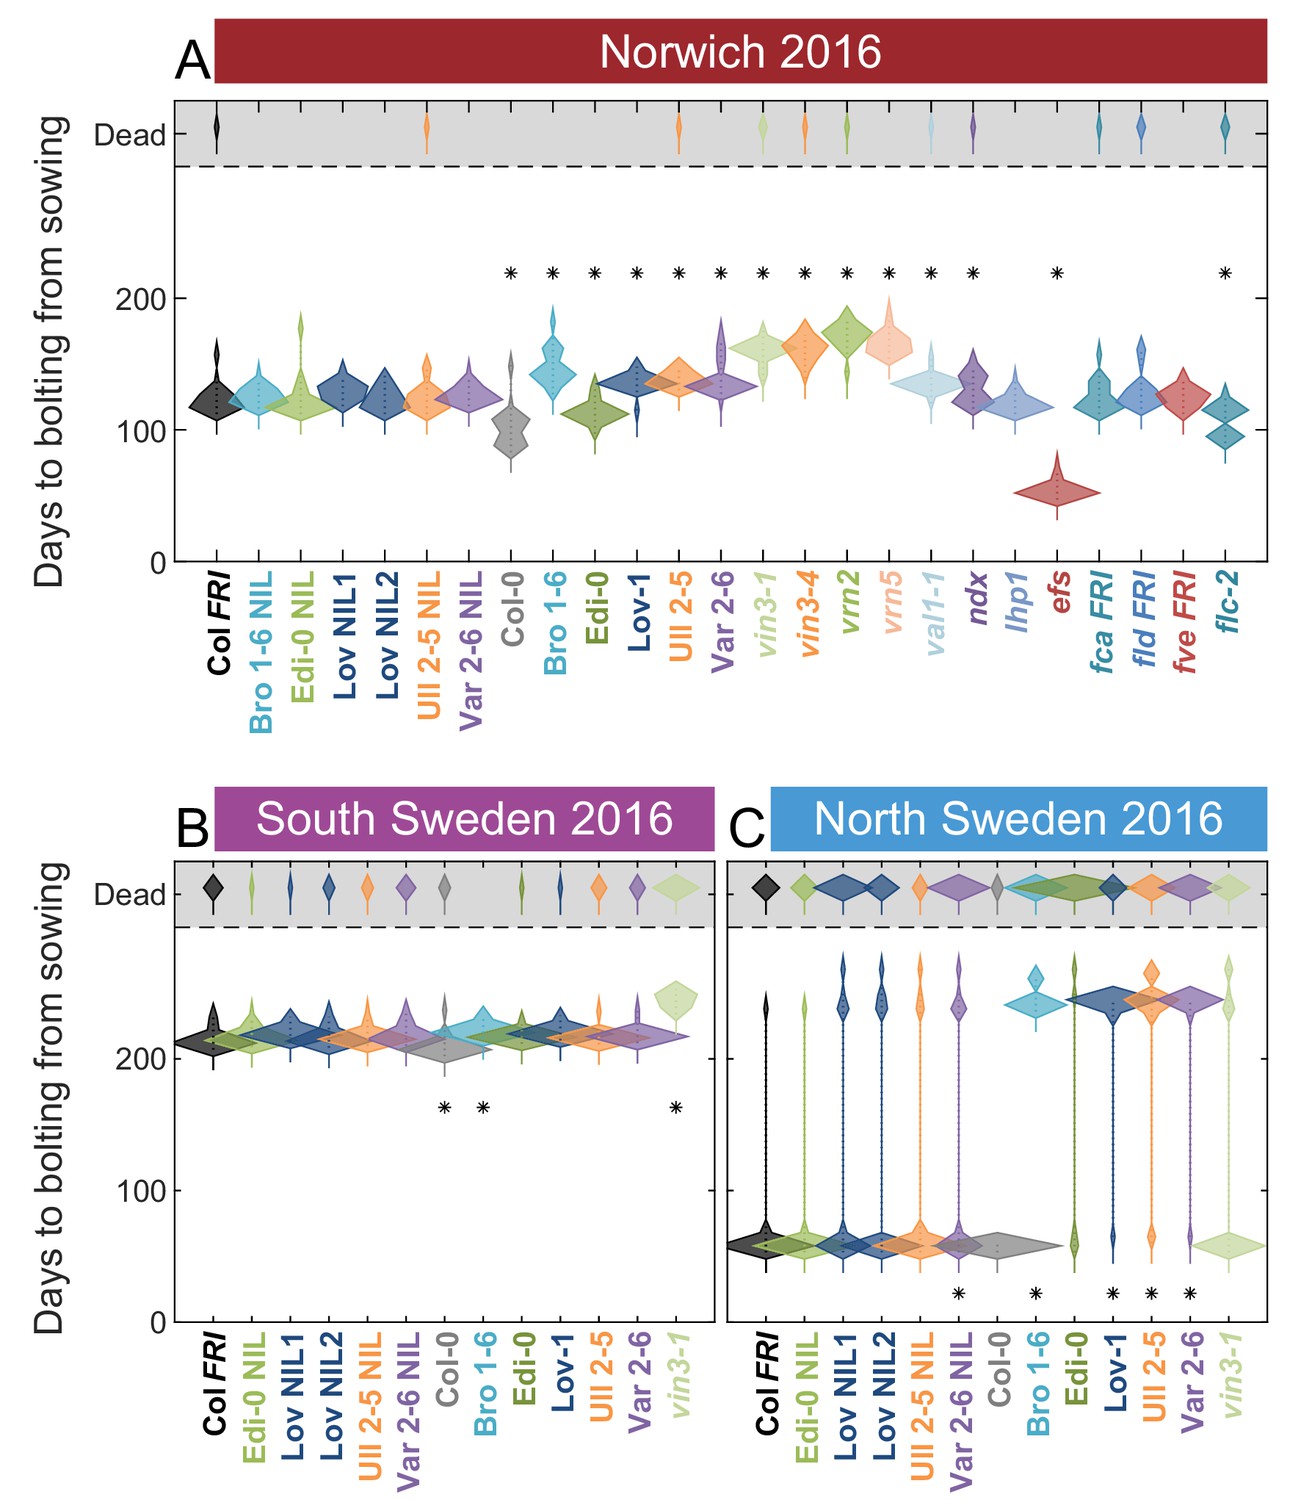
Flowering in the field across all sites in 2016–2017.
Time to bolting for each genotype in (A) Norwich, (B) South Sweden and (C) North Sweden in 2016–7. Plots show the histogram of numbers of plants as the width of violin plots. A line connects the measurements to indicate the range. N = 24 for Norwich, N = 32 for South Sweden, N = 36 for North Sweden, Source data 6. For Norwich 2016–7, nearby building works resulted in increased light pollution at night, possibly causing earlier flowering.
Figure 7—figure supplement 2

FLC affects fitness in North Sweden through bolting time and branching.
Survival, branching and silique set in North Sweden are all correlated to aspects of FLC regulation. (A) Survival over winter of plants that bolted before winter in different genotypes vs. survival of plants that did not bolt before winter. (B) Survival to seed set plotted against FLC levels (normalised to control sample for 2016–7) in the field in North Sweden 2016 (p<0.003, Generalised Linear Models (GLMs) for binomial data). (C) Percentage mortality before setting seed was high for all genotypes. (D) Mean number of siliques for plants surviving to set seed that bolted before or after winter. (E) Survival in the field does not correlate with FLC post-vern for the Col FRI background (GLM with binomial distribution, p-value>0.1). (F) Date of bolting in the field does not correlate with FLC post-vern for the Col FRI background (linear regression, p-value>0.1). (G) Silique production by surviving Col FRI background plants correlates with number of rosette branches, though more weakly at the individual level than at the genotype average level (linear regression, R2 = 0.23, p-value=0.004). (H) Rosette branching of surviving Col FRI background plants does not correlate with FLC mRNA as measured on 5th October in the field (linear regression, p-value>0.1). (I) Total number of siliques produced by Col FRI background genotypes plotted against percentage survival of that genotype to point of seed set, linear regression for survival effect alone, R2 = 0.64, p-value=0.019. N = 36 plants sown (A, B, C, E, I) subsequent data based on survivors to seed set (D, G, H) and plants that survive to bolting (F), see Source data 6. Error bars are s.e.m.
Tables
Table 1
Linear regression relationship between bolting time and FLC mRNA expression, as shown in Figure 6—figure supplements 5–6, where days to bolting = m[FLC mRNA] + c, and m is the ‘FLC-post-vern’ value and is the y-intercept fitted constant relating to non-FLC-mediated bolting delay (dependent on the transfer dates and conditions of each experiment).
NA – estimate only based on two data points, so no standard error is calculable. n.d. – no data. No value given for Col-0 as initial FLC value is too low for useful estimation.
| Genotype | Norwich m (days-to-bolting-per-FLC-unit) | Norwich Std. error | Norwich p-value | North Sweden M | North Sweden Std. error | North Sweden p-value | Average m ‘post-vern’ |
|---|---|---|---|---|---|---|---|
| Col FRI | 36.5 | 5.5 | 0.007 | 39.0 | 17.6 | 0.269 | 37.8 |
| vin3-1 FRI | 51.0 | 3.9 | 0.049 | 67.3 | 27.6 | 0.247 | 59.1 |
| Bro NIL | 36.1 | 0.3 | 0.006 | n.d. | n.d. | n.d. | 36.1 |
| Edi NIL | 33.5 | 2.7 | 0.051 | 39.8 | 1.1 | 0.017 | 36.7 |
| Löv NIL1 | 40.7 | 5.0 | 0.079 | n.d. | n.d. | n.d. | 40.7 |
| Löv NIL2 | 27.4 | 0.8 | 0.019 | 23.8 | 0.5 | 0.014 | 25.6 |
| Ull NIL | 24.8 | 1.0 | 0.025 | 42.1 | 9.3 | 0.138 | 33.4 |
| Var NIL | 25.7 | 0.9 | 0.022 | 22.3 | 1.6 | 0.046 | 24.0 |
| Bro1-6 | 27.0 | 0.3 | 0.007 | 37.3 | 2.1 | 0.036 | 32.1 |
| Edi-0 | 16.4 | 3.2 | 0.124 | 48.3 | 9.2 | 0.119 | 32.4 |
| Löv-1 | 113 | 19 | 0.110 | n.d. | n.d. | n.d. | 113 |
| Ull2-5 | 31.4 | 1.2 | 0.024 | 16.9 | 8.5 | 0.297 | 24.2 |
| Var2-6 | 63.1 | 6.9 | 0.070 | 35.0 | NA | NA | 49.0 |
Appendix 1—key resources table
| Reagent type (species) or resource | Designation | Source or reference | Identifiers | Additional information |
|---|---|---|---|---|
| Gene (Arabidopsis thaliana) | FLOWERING LOCUS C; FLC | TAIR | At5g10140 | |
| Gene (Arabidopsis thaliana) | VERNALIZATION INSENSITIVE3; VIN3 | TAIR | At5g57380 | |
| Gene (Arabidopsis thaliana) | PROTEIN PHOSPHATASE 2A SUBUNIT A3; PP2A | TAIR | At1g13320 | |
| Gene (Arabidopsis thaliana) | UBC; PEX4 PEROXIN4 | TAIR | At5g25760 | |
| Gene (Arabidopsis thaliana) | CIRCADIAN CLOCK ASSOCIATED1; CCA1 | TAIR | At2g46830 | |
| Strain, strain background (Arabidopsis thaliana) | Col-0 | Shindo et al., 2005 Doi:10.1104/pp.105.061309 | Nottingham Arabidopsis Stock Centre (NASC) ID N22625 | |
| Strain, strain background (Arabidopsis thaliana) | Bro1-6 | Long et al., 2013, Doi:10.1038/ng.2678 | NASC ID N76726 | |
| Strain, strain background (Arabidopsis thaliana) | Edi-0 | Shindo et al., 2005 Doi:10.1104/pp.105.061309 | NASC ID N22657 | |
| Strain, strain background (Arabidopsis thaliana) | Löv-1 | Shindo et al., 2005 Doi:10.1104/pp.105.061309 | NASC ID N22574 | |
| Strain, strain background (Arabidopsis thaliana) | Ull2-5 | Shindo et al., 2005 Doi:10.1104/pp.105.061309 | NASC ID N22586 | |
| Strain, strain background (Arabidopsis thaliana) | Var2-6 | Shindo et al., 2005 Doi:10.1104/pp.105.061309 | NASC ID N22581 | |
| Genetic reagent (A. thaliana) | Col FRISF2 | Lee and Amasino, 1995 Doi:10.1038/ncomms3186 | ||
| Genetic reagent (A. thaliana) | Bro NIL | This paper | FLC from Bro1-5 backcrossed to Col FRI background six times and brought to homozygosity, as described in Plant materials section of Materials and methods. Requests for materials should be addressed to Caroline Dean. | |
| Genetic reagent (A. thaliana) | Edi NIL | This paper | FLC from Edi-0 backcrossed to Col FRI background six times and brought to homozygosity, as described in Plant materials section of Materials and methods. Requests for materials should be addressed to Caroline Dean. | |
| Genetic reagent (A. thaliana) | Löv NIL1 | Duncan et al., 2015 Doi:10.7554/eLife.06620 | ||
| Genetic reagent (A. thaliana) | Löv NIL2 | Duncan et al., 2015 Doi:10.7554/eLife.06620 | ||
| Genetic reagent (A. thaliana) | Ull NIL | This paper, derived from Strange et al., 2011 doi:10.1371/journal.pone.0019949 | FLC from Ull2-5 backcrossed to Col FRI background six times and brought to homozygosity, as described in Plant materials section of Materials and methods. Requests for materials should be addressed to Caroline Dean. | |
| Genetic reagent (A. thaliana) | Var NIL | Li et al., 2015 doi:10.1101/gad.258814.115 | ||
| Genetic reagent (A. thaliana) | vin3-1 FRI | Sung and Amasino, 2004 doi:10.1038/nature02195 | ||
| Genetic reagent (A. thaliana) | vin3-4 FRI | Bond et al., 2009b doi:10.1111/j.1365-313X.2009.03891.x | ||
| Genetic reagent (A. thaliana) | vrn1-4 FRI | Sung and Amasino, 2004 doi:10.1038/nature02195 | ||
| Genetic reagent (A. thaliana) | vrn2-1 FRI | Yang et al., 2017 doi:10.1126/science.aan1121 | ||
| Genetic reagent (A. thaliana) | vrn5-8 FRI | Greb et al., 2007 doi:10.1016/j.cub.2006.11.052 | ||
| Genetic reagent (A. thaliana) | ndx1-1 FRI | Sun et al., 2013 doi:10.1126/science.1234848 | ||
| Genetic reagent (A. thaliana) | fca-9 | Liu et al., 2007 doi:10.1016/j.molcel.2007.10.018 | ||
| Genetic reagent (A. thaliana) | fld-4 | Liu et al., 2007 doi:10.1016/j.molcel.2007.10.018 | ||
| Genetic reagent (A. thaliana) | fve-3 | Ausín et al., 2004 doi:10.1038/ng1295 | ||
| Genetic reagent (A. thaliana) | fca-9 FRI | This paper | Cross Col FRI and lines reported above. Requests for materials should be addressed to Caroline Dean. | |
| Genetic reagent (A. thaliana) | fld-4 FRI | This paper | Cross Col FRI and lines reported above. Requests for materials should be addressed to Caroline Dean. | |
| Genetic reagent (A. thaliana) | fve-3 FRI | This paper | Cross Col FRI and lines reported above. Requests for materials should be addressed to Caroline Dean. | |
| Genetic reagent (A. thaliana) | val1-2 FRI | Qüesta et al., 2016 doi:10.1126/science.aaf7354 | ||
| Genetic reagent (A. thaliana) | sdg8 FRI | Yang et al., 2014 doi:10.1016/j.cub.2014.06.047 | ||
| Genetic reagent (A. thaliana) | lhp1-3 FRI | Mylne et al., 2006 doi:10.1073/pnas.0507427103 | ||
| Sequence-based reagent | UBC_qPCR_F | Hepworth et al., 2018 doi:10.1038/s41467-018-03065-7 | CTGCGACTCAGGGAATCTTCTAA | |
| Sequence-based reagent | UBC_qPCR_R | Hepworth et al., 2018 doi:10.1038/s41467-018-03065-7 | TTGTGCCATTGAATTGAACCC | |
| Sequence-based reagent | PP2A QPCR F2 | Hepworth et al., 2018 doi:10.1038/s41467-018-03065-7 | ACTGCATCTAAAGACAGAGTTCC | |
| Sequence-based reagent | PP2A QPCR R2 | Hepworth et al., 2018 doi:10.1038/s41467-018-03065-7 | CCAAGCATGGCCGTATCATGT | |
| Sequence-based reagent | FLC_4265_F (spliced sense) | Hepworth et al., 2018 doi:10.1038/s41467-018-03065-7 | AGCCAAGAAGACCGAACTCA | |
| Sequence-based reagent | FLC_5683_R (spliced sense) | Hepworth et al., 2018 doi:10.1038/s41467-018-03065-7 | TTTGTCCAGCAGGTGACATC | |
| Sequence-based reagent | FLC_3966_F (unspliced sense) | Hepworth et al., 2018 doi:10.1038/s41467-018-03065-7 | CGCAATTTTCATAGCCCTTG | |
| Sequence-based reagent | FLC_4135_R (unspliced sense) | Hepworth et al., 2018 doi:10.1038/s41467-018-03065-7 | CTTTGTAATCAAAGGTGGAGAGC | |
| Sequence-based reagent | FLC unspliced RT (4029) | Hepworth et al., 2018 doi:10.1038/s41467-018-03065-7 | TGACATTTGATCCCACAAGC | |
| Sequence-based reagent | VIN3 qPCR 1 F | Hepworth et al., 2018 doi:10.1038/s41467-018-03065-7 | TGCTTGTGGATCGTCTTGTCA | |
| Sequence-based reagent | VIN3 qPCR 1 R | Hepworth et al., 2018 doi:10.1038/s41467-018-03065-7 | TTCTCCAGCATCCGAGCAAG | |
| Sequence-based reagent | JF118-CCA1-F | MacGregor et al., 2013 doi:10.1105/tpc.113.114959 | CTGTGTCTGACGAGGGTCGAA | |
| Sequence-based reagent | JF119-CCA1-R | MacGregor et al., 2013 doi:10.1105/tpc.113.114959 | ATATGTAAAACTTTGCGGCAATACCT | |
| Commercial assay or kit | Turbo DNA Free Kit | Invitrogen | ||
| Commercial assay or kit | SuperScript Reverse Transcriptase III | Invitrogen | ||
| Commercial assay or kit | Roche | LightCycler 480 SYBR Green I Master | ||
| Software, algorithm | R | R Development Core Team, 2018 | ||
| Software, algorithm | LinReg PCR | https://www.medischebiologie.nl/files/ Ruijter et al., 2009, doi:10.1093/nar/gkp045 |
Additional files
-
Source data 1
Field temperatures.
- https://cdn.elifesciences.org/articles/57671/elife-57671-data1-v2.xlsx
-
Source data 2
RNA Expression for all field experiments 2014–15.
- https://cdn.elifesciences.org/articles/57671/elife-57671-data2-v2.xlsx
-
Source data 3
RNA Expression for all field experiments 2016–17.
- https://cdn.elifesciences.org/articles/57671/elife-57671-data3-v2.xlsx
-
Source data 4
Flowering time and phenotypes for all field experiments 2014–15.
- https://cdn.elifesciences.org/articles/57671/elife-57671-data4-v2.xlsx
-
Source data 5
Flowering time and phenotypes for all transfer experiments 2016–17.
- https://cdn.elifesciences.org/articles/57671/elife-57671-data5-v2.xlsx
-
Source data 6
Flowering time.
Survival and phenotypes for field experiments 2016–17.
- https://cdn.elifesciences.org/articles/57671/elife-57671-data6-v2.xlsx
-
Source data 7
Flowering time and branching for accessions and NILs in constant-condition vernalization treatments.
- https://cdn.elifesciences.org/articles/57671/elife-57671-data7-v2.xlsx
-
Supplementary file 1
- https://cdn.elifesciences.org/articles/57671/elife-57671-supp1-v2.xlsx
-
Supplementary file 2
List of all comparisons of coefficients of variation.
Differences between the coefficients of variation of different groups (sites, features, years; 24 comparisons)
- https://cdn.elifesciences.org/articles/57671/elife-57671-supp2-v2.docx
-
Supplementary file 3
Statistics for Figure 6, Figure 6—figure supplements 1–4, and Figure 7—figure supplement 1.
- https://cdn.elifesciences.org/articles/57671/elife-57671-supp3-v2.xlsx
-
Supplementary file 4
Sources of previously published mutants and transgenics.
- https://cdn.elifesciences.org/articles/57671/elife-57671-supp4-v2.docx
-
Supplementary file 5
Primers used for PCR.
- https://cdn.elifesciences.org/articles/57671/elife-57671-supp5-v2.docx
-
Supplementary file 6
Statistics for Figure 5.
- https://cdn.elifesciences.org/articles/57671/elife-57671-supp6-v2.xlsx
-
Transparent reporting form
- https://cdn.elifesciences.org/articles/57671/elife-57671-transrepform-v2.docx
Download links
A two-part list of links to download the article, or parts of the article, in various formats.
Downloads (link to download the article as PDF)
Open citations (links to open the citations from this article in various online reference manager services)
Cite this article (links to download the citations from this article in formats compatible with various reference manager tools)
Natural variation in autumn expression is the major adaptive determinant distinguishing Arabidopsis FLC haplotypes
eLife 9:e57671.
https://doi.org/10.7554/eLife.57671


