A versatile oblique plane microscope for large-scale and high-resolution imaging of subcellular dynamics
- Department of Cell Biology, University of Texas Southwestern Medical Center, United States
- Lyda Hill Department of Bioinformatics, University of Texas Southwestern Medical Center, United States
- Institute for Molecular Bioscience, University of Queensland, Australia
- Department of Molecular Genetics, University of Texas Southwestern Medical Center, United States
- Institute for Quantitative Health Sciences and Engineering, Michigan State University, United States
- William T. Shearer Center for Human Immunobiology, Baylor College of Medicine and Texas Children’s Hospital, United States
- Harold C. Simmons Comprehensive Cancer Center and the Department of Internal Medicine, University of Texas Southwestern Medical Center, United States
- Department of Basic and Clinical Oncology, Faculty of Medicine, University of Chile, Chile
- Department of Obstetrics, Gynecology, and Reproductive Biology, Michigan State University, United States
- Chan Zuckerberg Biohub, United States
- Department of Cell Biology, Duke University School of Medicine, United States
- Center for Biological Physics and Department of Physics, Arizona State University, United States
- Cecil H. and Ida Green Comprehensive Center for Molecular, Computational and Systems Biology, University of Texas Southwestern Medical Center, United States
- Calico Life Sciences LLC, United States
Figures
Figure 1 with 7 supplements
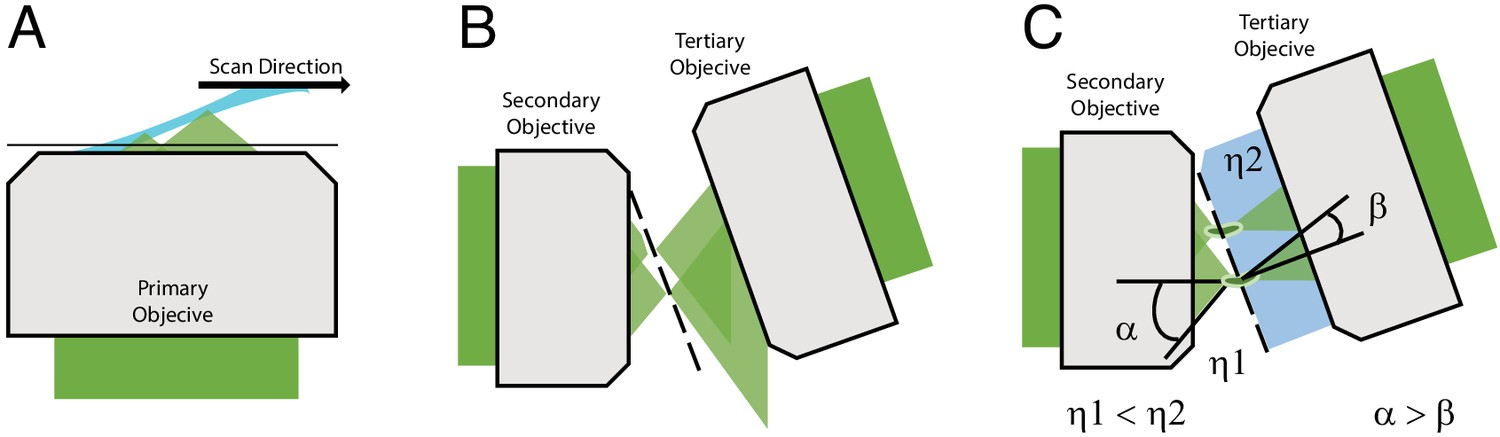
Optical principle of oblique plane microscopy.
(A) The light-sheet, shown in light blue, is launched from the primary objective at an oblique illumination angle, and the resulting fluorescence cones of light, shown in green, are collected by the same objective. (B) In a traditional oblique plane microscope, a replica of the fluorescence collected from the primary objective is formed by the secondary objective at the focus of the tertiary objective. However, owing to the off-axis imaging geometry, high-angle rays cannot be captured by the tertiary objective. (C) If instead the light travels from a region of low refractive index (η1, air) to high refractive index (η2, water or glass), then the optical cone of light is compressed from an angle of α to β and refracted toward the tertiary imaging system, thus permitting its capture, and maximizing the resolving power of the microscope.
Figure 1—figure supplement 1
Geometrical considerations for the theoretical NA.
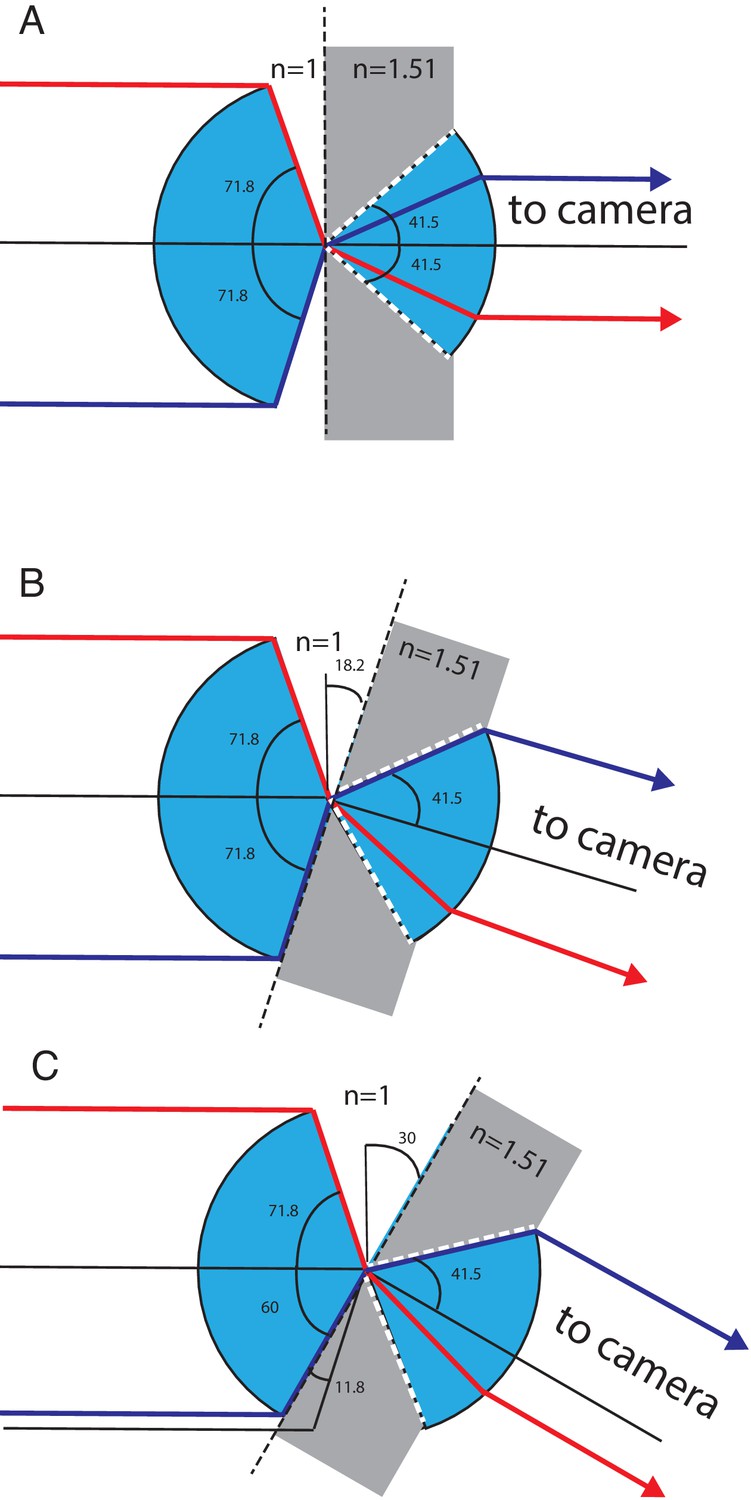
Light transmission between the secondary and tertiary objective is considered. (A) Geometry for zero tilt angle of the tertiary objective. Blue depicts the cone of light that can be transmitted through the secondary and tertiary objective. Gray depicts the higher refractive index of the tertiary objective’s immersion media (glass). White dotted lines depict the marginal rays of the tertiary objective, which have a half opening angle corresponding to the critical angle of the air-glass interface. Red and magenta mark two marginal rays, both rays are refracted toward the optical axis of the tertiary objective well below the critical angle. (B) Geometry for a tilt angle of the tertiary objective of 18.2 degrees. The magenta ray enters the tertiary objective at the critical angle, while the red ray stays below the critical angle. (C) Geometry for a tilt angle of 30 degree for the tertiary objective. The glass truncates the available angular aperture of the secondary objective and reduces the half opening angle of the magenta ray to 60 degrees. This new marginal ray enters the tertiary objective at the critical angle.
Figure 1—figure supplement 2
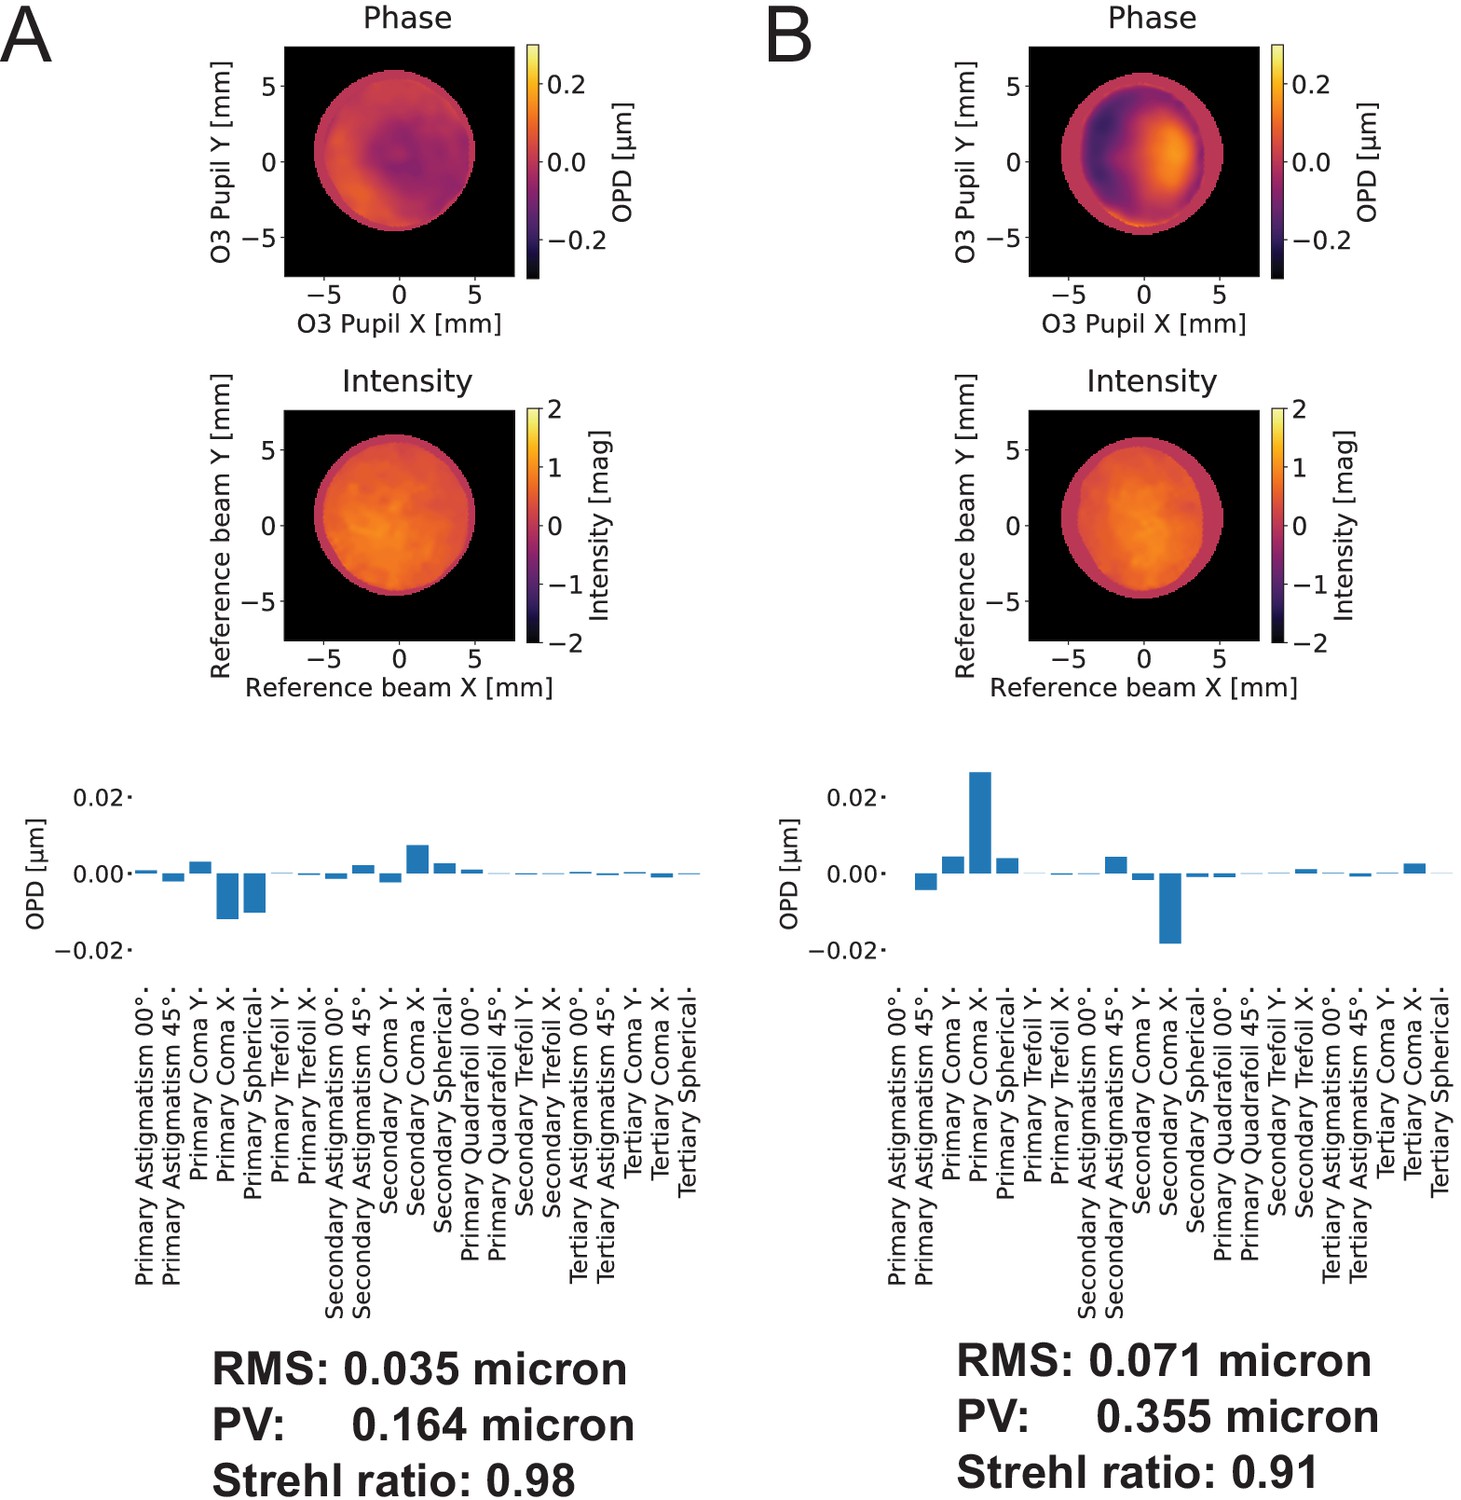
Wavefront error associated with our remote focusing system.
(A) At zero-degrees, the remote focus system achieves a Strehl ratio of 0.97. (B) At 30-degrees, the remote focus system achieves a Strehl ratio of 0.91. Zernike decomposition indicates a small amount of coma, likely resulting from the coverslip that was mounted to the secondary objective, increases upon tilting of the tertiary imaging system. OPD: Optical phase difference.
Figure 1—figure supplement 3
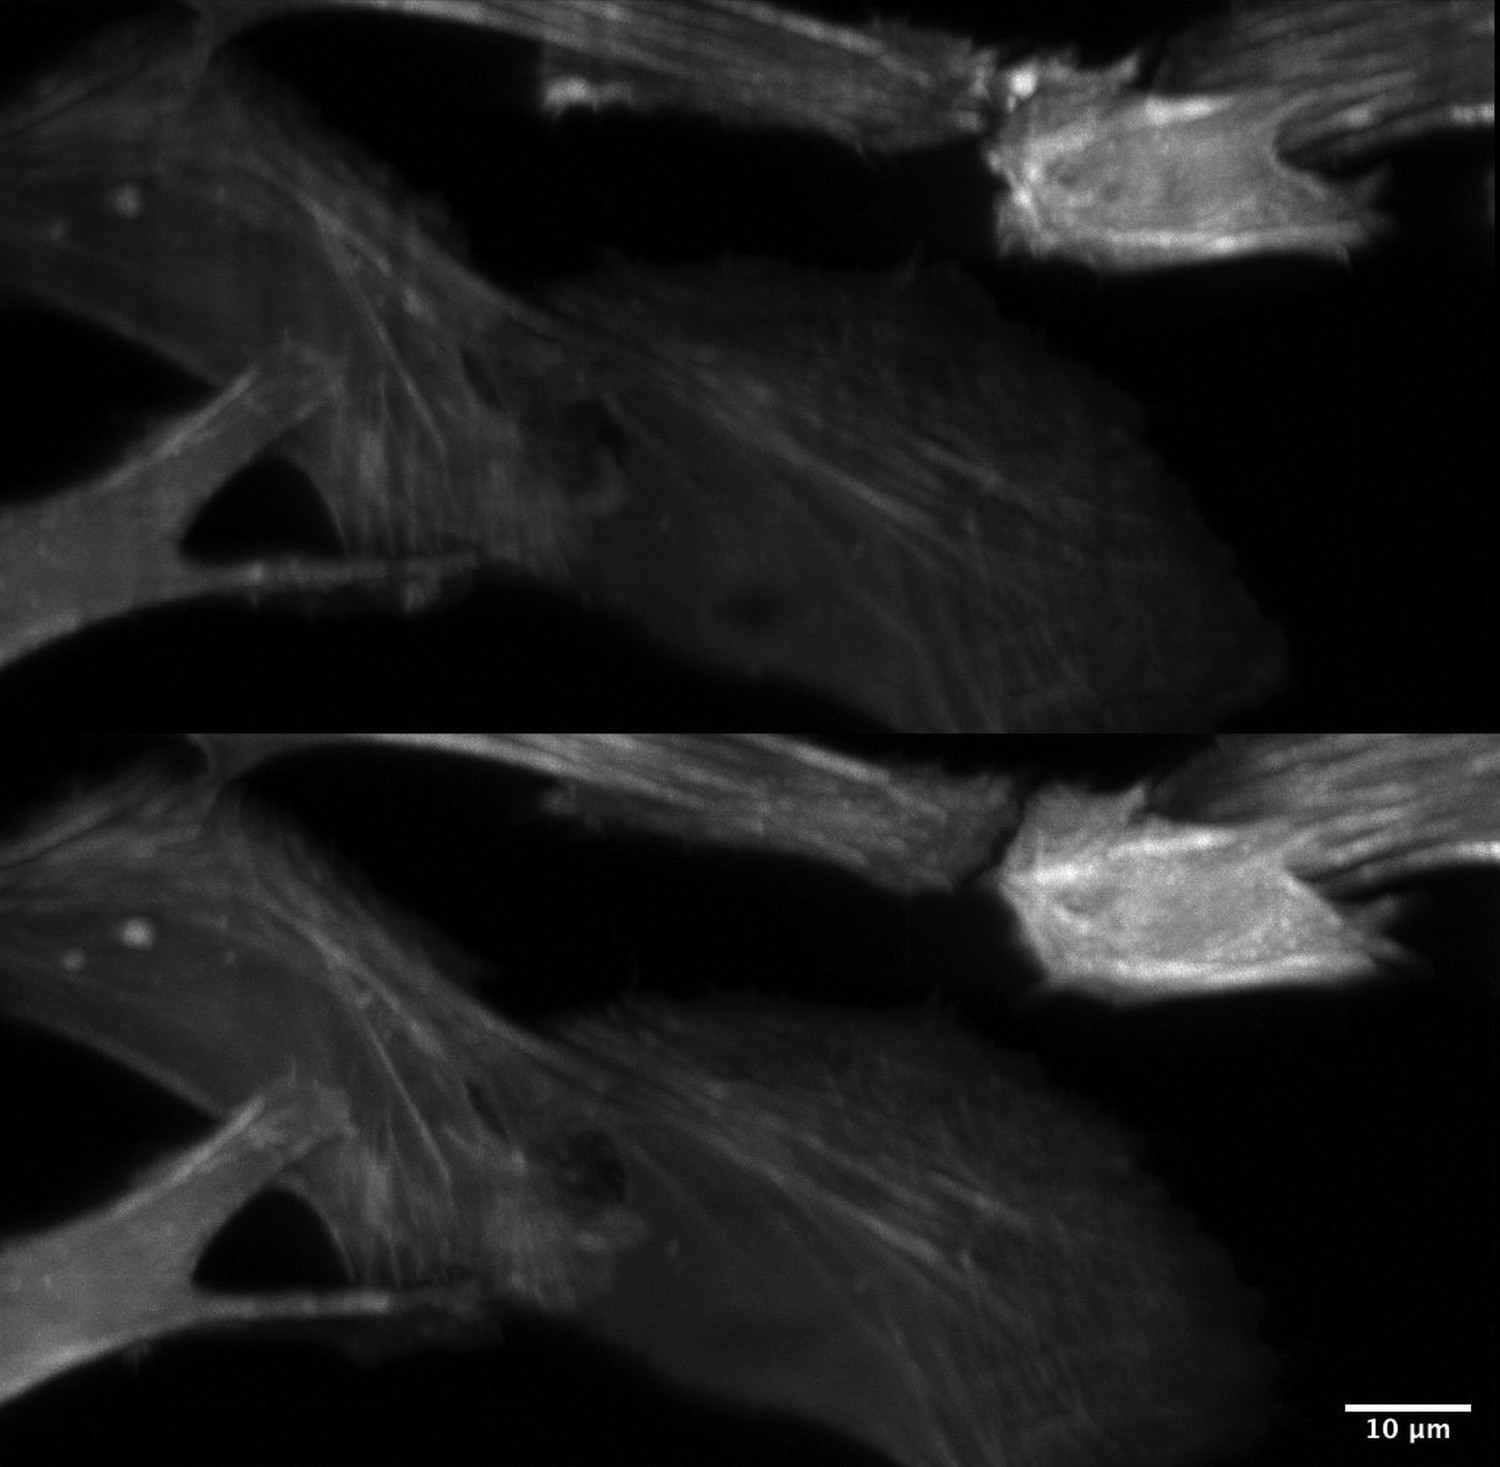
Improved illumination homogeneity with resonantly scanned multidirectional illumination.
(Top) Scattering, refraction, and absorption results in shadow and non-uniform illumination artifacts. (Bottom) By resonantly scanning the illumination beam in a plane conjugate to the sample, these artifacts are reduced substantially and thereby provide greater imaging quality. Cell Type: U2OS. Label: GFP-Tractin.
Figure 1—figure supplement 4

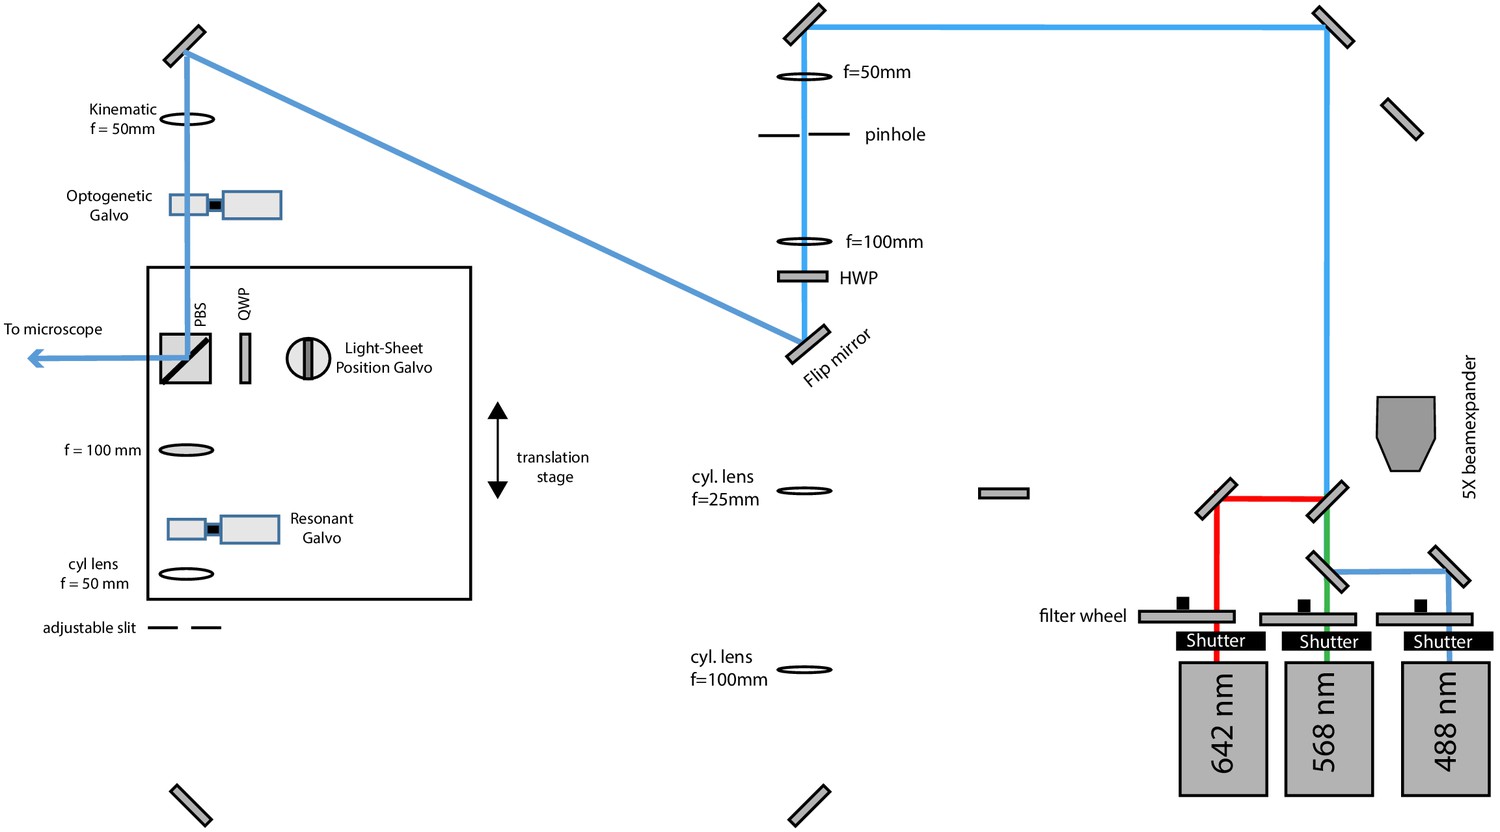
Schematic diagram of the illumination unit configured for light-sheet illumination.
488, 568, and 642 nm laser light is combined by dichroic mirrors, but for clarity, only the blue laser path is outlined after laser combination. The light-sheet position galvo is conjugate to the pupil plane of the primary objective and allows fine adjustments of the relative position of the light-sheet to the focal plane of the tertiary imaging system.
Figure 1—figure supplement 5
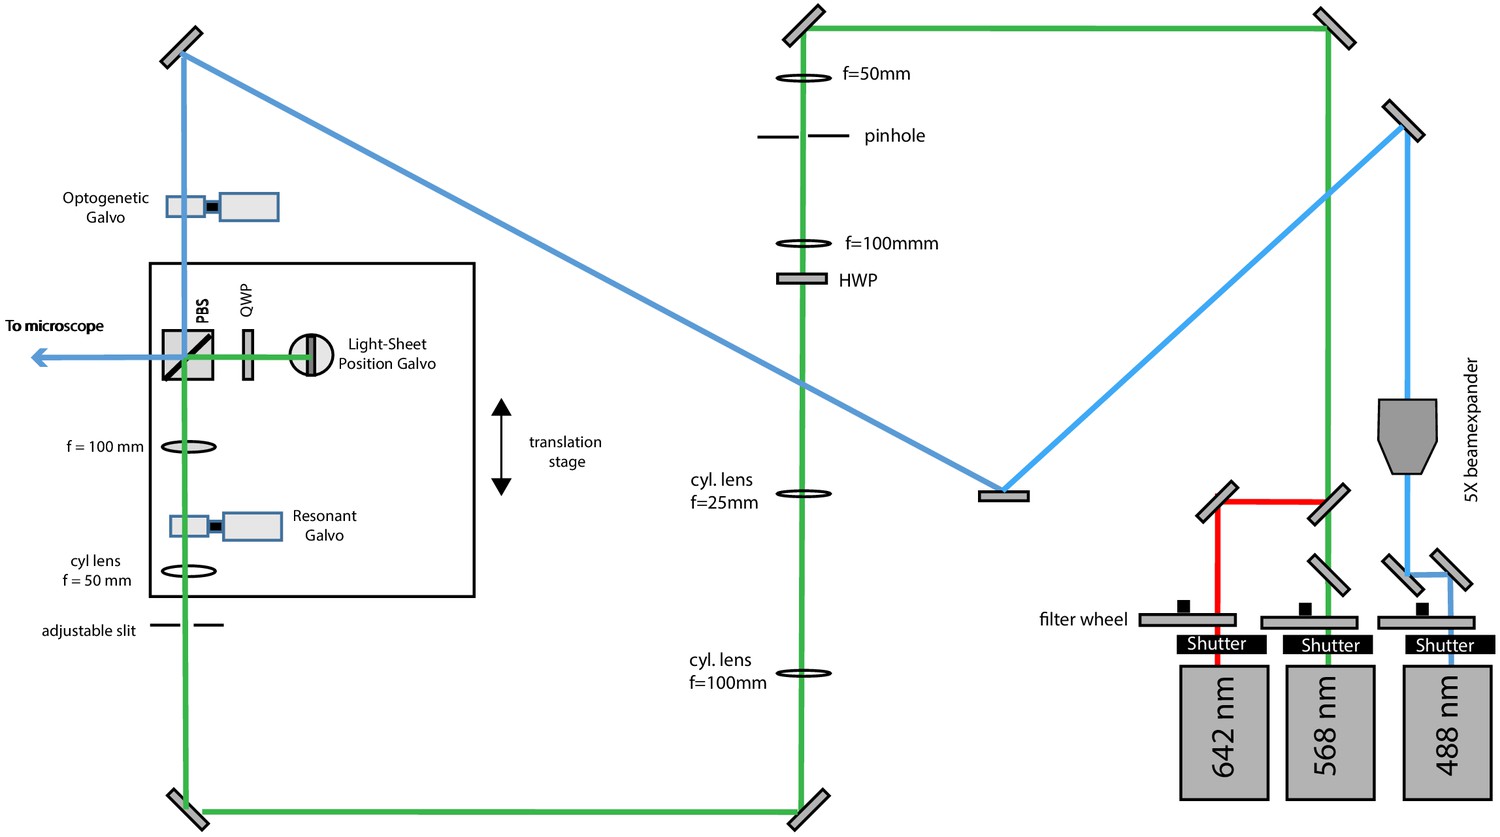
Schematic diagram of the illumination unit configured for widefield illumination.
A flip mirror guides the light to the corresponding path and a kinematic mount inserts a lens to focus the laser beam on the optogenetic galvo (which is conjugated to the pupil plane of the primary objective), thereby producing a collimated laser beam in the sample space.
Figure 1—figure supplement 6
Schematic diagram of the illumination unit configured for light-sheet illumination with the far-red and red lasers and photo-activation with the blue laser.
To this end, a flip mirror is used to send the 488 nm laser light into a different beam path. The optogenetic galvo is conjugate to the pupil plane and allows lateral beam scanning.
Figure 1—figure supplement 7
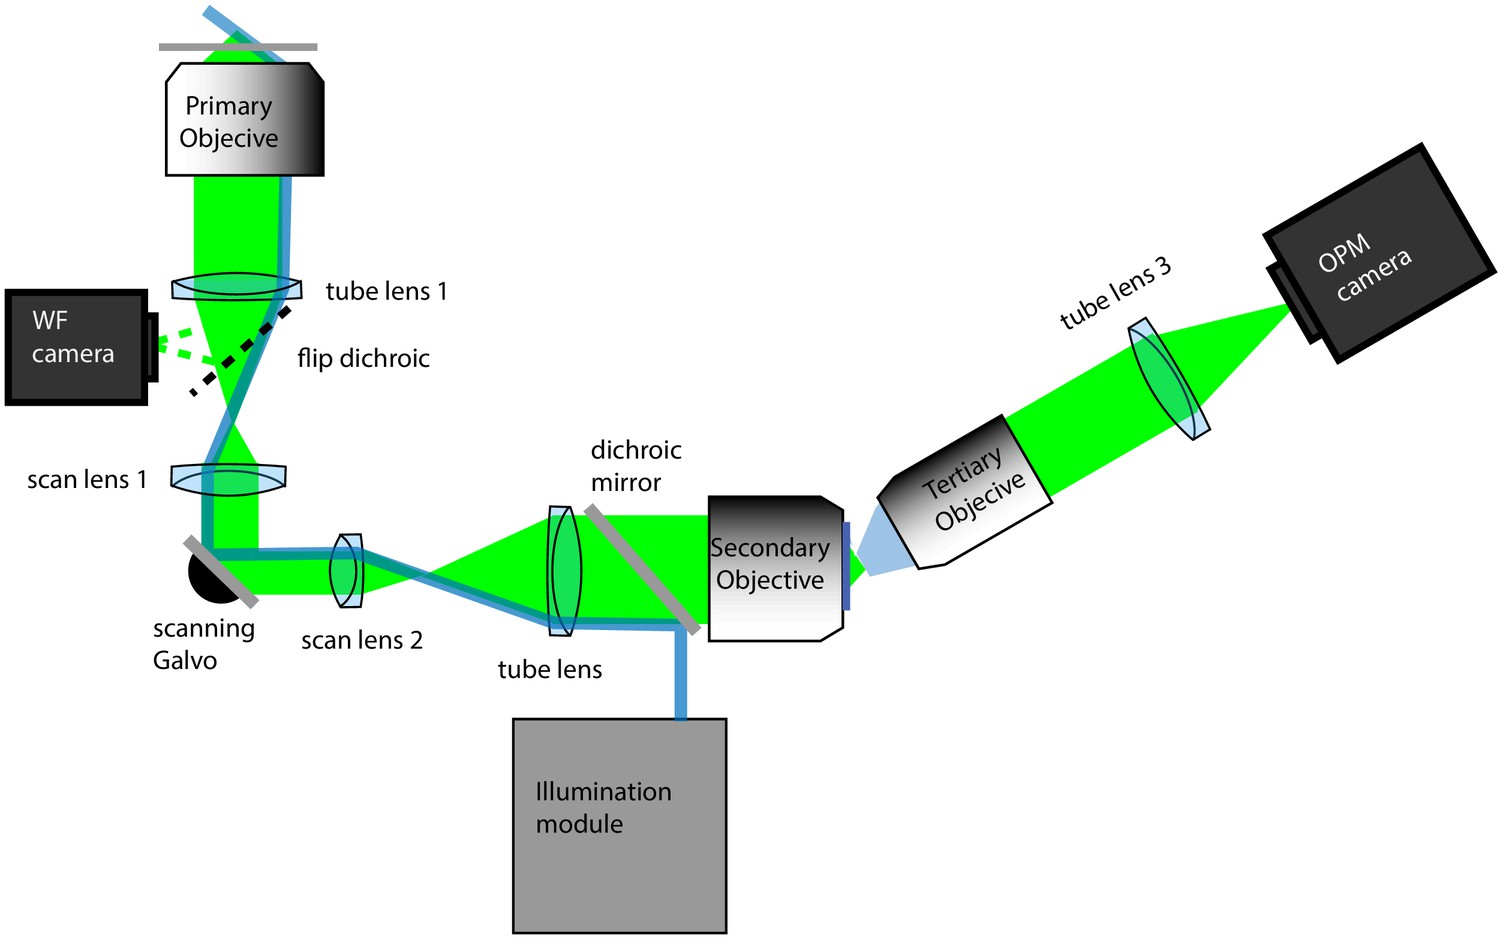
Schematic diagram of the oblique plane microscope.
Primary objective: 100X/1.35 MRD73950 Silicone Immersion Objective, Nikon Instruments; tube lens 1: TTL200, ThorLabs; WF camera: Grasshopper 3, FLIR; scan lens 1: CSL-SL, ThorLabs; scanning galvo: 6215H, Cambridge Technology; scan lens 2: LSM03-VIS, ThorLabs; tube lens 2: TTL200; Secondary objective: CFI Plan Apo Lambda 40XC, Nikon Instruments; tertiary objective: AMS-AGY v1.0, Special Optics; tube lens 3: ITL200 Thorlabs; OPM camera: Flash 4.0 v3, Hamamatsu. Blue rays depict the light-sheet illumination path and green depicts fluorescence light originating from a single point source. The illumination module is detailed in Figure 1—figure supplements 4–6.
Figure 2 with 5 supplements
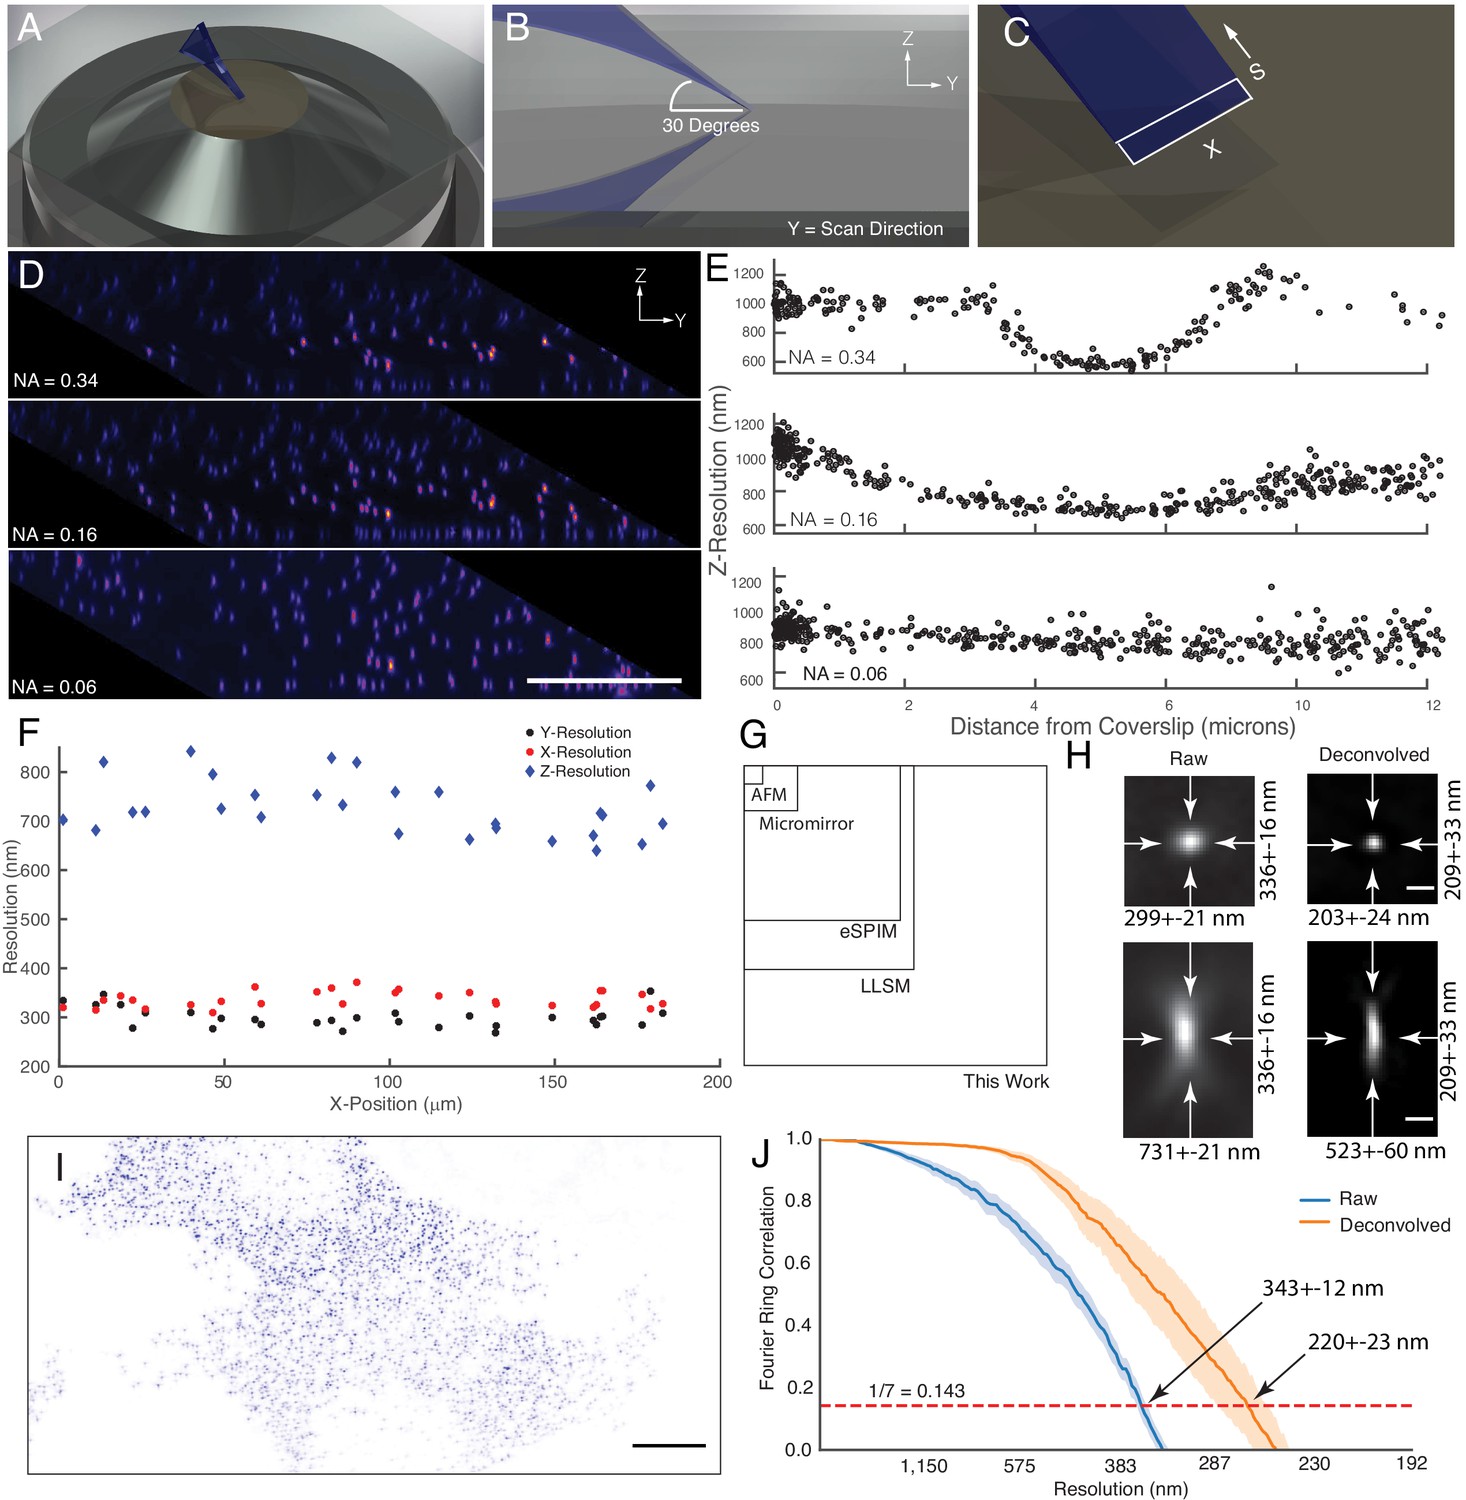
Microscope illumination geometry, light-sheet properties, resolution, and field of view.
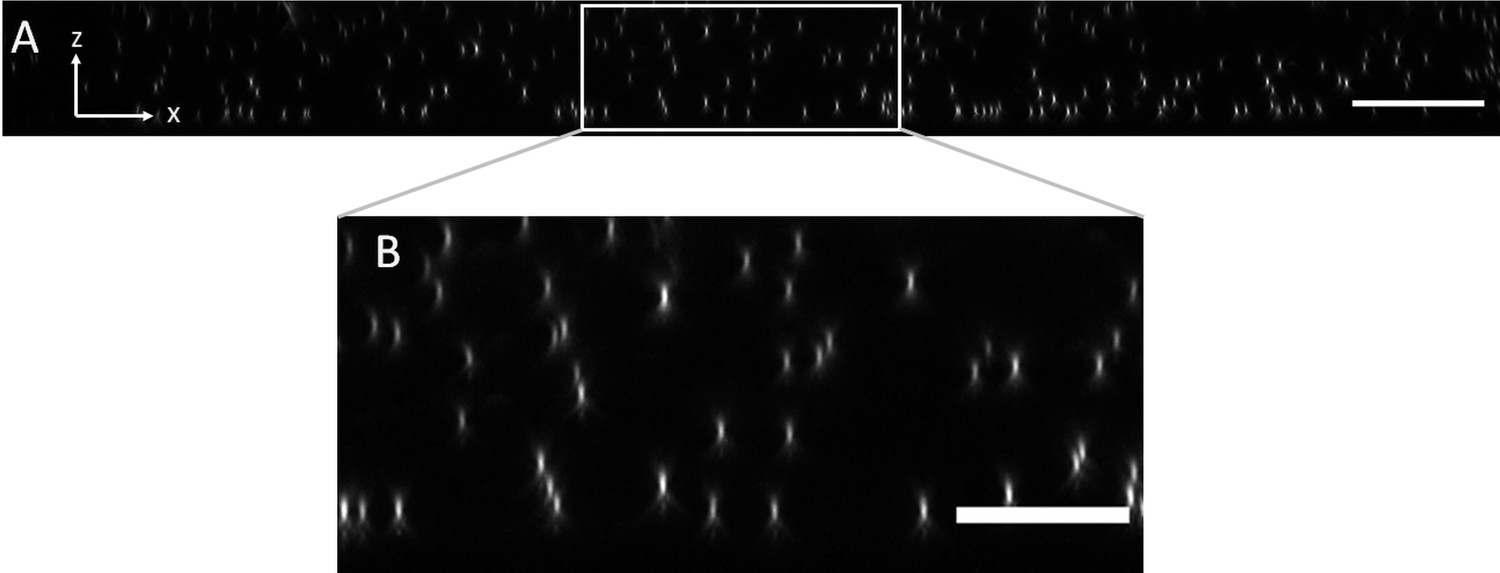
(A) The light-sheet is launched from a single primary objective at a (B) 30-degree oblique illumination angle, and rapidly scanned in the Y-direction to acquire a 3D volume. (C) At each intermediate position, a two-dimensional plane along the X and S axes is acquired with a scientific CMOS camera. (D) 100 nm fluorescent beads embedded in agarose. Sharp strip of beads reveals the position of the illumination light-sheet beam waist and scan trajectory along the Y-axis. Parallelepiped data geometry results from oblique illumination and computational shearing of the data. (E) FWHM of beads for different illumination light-sheet NAs, as a function of distance from the coverslip. Raw data, no deconvolution. The confocal parameter of the light-sheets projected onto the Z-axis is 3.0, 7.5, and >12 microns, for NAs of 0.34, 0.16, and 0.06, respectively. (F) Lateral and axial resolutions of surface immobilized fluorescent nanospheres and using an excitation NA of 0.16. Raw data, no deconvolution (G) Dimensions of the field of view for the OPM presented here when operated in a laser-scanning format compared to lattice light-sheet microscopy, eSPIM, a microfluidic-based micromirror, and an atomic force microscopy (AFM)-based cantilever. Lateral dimensions of the figure represent the X and Y axes. (H) Representative point-spread functions for surface immobilized fluorescent nanospheres, before and after deconvolution. Scale Bar: 500 nm. (I) Maximum intensity projection of a MV3 cell expressing genetically encoded multimeric nanoparticles. Deconvolved data is shown. Scale Bar: 10 microns. (J) Fourier Ring Correlation analysis of intracellular resolution. Solid lines show mean value, shaded area is the 95% confidence interval.
Figure 2—figure supplement 1
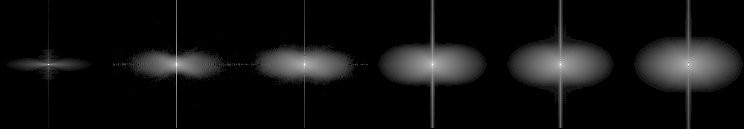
Rotationally averaged optical transfer functions for a widefield microscope and our OPM with increasing numerical aperture of the light-sheet illumination.
Numerical Aperture of the light-sheet, including (second from the left) 0.06, 0.14, 0.27, 0.32, and (far right) 0.48, as measured by the width of the illumination in a conjugate pupil plane. The latter value (0.48) was obtained when fully opening the slit aperture that controls the beam waist of the light-sheet. While the real NA value might be smaller, as some truncation may have occurred, the last OTF shows the maximum extend we could obtain with our setup. All data shown as the log of the absolute value of the spectrum.
Figure 2—figure supplement 2
Axial view of 100 nm fluorescent microspheres in agarose imaged with an NA of 0.06 for light-sheet excitation.
(A) XZ maximum intensity projection over the imaging volume. Scale Bar: 20 microns. (B) Magnified version of the boxed region in (A). Scale Bar 10 microns.
Figure 2—figure supplement 3
Comparison of raw PSFs obtained with OPM, lattice light-sheet microscopy and spinning-disk microscopy.
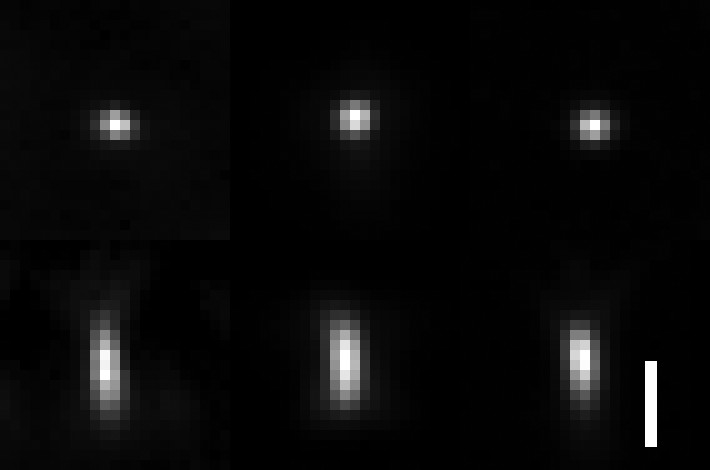
Lateral and axial views with isotropic voxel size are shown. Left: OPM PSF with a tilt of the tertiary objective of 30 degrees and an excitation NA of 0.16. Resolution as measured by FWHM of the PSF: X = 299 ± 21 nm, Y = 336 ± 16 nm, and Z = 731 ± 21 nm. Middle: lattice light-sheet microscopy PSF, using an NA 1.1 detection and NA 0.67 excitation objectives, a square lattice illumination pattern and an inner and outer NA of 0.32 and 0.5 of the annulus that filters the lattice pattern. Resolution as measured by FWHM of the PSF: X = 333 ± 35 nm. Y = 322 ± 33 nm. Z = 671 ± 147 nm. Right: spinning-disk PSF using an NA 1.35/100X objective on a Nikon Ti2-E microscope. Resolution as measured by FWHM of the PSF: X = 295 ± 32 nm, Y = 291 ± 23 nm, Z = 584 ± 56 nm. Scale Bar 1 micron.
Figure 2—figure supplement 4
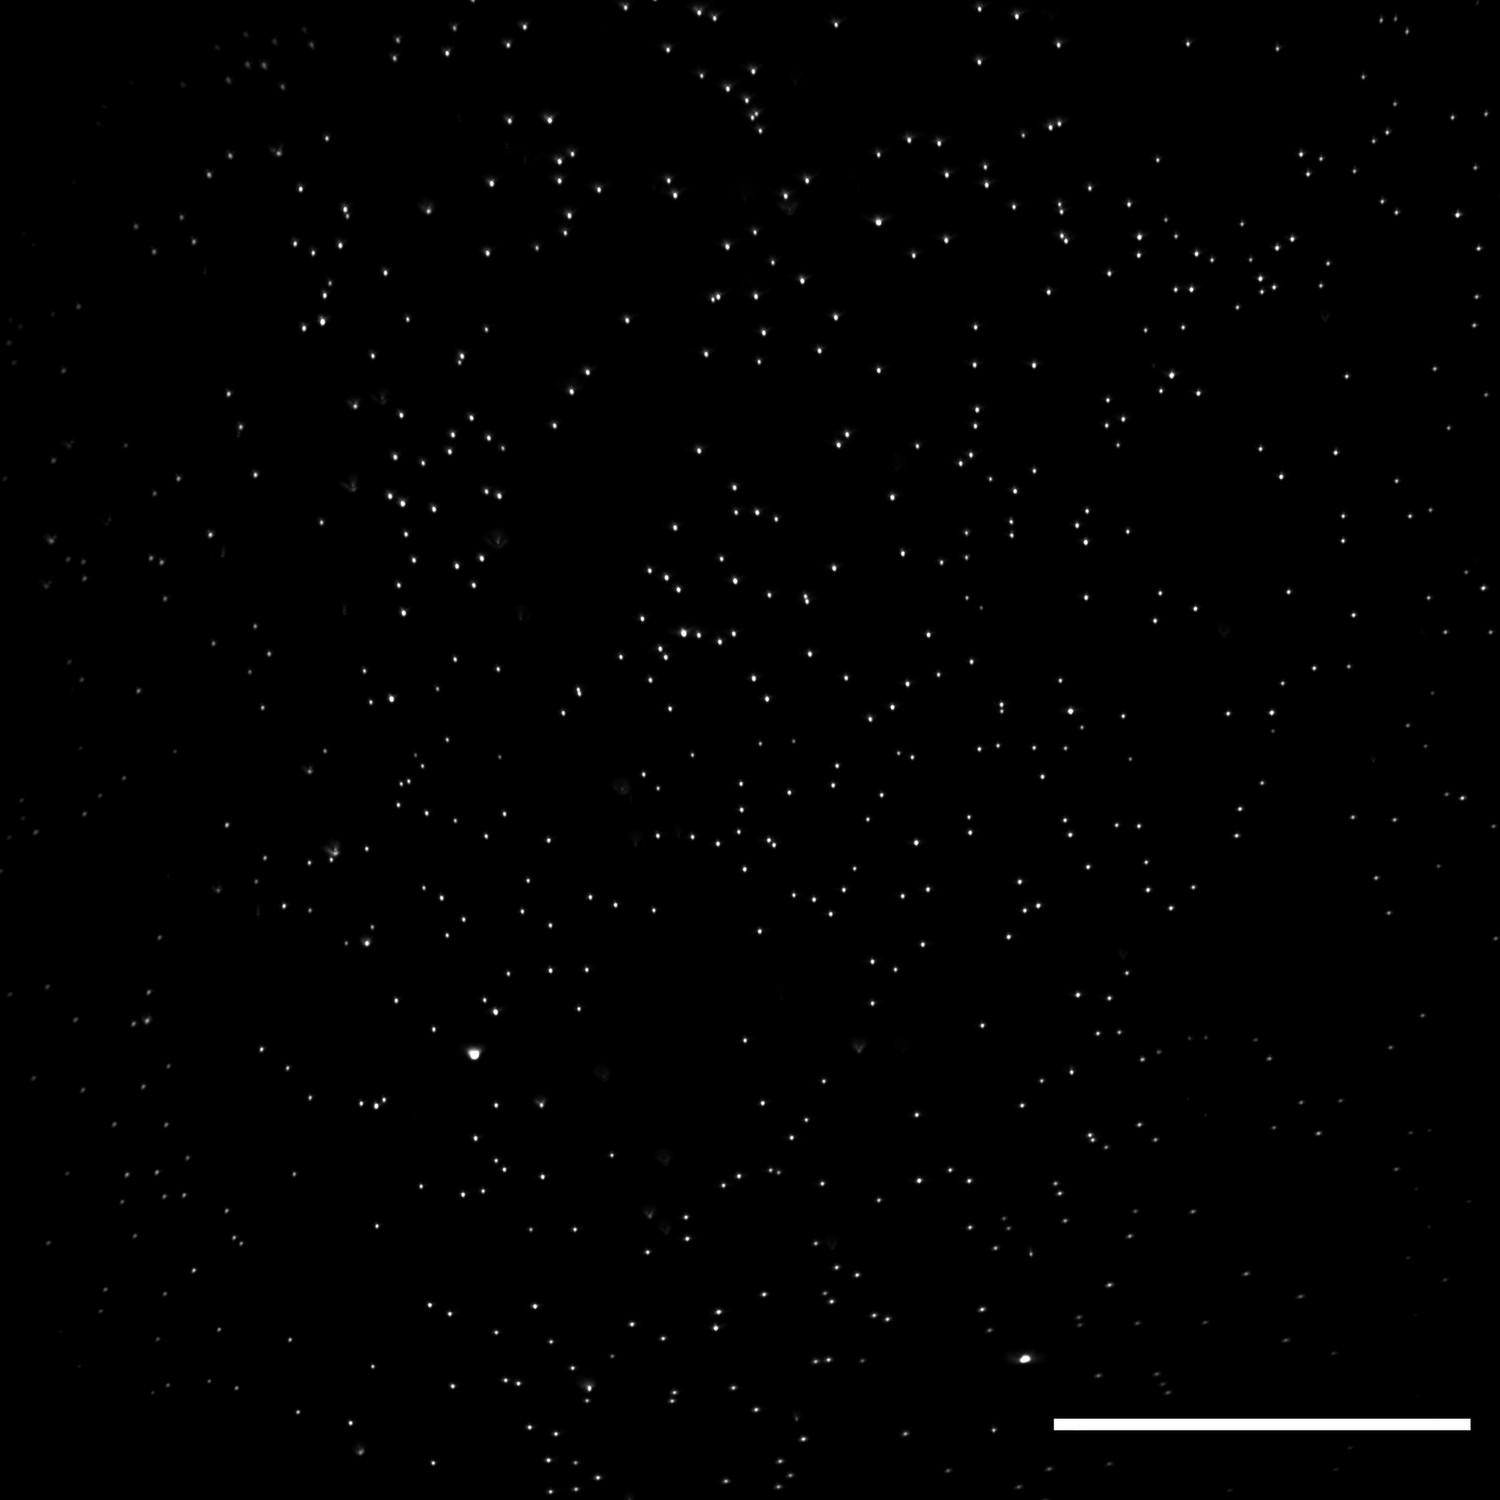
Lateral XY field of view of 100 nm fluorescent microspheres in agarose obtained with an optical scan along the Y-axis.
Image decorrelation analysis yielded a lateral resolution estimate of 325± 25 nm (mean and standard deviation). Raw data is shown. Scale Bar: 50 microns.
Figure 2—figure supplement 5

Lateral resolution measured at different depths using 100 nm green fluorescent beads.
Deconvolved data is shown.
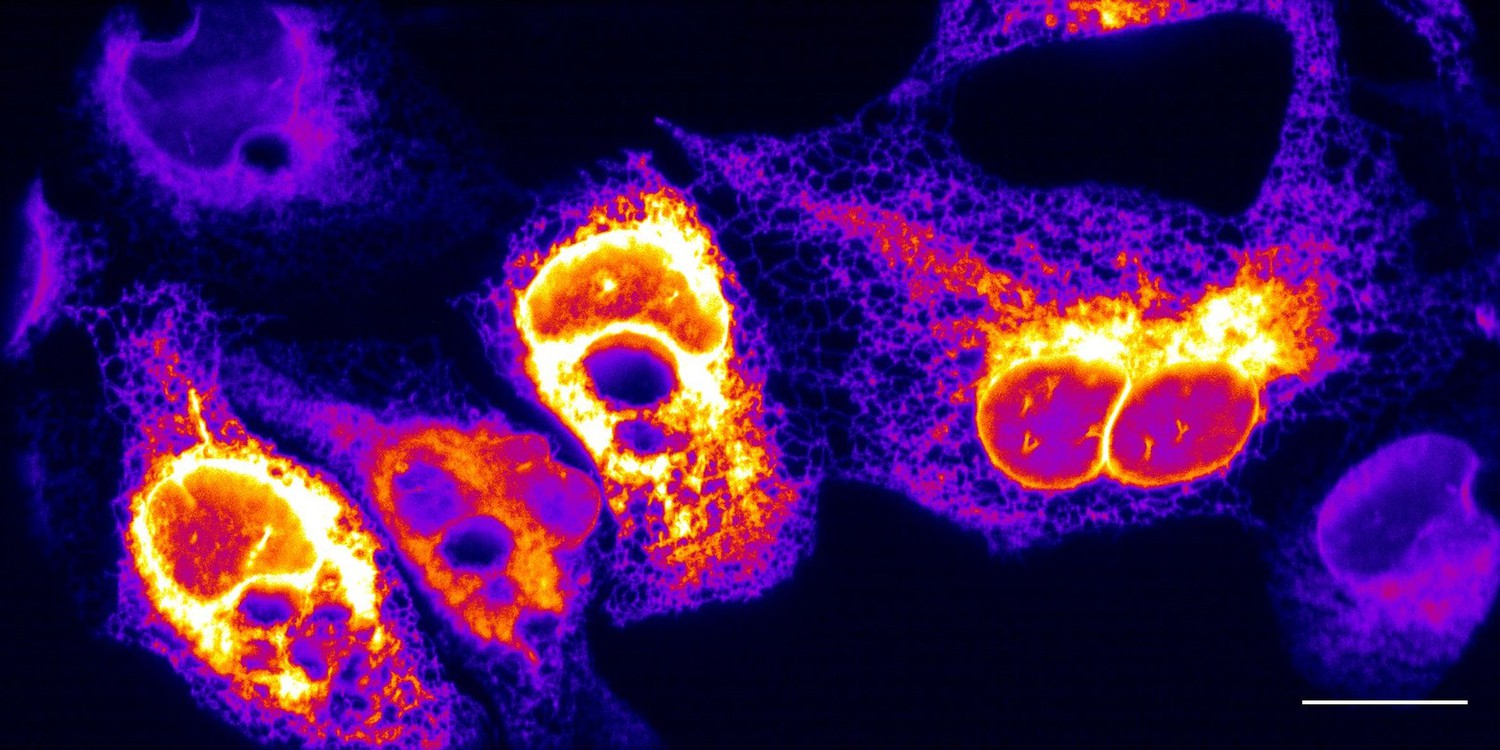
Figure 3 with 2 supplements
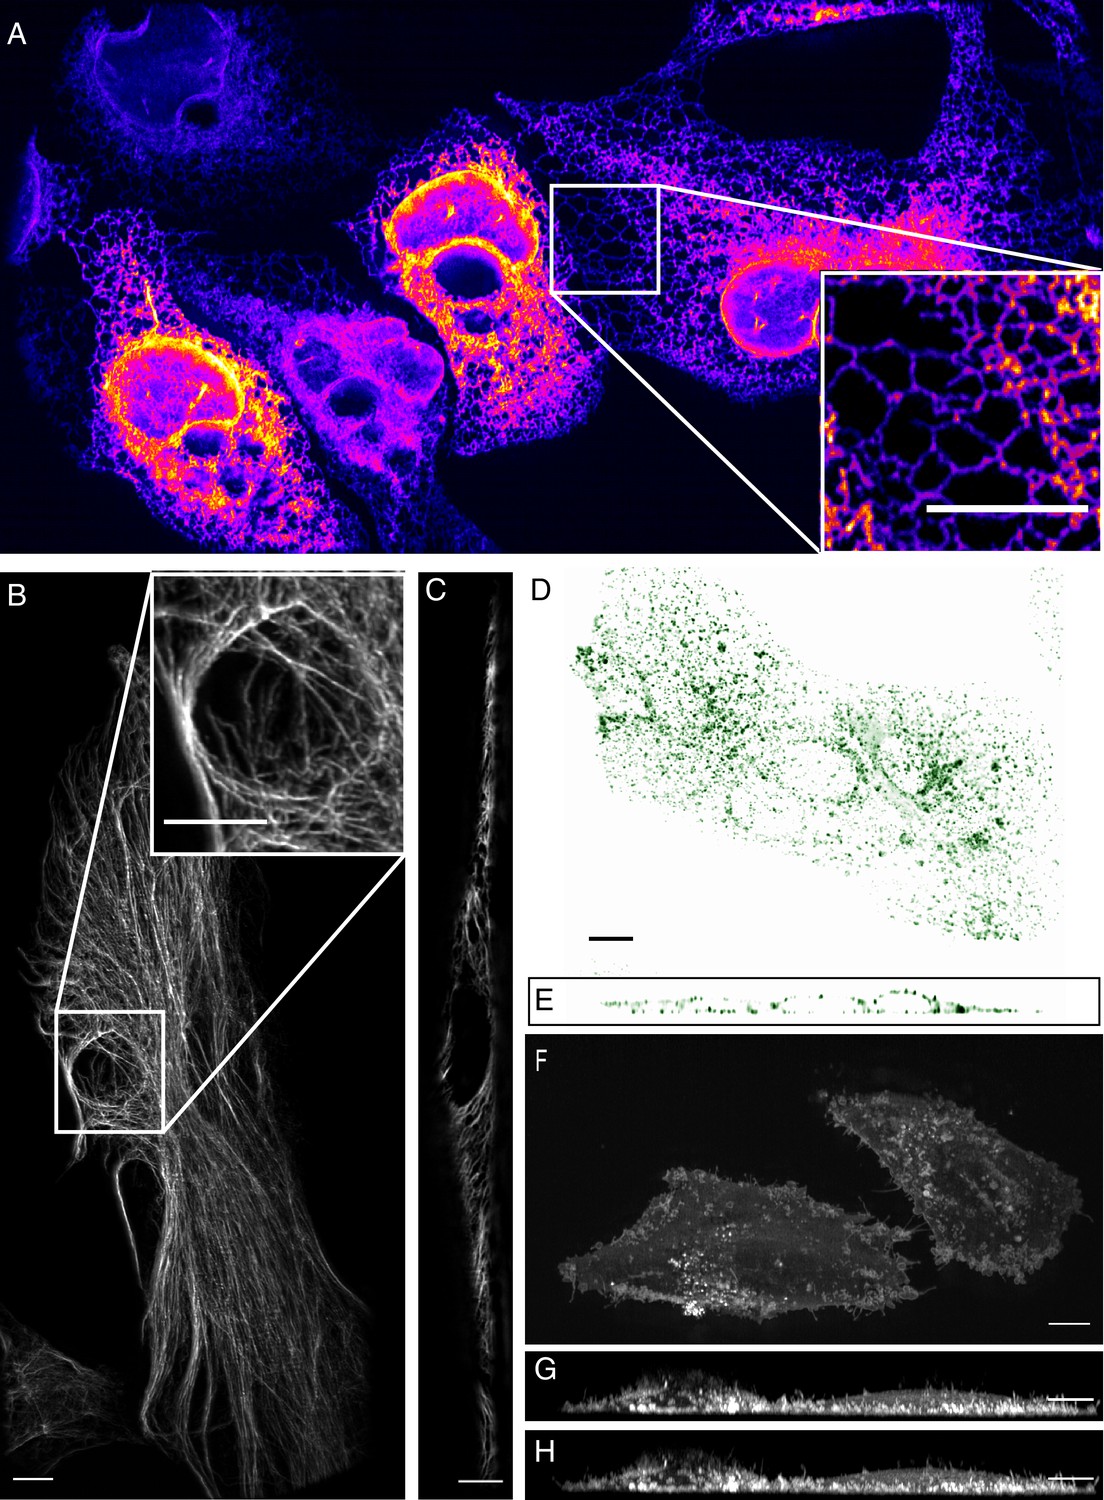
High-resolution biological imaging.
(A) Endoplasmic reticulum in U2OS cells. Inset shows fine details in the dense, tubulated network. The lookup table was selected as it allows visualization of both bright and dim structures. (B) Vimentin in RPE hTERT cells. (C) Single slice through vimentin network. (D) Lateral and (E) axial view of clathrin-mediated endocytosis in ARPE cells. (F) Cortical blebs in MV3 melanoma cells. (G) Cross-section through MV3 cells at the 6th and (H) 12th time point. All data shown in this figure was deconvolved. All Scale Bars are 10 microns.
Figure 3—figure supplement 1
Maximum intensity projection of endoplasmic reticulum in U2OS osteosarcoma cells, without deconvolution.
Scale Bar: 20 microns.
Figure 3—figure supplement 2
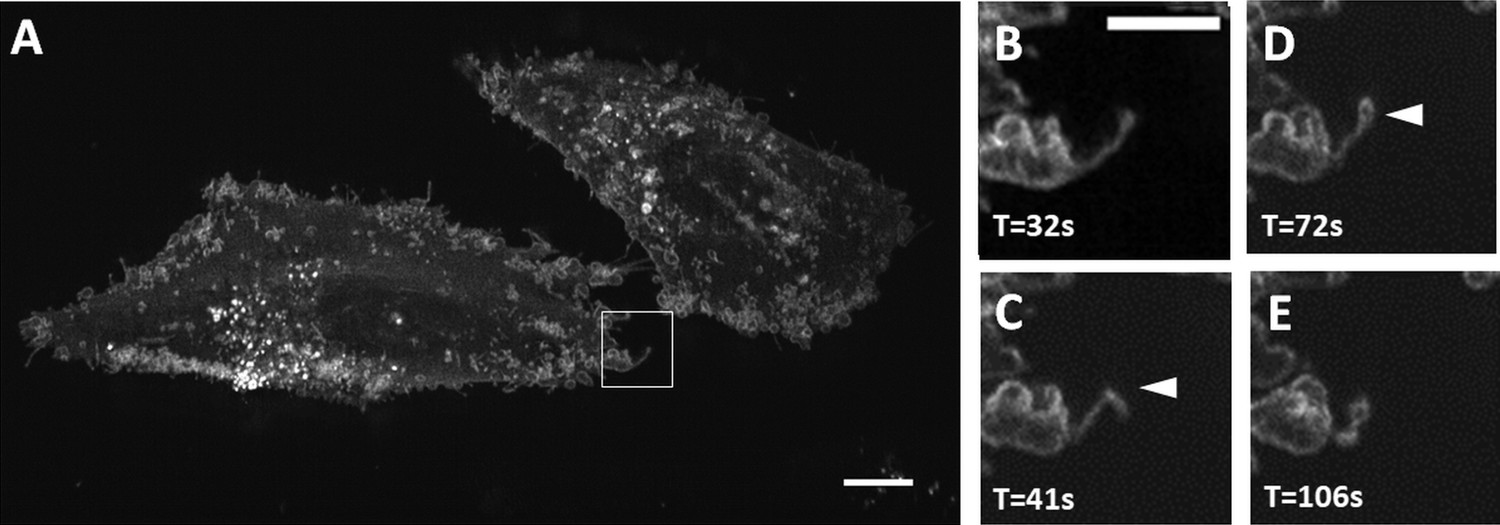
Maximum intensity projection of filopodial buckling events.
(A) MV3 melanoma cells labeled with CAAX-Halo over 150 timepoints. Scale Bar: 10 microns. (B–E) Magnified view of the boxed region in A. Chevron points to a filopodial buckling event, which is followed by bleb formation on the tip of the filopodia. Scale Bar: 5 microns.
Figure 4
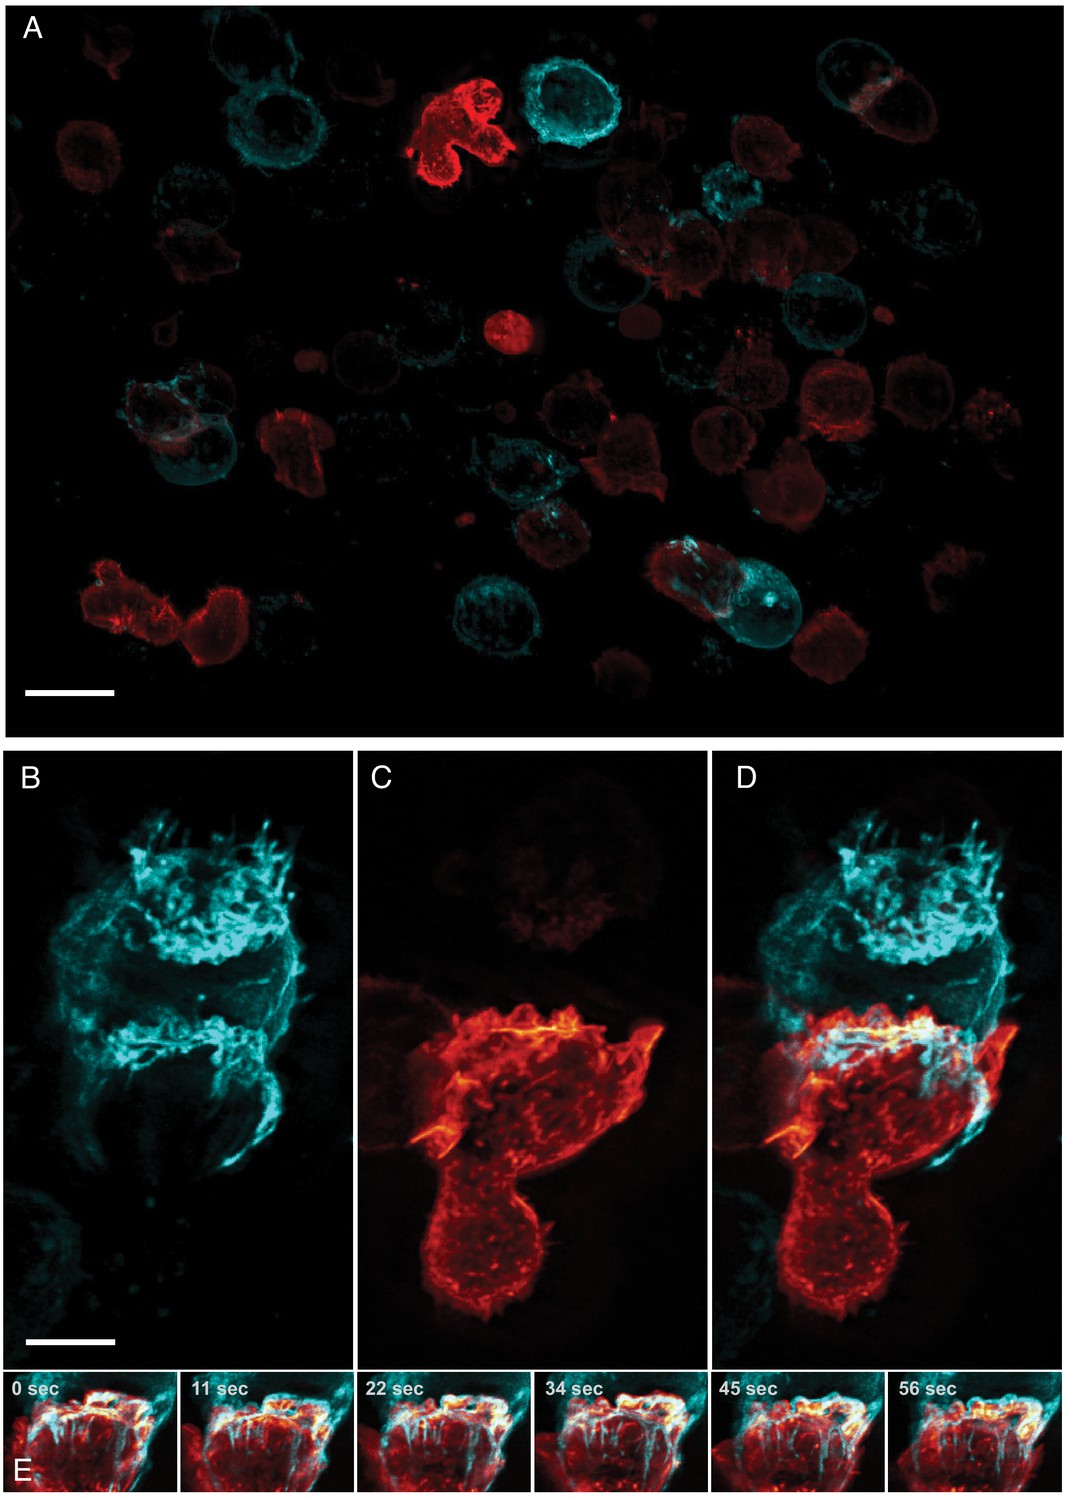
Formation of an immunological synapse between a natural killer cell and a target cell.
(A). Subset of imaging field of view, showing a population of NK-92 natural killer cells expressing Life-Act-mScarlet and K562 leukemic cells expressing Lck-mVenus, which is myristolyated and localizes to the plasma membrane. Scale Bar: 20 microns. (B). K562 leukemic cell. (C) NK-92 natural killer cell. (D) Overlay of NK-92 and K562 cells during the formation and maturation stages of the immunological synapse. Scale Bar: 5 microns. (E) Upon formation of the synapse, centrifugal flows driven by the NK-92 cell results in displacement of the K562 cellular membrane highlighted by the presence of membrane tethers, visible in the left panel and emphasized in the color merged frame sequence (bottom). Data is shown as maximum intensity projection and was deconvolved. Time Interval: 11.33 s.
Figure 5
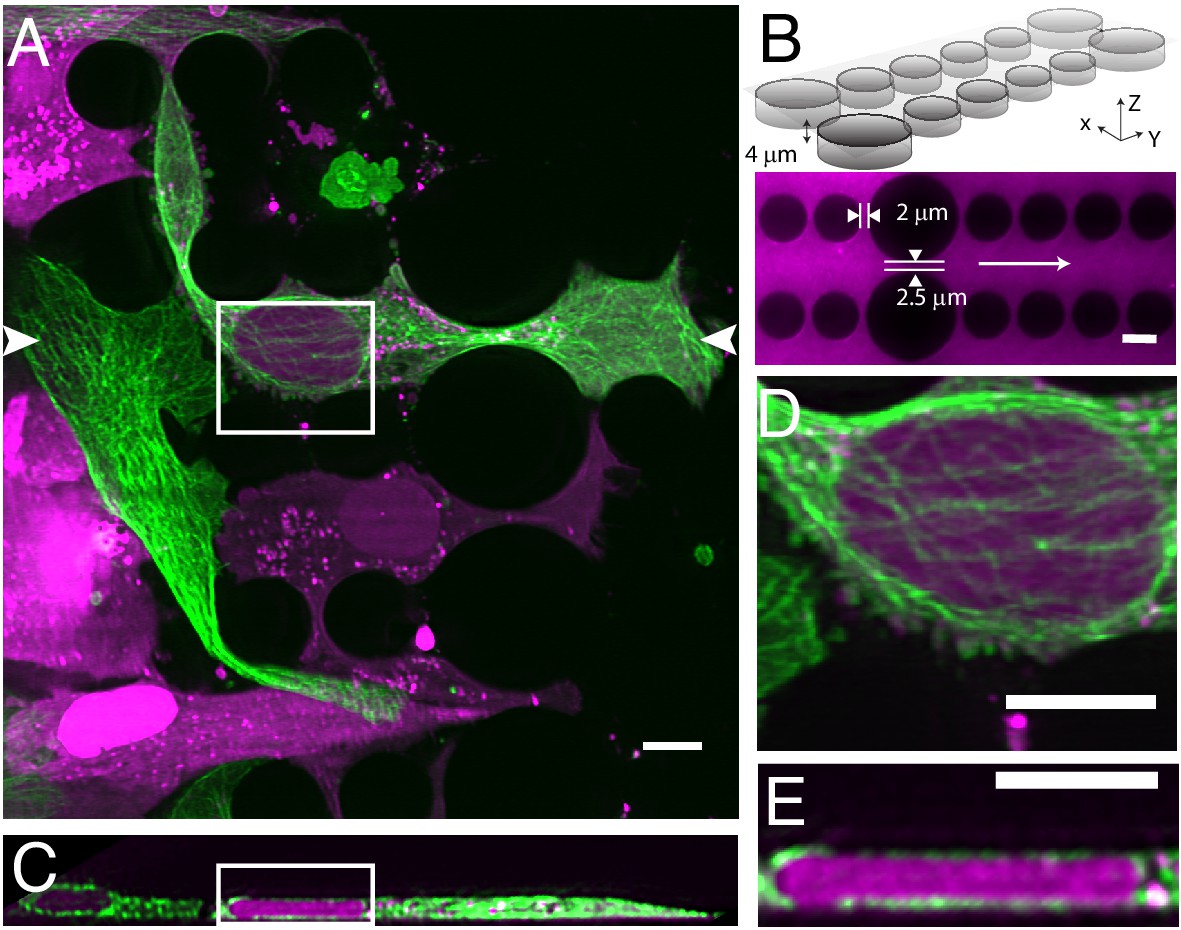
Cell migration through PDMS micro-confinement channels.
(A) 1205Lu metastatic melanoma cells endogenously expressing eGFP-α-tubulin tagged microtubules with CRISPR (green) and a nuclear-localizing red fluorescent protein (3XNLS-mScarlet-I; magenta), migrating through a PDMS microchannel device. (B) Schematic drawing and fluorescence image of microfluidic device filled with TRITC-Dextran, where cells migrate in the horizontal dimension and squeeze between the pillars (large pillars are separated by 2.5 microns, and small pillars are separated by two microns). The white arrow in the fluorescence image marks the migration direction of the cells and also the scan direction (Y) of the light-sheet. (C) Axial cross-section of cells in a microchannel device shows top-down nuclear confinement as cells migrate through 4-micron tall channels. (D) Microtubule protofilaments wrap around both the basal and apical surfaces of the cell when migrating through confined spaces. (E) Zoom of the region shown in C. All data with the exception of (B) was deconvolved. All scale Bars: 10 microns.
Figure 6
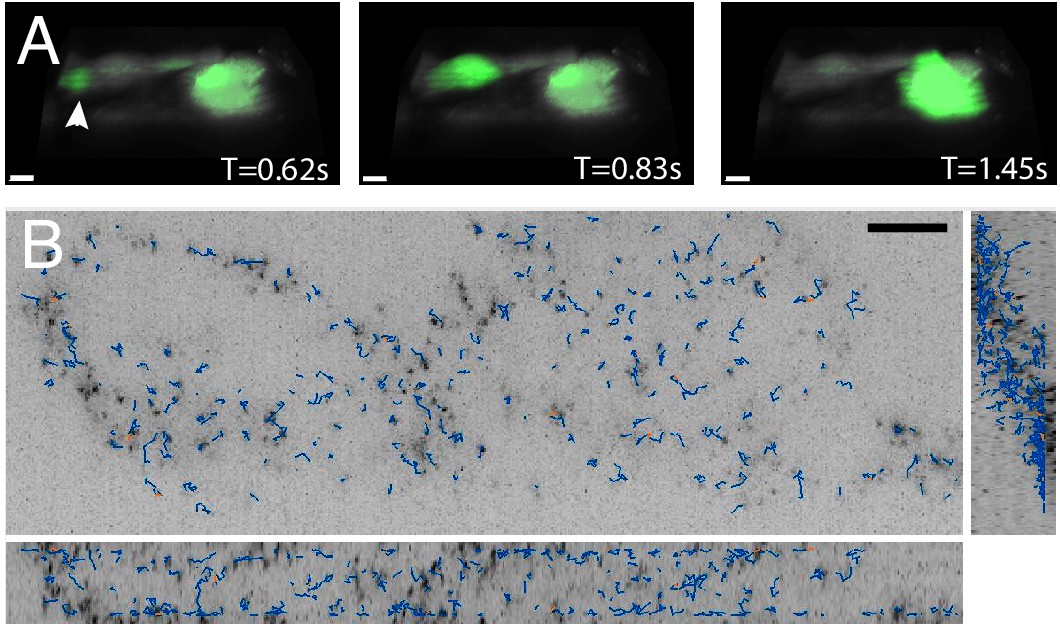
High-speed volumetric imaging of calcium waves and genetically encoded multimeric nanoparticles.
(A) Primary rat cardiomyocytes were labeled with the small-molecule sensor, Fluo-3, and imaged at 10.4 Hz. Deconvolved data is shown. Scale Bar: 10 microns. (B) Imaging rheological tracers in the mammalian cytosol at 13.7 Hz. Deconvolved data is shown. Scale Bar: 10 microns.
Figure 7
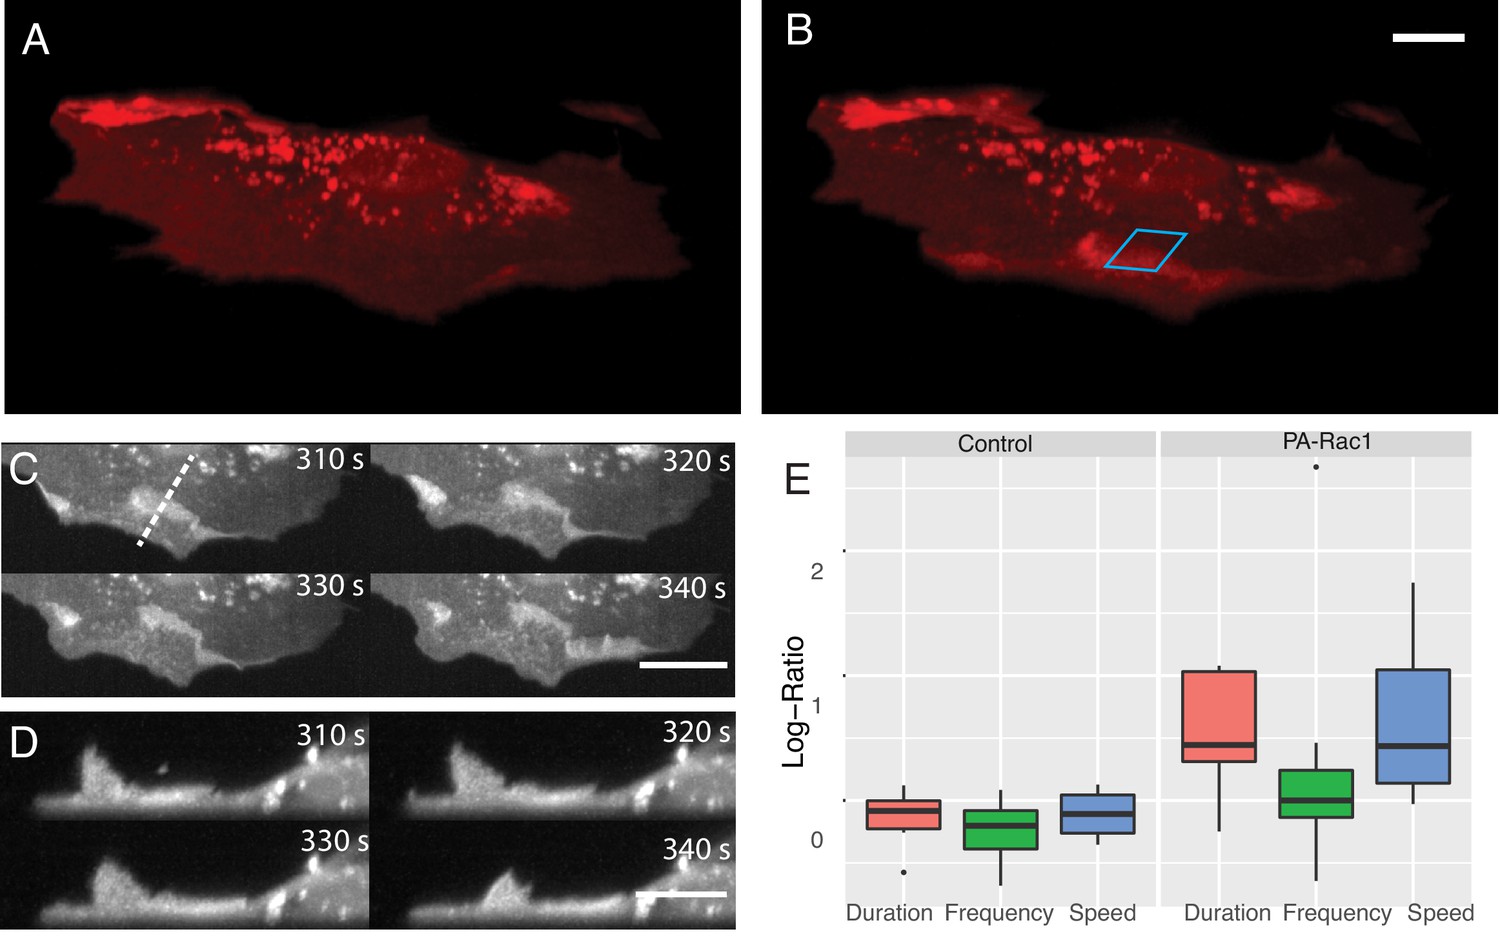
Simultaneous subcellular optogenetic stimulation of PA-Rac1 and volumetric imaging of morphodynamic changes in MEF cells.
(A) Cell before optogenetic stimulation. (B) Localized optical stimulation of PA-Rac1 (within the blue box) was performed with a 488 nm laser operating in a laser-scanned illumination geometry synchronously with volumetric imaging using a 561 nm laser. Scale Bar: 10 microns. (C) Lateral maximum intensity projection of the cell during optical stimulation shows the dorsal ruffles moving from the cell periphery to the juxtanuclear cellular region. Scale Bar: 20 microns. (D) Orthogonal maximum intensity projection along the dotted line in (C) of dorsal ruffles. Scale Bar: 10 microns. (E) Hidden Markov model analysis gives the log-ratio difference between pre activation and activation response showing control cells (N = 6) with no difference in protrusion duration, speed, or frequency while cells expressing PA-Rac1 (N = 7) show statistically significant increases in protrusion speed (p=0.04) and duration (p=0.02) with no significant changes in frequency. All image data shown are raw.
Figure 8 with 1 supplement
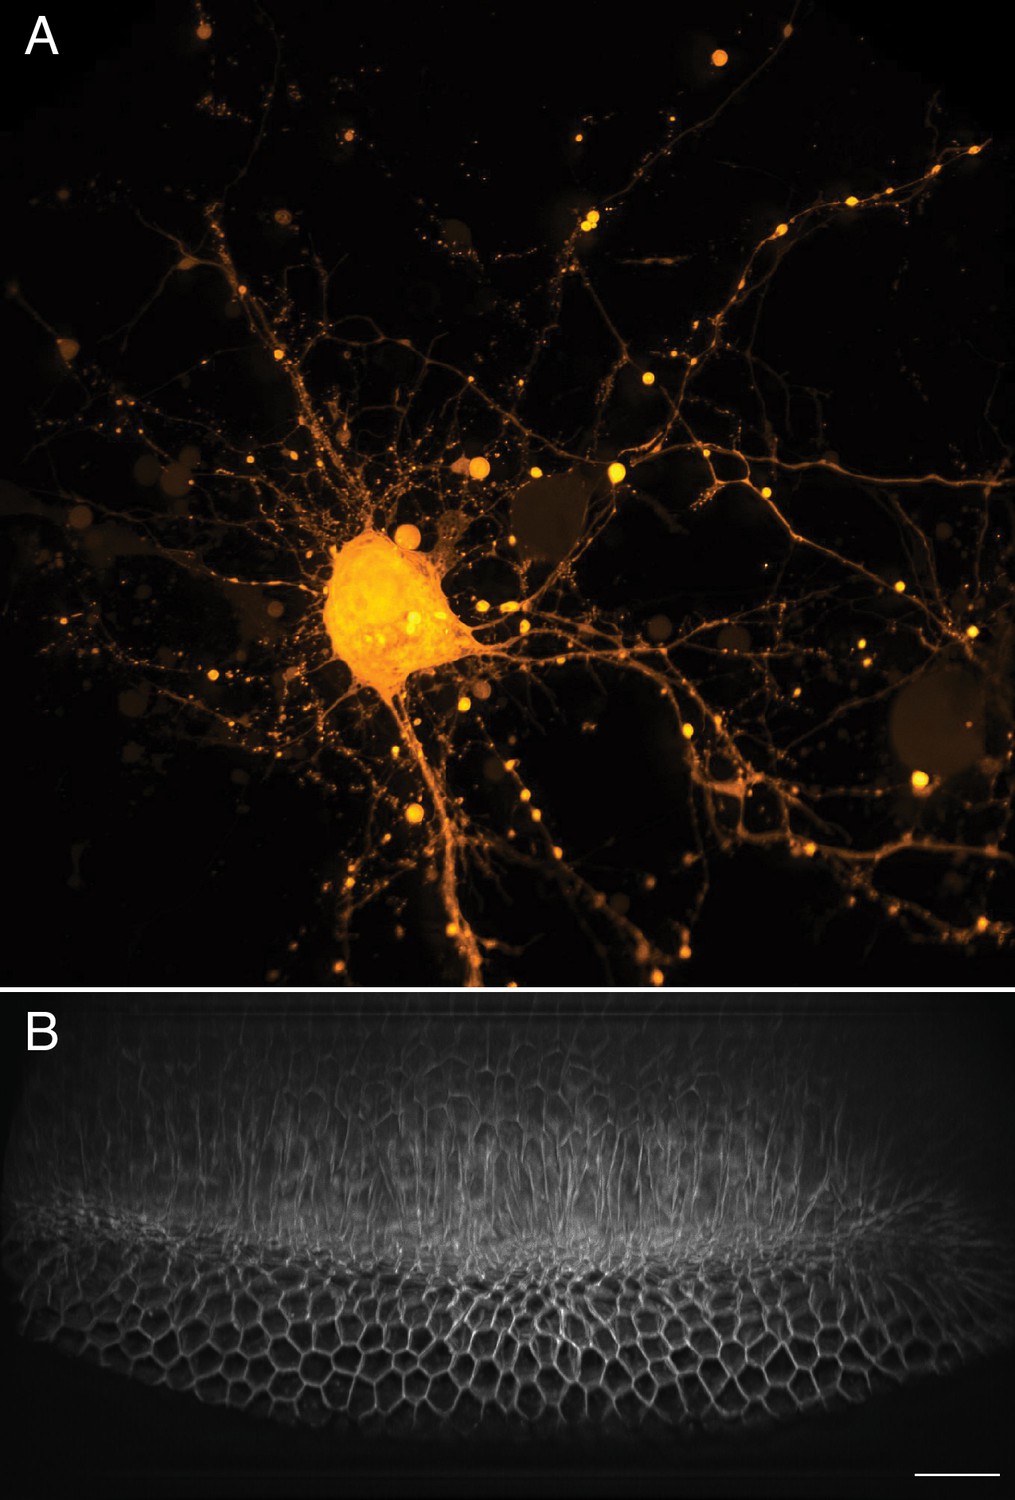
Large-scale imaging of cultured neurons and drosophila embryo gastrulation.
(A) Cultured cortical neurons expressing the Ca2+ biosensor GCaMP6f. Maximum intensity projection of deconvolved data. (B) Stage 6 Drosophila embryo expressing gap43-mCherry. Scale Bar: 20 microns. Maximum intensity projection of deconvolved data is shown in both (A) and (B).
Figure 8—figure supplement 1
Single XS camera view (single slice of a stack) acquired for Drosophila embryo before (A) and after (B) deconvolution.
A low NA (0.06) illumination beam was used. The depth this slice covers in the Z-direction (direction normal to coverslip) amounts to ~25 microns. Scale Bar: 20 microns.
Figure 9 with 2 supplements
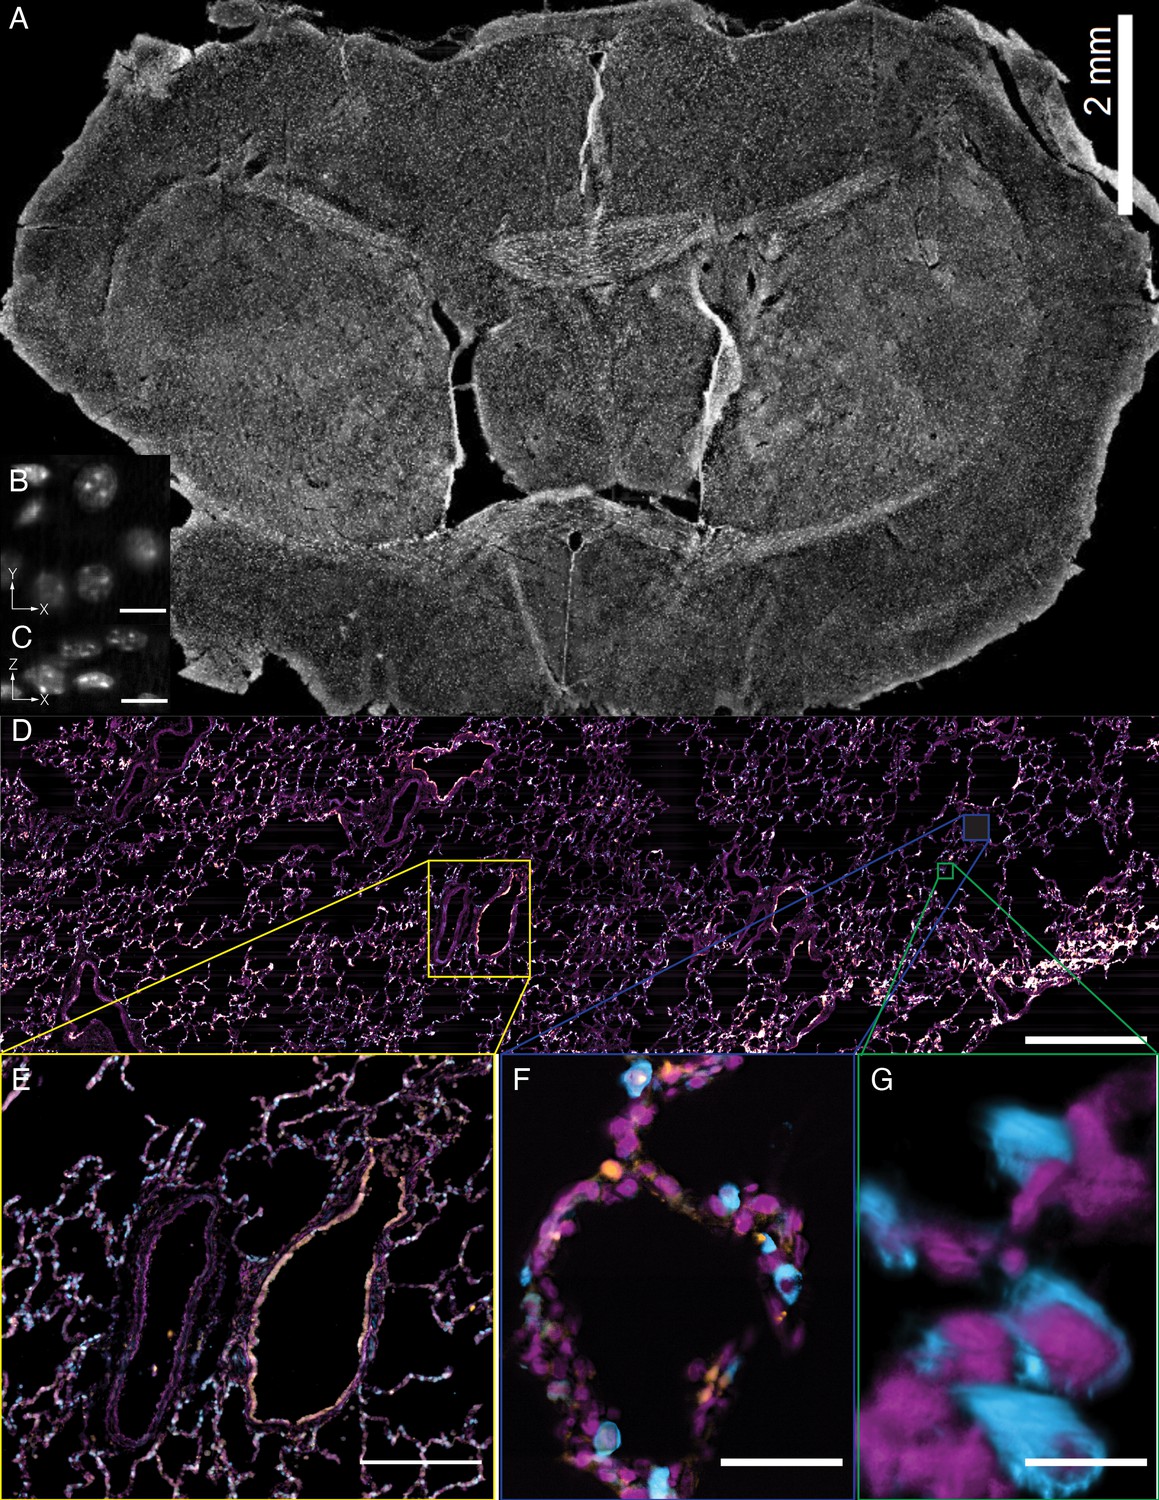
Tissue-scale imaging.
(A) Maximum intensity projection of fused raw image for 30 um thick mouse brain tissue labeled for nuclei Scale Bar: 2 mm. (B) Individual raw XY slice of individual nuclei. Scale Bar: 250 microns. (C) Individual raw YZ slice of data in (B). Scale Bar: 250 microns. (D) Maximum projection of fused raw image for 15 um thick human lung tissue labeled for nuclei (magenta), SFTPC protein (cyan), ACE2 mRNA (orange). Scale Bar: 2 mm. (E) Maximum projection of raw data for yellow box in (A). Scale Bar: 0.5 mm. (F) Maximum projection of raw data for blue box in (A). Scale Bar: 75 microns. (G) 3D rendering of raw data for green box in (A). All data was deconvolved. Scale Bar: 25 microns.
Figure 9—figure supplement 1
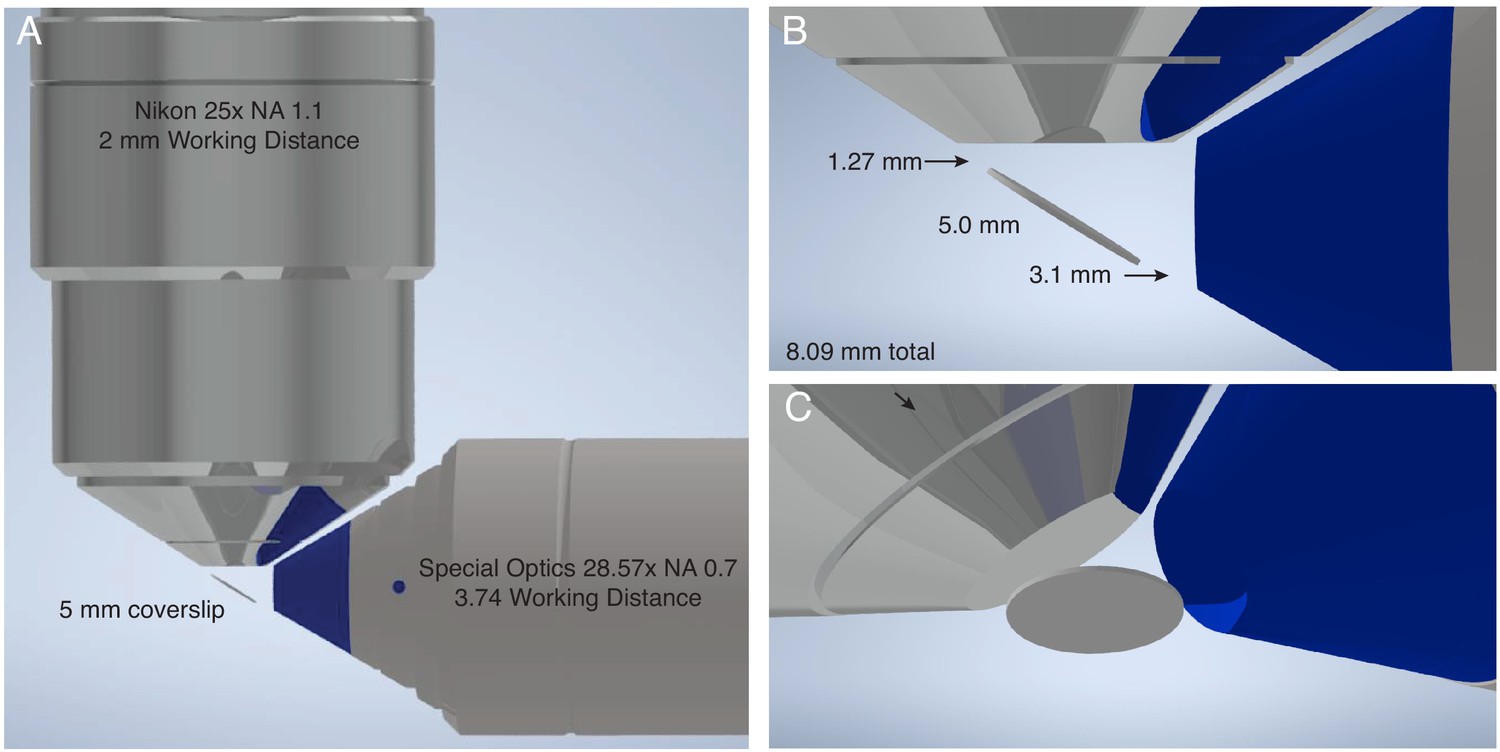
Geometric considerations for the maximum sample size of lattice light-sheet microscopy.
(A) CAD rendering of most common objective combination used for lattice light-sheet microscopy. Illumination performed with a Special Optics 28.6x NA 0.66 objective with a 3.74 mm working distance. Detection is performed with a Nikon 25x NA 1.1 objective with a 2 mm working distance. (B) The sample is positioned on a #1.5 glass coverslip with a diameter of 5 mm at 32-degrees relative to the optical axis of the detection objective. Thus, in the absence of any sample mounting, only 3.089 mm is available for imaging prior to colliding with either the illumination or detection objective in the plane of the figure, whereas the sample can be scanned an arbitrary distance into and out of the plane of the figure. (C) An alternative perspective of the illumination and detection objectives, and the 5 mm coverslip.
Figure 9—figure supplement 2
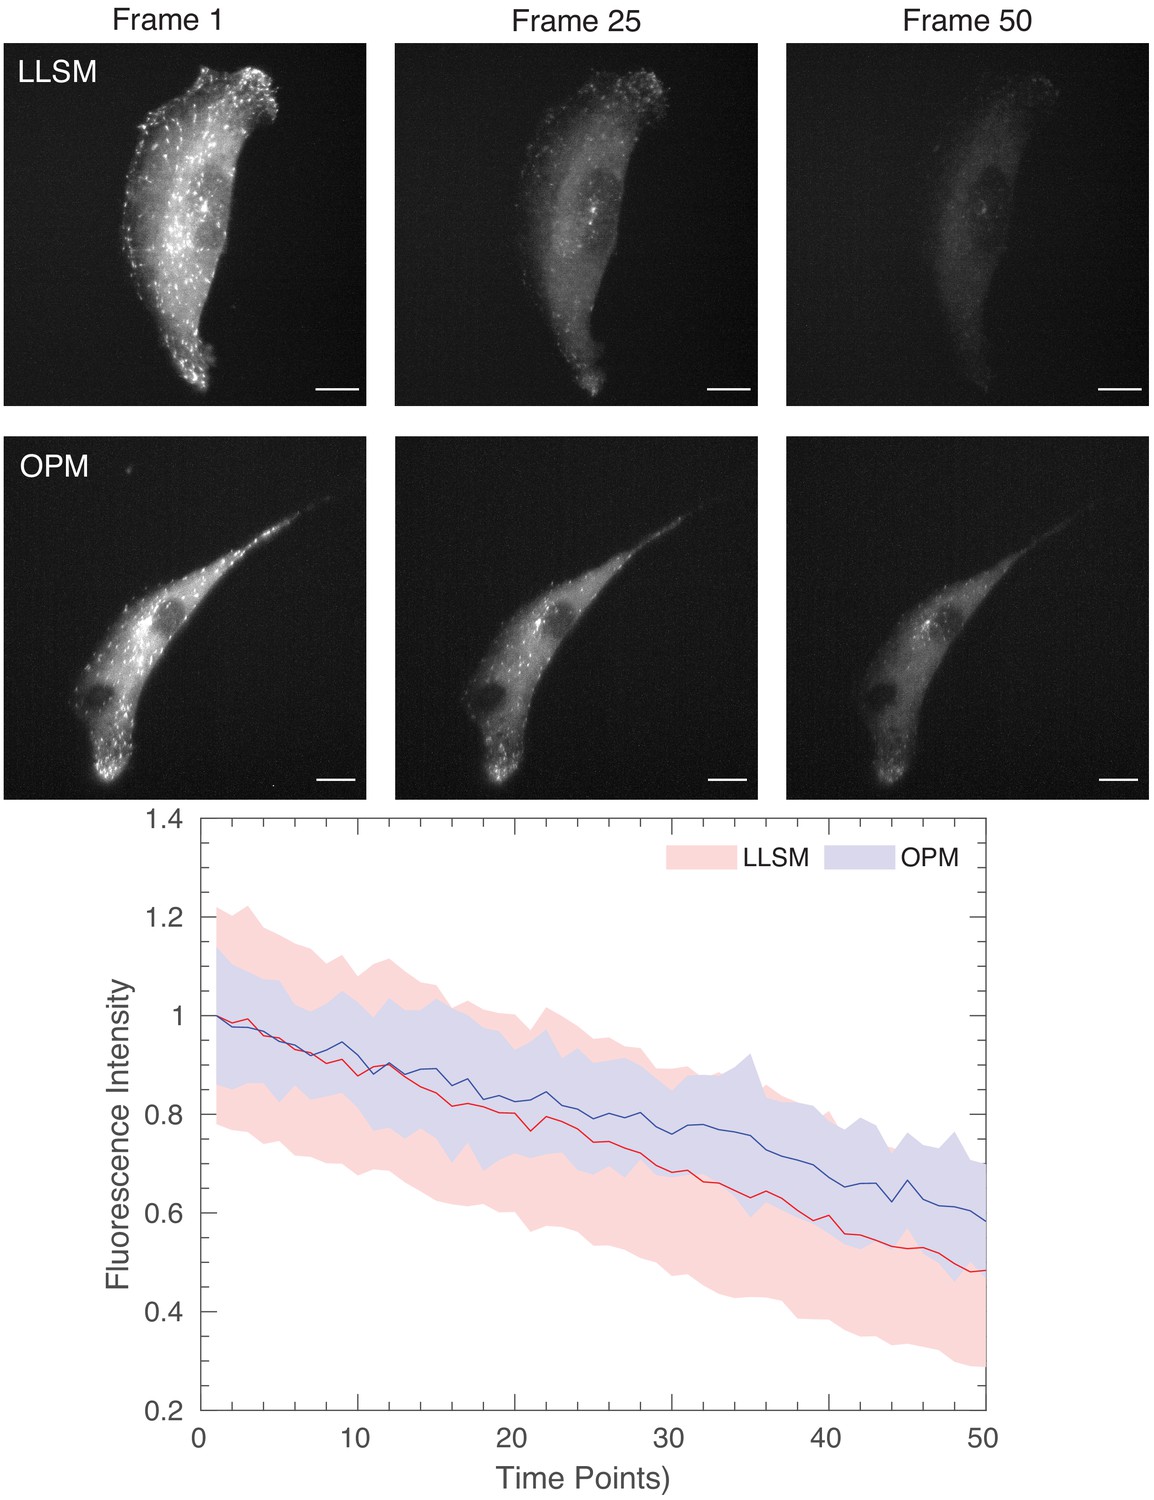
Photobleaching comparison for lattice light-sheet microscopy and OPM.
(Top) Images of ARPE cells expressing mNeonGreen-EB3 from a truncated CMV promoter and imaged with a Lattice Light-Sheet Microscope using a square lattice illumination pattern. (Middle) Images of ARPE cells expressing the same construct but imaged with an OPM. (Bottom) Normalized fluorescence intensity of EB3 comets, as detected with uTrack. Mean is shown as a line, and solid bands represent the mean ± 1 standard deviation. Scale Bar: 10 microns.
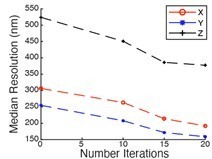
Author response image 1
Videos
Video 1
Endoplasmic reticulum dynamics in osteosarcoma U2OS cells expressing Sec61-GFP.
Time Interval: 0.84 s. Scale Bar: 10 microns.
Video 2
3D stack of RPE hTERT cells expressing GFP-vimentin.
Data has been deconvolved and sheared into its proper Euclidian position. Scale Bar: 20 microns.
Video 3
3D stack of ARPE cells tagged with AP2-GFP, a marker for clathrin-mediated endocytosis.
Data has been deconvolved and sheared into its proper Euclidian position. Scale Bar: 10 microns.
Video 4
Maximum intensity projection of ARPE cells tagged with AP2-GFP, a marker for clathrin-mediated endocytosis.
Time Interval: 1.34 s. Scale Bar: 20 microns.
Video 5
MV3 cells expressing the biorthogonal membrane marker, CAAX-Halo-Tag, labeled with Oregon Green.
Time Interval:1.09 seconcs, Scale Bar: 10 microns.
Video 6
An NK-92 natural killer cell forming an immunological synapse with a target cell.
The NK-92 cell (Natural Killer cell line) was labeled with Life-Act-mScarlet, and is shown in orange. The target cell (K562 leukemia cell line) was labeled with Lck-mVenus and is shown in cyan. Time Interval:11.33 s. Scale Bar: 10 microns.
Video 7
1250Lu metastatic melanoma cells expressing GFP-alpha-tubulin (green) and a 3XNLS-mScarlet-I nuclear marker (magenta).
Nuclei often undergo compression and rupture as cell migrate and squeeze through pillars. Time Interval: 29.88 s. Scale Bar: 10 microns.
Video 8
3D rendering of primary cardiomyocyte stained with Fluo-3, a small-molecule sensor for calcium (II).
Green indicates fluctuations in intracellular calcium levels, and gray represents the cell boundary (calculated as an average of all imaging frames). Time Interval: 0.096 s. Scale Bar: 10 microns.
Video 9
Orthogonal maximum intensity projections of MV3 cells expressing cytosolic GEMs as rheological tracers.
Particles were detected and tracked with the uTrack-3D software package. Time Interval: 0.073 s.
Video 10
Animation of light-sheet scanning and optogenetic activation.
Blue rays represent the light-sheet illumination, and green rays indicate the near-diffraction-limited epi-illumination. Both beams are scanned with a mirror galvanometer (bottom) that is conjugate to the back focal plane of the primary objective (top).
Video 11
Mouse embryonic fibroblasts expressing PA-Rac1 and mCherry.
Movie shows 15 min in the absence of optical stimulation followed by 15 min of optical stimulation. The blue rectangle shows region undergoing optical stimulation with 488 nm light. An axial cross-section of the region in green is shown at the bottom. Scale Bar: 10 microns. Time Interval: 10 s.
Video 12
MEF PA-Rac1-mCherry cell movie same as Video 11 show cell dynamics with Imaris 3D rendering.
Time Interval: 10 s. Scale Bar: 10 microns.
Video 13
Dissociated cortical neurons expressing the Ca2+ biosensor GCaMP6f, imaged volumetrically at 7 Hz.
Scale Bar: 20 microns.
Video 14
Stage 6 Drosophila embryo undergoing gastrulation.
Ventral furrow ingression occurs along the anteroposterior axis of the embryo and is immediately followed by rapid epithelial mitotic events. Time Interval: 23 s.
Video 15
Z-stack of raw data for 30-micron thick slice of coronal mouse brain tissue.
Sub-nuclear features such as nucleoli, are readily evident owing to the high-resolution and optical sectioning of the OPM.
Video 16
Volumetric rendering of deconvolved data for human lung tissue as imaged with the stage-scanning variant of the OPM, which permits imaging of cm-scale objects.
Nuclei (magenta) and SFTPC protein (cyan). SFTPC is a commonly used cytosolic marker of alveolar type 2 cells, which is resolved with subcellular resolution in 3D. Scale Bar: 10 microns.
Additional files
-
Supplementary file 1
Description of sample type, fluorescent labels, imaging conditions, data post-processing, and rendering, for each figure.
- https://cdn.elifesciences.org/articles/57681/elife-57681-supp1-v5.docx
-
Supplementary file 2
Encoding probe sequences for proximity ligation RNA fluorescence in situ hybridization.
- https://cdn.elifesciences.org/articles/57681/elife-57681-supp2-v5.docx
-
Supplementary file 3
Source, authentication method, and routine testing performed on cell lines.
- https://cdn.elifesciences.org/articles/57681/elife-57681-supp3-v5.docx
-
Transparent reporting form
- https://cdn.elifesciences.org/articles/57681/elife-57681-transrepform-v5.docx
Download links
A two-part list of links to download the article, or parts of the article, in various formats.
Downloads (link to download the article as PDF)
Open citations (links to open the citations from this article in various online reference manager services)
Cite this article (links to download the citations from this article in formats compatible with various reference manager tools)
A versatile oblique plane microscope for large-scale and high-resolution imaging of subcellular dynamics
eLife 9:e57681.
https://doi.org/10.7554/eLife.57681


