Epithelial colonies in vitro elongate through collective effects
- Laboratory of Cell Physics ISIS/IGBMC, CNRS and Université de Strasbourg, France
- Institut de Génétique et de Biologie Moléculaire et Cellulaire, France
- Centre National de la Recherche Scientifique, UMR7104, France
- Institut National de la Santé et de la Recherche Médicale, U964, France
- Department of Civil Engineering, Indian Institute of Technology Bombay, Powai, India
- Department of Mechanical Engineering, Indian Institute of Technology Bombay, Powai, India
- The Francis Crick Institute, United Kingdom
- Max Planck Institute for the Physics of Complex Systems, Germany
- Cluster of Excellence Physics of Life, Germany
Abstract
Epithelial tissues of the developing embryos elongate by different mechanisms, such as neighbor exchange, cell elongation, and oriented cell division. Since autonomous tissue self-organization is influenced by external cues such as morphogen gradients or neighboring tissues, it is difficult to distinguish intrinsic from directed tissue behavior. The mesoscopic processes leading to the different mechanisms remain elusive. Here, we study the spontaneous elongation behavior of spreading circular epithelial colonies in vitro. By quantifying deformation kinematics at multiple scales, we report that global elongation happens primarily due to cell elongations, and its direction correlates with the anisotropy of the average cell elongation. By imposing an external time-periodic stretch, the axis of this global symmetry breaking can be modified and elongation occurs primarily due to orientated neighbor exchange. These different behaviors are confirmed using a vertex model for collective cell behavior, providing a framework for understanding autonomous tissue elongation and its origins.
Introduction
Tissue elongation is a central morphogenetic event occurring in many organisms during development (Lecuit and Lenne, 2007; Guillot and Lecuit, 2013), such as Drosophila or Caenorhabditis elegans. The tissue is transformed both in terms of area and shape. Such transformation takes place within typically hour timescale with or without cell division. During this process, symmetry of cells and tissues is broken by different mechanisms, such as neighbor exchange (Rauzi et al., 2008; Rauzi et al., 2010), cell elongation (Ciarletta et al., 2009; Vuong-Brender, 2016), and oriented cell division (Campinho et al., 2013). Rearrangement of neighboring cells or T1 transitions is essential in the germ band extension of Drosophila (Rauzi et al., 2008; Rauzi et al., 2010), allowing a group of cells to change their position by intercalation, eventually leading to tissue elongation. Cell deformation drives the threefold elongation process in C. elegans (Ciarletta et al., 2009; Vuong-Brender, 2016) while keeping the number of cells and their positions fixed. Finally, epithelial spreading during zebrafish epiboly is promoted by oriented cell divisions as a mechanism to limit tension (Campinho et al., 2013). Those mechanisms can act alone or in combination as in Drosophila pupal wing elongation (Etournay et al., 2015). While the phenomenon is known to involve remodeling of adherens junctions (Rauzi et al., 2010) and acto-myosin (He et al., 2010; Rauzi et al., 2010) at the molecular level, mesoscopic mechanisms leading to distinct morphogenesis processes are poorly understood. This is partly because inputs from morphogen gradients (Gilmour et al., 2017) or from neighboring tissues (Zhang et al., 2011; Etournay et al., 2015) can affect tissue autonomous self-organization in vivo. For example, changes in tissue shape can be influenced by neighboring tissues such as the cuticle and the blade in the Drosophila pupal wing elongation (Etournay et al., 2015), the coordination between amnioserosa and epidermis in dorsal closure (Hayes and Solon, 2017), and the muscle layer in gut development (Shyer et al., 2013) or in C. elegans morphogenesis (Zhang et al., 2011). Since in vivo, epithelial tissues are surrounded by other tissues and the cellular dynamics leading to elongation can result from interactions between tissues and boundary conditions, it is therefore difficult to disentangle cell intrinsic from externally mediated behaviors. In this context, it appears important to characterize elongation in an in vitro system where the epithelial tissue undergoes shape transition autonomously.
Here, we use in vitro experiments and numerical simulations to characterize the spontaneous behavior of a growing cell colony in vitro. We designed an assay to study the spontaneous elongation of a tissue that is not subjected to external orienting input, we studied the appearance of the symmetry breaking, and the effect that external forces have in this process. We show that in vitro tissue elongation arises from anisotropy in the average cell elongation. This anisotropy sets the direction along which boundary cells migrate radially outwards resulting in a non-isotropic elongation that arises primarily through cell elongation. For colonies submitted to a time periodic uniaxial stretch, the axis of global symmetry breaking can be imposed by external force, and tissue elongation arises through oriented neighbor exchange. Emergence of radially migrating cells and the interplay between cell elongation and cell rearrangements are confirmed by numerical simulations based on a vertex model. Our results suggest that spontaneous shape deformation is related to the mean orientation of the nematic cell elongation field in the absence of any external input. This provides a framework to explain autonomous tissue elongation and how contributions from different mesoscopic mechanisms can be modulated by external forces.
Results
Isotropic colonies elongate in a non-isotropic manner
To study the spontaneous tissue deformation arising during epithelial growth, we designed an in vitro assay to track symmetry breaking, both spontaneous and driven by external force. We prepared isotropic colonies of Madin Darby Canine Kidney (MDCK) cells, which assume features of epithelial cells in vivo (Reinsch and Karsenti, 1994; Adams et al., 1998; Reffay et al., 2014), such as adherens junctions (Adams et al., 1998), cytoskeletal components, and the Rho signaling pathway regulating cell shapes and dynamics (Reffay et al., 2014; Fodor et al., 2018). The initial size and shape of the colonies were controlled by plating cells in microfabricated circular stencils (Ostuni et al., 2000). When cells reached confluency, the stencil was removed at time t0. Cell dynamics was followed over time by phase contrast (Video 1) or fluorescence microscopy with strains labeled with GFP cadherin (Figure 1b), that allowed to observe the behavior of individual cells. We observed that large colonies (750 µm in diameter) expanded isotropically (Figure 1—figure supplement 1). In contrast, colonies of 250 µm in diameter (Figure 1b), the typical coherence length of such epithelial tissues (Doxzen et al., 2013), expanded in a non-isotropic manner (Figure 1c). We then further characterized the process of symmetry breaking.
Figure 1 with 2 supplements see all
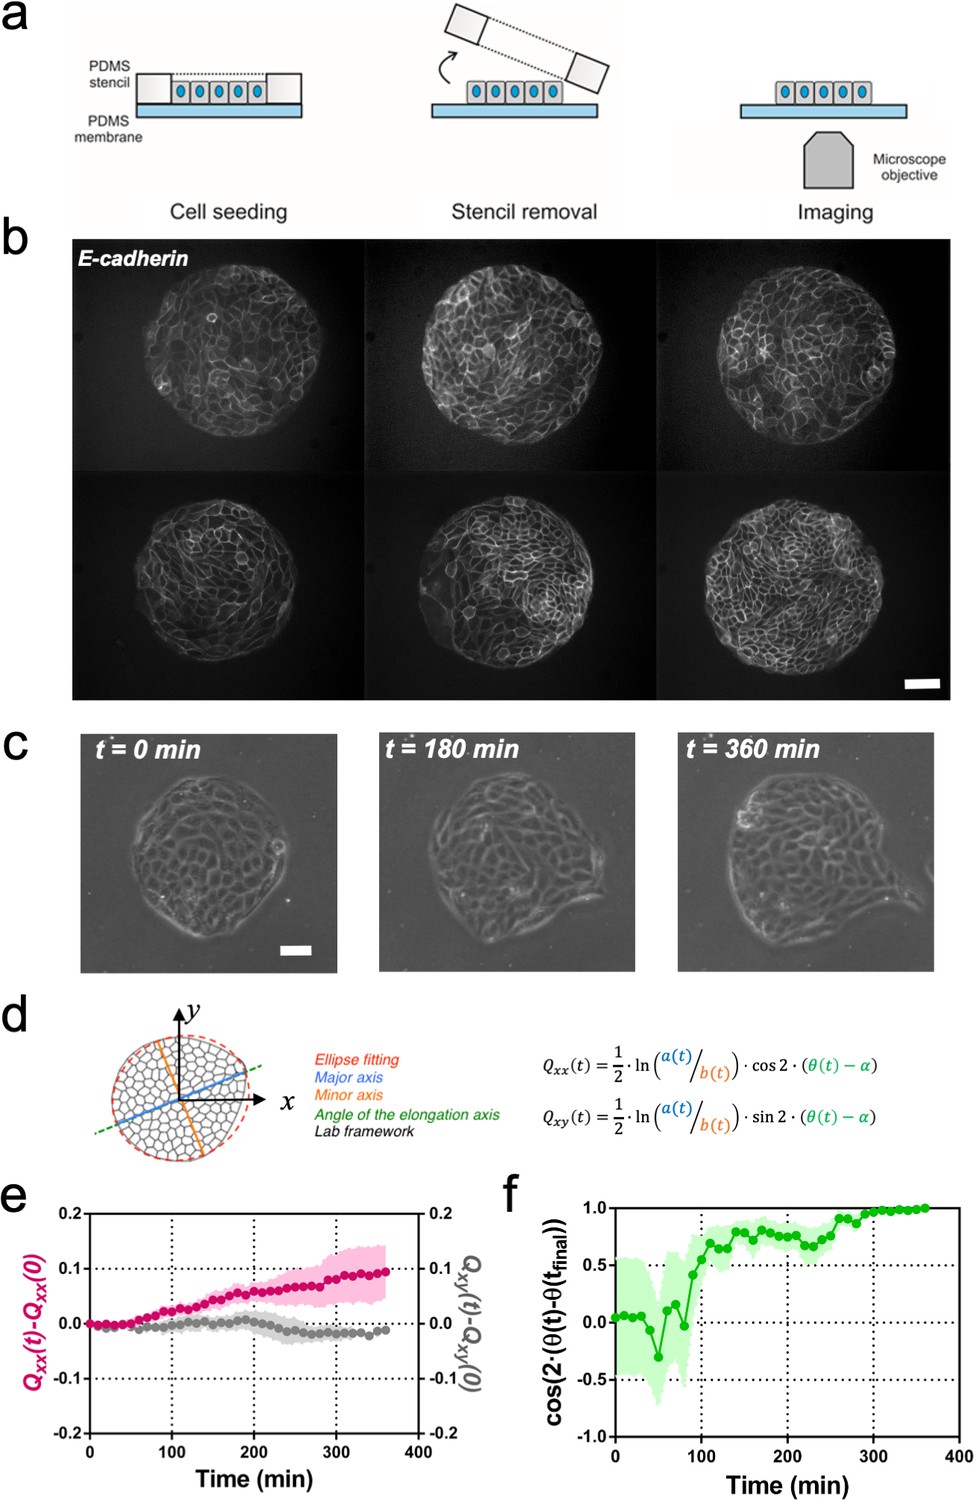
Symmetry breaking and its quantification.
(a) Schematics of the experimental set-up: Madin Darby Canine Kidney (MDCK) cells were seeded on a poly(dimethylsiloxane) (PDMS) membrane using stencils to predefine their shape. When the colony was confluent, the stencil was removed and the expansion of the colony was observed under the microscope. (b) Several examples of MDCK colonies (GFP-E-cadherin) after stencil removal and prior to colony expansion. Scale bar 50 µm. (c) Phase contrast images of the spontaneous elongation of an MDCK colony for 360 min. Scale bar 50 µm. (d) Colony elongation is quantified by ellipse fitting and Qxx and Qxy measurement referred to the elongation axis (α = θ(tfinal)). (e) Qxx (left y axis) and Qxy (right y axis) during 360 min of colony expansion. Mean value ± standard error of the mean, n = 4 colonies from N = 4 independent experiments. (f) Cosine of two times the angle difference between the instantaneous main direction of the colony (θ(t)) and the main direction of the colony at 360 min (θ(tfinal)). Colonies set the elongation direction within the first 120 min. Mean value ± standard error of the mean, n = 4 colonies from N = 4 independent experiments.
-
Figure 1—source data 1
The Qxx(t)-Qxx(0) and Qxy(t)-Qxy(0) of individual colonies used in panel (e) and the raw values of cos(2·(θ(t)-θ(tfinal))) used in panel (f) of Figure 1.
- https://cdn.elifesciences.org/articles/57730/elife-57730-fig1-data1-v2.xlsx
Video 1
Spontaneous symmetry breaking of circular colonies.
Time-lapse of a Madin Darby Canine Kidney (MDCK) cells colony freely evolving after removal of a poly(dimethylsiloxane) (PDMS) stencil. Time in hh:mm. Scale bar 50 μm.
In order to compare elongations in each experiment, we quantified the breaking of symmetry by ellipse-fitting the colony shape. Shape change analysis was quantified by a nematic shape elongation tensor Q. It has two independent components defined as Qxx = ½ ln(a/b)cos(2•(θ − α)) and Qxy = ½ ln(a/b)sin (2•(θ − α)), where a corresponds to the major axis, b to the minor axis, θ to the orientation of the major axis of the ellipse and α = θ(tfinal) (Figure 1d). As can be seen in Figure 1e, MDCK colonies elongated persistently along the main axis of elongation (Qxx > 0 and Qxy ≈ 0) for 6 hr (Figure 1e). In addition, we explored if other epithelial cell lines would behave in a similar manner. Circular epithelial colonies of human epithelial colorectal adenocarcinoma cells (Caco2) and human mammary epithelial cells (MCF-10A) also elongated along the main axis of elongation and by the same magnitude that MDCK cells (Figure 1—figure supplement 2). We note that elongation observed during this time for the three epithelial cell lines was similar in magnitude to tissue elongation observed during in vivo morphogenesis, for instance in the wing blade in Drosophila (Etournay et al., 2015). Moreover, the elongation direction (θfinal = θ (t = 6 h)) converges to a constant value within 2 hr after t0 (Figure 1f). Altogether, large circular epithelial colonies (750 µm in diameter) expand isotropically, whereas small colonies (250 µm in diameter) expand in a anisotropic manner and shape symmetry breaking takes place within the first 2 hr. As a result, we focus here on these first 2 hr during which the elongation axis is established.
Cyclic uniaxial stretching rectifies symmetry breaking
It has been previously described for C. elegans embryo elongation (Zhang et al., 2011) and in other organisms (Zhang and Labouesse, 2012) that time periodic stretch can play a role in morphogenesis. Motivated by these observations, we explored whether oscillatory external forces could have an impact on the direction of elongation. We designed an experimental setup where elongating colonies were submitted to cyclic uniaxial stretching (Figure 2a and Video 2). Mechanical cycles of contraction-relaxation can range from 1 s in C. elegans epithelial elongation (Zhang et al., 2011) up to 200 s in dorsal closure (Solon et al., 2009). So, we explored frequencies and extensions around physiological values (Zhang and Labouesse, 2012). We selected three different cycle durations (20, 60, and 120 s period) and three different stretching conditions (5%, 10% and 15% strain). The stretch was applied to a silicon membrane and was transmitted to the colony. We then fitted the colonies shapes with ellipses at successive time and quantified Qxx and Qxy with respect to the angle of uniaxial stretching (set as x-axis, α = 0). Figure 2—figure supplement 1 shows the value of the components of the tensor Q along time for the different strains and periods tested. Among different conditions, we observed colony elongation along the direction imposed by the external strain when we stretched cyclically with 60 s timescale and 5% strain (Figure 2b and Video 3). The overall elongation of colonies under cyclic uniaxial stretching was similar to the spontaneous elongation in the absence of externally applied uniaxial stretching during the first 2 hr (Figure 2c). Also, the magnitude of the shape elongation tensor Q under cyclic uniaxial stretching was comparable to the spontaneous elongation of colony when stretch was not applied, but elongation was oriented in the direction of externally applied uniaxial cyclic stretching (Figure 2d). Therefore, application of an external cyclic force can rectify symmetry breaking and set the direction of tissue elongation.
Figure 2 with 1 supplement see all
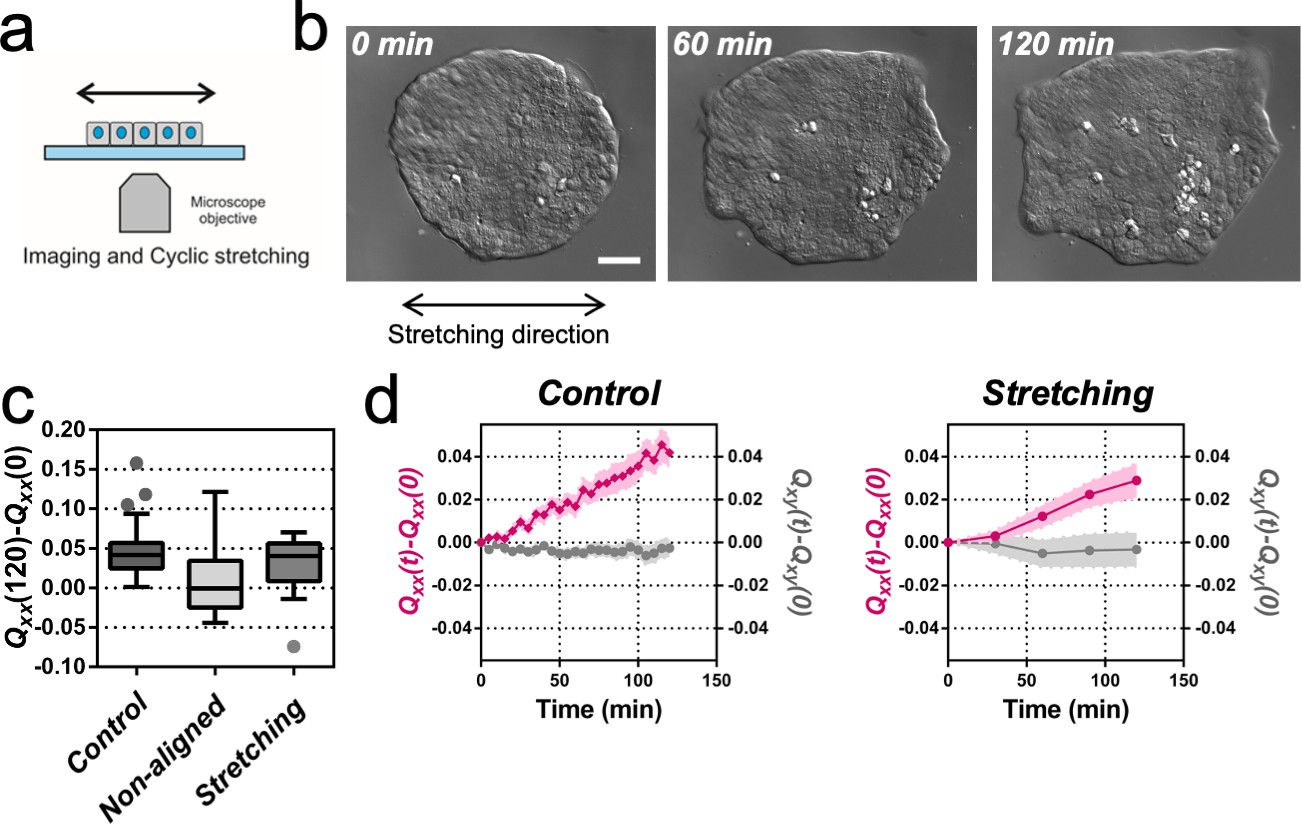
Uniaxial cyclic stretching rectifies symmetry breaking.
(a) Schematics of the experiment where the colony expansion was observed under the microscope while the underlying membrane was uniaxially stretched. (b) Snapshots of the expansion of a Madin Darby Canine Kidney (MDCK) colony while cyclically stretched. Scale bar 50 µm. (c) Colony elongation (Qxx) of control colonies along the elongation axis, control colonies in the laboratory framework (non-aligned, α = 0) and colonies under cyclic uniaxial stretching in the laboratory framework (uniaxial stretching, α = 0). Box Plot between 25th and 75th percentile, being the line in the box the median value, whiskers and outliers (dots) are obtained following Tukey’s method, Ncontrol = 11 independent experiments, n = 25 colonies and Nstretching = 9, n = 20 colonies. Mann-Whitney test control vs control aligned p=0.0003, control vs stretching p=0.0281 and control aligned vs stretching p=0.3319. (d) Qxx (left y axis) and Qxy (right y axis) during 120 min of colony expansion for control colonies and colonies under cyclic uniaxial stretching. Mean value ± standard error of the mean, Ncontrol = 8, n > 14 colonies and Nstretching = 9, n = 20 colonies.
-
Figure 2—source data 1
Raw data used for the panel (c) of Figure 2 and Qxx(t)-Qxx(0) and Qxy(t)-Qxy(0) for the individual colonies used for panel (d) of Figure 2.
- https://cdn.elifesciences.org/articles/57730/elife-57730-fig2-data1-v2.xlsx
Video 2
Cyclic stretching of Madin Darby Canine Kidney (MDCK) colonies.
Time-lapse of an MDCK colony under cyclic stretching (5% and 120 s). Time in hh:mm:ss. Scale bar 50 μm.
Video 3
Expansion of Madin Darby Canine Kidney (MDCK) colonies under cyclic stretching.
Time-lapse of an MDCK colony under cyclic stretching (5% and 60 s) at the 0% strain position. Time in hh:mm. Scale bar 50 μm.
Collective effects are essential for rectification
To get further insight into the collective nature of the rectification of tissue elongation, we probed the roles of adhesion between cells. First, we stretched single MDCK cells, individually plated. We observed that cells oriented perpendicularly to the externally applied uniaxial cyclic stretching (Figure 3a and b) as previously reported for fibroblasts (Faust et al., 2011). Then we blocked cell-cell junction in circular colonies prior stretching. Briefly, we incubated confluent colonies in medium containing 5 mM EDTA and 10 μg/ml anti-E-cadherin blocking antibody that targeted the extracellular domain of E-cadherin for 30 min (Harris et al., 2014). Then, medium was replaced by normal medium and the evolution of colonies with and without stretch was followed (Figure 3c). In the absence of externally applied uniaxial cyclic stretching, colonies treated with anti E-cadherin antibody expanded more than control colonies. Moreover, this expansion was still along one preferential direction (Figure 3d). Under cyclic uniaxial stretching, elongation was also non-isotropic and along the direction perpendicular to the cyclic stretching direction, in contrast to the parallel elongation observed when cell-cell contacts were intact (Figure 2b–d). This supports the collective nature of colony elongation. It is worth noting that cells inside the colony exhibited a decrease in their mean velocity (Figure 3e) and a large recruitment of myosin within cells similar to reinforcements (Riveline et al., 2001) in stretching conditions, as shown by the appearance of stress fibers (Figure 3f). However, this effect did not appear to affect the overall elongation rate. Altogether these data suggest that the asymmetric expansion of colonies in the direction imposed by cyclic uniaxial stretching is generally associated to a collective effect.
Figure 3
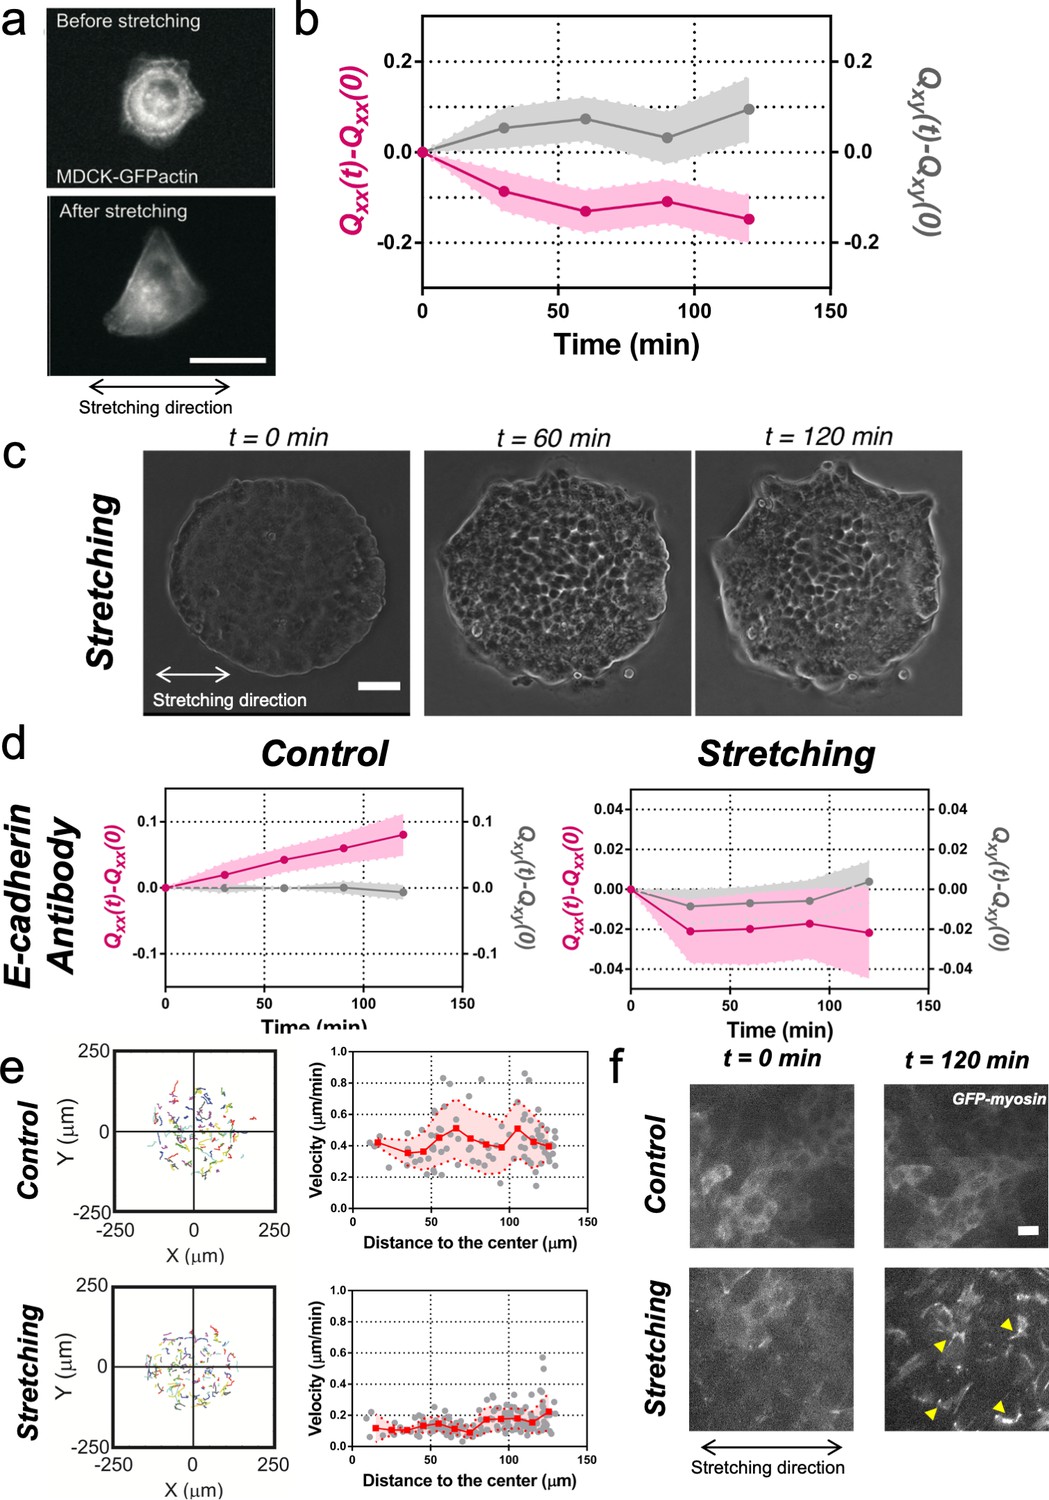
Collective effects are essential for rectification.
(a) Image of a single MDCK-GFP-actin cell before and after being stretch for 2 hr (5% strain and 60 s period). Scale bar 20 µm. (b) Qxx (left y axis) and Qxy (right y axis) of single cells during 120 min of cyclic uniaxial stretching (α = 0). Mean value ± standard error of the mean. N = 3, n = 31 cells. (c) Phase-contrast images of a Madin Darby Canine Kidney (MDCK) colony evolving for 120 min under cyclic mechanical stretching when E-cadherins are blocked by an E-cadherin antibody. Scale bar 50 µm. (d) Comparison of the cumulative Qxx (left y axis) and cumulative Qxy (right y axis) during 120 min of colony expansion when E-cadherin are blocked by an E-cadherin antibody in control and under cyclic uniaxial stretching (α = 0). Mean value ± standard error of the mean, Ncontrol = 3, n = 8 colonies and Nstretching = 4, n = 15 colonies. (e) Trajectories of cells (left) and single-cell velocity as a function of its distance to the center of the colony (right) in control colonies (top) and under cyclic uniaxial stretching (bottom). ncontrol = 90 cells from 8 colonies of Ncontrol = 4 independent experiments and nstretching = 154 cells from 13 colonies of Nstretching = 4 independent experiments. Individual cells in gray, red square and line corresponds mean (binned by distance to the center), shadowed area corresponds to SD. (f) Myosin distribution inside MDCK-GFP-myosin colonies at 0 min and at 120 min after expansion in control and under uniaxial stretching. Note the myosin structures appearing in the stretching case (yellow arrows). Scale bar 10 µm.
-
Figure 3—source data 1
The Qxx(t)-Qxx(0) and Qxy(t)-Qxy(0) of individual cells used in panel (b) and individual colonies used in panel (d); we also provide datasets for the velocities of individual cells in panel (e).
- https://cdn.elifesciences.org/articles/57730/elife-57730-fig3-data1-v2.xlsx
Fingers and symmetry breaking
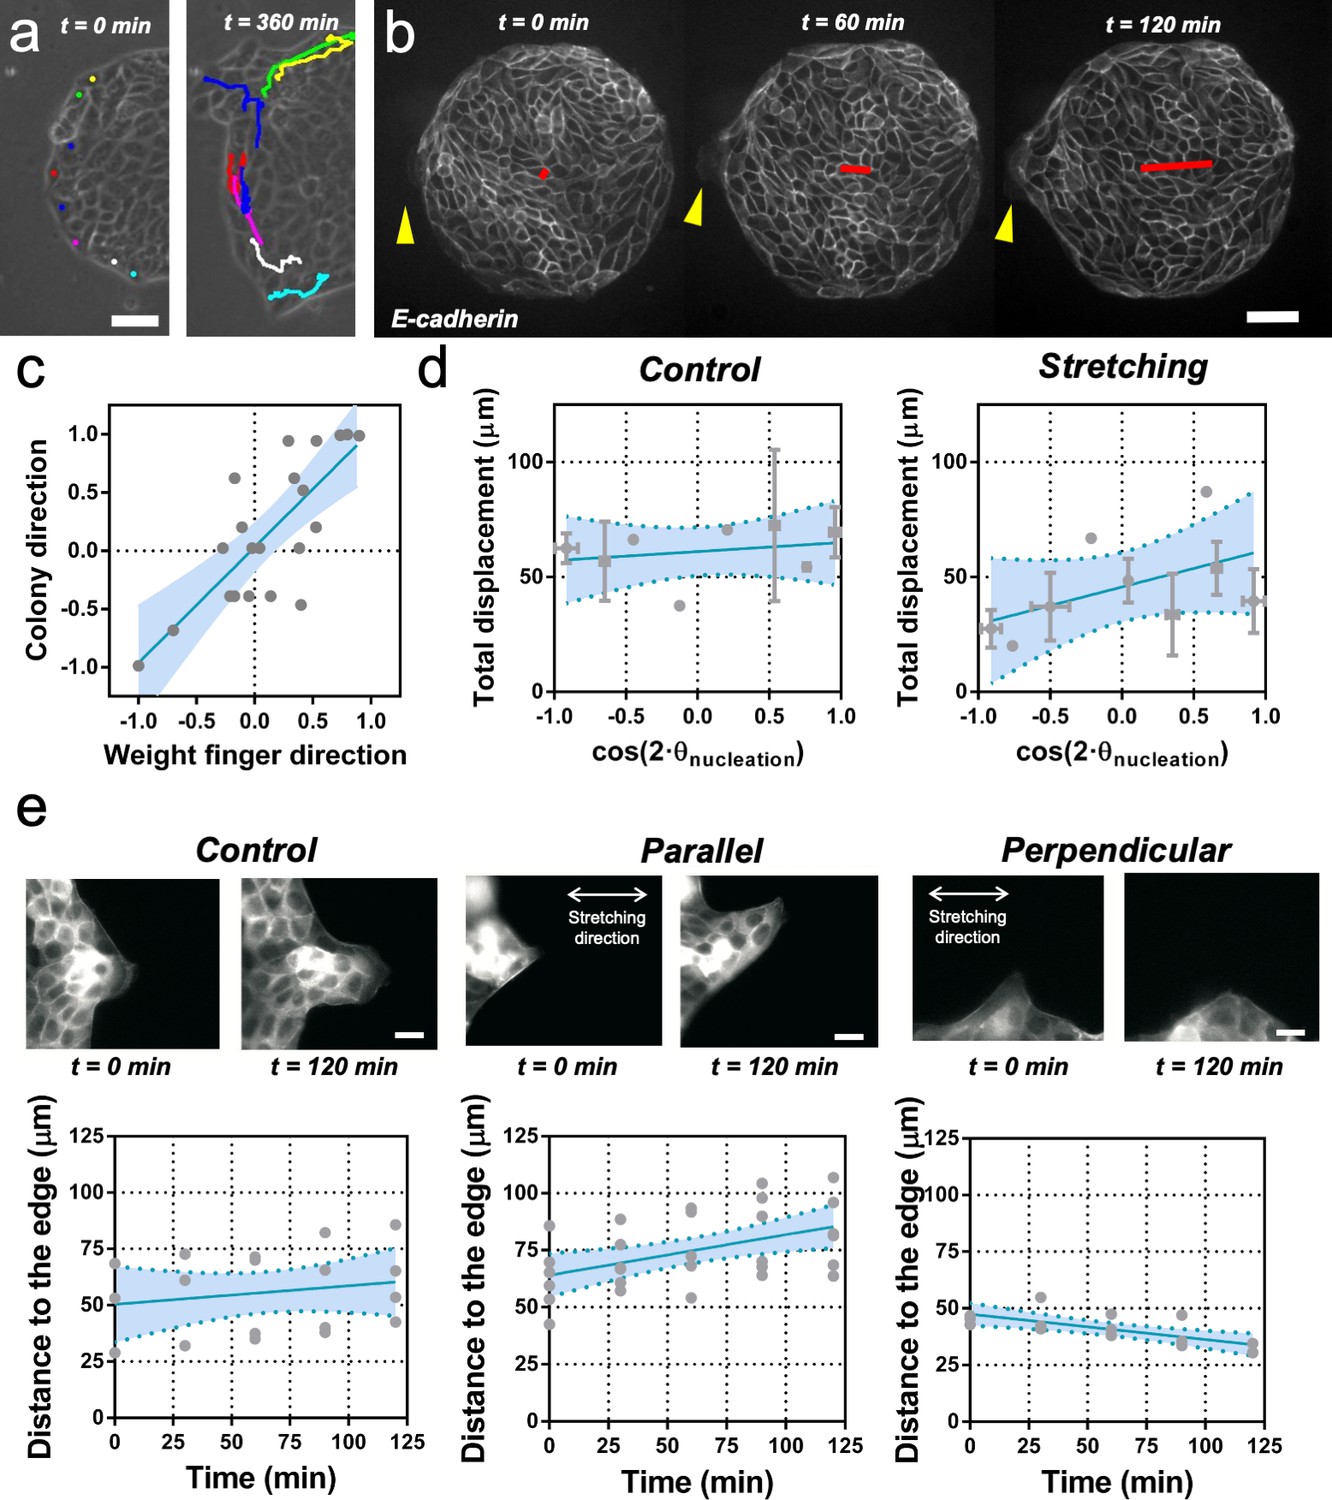
We next sought to identify the source of symmetry breaking in both conditions, with and without application of cyclic uniaxial stretching. It has previously been reported that in MDCK monolayers, cells can migrate tangentially to the monolayer boundary when confined (Doxzen et al., 2013), or perpendicular to the boundary in the form of multicellular groups or fingers during monolayer expansion (Reffay et al., 2011; Reffay et al., 2014). During spontaneous elongation of MDCK colonies in the absence of externally applied cyclic stretching (Video 4), we observed that boundary cells tend to move either perpendicularly or tangentially to the colony boundary (Figure 4a). In most of the experiments, an acto-myosin cable, similar to compartmentalization boundaries in vivo (Monier et al., 2010; Calzolari et al., 2014), was observed in the outer boundary of the colonies at stencil removal (see Figure 4—figure supplement 1). When this supra-cellular structure is intact, cells at the periphery are reported to undergo clockwise and counter clockwise rotations (Doxzen et al., 2013). In contrast, when a local interruption of this cable appeared, the cell at the vicinity could extend a lamellipodia and move away and radially from the center of the colony (Figure 4—figure supplement 2a). Apparently, a local defect in the cable could promote the local protrusion of a cell in the direction normal to the edge as shown in laser ablation experiments previously (Reffay et al., 2014). Several local defects could appear within the same colony, thus providing the opportunity for cells in the vicinity to protrude outwards. This cell has been termed leader cell (Reffay et al., 2011) and the collection of cells protruding from the circular colonies along this cell can be identified as the finger-like structures already reported for MDCK monolayers (Reffay et al., 2011; Reffay et al., 2014).
Figure 4 with 2 supplements see all
Fingers and symmetry breaking.
(a) Trajectories of boundary cells during colony expansion. Two types of trajectories are observed: radial and tangential. Scale bar 50 µm. (b) Fluorescent images (GFP-E-cadherin) of a colony evolving for 120 min. Red line shows the orientation of the colony according to ellipse fitting (length scales with the change in Qxx) and yellow arrow indicates a cell migrating radially. Scale bar 50 µm. (c) Direction of the colony elongation (quantified by the cosine of two times the angle of the main axis of the colony at t = 2 hr) as a function of the weight finger direction (quantified by the average of the cosine of two times the angle of each finger trajectory, for example the angle corresponding to the vector between the position of the finger at t = 0 hr and t = 2 hr, of each finger weight by the finger’s displacement). N = 5, ncolonies = 12 colonies and nfinger = 21 fingers. Blue line corresponds to the linear fitting of the data points and the shadowed area corresponds to the 95% confidence interval. Pearson’s correlation coefficient r = 0.7724, p=0.0001. (d) Total displacement of finger growth as a function of its initial position in the colony (angular coordinate from the center of the colony) for control colonies and colonies under uniaxial stretching. N = 5 independent experiments, ncolonies = 11 colonies and nfinger = 21 fingers (control) and N = 6, ncolonies = 10 colonies and nfinger = 28 fingers (stretching). Averaged fingers in gray (both position and distance, Mean ± SD), blue line corresponds to the linear fitting of the data points and the shadowed area corresponds to the 95% confidence interval. (e) Distance between the tip of the finger and the edge of the monolayer along time, for monolayers in control conditions, stretched parallel and perpendicular to the finger growth direction. Ncontrol = 3, Nparallel = 4 and Nperpendicular = 3 independent experiments and n = 4, 6, and 3 fingers, respectively. Individual fingers in gray, blue line corresponds to the linear fitting of the data points and the shadowed area corresponds to the 95% confidence interval.
-
Figure 4—source data 1
Raw data corresponding to panels (c), (d) and (e).
For panels (c) and (d), we list the individual values corresponding to each colony and its associated fingers. For panel (e), we list the values for individual fingers in each condition.
- https://cdn.elifesciences.org/articles/57730/elife-57730-fig4-data1-v2.xlsx
Video 4
Early symmetry breaking of circular colonies.
Composite array time-lapse of MDCK-GFP-Ecadherin cells colonies during the first 2 hr of expansion. Time in hh:mm. Scale bar 150 μm.
We performed cell tracking and observed that, on average, these protruding cells are faster than other boundary cells (Figure 4a and Figure 4—figure supplement 2b and c). They are characterized also by radial and directional migrations, in contrast to tangential motion observed in the other cells of the outer region of the colony (Figure 4—figure supplement 2d and e). In general, the motion of these so-called leader cells was directionally persistent and on average the shape of the whole colony followed the same overall direction (Figure 4b and c). To correlate colony elongation with leader cell orientation, we analyzed the evolution of a larger number of colonies for 2 hr after stencil removal (Video 4). We quantified the breaking of symmetry by fitting an ellipse to the shape of each colony. We then tracked the positions where finger-like structures were appearing, as well as the direction and distance performed by each of them. We could observe that the elongation direction of the whole colony correlated on average with the direction of the leader cell migration and associated finger (Figure 4c).
We then measured the position and displacement for each finger in control colonies and colonies under cyclic uniaxial stretching (Figure 4d). We observed that, when growing perpendicular to the direction of force application, finger cells performed shorter displacements than when growing parallel to it. In the absence of externally applied cyclic uniaxial stretching, fingers grew a similar amount as when growing parallel the direction of applied uniaxial cyclic stretching and no bias was observed vis-à-vis the nucleation position (Figure 4d and Figure 4—figure supplement 2f). To further explore this effect, we grew MDCK monolayers with straight boundaries either parallel or perpendicular to the external force. Then, we let fingers appear and grow for 2 hr before applying cyclic uniaxial stretching (Figure 4e). When fingers were growing perpendicular to the stretching direction, they shrank upon application of cyclic uniaxial stretching; in contrast, fingers further elongated when parallel to the direction of uniaxial cyclic stretching. Altogether, this suggests that direction of finger-like structures correlates with elongation direction, and that external stretching affects the dynamics of finger growth.
Collective effects and symmetry breaking
Finger growth correlates with colony elongation. However whether it is a cause or consequence of the symmetry breaking of the shape of the colony remains elusive. We therefore explored the possibility of inducing the growth of fingers and therefore set the direction of elongation of the colonies. Breakage of the acto-myosin cable by laser ablation induces the appearance of leader cells (Reffay et al., 2014). Hence we attempted to trigger the growth of fingers by locally injecting cytochalasin D using a micropipette. The transient injection of this actin polymerization inhibitor was followed by the disruption of the acto-myosin cable (Video 5 and Figure 5—figure supplement 1). However, the cable reformed, and fingers did not appear. This result shows that breakage of the cable alone does not trigger the growth of fingers in our colonies, and suggests that other mechanisms may be involved.
Video 5
Disruption of the acto-myosin cable.
Movie showing the disruption of the acto-myosin cable. The colony and the micropipette used are shown at the left and the myosin signal is shown at the right. Cytochalasin D was mixed with Cy5 to allow its visualization. Time in hh:mm. Scale bar 50 μm (right).
We observed that when a finger moves outward from the colony, cells in the immediate vicinity elongate and seem to reorient their elongation axis toward the finger (Figure 5a). Recent studies have shown that the nematic field of cell elongation and its topological defects could be involved in the growth of bacterial colonies (Doostmohammadi et al., 2016) and in controlling dynamics, death and extrusion of epithelial cells (Kawaguchi et al., 2017; Mueller et al., 2019; Saw et al., 2017). We wondered if the spontaneous elongation of colonies would also be related to the average cell elongation. We followed the evolution of the cell elongation nematic field in different MDCK and MCF 10A colonies during expansion. We first obtained the spatio-temporal cell elongation nematic orientation field (see Materials and methods) on the experimental time-lapse images (see Figure 5b, Figure 5—figure supplement 2a-c, Video 6 and Appendix 1C). We could then obtain the angle θnematic of the average cell-shape nematic field at t0 which we compared with final colony orientation θcolony obtained using the ellipse fitting analysis (Figure 5c, Figure 5—figure supplement 2d and Appendix 1C). Strikingly, we observed a clear average cell elongation even at the time of stencil removal t0, and the corresponding angle θnematic correlated with colony orientation when elongation direction was established for both MDCK and MCF 10A cell lines (Figure 5d, Figure 5—figure supplement 2d and e). The cell elongation orientation field was not homogeneous at t0 but exhibited a complex pattern with ±½ topological defects (Figure 5b and Appendix 1D). Interestingly, an expression that provides equilibrium orientation of liquid crystals with defects and having one constant Frank free energy,
(1)
mimics the experimentally observed orientation field very well with just one fitting parameter (see Appendix 1D for details). Here ki = ±½ and (xi, yi) are the strength and location, respectively, of the topological defects obtained from the experimental image. Thus, the defect position and strength can be used to provide an approximate readout for the orientation of the cell-shape nematic field (Figure 5d). Moreover, the location of finger nucleation seemed to be biased toward the position of topological defects. However, some defect locations were not stable in time and in some cases, the nematic field of cell shapes could only be interpreted in terms of virtual defects outside the colonies, thus suggesting that the mean nematic direction is a better readout for the cell-shape nematic field.
Figure 5 with 5 supplements see all
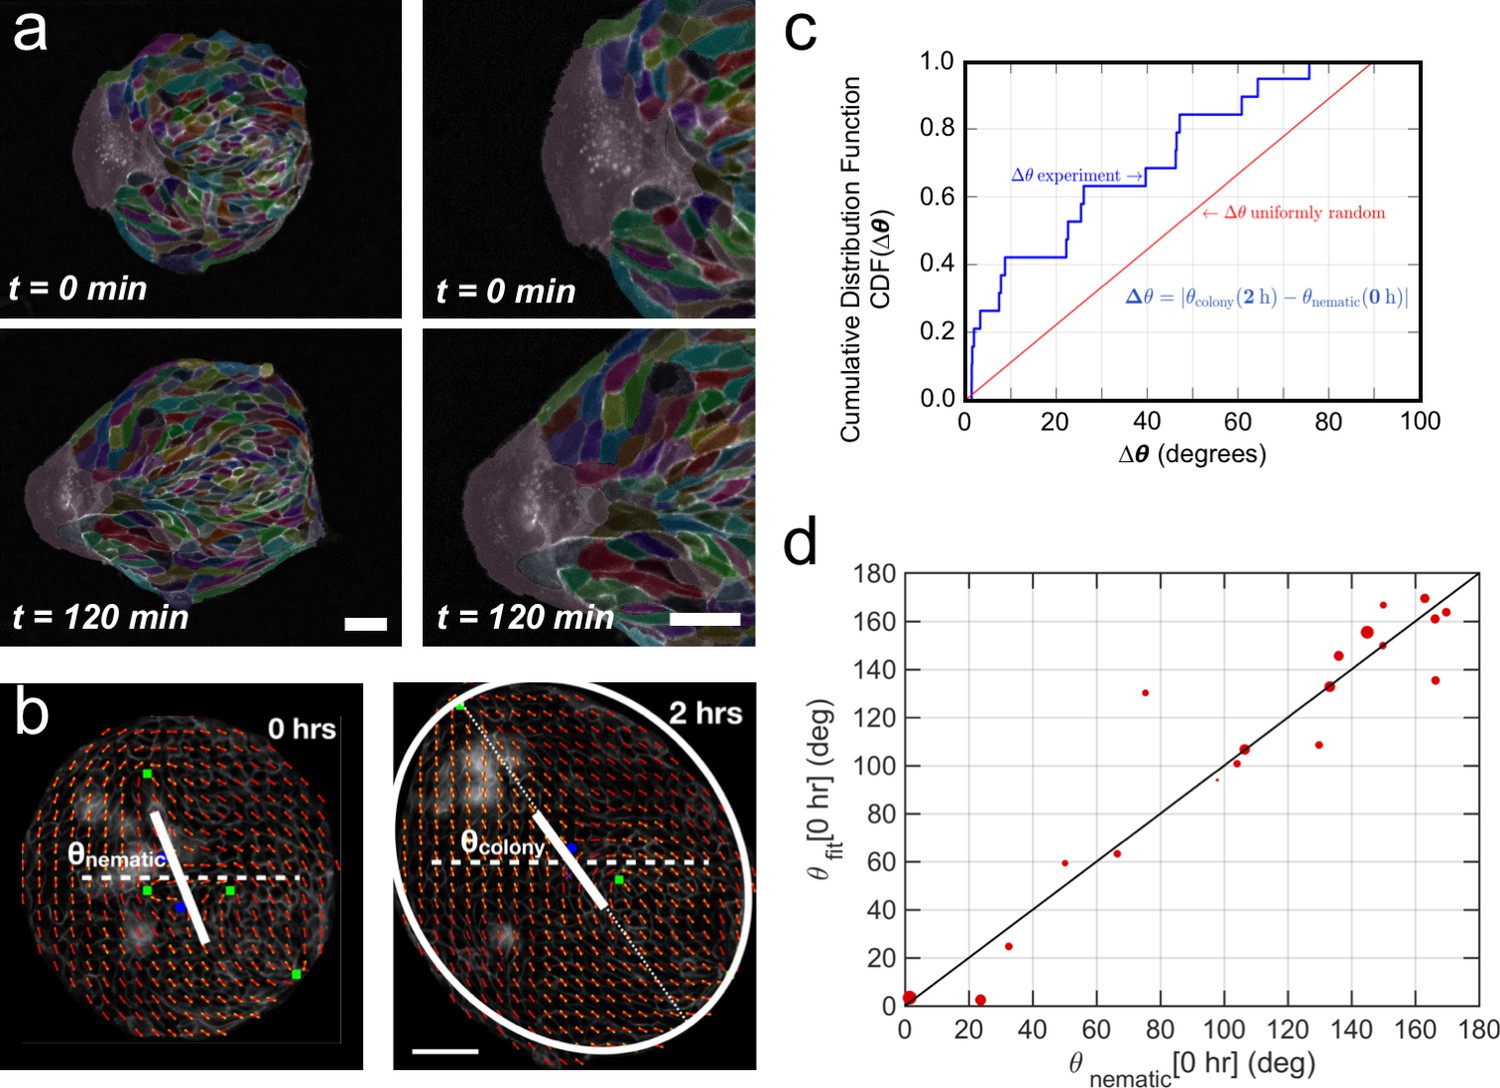
Collective effects and symmetry breaking.
(a) A leader cell at the boundary of the colony pulls the colony outwards while inner cells deform and elongate. Scale bar 50 µm. (b) Cell shape is quantified using a nematic field (red segments). First, the mean cell shape nematic is quantified at the moment of stencil removal (0 hr) and the orientation θnematic of its mean for the entire colony is obtained. Then, the overall shape of the colony after 2 hr is obtained by fitting an ellipse, whose major axis makes an angle θcolony. The yellow directors correspond to fits for the cell shape nematic field obtained with respect to the +1/2 and −1/2 topological defects of the experimentally obtained (red) nematic field (also see Appendix 1D for details.) Scale bar 50 µm. (c) The cumulative distribution function (CDF) for the difference Δθ between θnematic (0 hr) and θcolony (2 hr) is obtained from n = 19 colonies of N = 5 independent experiments. Red line corresponds to the CDF of a random distribution of the difference Δθ. This plot shows a strong correlation between the cell shape nematic and the overall shape symmetry breaking (also see Figure 5—figure supplement 2d, and Appendix 1E). (d) The experimentally measured angle of mean nematic orientation θnematic obtained for 19 colonies at t = 0 hr is compared with its counterpart θfit obtained by fitting the experimental data with Equation 1 of the main paper with respect to the orientation parameter α (see Appendix 1D). The size of the red circles in (b) is proportional to the magnitude of anisotropy of the colony shape after 2 hr. n = 19 colonies of N = 5 independent experiments for MDCK.
-
Figure 5—source data 1
Raw data corresponding to panels (c) and (d).
For panel (c), we list the individual values used to calculate the cumulative distribution function. For panel (d), we list the values for the x-axis, the y-axis and the weight associated to each dot.
- https://cdn.elifesciences.org/articles/57730/elife-57730-fig5-data1-v2.xlsx
Video 6
Nematic field alignment precedes colony elongation.
Movie showing cell- shape nematics and topological defects of an elongating colony. Time in hh:mm. Scale bar 50 μm.
On the one hand, finger nucleation seemed to be correlated with colony elongation direction (Figure 4c). On the other hand, the orientation of tissue elongation correlates with orientation of average cell elongation at t0 (Figure 5 and Figure 5—figure supplement 2). This suggests that leader cells moving outward from the colony may not be the cause of symmetry breaking in colony shape, but rather follow from the initial cell shape elongation before stencil removal. Moreover, we found no correlation between breaks of the acto-myosin cable surrounding the colony and the mean nematic direction (Figure 5—figure supplement 3), which suggests that breaks are uniformly distributed along the colony border. We have also shown that breakage of acto-myosin cable after stencil removal, which is associated with leader cell formation (Reffay et al., 2014), did not necessarily induce the growth of fingers in our colonies. Altogether, our results could indicate that the orientation of the mean cell-shape nematic of the colony before stencil removal sets the direction of elongation by triggering the growth of fingers, which appear at the discontinuities of the outer acto-myosin cable located along the nematic orientation, while preventing finger growth at discontinuities located in other directions.
Finally, when looking at the evolution of the mean cell elongation nematic field of colonies under uniaxial cyclic stretching, we observed that it did not change over time (Figure 5—figure supplement 4). The initial mean direction of cell elongation, either parallel or perpendicular to the external stretching, was maintained throughout 2 hr of external stretching. This suggests that average cell elongation alone does not determine colony elongation direction when subjected to uniaxial cyclic stretching.
Contributions to symmetry breaking
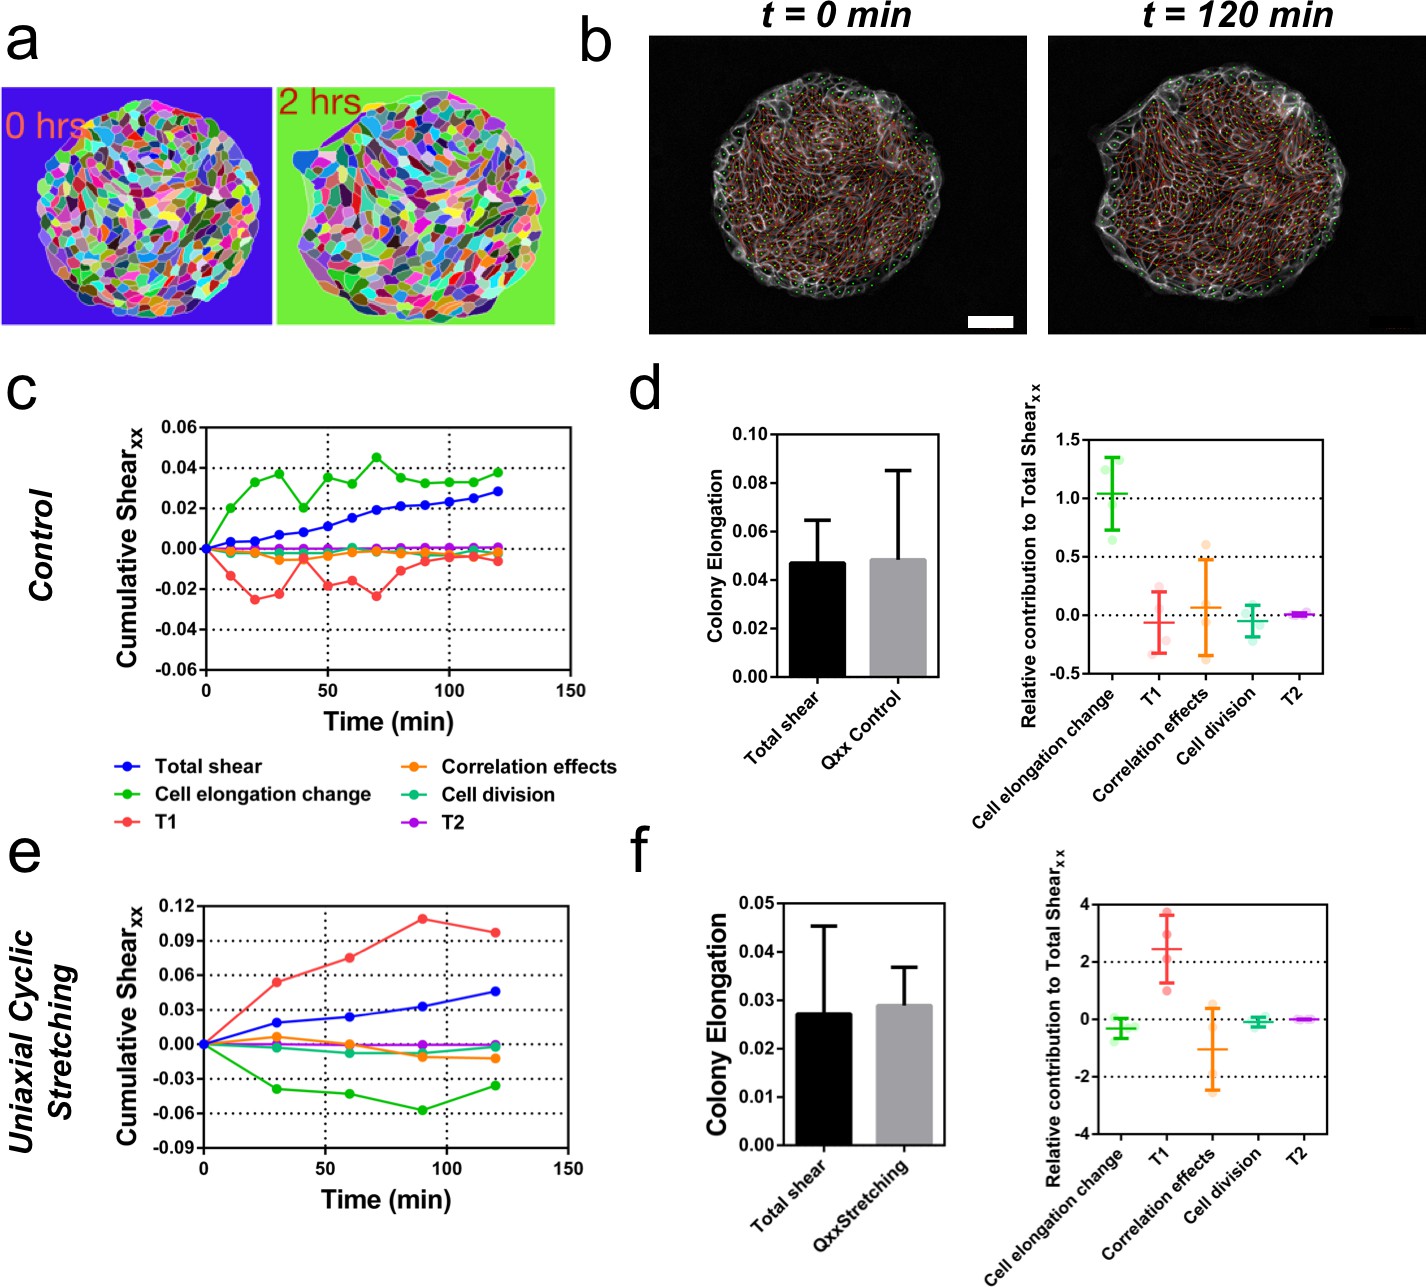
We next sought to evaluate quantitatively the contribution of cellular processes to elongation. We quantified the contributions of each cellular event using image segmentation, cell tracking, and neighbor triangulation (Etournay et al., 2015; Etournay et al., 2016) (see Appendix 1A, Figure 6a and b, Figure 6—figure supplement 1 and Figure 6—figure supplement 2, and Video 7). This procedure decomposes overall tissue elongation, which is quantified in terms of cumulative total pure shear, into contributions from cell elongation and topological changes. Five main events contribute to total shear: cell elongation change, cell division, cell extrusion, T1 transition, and correlation effects (Etournay et al., 2015; Etournay et al., 2016). At the colony scale, shear decomposition plots (Figure 6c and Figure 6—figure supplement 3) revealed that the total pure shear gives values consistent with elongation estimates from ellipse fitting (Figure 6d). Note that various contributions to shear decomposition exhibit significant variability between experiments (Figure 6—figure supplement 3). However, we found that after the first 2 hr, the contribution of cell elongation is generally comparable to the total pure shear, with a smaller contribution from other sources (Figure 6d). When looking at the shear decompositions of colonies under cyclic uniaxial stretching (Figure 6e and Figure 6—figure supplement 3), the cumulative shear values were also similar to the ones obtained by ellipse fitting (Figure 6f). Interestingly, we found however that in that case, shear created by T1 transitions is the main contributor for the total pure shear, while cell elongation does not contribute to tissue elongation (Figure 6f and Figure 6—figure supplement 3). This indicates that applying oscillatory forces to the tissue changes fundamentally the main mode of tissue elongation by favoring topological rearrangements of the cell network.
Figure 6 with 3 supplements see all
Contributions to symmetry breaking.
(a) Snapshots of two colonies from control condition segmented and tracked for cells using Tissue-Analyzer (TA) for a duration of t = 120 min starting from removal of stencil at t = 0. Scale bar 50 µm. (b) The segmented and tracked images are triangulated in Tissue-Miner (TM). Scale bar 50 µm. The green dots represent the centers of the segmented cells. (c) The dynamics of triangulation is analyzed in TM to provide the overall xx component of cumulative pure shear strain in a sample colony as a function of time (total shear). (d) Comparison between the mean total pure shear obtained from TM and the overall colony pure shear obtained from ellipse fitting (left). Total shear corresponds to ncolonies = 4 colonies from N = 2 independent experiments and Qxx control was obtained from ncolonies = 25 colonies of N = 11 independent experiments. Relative contribution of the different processes to the total pure shear (right). Total shear and contributions were obtained from ncolonies = 4 colonies from N = 2 independent experiments. (e) Cumulative pure shear decomposition for stretched colony. (f) Comparison between the mean total pure shear obtained from TM and the overall colony pure shear obtained from ellipse fitting (left) and relative contribution of the different processes to the total pure shear (stretching case). Total shear corresponds to ncolonies = 4 colonies from N = 4 independent experiments and Qxx stretching was obtained from ncolonies = 20 colonies of N = 9 independent experiments. Relative contribution of the different processes to the total pure shear (right). Total shear and contributions were obtained from ncolonies = 4 colonies from N = 4 independent experiments.
Video 7
Contributions to colony elongation.
Movie showing cell tracking, neighbor triangulation, cell-shape nematics, and topological defects of an elongating colony. Time in hh:mm. Scale bar 50 μm.
Vertex model recapitulates symmetry breaking and shear decomposition
We then asked whether a model could reproduce experimental observations of shear decomposition and, in particular, in which conditions tissue elongation would arise from cell elongation or from topological transitions. We developed a vertex model which takes into account mechanical anisotropies such as active stresses and polarized cell bond tension (see Figure 7a and Appendix 2). We generated a confluent colony of circularly confined cells, in which a unit director p that represented the cell polarity was assigned to each cell. Based on orientation of the director, each cell generated an extensile active stress σa and bias λ in the base value of its edge contractility to promote cell elongation and active T1 transitions. We assumed that the experimentally measured cell elongation nematic q is a readout of the underlying cell polarity p (Figure 7b). Hence, the initial spatial distribution of p was based on the commonly observed pattern of q (Figure 7c). To evolve p with time, we imposed that p of the exterior cells tended to be parallel to the boundary, whereas the inner cells tended to align their p with those of their neighbors (Appendix 2D).
Figure 7 with 1 supplement see all
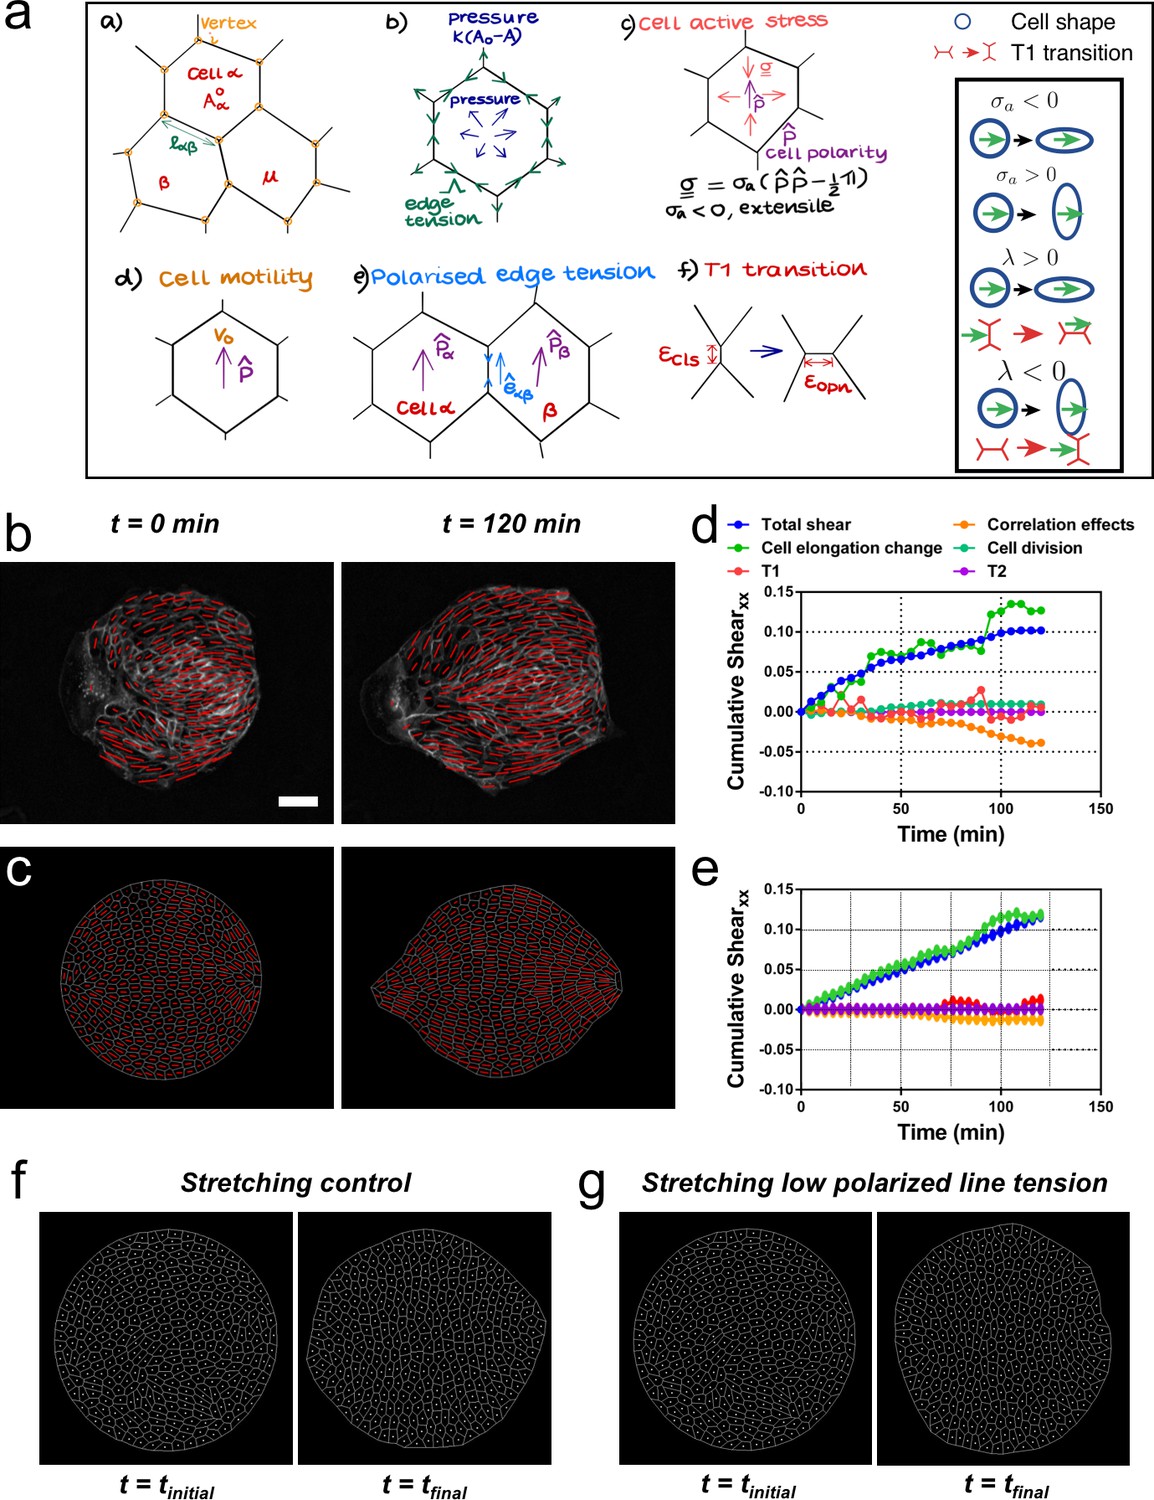
Vertex model recapitulates symmetry breaking and shear decomposition.
(a) Schematic of vertex model depicting the arrangement of cells, forcing, and topological transitions in a tissue. 2-D monolayer of epithelial cells is represented by polygons, generally sharing a common edge and two vertices between cells. For any cell α shown in the figure, Aα is the area, is the preferred area and lαβ is the length of the edge shared between cells α and β. The forces on any vertex i in the basic vertex model are from pressure due to deviation in the cell area from its preferred value and the tensile force arising from edge or cortical contractility Λ. In our model, each cell also has a polarity associated with it through which active forces can act on the cell vertices due to anisotropic cell active stress (extensile in our case), cell motility v0 and polarized or biased edge tension that depends on the orientation of the edge with respect to the polarities of the adjoining cells. When the edge connecting two cells becomes smaller than a critical value , the cells are made to modify their neighbors by forming a new edge of length as shown. Scheme depicting the different possibilities from the model parameters. (b) Experimental coarse-grained cell shape nematic at t=0 and t=120 min. Scale bar 50 µm. (c) A vertex model with internal activity arising from extensile active cell stress (σa′ = -5) and biased edge tension for the cell-cell junctions (λ′ = 20). Prime symbol ′ refers to non-dimensional values (see Appendix 2E). (d) Overall xx component of cumulative pure shear strain in the sample colony shown in (b) as a function of time (total shear). (e) Shear decomposition of the in silico experiment which is similar to its experimental counterpart in (d). (f) A vertex model with an additional aligning term that defines the direction of the uniaxial stretching through cell polarity. When cell-cell junctions are intact, biased edge tension (λ′ = 50) dominates over active cell stress (σa′ = 2) and the colony elongates along the (horizontal) direction of stretch collectively through T1 transitions. (g) When the effect of edge tensions is lowered (λ′ = 25) and active cell stress is increased (σa′ = 4), the colony elongates perpendicularly to the direction of stretch.
Upon removal of confinement, we found that the simulated colony spontaneously elongates, in a direction set by the orientation of the mean cell elongation nematic field, along with the formation of finger-like structures near the +½ defect, as observed experimentally (see Video 8). Our simulations therefore reproduce experimental observations indicating that colony deformation can be understood without forces exerted by a leader cell at the colony boundary (Figure 7c, Video 8, and Appendix 2). To test whether we could also recapitulate different contributions of the total pure shear inside the tissue, we performed a shear decomposition analysis of in silico movies. We found a qualitatively similar cumulative shear-strain decomposition as was observed in experiments (Figure 7d and e), where the main contribution came from cell elongation. Moreover, by changing the relative contributions of the cellular active stress magnitude (σa) and the edge tension bias (λ), we could modulate the relative contributions from cell elongations and T1 transitions to the total pure shear (Figure 7—figure supplement 1) as was also observed in experiments with colonies in the absence or presence of cyclic stretching (Figure 6—figure supplement 3). When σa was dominant, the colony elongation was primarily due to cell elongation, whereas when λ was the stronger term, T1 transitions were the main cause of colony elongation. These results reveal possible cellular mechanisms that can govern the process of tissue deformation and influence whether cell elongation, or cellular rearrangements, dominate tissue elongation.
Video 8
In silico recreation of a colony elongation.
Vertex model simulation of a colony elongation. Cell-shape nematics, topological defects, and cell polarization are followed over time.
Our vertex model assumed that the cell elongation was the main readout for cell polarity, and it did not explicitly account for the effect of substrate stretching. To incorporate uniaxial cyclic stretching, we further developed the model. Our results show that initial cell shape elongation does not have a preferential direction (Figure 5—figure supplement 4), but colony elongation under uniaxial cyclic stretching is along x axis, the direction of stretching, and mainly achieved through T1 transitions (Figure 2c and Figure 6f). Also, we report that the elongation happens along y axis, perpendicular to the direction of stretching, in single cells and cell colonies with lowered Ecadherin levels (Figure 3a–d). These two experimental observations can be implemented in the model. First, we introduced an additional term mstretch that oriented cell polarization p along x axis, for any given initial condition, upon confinement removal at t0 – this term is inactive in the absence of uniaxial stretching (Appendix 2D). Then, by using cell active stress σa > 0, we mimicked the tendency of single cells to elongate perpendicular to the orientation of polarity, i.e., perpendicular to the uniaxial stretching. In contrast, the bias in the edge tension λ > 0 induced T1 transitions along the polarity of the cell, i.e., parallel to the uniaxial stretching. Thus, in the presence of uniaxial stretching, mstretch oriented cell polarities along x, while the relative magnitudes of single cell active stress σa and edge-contractility bias λ dictated the orientation of the colony elongation. When keeping a lower magnitude of σa and a higher value of λ, colonies elongated along x through T1 transitions (Figure 7f and Video 9), mimicking colony elongation under uniaxial cyclic stretching (Figure 2 and Figure 6f). On the contrary, by increasing σa and lowering λ (Ecadherin deficient colonies), colonies elongated perpendicular to x (Figure 7g and Video 9), mimicking colonies under uniaxial cyclic stretching treated with E-cadherin antibody (Figure 3c–d). Therefore, we propose that a competition between the strength of active T1 transitions parallel to the external stretching and active cell stress perpendicular to the external stretching dictate overall colony elongation under uniaxial cyclic stretching. When cell-cell junctions are intact, colony elongation is along the direction of stretching and through T1 transitions (Figure 2c and Figure 6f), suggesting that the tendency of single cells to orient along y (Figure 3a–b) is partially screened by cell-cell junctions via T1 transitions. When cell-cell junctions are weakened, active cell stress dominates, and colonies, which could be thought of to be closer to a collection of single cells, elongate perpendicular to the uniaxial stretching direction (Figure 3c and d).
Video 9
In silico recreation of single versus collective effect of stretching.
Competition between active cell stress σa and biased junction tension λ governs direction of colony elongation. (Left) When cell-cell junctions are normal, we propose that λ’=50 dominates over σa′ = −2 and the colony elongates along the direction of stretch (horizontal) collectively through T1 transitions (collective stretching). (Right) When E-cadherin levels are low (blocked by anti-E-cadherin antibody), the effect of edge tensions λ′=25 is lowered as compared and that of active cell stress σa′ = −4 is increased, thus leading to elongation of the colony perpendicular to the direction of stretch (vertical) through individual cell elongation (single stretching). The superscript ′ indicates non-dimensionalized parameter (see Appendix 2E).
Stretching-dependent elongation is mediated by ROCK
We showed that upon stretching, cells reduced their speed and myosin structures appeared (Figure 3e and f). These type of cellular responses to external stretching involve the Rho-associated protein kinase (ROCK) (Hart, 2020), which is also involved in cell-cell contacts integrity (Ewald et al., 2012; Nishimura and Takeichi, 2008). We treated MDCK colonies with a ROCK inhibitor (Y-27632 50µM) and followed their behavior for 2 hr, both in the absence and the presence of cyclic uniaxial stretching (Figure 8—figure supplement 1). When cyclic stretching was applied, elongation along the direction of the uniaxial cyclic stretching was absent (Qxx ≈ Qxy) (Figure 8—figure supplement 1a and b). However, colonies still elongated anisotropically, similar to colonies in the absence of application of uniaxial cyclic stretching (Figure 8—figure supplement 1c). According to our model, when edge tension bias is sufficiently large, the dominant mechanism for tissue elongation switches from single-cell elongations to T1 transitions (Figure 7—figure supplement 1). We observed that uniaxial cyclic stretching triggers this type of elongation (Figure 6f). Therefore, if the effect that application of uniaxial cyclic stretching has at the cellular level was reduced, colonies subjected to cyclic uniaxial stretching should preferentially elongate as if cellular active stress becomes dominant, that is through single-cell elongation. Strikingly, shear decomposition analysis shows that the elongation mechanism shifts from T1 transition-dominant to cell elongation-dominant when colonies under uniaxial cyclic stretch have ROCK inhibited (Figure 8a-b). In summary, colonies under cyclic uniaxial stretching elongate through T1 transitions rather than through cell elongation (red dot in Figure 8c) similar to what our model predicts for colonies with increased biased edge tension. In contrast, colonies elongate spontaneously largely through single-cell elongation, which the model predicts when the effect of the cellular active stress is more dominant (green dot in Figure 8c). Strikingly, the application of a ROCK inhibitor leads to single-cell elongation dominating over T1 (orange dot in Figure 8c), effectively suppressing the effect of uniaxial cyclic stretching on the mode of colony deformation (Figure 8—figure supplement 1).
Figure 8 with 1 supplement see all
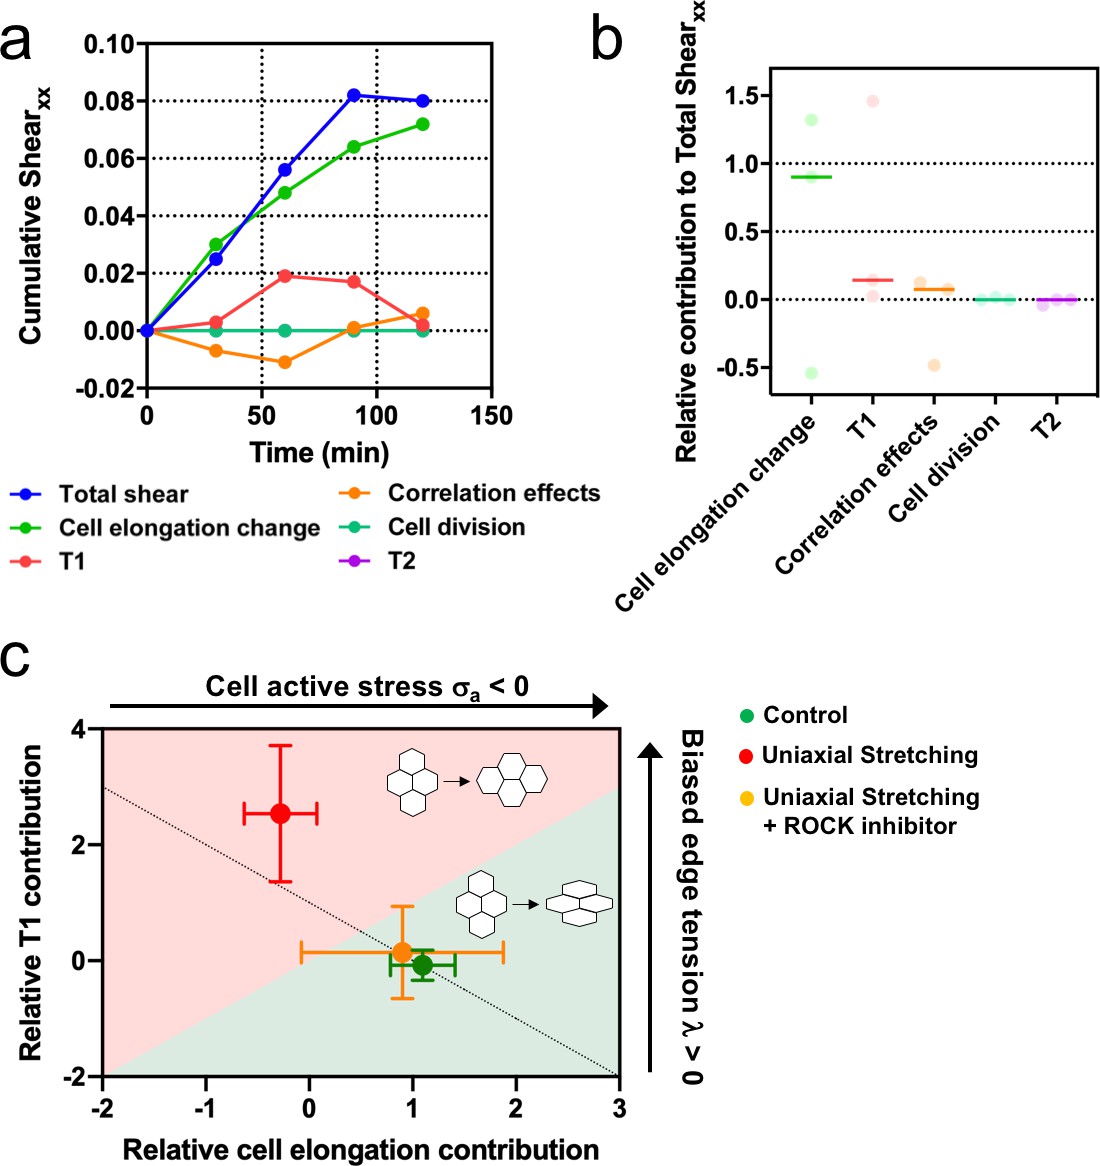
Stretching-dependent elongation is mediated by ROCK.
(a) Cumulative pure shear decomposition for stretched colony in the presence of ROCK inhibitor Y-27632 50 µM. (b) Relative contribution of the different processes to the total pure shear. Total shear and contributions were obtained from ncolonies = 3 colonies from N = 3 independent experiments. Individual experiments and median are plotted. (c) Contribution of single-cell elongation to total elongation versus contribution of T1 transitions to total elongation. In the green area, single-cell elongation dominates over T1, whereas red area corresponds to T1 transitions dominating over cell elongation. Along the dashed line, contribution of correlation effects and oriented cell division to total shear is close to zero. Above this line this contribution is negative and below the line is positive. According to our vertex model, by changing the strength of cellular active stress and biased edge tension, colonies change the relative contribution of each mechanism of elongation. Experiments show that epithelial colonies spontaneously elongate through single-cell elongation (green point, N = 2, ncolonies = 4), whereas colonies under uniaxial stretching elongate through T1 (red dot, N = 4, ncolonies = 4). When ROCK activity is inhibited, colonies under uniaxial stretching elongate through single-cell elongation (orange dot, N = 3, ncolonies = 3). Points represent median ± SD.
-
Figure 8—source data 1
Values of each of the different contributions to cumulative shear as time progresses for the three colonies analyzed.
- https://cdn.elifesciences.org/articles/57730/elife-57730-fig8-data1-v2.xlsx
Discussion
Tissue spreading is key during embryonic development (Bénazéraf et al., 2010; Campinho et al., 2013; Etournay et al., 2015). Epithelial cells migrate in a collective and cohesive manner. In many cases symmetry is broken leading to shape transformation. The resulting tissue kinematics and the underlying mechanisms for this symmetry breaking has been studied using original approaches, and is understood with a variety of cell-based and continuum models in vivo (Blanchard et al., 2009; Ciarletta et al., 2009; Aigouy et al., 2010; Etournay et al., 2015; Guirao et al., 2015; Alt et al., 2017). On the in vitro situation too, combination of theory and experiments have been applied on similar phenomena (Mark et al., 2010; Tarle et al., 2015; Kawaguchi et al., 2017; Saw et al., 2017).
In the present work, we sought to integrate knowledge from in vitro and in vivo studies to test new ideas for breaking symmetry through collective effects. First we showed that initially circular colonies of three different epithelial cell lines spontaneously expanded in a non-isotropic manner and the elongation observed was similar in magnitude to Drosophila wing blade elongation in vivo (Etournay et al., 2015). However, the undeformed circular colonies have a non-zero average cell elongation even before spreading starts, which determines orientation of the final colony shape. Our analysis also showed that the cell orientation patterns are not homogeneous but spatially organized and directed by the presence of ±½ topological defects. It was already shown that topological defects in the cell elongation nematic field have a key role on epithelial dynamics (Kawaguchi et al., 2017) and on cell death and extrusion (Saw et al., 2017). Our results reinforce the idea that cell elongation nematic field, which could only arise from collective interaction between cells, can have an impact on epithelial morphogenesis.
Since developing tissues are regularly subjected to internal oscillations (Solon et al., 2009; He et al., 2010; Rauzi et al., 2010) and external pulsatory forces (Zhang et al., 2011; Hayes and Solon, 2017) in a number of living organisms, we explored the effect of external forces in the in vitro circular colonies. We observed that the direction of elongation could be rectified by imposing an external uniaxial cyclic force. This particular behavior is of great interest from an in vivo point of view: cyclic contraction could direct elongation in specific directions to trigger the next steps in morphogenesis. The generic localizations of muscles connected to epithelial layer (Zhang and Labouesse, 2012) could have this essential function for tissues which would otherwise elongate in any direction like in our assay. Finally, direction of this tissue rectification is along the external force, but perpendicular to the reorientation of single cell under external uniaxial stretching, and this further supports the collective nature of the phenomenon.
We also systematically quantified the shear deformation kinematics of the colony and demonstrated that some of the colonies exhibit shear decomposition patterns similar to those observed during Drosophila pupal wing elongation (Etournay et al., 2015). Moreover, while the colony deformation for the control colonies was dominated by cell elongation, T1 transitions were the main drivers of the colony shape anisotropy under cyclic uniaxial stretching thus indicating different mechanisms at work. Thus, the current work thus makes a direct comparison and contrast tissue kinematics between in vivo and in vitro cases.
Finally, we developed a vertex model that takes into account mechanical anisotropies. Cell anisotropic active stress arising in the cell core, cortical contractility at the cell-cell junctions and cell motility are three of the important forces involved in morphogenesis of epithelial monolayers. To our knowledge, this is the first attempt to systematically show how each of these activities acts on tissue kinematics. Specifically, we showed that cell anisotropic active stress results mainly in cell elongation, whereas anisotropies in cortical contractility primarily effects cell intercalations or T1 transitions. Including cell motilities appears to enhance tissue shear generated by the other two modes of internal forcing. We perturbed active stress and line edge tension by inhibiting ROCK, which has been reported to be involved in cell-cell contact integrity in vivo (Nishimura and Takeichi, 2008; Ewald et al., 2012), and recently, in cell responses to stretching in vitro (Hart, 2020). This led to experimentally blocking the ability of colonies to respond to the externally applied uniaxial cyclic stretching. By doing so, colonies which primarily elongate through cell intercalations, shifted to a single cell elongation driven mechanism.
From our simulations, we could demonstrate that symmetry breaking and finger formation in colonies and the corresponding tissue kinematics observed in our experiments could be brought about by collective active behavior of the colony cells and does not require special action of leader cells (Theveneau and Linker, 2017). This result echoes experiments in which the emergence of the leader cells and the fingering behavior at the border were suggested to arise due to the internal stress pattern in the tissue (Vishwakarma et al., 2018). On the other hand, there are many excellent models in which the boundary cells are ascribed special motility properties that could replicate the experimental results on border fingering (Mark et al., 2010; Tarle et al., 2015). Thus, although leader cells at the boundary may play a role in the border fingering, our experimental findings and simulations clearly indicate that the cell-level internal activities and cell-cell interactions are sufficient to cause symmetry breaking in the colony shape and its overall kinematics via the collective cell-shape nematic field.
Conclusion
Our results show that cell elongation nematic field can have an impact on epithelia morphogenesis. It was already reported that topological defects in the cell elongation nematic field have a key role on epithelial dynamics (Kawaguchi et al., 2017) and on cell death and extrusion (Saw et al., 2017). Now, we showed that circular epithelial colonies when in confinement build up a mean nematic orientation. This symmetry breaking results from the inner activity of cells, and sets the direction for colony elongation. Epithelia changes in shape could be revisited in vivo with this new framework, leading to potential generic rule of morphogenesis in developmental biology.
Materials and methods
Cell culture
Request a detailed protocolMDCK cells (GFP-E-cadherin strain [Adams et al., 1998], GFP-Actin strain, mCherry-actin / GFP-myosin strain [Klingner et al., 2014]) were cultured in Dulbecco’s modified Eagle medium (D-MEM) 1 g/l glucose (Invitrogen), supplemented with 10% fetal bovine serum (FBS) (Invitrogen) and 1% penicillin-streptomycin (and the corresponding resistance for each strain). Cells were passaged every 2–3 days using standard procedures. Caco-2 cells (ATCC) were cultured in minimum essential media (MEM) supplemented with Earle’s salts (Life Technologies), 20% fetal calf serum (FCS) (Invitrogen), 0.1 mM non-essential amino acids, 1 mM sodium pyruvate, and 40 µg/ml Gentamicin at 37°C and 5% CO2. Culture was passaged every 3–4 days. MCF 10A cells (ATCC) were cultured in Dulbecco’s modified Eagle medium (D-MEM) 1 g/l glucose (Invitrogen), supplemented with 10% horse serum (Invitrogen), 5 µg/ml insulin, 40 µg/ml Gentamicin, 2 mM L-Glutamine, 0.5 µg/ml Hydrocortisone, and 2 ng/ml human epidermal growth factor (hEGF). Cells were passaged every 2–3 days. Cells tested negative for mycoplasma.
Fabrication of PDMS membranes and stencils
Request a detailed protocolPoly(dimethylsiloxane) (PDMS) (Sylgard) was prepared by mixing the pre-polymer and the cross-linker at a 10:1 ratio. To prepare stretchable membranes, uncured PDMS was first centrifuged (3000 rpm for 5 min) to remove air bubbles. Afterwards, the PDMS was spin-coated on a flat polystyrene (PS) surface (500 rpm for 1 min) and cured at 65°C overnight. PDMS stencils were prepared as described previously (Ostuni et al., 2000). Briefly, SU-8 2050 molds containing circles of 250 µm in diameter were prepared by standard photolithography. Uncured PDMS was then spin-coated on molds to a thickness lower than the height of the microstructures (50 µm) and cured overnight at 65°C. Stencils for the finger experiments were prepared by spin-coating uncured PDMS on a flat surface.
Cell seeding on stencils
Request a detailed protocolThe PDMS stencils were cut, peeled off the mold, and placed in a 2% Pluronic F-127 (Sigma-Aldrich) in PBS for 1 hr. The stencils were then kept in PBS for 2 hr and dried under the hood flow. PDMS stretchable membranes were cut and then activated using O2 plasma. The membranes and the stencils were exposed to UV light in the cell culture hood for 10 min. Afterwards, stretchable membranes were incubated with fibronectin 20 µg/ml for 1 hr, rinsed with PBS and dried. PDMS membranes were placed on a PS holder, and the PDMS stencils were deposited on top of the membrane right after. A rectangular PDMS chamber was attached onto the membrane using vacuum grease, and cells were seeded at a density of 20,000 cells/mm2 (Serra-Picamal et al., 2012) for 4 hr. When cells were attached, the medium was changed and the membrane with the cells was kept in the incubator. Local cell density could vary within each colony. We followed the dynamics of assembly of the colony prior removal of the stencil and we could see that cellular clusters size distribution and respective location within the cavity at plating could contribute to these variations. Once they formed confluent circular colonies, the stencils were removed with tweezers carefully before starting the experiment. Some of the colonies exhibited elongation in the short time window between stencil removal and the start of image acquisition.
Time-lapse microscopy
Request a detailed protocolAfter stencil removal, the medium was replaced by L-15 (Leibovitz’s L-15 medium, Invitrogen) supplemented with 10% FBS. Cells were then observed under a Nikon Ti inverted microscope using either a x10 or a x20 objective for 6 hr at 37°C. Images were acquired every 5 min.
Stretching experiments
Request a detailed protocolThe stretching device was designed in the lab. Briefly, a Thorlabs motor (Thorlabs z812 motor, Thorlabs) was controlling the motion of a PDMS membrane, and everything was mounted on a custom-made microscope stage. Circular colonies were plated on PDMS membranes, and after removal of the stencils, samples were placed on the microscope. Cyclic uniaxial stretches were applied and images were taken every 30 min typically shortly to prevent interfering with the time course of the experiments. We probed three times for cycles, 20, 60, 120 s, and three extensions, 5, 10, and 20%. The shape of the cycles was triangular. We checked that the PDMS membranes were elastic at all extension and frequency ranges.
Chemical treatments
Request a detailed protocolTo prevent the formation of E-cadherin-mediated adhesion, cells were incubated for 30 min with L-15 medium containing 5 mM EDTA (Sigma-Aldrich) and 10 µg/ml anti-E-cadherin blocking antibody that targeted the extracellular domain of E-cadherin (Gumbiner et al., 1988) (uvomorulin, monoclonal anti-E- cadherin antibody, Sigma); after incubation, the medium was replaced by normal L-15 and the experiment started. The inhibition of ROCK was done by incubating cells with Y-27632 50 µM solution (Sigma-Aldrich) from 30 min before the experiment started until the end of the experiment.
Finger dynamics experiments
Request a detailed protocolFor the finger test after growth, we let finger grow for 2 hr, and we subsequently applied the cyclic stretch.
Colony shape change analysis
Request a detailed protocolShape change analysis was performed using ImageJ (http://rsb.info.nih.gov/ij, NIH). The outline of the colony on phase contrast images was ellipse fitted at every time point. Major axis a, minor axis b, and ellipse orientation θ were obtained. We computed Q, defined as Qxx(t) = ½ ln(a(t)/b(t))·cos2·(θ(t) − α) and Qxy(t) = ½ln(a(t)/b(t))·sin2·(θ(t) − α ) being α = θ(tfinal) to quantify cell colony elongation. In uniaxial stretching experiments, the x axis corresponds to the direction of the external stretch and Q components are defined as Qxx(t) = ½ ln(a(t)/b(t))·cos2·(θ(t) − α) and Qxy(t) = ½ln(a(t)/b(t))·sin2·(θ(t) − α) being α = 0.
Velocity analysis
Request a detailed protocolThe centroid trajectories of cells were tracked using the manual tracking plug-in in ImageJ. Data analysis was performed using a custom-made code in MATLAB (The MathWorks). Cell positions were characterized by a vector r(t), with t denoting time and r position in space (bold letter refers to a vector). Every recorded cell position during the time-lapse experiment was defined as ri = r(ti), where ti = iΔt are the times of recording and Δt denotes the duration of time-lapses. The average velocity of each cell was then defined as v = (1/T)·∑iri, being ri the module of the vector ri and T the total duration of the trajectory.
Colony segmentation and cell tracking
Request a detailed protocolMovies acquired using an MDCK GFP-E-cadherin strain were first pre-processed with FIJI. The subtract background function was applied to remove noise. Images were then loaded to Tissue Analyzer (TA) v8.5 (Aigouy et al., 2010) for edge detection and cell tracking.
Orientation field of the cells and topological defects
Request a detailed protocolFirst, the background noise of the time-lapse images of the elongating MDCK colonies was reduced with the subtract background function by using a rolling ball radius of 40 px. The resulting images were then subjected to band-pass filter with upper and lower limits of 40 px and 3 px, respectively. The background noise from this output was reduced by using the subtract background command again with a rolling ball radius of 40 px. The processed images from each experiment were analyzed with the OrientationJ plugin of FIJI to quantify their local spatial orientation that reflects the underlying cell elongation. Within this plugin, we used a local smoothing window of 20 px (approximately of the size of the cells) to obtain the structure tensor at discrete points on a grid of 20 px × 20 px. The plugin provides the dominant direction of the structure tensor at each point that represents the local orientation field for cell elongation. The OrientationJ plugin also provides the coherence C of the structure tensor to quantify the strength of the orientation; and would approximately correspond to rounded and elongated cells, respectively. The orientation or the director field q thus obtained was further quantified by studying the spatiotemporal evolution of ±1/2 topological defects that were obtained by calculating the winding number over unit-cells of the underlying grid. The local smoothing window of 20 px for obtaining the structure tensor, which is approximately of the size of cells, ensured that the most robust defects were observed. The validity of this procedure was cross-verified with the smoothed cell-shape nematic field and the corresponding ±½ defects from the segmented and triangulated data of the experiments processed in Tissue Miner (TM) (Figure 5—figure supplement 2 and Appendix 1). Finally, the orientation of mean cell-shape nematic calculated at 0 hr was compared with shape orientation of the colony at t = 2 hr. For obtaining the cell-shape nematic field for MCF 10A colonies, the procedure was the same as for MDCK control but the numerical parameters used were, rolling ball radius for subtract background 50 px, no band pass filter, and local smoothing window of 15 px and grid size of 30 px for OrientationJ. Similarly, for obtaining the cell-shape nematic field for stretched colonies, the procedure was the same as for MDCK control but the numerical parameters used were, rolling ball radius for subtract background 50 px, no band pass filter, and local smoothing window of 40 px and grid size of 30 px for OrientationJ. See Appendix 1 for more details (also see Video 6).
Acto-myosin cables
Request a detailed protocolIn order to image acto-myosin supracellular cables at the boundary of colonies either cells expressing mCherry-actin / GFP-myosin strain or cell immunostaining were used. To disrupt acto-myosin cables, local injection of 4 µM Cytochalasin D using a micropipette was performed. Glass micropipettes were connected to a microinjection system (CellTram vario, Eppendorf). The position of the pipette tip was controlled in x, y, z by using a micromanipulator. The system was mounted on an epifluorescence inverted microscope to record the process. Cytochalasin D was released locally for about 10 min. To detect discontinuities in the cable, fluorescent images of actin and myosin were treated using Fiji as follows. First, a median filter was applied and the background subtracted. Then, a contrast-limited adaptive histogram equalization (CLAHE) was used and the background was again removed using an exponential function. Images corresponding to actin and myosin were added. Finally, a Laplacian of Gaussian filter was applied to the resulting image. Once the cable structure was revealed, the positions of the defects were identified.
Quantification of cellular deformations, topological transitions, and their contribution to pure shear deformation
Request a detailed protocolAfter obtaining the geometrical and topological information of the colonies from the series tracked images generated using TA, TM was used to extract, triangulate and store the data with the help of an automated workflow. The database obtained after this stage of analysis was used to quantify various state properties such as cell area, neighbor number, cell elongation and the contribution of different cellular processes to deformation using scripts written both in R and in Python. TM was further used to quantify the contributions of various cellular events such as cell elongation and topological transitions to the colony deformation. More details about this analysis can be found in Appendix 1 (also see Video 7).
Vertex model simulations
Request a detailed protocolA vertex model was developed with an addition of a unit nematic director p to every cell. The orientation of the boundary cell p was maintained parallel to the boundary, whereas p for internal cells were modeled to tend to align with the p of its neighbors. In these simulations, an extensile active stress with <0 acts to increase cell elongation along p. In addition, a bias λ was also applied on the basic edge tension with respect to the director p of its neighboring cells. For positive λ, this bias reduces (increases) the tension of the edge along (perpendicular to) p. Consequently, the closure (formation) of edges is enhanced in the direction perpendicular (parallel) to p. Hence, the T1 transitions in the region around the cells are oriented to cause shear elongation (contraction) along (perpendicular) to p. The colony is provided with an initial condition for p that mimics the initial configuration of experimentally frequently observed cell shape nematic fields q with two +½ defects that are separated by a distance. The initial polar vector orientation along the nematic axis are chosen at random such that the total polarity is zero, and the dynamics of polarity reorientation is independent on a p → -p flipping of the polarity axis. To begin with, the cell positions and director orientations were evolved under colony confinement until cell position and p do not change significantly. The confinement is then removed to see how the colony breaks symmetry in its shape. In another set of simulations, a small motility v0 was also provided to the internal cells (Figure 7—figure supplement 1). Similar to the experiments, the output of these simulations was also processed in TM and analyzed for topological defects and pure shear decomposition. For colonies subjected to uniaxial cyclic stretching, p for any cell was provided with an additional tendency to align along the stretching orientation (x-axis). Moreover, the active stress in this case was contractile, that is the cell tended to elongate perpendicular to the orientation of p. More details of the simulations are provided in Appendix 2 (also see Videos 8 and 9).
Statistics
No statistical methods were used to predetermine sample size. Measurements were performed on different colonies (n) obtained in different independent experiments (N). The exact values are defined at the caption of each figure. Data presentation (as Mean value ± standard deviation (SD) or as Mean value ± standard error of the mean (SE)) is defined at the corresponding figure caption. D’Agostino normality test, Mann-Whitney test and Pearson’s correlation were performed using GraphPad Prism 8. Specific values are noted at the corresponding figure captions.
Appendix 1
Quantification of tissue kinematics
In the first step of analysis, time-lapse images of MDCK colonies are segmented to partition the tissue into individual cells and then tracked for their movements using Tissue-Analyser (TA) plugin of FIJI (Aigouy et al., 2010; Aigouy et al., 2016) (see Figure 6—figure supplement 1a-i). This information of the tracked cell colony is then passed to Tissue-Miner (TM), which extracts data and stores the cellular geometry and connectivity in the form of cell vertices and bonds using a snakemake based automated workflow (see Figure 6—figure supplement 1j-l). As described in Merkel et al., 2017; Etournay et al., 2016, TM has R or Python API that can be used to quantify fine-grained (cell-level) and coarse-grained (colony-level) deformation properties of epithelial colonies. Even though the scripts to calculate the basic kinematic quantities are available, users have the freedom to add new computational routines to calculate the quantities of their interest.
A. Analysis of cell elongation
Cell-shape anisotropy is an important marker of stress in the cells in response to either internal activity or external forcing (Paluch and Heisenberg, 2009; Rauzi and Lenne, 2011). To understand and quantify the elongation of cells over time, TM computes an elongation parameter proposed in Aigouy et al., 2010. In their study to understand the role of flow in orienting the axis of polarity in Drosophila wings, Aigouy et al., 2010 use a nematic tensor with a magnitude and orientation to quantify the elongation of each cell. For a given cell with area , the elongation nematic tensor is proposed as
(1)
This tensor E is traceless and symmetric with components given by
(2)
where is the distance to cell boundary at an angle (SI of Aigouy et al., 2010). For this nematic tensor, the magnitude is given by
(3)
and the orientation is given by angle
(4)
Based on the above expressions, the spatial distribution of the magnitude of shape nematic for individual cells within the colony for three time points is shown in Figure 6—figure supplement 2a-c. The fine-grained nematic segments for individual cells whose magnitude is proportional to and orientation is (Figure 6—figure supplement 2d-f). The coarse-grained representation of this tensor (Figure 6—figure supplement 2g-i) is obtained by spatially averaging the elongation nematic over several cells by using a Gaussian smoothing kernel of size comparable to the size of cells (30 pixels in this case). From the figures it is clear that the elongation of interior cells is strongly correlated with the orientation of the future ‘finger’ even at h.
B. Analysis of tissue deformation from components of pure shear strain via triangulation
As discussed earlier, during different stages of morphogenesis, epithelial tissues are reported to undergo a series of physical changes. The various internal and external forces that are being applied to the tissue during these processes result in deformation and rearrangement of constituent cells. The shape modification rate of the tissue is quantified in terms of the anisotropic component of shear strain rate. However, at the tissue level in epithelial sheets, shear strain can arise due to a combination of cell elongation, T1 transitions, cell division, cell extrusion, and correlation effects. By studying each both component separately and with respect to the other components, one can get hints regarding the mechano-chemical state of the colony. As is described in Etournay et al., 2016, for any general 2-D velocity vector , the gradient tensor can be defined as
(5)
The above velocity gradient tensor for a group of cells can be split into three parts: (i) isotropic component to obtain the rate of area change, (ii) symmetric traceless component to quantify the pure shear strain rate, and (iii) an antisymmetric part that represents the local vorticity (Etournay et al., 2015; Etournay et al., 2016) as follows
Here, more specifically, is the trace of the velocity gradient tensor, or the divergence of the velocity field and quantifies the rate of contraction or expansion in the cell area. The traceless symmetric part is the pure shear strain rate and quantifies shape changes in the tissue. The antisymmetric component is the vorticity of the velocity field and provides values of rotational rates of the group of cells during deformation.
The total pure shear strain rate of the tissue , now represented in a tensorial form , can be further split into traceless, symmetric, components as follows
(7)
where is the shear contribution coming from average cell elongation, is the shear contribution from T1 transitions, from cell divisions, from cell extrusions and due to the correlations effects in the tissue which arise due to coarse graining effects. Detailed derivation and discussion of this expression are available in Etournay et al., 2015; Etournay et al., 2016; Merkel et al., 2017. The contributions from above mentioned components are quantified using the triangulation approach (Merkel et al., 2017). As shown in Figure 6—figure supplement 2j-l, the triangulation method considers the entire colony without the boundary cells as a network of triangles, connecting the centers of the neighboring cells. Any topological changes in the form of cell division or extrusion will lead to a new triangulation. The shear strain rates in Equation 7 can be integrated over time to provide cumulative shape deformation and the corresponding cumulative shear decomposition for the cell colony, and is obtained for the complete colony without including the external boundary cells (Figure 6b). Figure 4 of Etournay et al., 2015 schematically represents this decomposition of total tissue shear into individual cellular events.
In Drosophila pupal wing the x axis is naturally provided by the A-P axis. In our in vitro situation, however, the x axis is chosen as the dominant direction of colony elongation, such that at the end of the experiment ( h) the cumulative value of the total shear strain rate . The cumulative shear decomposition plots for the experiments and simulations are shown in Figure 6, Figure 6—figure supplement 3 and Figure 7—figure supplement 1.
C. Correlation between the orientation of mean cell-shape nematic and the orientation of the overall colony elongation
As discussed earlier, the shape of a cell can be thought of to be represented by a nematic tensor . Upon averaging this quantity over multiple cells, we obtain nematic field over the colony. As described in the previous sub-section, this nematic tensor is traceless and symmetric with an orientation (Figure 5—figure supplement 2 and Figure 6—figure supplement 2g-i) and magnitude such that
(8)
(9)
This nematic field is obtained for our MDCK colonies by analyzing time-lapse images with the OrientationJ plugin of ImageJ (Püspöki et al., 2016; Saw et al., 2017). We verified that this image based approach gives results that are comparable with those obtained by spatially smoothing (with Gaussian kernel) the individual cell-shape nematics extracted from the segmented images of the colonies (Appendix 1A, Figure 5—figure supplement 2 and Figure 6—figure supplement 2). At any particular time t, the mean nematic field for the colony is
(10)
(11)
The orientation of the mean cell-shape nematic is then simply
(12)
where is implemented in Matlab using the inbuilt function atan2 (MATLAB, 2018). In this analysis, the coherence of the image structure tensor is the counterpart of the magnitude of the mean cell-shape nematic (Püspöki et al., 2016). We then compare the final colony orientation , which is obtained from ellipse fitting, with the orientation of the mean colony nematic (Figure 5b and Figure 5—figure supplement 2). Also refer to Materials and Methods: Orientation field of the cells and topological defects in the Main Paper for additional details.
D. Topological defects as readouts of cell-shape nematic orientation field
Any nematic field can contain topological defects (Kleman and Laverntovich, 2003). A visual inspection of the cell-shape orientation field for MDCK colonies indicates the possible presence of topological defects (Figure 5 and Figure 5—figure supplement 2). The strength k of topological charge for this field (Appendix 1C) in a given region is obtained as
(13)
where the line integral is calculated by traversing the curve that encloses this region in an anticlockwise sense. For the experimental colonies, the nematic field is not continuous but obtained on the vertices of the grid-cell as shown in Figure 5—figure supplement 5. In this case, the topological charge k enclosed within the grid-cell is
(14)
where the notation is as shown in Figure 5—figure supplement 5. If no topological defect is present within the cell then . Else, the net topological charge would evaluate to , corresponding to the effective strength of the topological defects within the cell.
The location and strength of topological defects thus obtained for the experimental data could then be used to approximately depict the entire nematic field as follows. We first model the energetics of the nematic orientation field with one constant Frank free energy (de Gennes and Prost, 1995). If we then assume that the orientation field is in local mechanical equilibrium at every time-step, it will then satisfy the Laplace equation (Kleman and Laverntovich, 2003). The resulting orientation field for the nematic field in the presence of a single topological defect of strength k at the origin has a singular solution of the form
(15)
where is the polar angle and is a harmonic function that satisfies that Laplace equation (Kleman and Laverntovich, 2003). However, for the current paper we find that taking to be a constant that determines the orientation of the topological defect is sufficient to approximate the orientation of nematic field (Figure 5d). Hence, as per Equations 13 and 15 the integral
(16)
for a closed curved around the defect gives . If multiple defects are present in the domain, this solution for can be generalised to give
(17)
where and ki are the coordinates and the strength, respectively, of the nematic topological defect obtained from the experimental data, and dictates the orientation of the defect. Here, the subscript in is added to distinguish it from the experimentally obtained . As before, is implemented in Matlab using the inbuilt function atan2 (MATLAB, 2018). We now use the fitting parameter in to see how well it represents the orientation field by using the following procedure. The experimental field is obtained on a grid with N points , where . The difference between and is quantified by the residue
(18)
obtained over the grid points k. The minimization of the value of over would provide us with a field where in a mean sense. Interestingly, by using this simple approach with just one fitting parameter , we can get an excellent representation of the experimentally obtain nematic orientation field (Figure 5d).
E. Statistical test for cumulative distribution of the orientation differences between and
To check if the orientation of the colony elongation at is correlated with the orientation of the mean cell-shape nematic at , we examine the difference . Specifically, as shown in Figure 5c, we obtain the cumulative distribution function (CDF) for . If the quantity is completely random, i.e., is completely uncorrelated with , then the probability density for is equal to . In such a case the CDF() as a function of should simply be a straight line with a slope of . However, it can clearly be seen that the experimentally observed CDF is significantly above this line, especially at relatively smaller values of . This indicates that there indeed is correlation between and .
We now note that the total number of experiments (colonies) that were analysed for Figure 5c is . To check if the correlation between and holds up for this finite sample size, we do the following. Let us take the probability density , i.e., this relative angle is uniformly random between and . If we now sample values for then we have created a random counterpart to the actual experimental result. We repeat this trial using a straightforward Matlab script and obtain samples, each with experiments. Of all the samples thus randomly generated, for a given we select those samples i for which . If for a particular the total number of such selected samples is , the probability of observing equal or higher bias towards alignment of the two angles from a random experiment than that actually observed experimentally is (Figure 5—figure supplement 2d). It can clearly be seen that the percentage probability of observing such high values of CDF for smaller from a completely random sampling of is , i.e., approximately one sample of experiments for every 100 samples, a very low number. The few colonies for which does not match well with appear to align with the orientation of tissue initial elongation – the associated mechanism is, however, still open (see Figure 5—figure supplement 2e). This entire analysis clearly indicates that the orientation of the mean cell-shape nematic at the initial time has correlation with the final anisotropy orientation of the colony with a high probability.
Appendix 2
Vertex model simulation
A planar vertex model is one of the most commonly used computational tool to understand mechanics of epithelial monolayers (Farhadifar et al., 2007). In this description, the tissue is assumed to be a 2-D sheet composed of cells which are represented by planar polygons sharing vertices and edges with their neighbors (Figure 7a). Governing equations are formulated to study the dynamics of evolution of each vertex of a cell. The total effective energy or work-function W of the tissue arises from area deformation of the cells and a combination of acto-myosin contractility and membrane adhesion energy at the cell interfaces (Figure 7a).
(19)
where for a particular cell , is the actual area and is the preferred cell area. is the length of the bond connecting shared between the cells and and is the effective contractility of that bond (Alt et al., 2017). Note that the energy W depends both on the position of the vertices and cell connectivity.
For this model, the force acting on a particular vertex i can be obtained by taking a derivative of (Fletcher et al., 2014; Farhadifar et al., 2007) with respect to the vertex position as,
(20a)
(20b)
and is balanced by the friction force on the vertex from the substrate. Here, represents effective substrate viscosity experienced by the vertex via cell-substrate friction (Fletcher et al., 2014). A mathematically equivalent description of the vertex model could also be made by using mechanical equilibrium or principle of virtual work (Chen and Brodland, 2000; Alt et al., 2017).
A. Inclusion of active cell stress in the vertex model formulation
Collectively migrating epithelial cells can have an active stress of the form (Popović et al., 2017)
(21)
where for and , respectively, for contractile and extensile cell active stress. When , the cell has a tendency to contract along its polarisation and elongate perpendicular it, and vice-versa when . The goal of this section is to present how this stress within a particular cell can be accommodated in the vertex model formalism by obtaining the corresponding active force on the vertex i of the cell (Figure 7a).
1. Formulation of obtaining virtual strain of the cell from virtual displacement of cell vertices
We note that, when the vertices are provided virtual displacement of , the total internal virtual work because of the action of the cell active stress on the resulting virtual deformation gradient is
(22)
where A is the instantaneous area of the cell. We note that the negative sign in front of the summation sign arises since is taken as the force exerted by the interior of the cell on the vertices.
If we can find a relation between and , then Equation 22 will provide us with expression for . We first note that, assuming an affine virtual displacement field, the virtual displacement of any vertex i of a given cell k will be given as
(23)
where the superscript c denotes the centroid of vertices, with position
(24)
the virtual displacement of this centroid is
(25)
and
(26)
Here, is the number of vertices of the cell under consideration. The connection between and as per Equation 23 provides a set of , independent linear equations, and can be guaranteed a unique solution in terms of the four independent components of the tensor , i.e., and only for . For , we obtain a solution in the sense of least squares. To do that we minimise the error
(27)
where repeated summation is implied over the Greek numerals , and , which can take values of 1 and 2. This error S is to be minimised over , and will give four independent linear equations. Differentiating S with respect to , we get the following set of equations (in indicial notation)
(28)
These equations can be written in more readable format in the following manner.
(29)
where the quantities are defined as follows:
(30)
such that . Equation 29 can be solved to provide the components of as follows.
(31)
Thus in Equation 31 we have the virtual deformation tensor for a given cell k in terms of the virtual displacement of its vertices with respect to its vertex centroid. These expressions are to be substituted in Equation 22 to find the forces that are exerted on cell vertices due to the active cell stress in Equation 21.
2. Connection between cell active stress and vertex forces
The active stress for the cell in Equation 21 can be written in indicial notation as
(32)
and the contribution to the virtual work is
(33)
Using the expression for from Equation 31 we get
(34)
We now note from Equation 30 that
(35)
Using Equation 35, Equation 34 is rewritten as
(36)
Hence, from Equations 36 and 34 the contribution to the force on vertex i due to the cell active stress from the cell is
(37)
It can very easily be seen from Equation 37 that for a given cell, the sum of all the active forces on the vertices of that cell will be zero. Moreover, the total torque of all these forces with respect to the vertex centroid as defined in Equation 24 can also be shown to be equal to zero. This is as expected from a symmetric stress tensor. In the current work, we take the cell active stress as extensile, and hence (Saw et al., 2017).
Finally, the contribution of this active force to any vertex is a vector sum of the force contributions coming from all the cells that the vertex is a part of, and is given by,
(38)
The active force on the vertex would be added to the forces from cell area deformation and cell edge contractility as discussed in the earlier section.
B. Polarised or biased edge tensions
It is observed that T1 transitions can be influenced by the polarity of the cells (Sato et al., 2015). Such bias in T1 transitions can be introduced in the vertex model by modifying the tension of any edge based on its relative orientation with respect to the polarity and of the shared cells (Figure 7a) as
(39)
where the quantities , , are, respectively, the base edge tension, angle dependent edge tension bias, and correlated noise that is calculated as
(40)
(41)
(42)
Here, and are the correlation time and strength, respectively, for the correlated noise. This noise promotes T1 transitions and introduces tissue fluidity in the vertex model (Curran et al., 2016). The angle dependent bias ensure that the edges that are parallel (perpendicular) to the polarisation of the cells have a tension that is lower (higher) by than its base value . This bias enhances the propensity of tissue shear along cell polarisation due to T1 transitions.
C. Inclusion of cell motility
In addition to the forces described in the previous section, cells can also generate motility force (Mogilner and Oster, 1996; Pollard and Borisy, 2003). Following the idea of self-propelled cells (Bi et al., 2016), any cell can also be modeled to have a speed v0, such that in the absence of any other forces it moves with a velocity , where is the polarisation direction of the cell as described earlier (Figure 7a). A simplest representation of motile force on a particular vertex i is
(43)
where is the total number of cells that contain the particular vertex i, and is the index of each of these cells (Sussman, 2017). The motile force, if included, will be in addition to the forces as described in the previous sections.
D. Dynamical evolution
Dynamical evolution in these simulations involves updating the position of vertex i as per the following equation
(44)
where the subscripts basic, active, and motile correspond to the contributions to the forces, respectively, from basic vertex model, active stress and biased edge tensions, and cell motility. The evolution of edge tensions is as discussed in the previous section. In addition to the evolution of the vertex positions, whenever the size of any edge becomes smaller than a critical size , a connectivity change, termed as T1 transition in the literature Alt et al., 2017; Fletcher et al., 2014, is implemented – the size of the new edge (Figure 7a).
The next step is to update the polarisation of the cells. In our description, the for a given cell is modeled to have a tendency to align with the orientation of its neighbours (ngb) without distinction between and . i.e., nematically. This is achieved with the following simple differential equation for of any cell in the interior:
(45)
where is such that
the is the vector normal to the plane of the paper.
is the rotational torque on that aligns it with respect to the mean orientation of its neighbors and is the alignment rate.
is the rotational torque that aligns along the orientation of the external uniaxial periodic stretching, when applied, and is the corresponding alignment rate.
The quantity ensures that nematically align with polarisation of the neighbours in a mean sense. Similarly, the quantity is to ensure that aligns nematically along the orientation of external uniaxial stretch, , when applied. The orientational noise is modeled as uncorrelated Gaussian noise of zero mean and strength . This evolution rule also automatically ensures that the for all the cells. For any cells at the boundary, the only difference is that the alignment torque is
where
and and correspond to the position vectors of the two contiguous cells of cell- at the boundary.
In the case of colony elongation in the absence of external stretching, the initial condition for the positions of the vertices and the polarisation of the cells is generated as follows. A confluent colony of 332 cells, a number similar to that observed experimentally, is initially confined within a circular region of radius (see Appendix 2E for clarification regarding the simulation parameters.) The cells are provided with an initial polarisation such that the orientation is
(46)
where and is the location of two defects, which are taken to be symmetrically separated by a distance of with respect to the center of the circle (also see Appendix 1D). An orientation shift of is randomly added to of individual cells such that the vector sum of over all the cells is zero. This step is irrelevant for the implementation of forces due to cell active stress and biased edge tensions due to their inherent nematic symmetry (Equations 21 and 39) but ensures that the total motile force from all the cells is zero. The cells are then provided with small active stress () and evolved under confinement for some time using the above rules till and are almost equilibrated. This configuration is then used as the initial condition for all the numerical experiments, in which the confinement is removed to allow the colonies to elongate (see Video 8). Different simulation conditions correspond to varying proportion of active cell stress , biased cell edge tension and cell motility . The results from the simulations are then analysed in a similar manner as for the experimental data (Figure 7—figure supplement 1).
This set of polarity evolution rules for the interior and the boundary cells ensure that in the steady-state the orientation field satisfies in a coarse-grained sense, i.e., on longer length-scales, the Laplace equation . The nematic field for the interior cells tends to have a uniform orientation, whereas the nematic field for the boundary cells tries to align along the colony boundary. Because of this boundary alignment tendency of the border cells, at least for the parameters used in our simulations (Appendix 2E), the total topological charge of the polarisation field is mostly conserved in our simulations, i.e., remains equal to the total initial charge of (for a relevant study in another context see van Bijnen et al., 2012.) Due to the action of active cell stress (Equation 21) the cells have a tendency to elongate predominantly along thus creating a cell-shape nematic orientation field (also Appendix 1A-C.) Hence, the cell elongation anisotropy, as described earlier in Appendix 1, can loosely be thought of to be a readout of the internal polarisation of the cells. However, since the actual cell shape results from the interplay between cell mechanical properties and active cell stress, and are not necessarily always fully aligned. Thus, for the cell-shape nematic field, the total topological charge can be less than if the aligning tendency of internal cells dominates, e.g., when the cell active stress is large (see Video 8).
When the effects of external uniaxial stretching are included in the model, we take the mstretch term to dominate due to which the polarisation of the cells align along the orientation of uniaxial stretching . Hence, in this case, the role of initial and boundary conditions, as discussed above, is not quite important. As described in the section “Vertex model recapitulates symmetry breaking and shear decomposition” of the main paper, the competition between the cell active stress () and biased cell edge tension determines if the colony elongates either along the orientation of stretching or perpendicular to it (see Video 9).
E. Parameters used and the non-dimensional groups present in the Vertex Model
Using reference scales for length (l0), time (t0) and energy (U0), we get the following set of non-dimensional groups for the various parameters that are involved in the simulations. The non-dimensional counterparts of the parameters used in the simulations have been assigned an additional to make them distinct from the original.
Substrate friction:
Area modulus:
Cell preferred area:
Edge contractility: , ,
Cellular active stress (negative sign indicates extensile): .
Motility:
Polarisation alignment rate:
Stretch alignment rate:
Strength of Gaussian noise for polarisation: (very small)
Relaxation time for edge tension fluctuations:
Total experimental time:
T1 transition cutoffs: and
Colony size:
Simulation time-step:
We can now choose the scales l0, t0, and U0. We use the simulation time-step . We get the values of total cumulative shear in the range that is comparable with the experimental values at the end of the 4000 simulation time. Since the total duration of the experiment is 2 hrs, this implies that in experimental units. We also know from the experiments that the area of one cell is . Since, within our simulations, the preferred area of cells is taken as , this implies that .
The energy (or force) scale can be chosen arbitrarily since it is present in both the left hand and the right hand sides of Equation 44, and must only be chosen consistently. We now figure out the relative contributions to the forces that can come from different components for a cell: motile force, active force, basic edge contractility, active edge contractility, and isotropic force. For the values used the non-dimensional (simulation) values are:
cell motile force:
cell active force (extensile):
basic edge tension:
biased edge tension:
cell area stress:
One can see that forces from all these sources are of the same order of magnitude. Specifically when we wish to compare the relative magnitudes of active edge contractility and the active stress, a quantity of relevance is . The values of the active terms , and used in the simulations are shown in Figure 7—figure supplement 1.
Data availability
All data generated or analysed during this study are included in the manuscript and supporting files.
References
-
Vertex models: from cell mechanics to tissue morphogenesisPhilosophical Transactions of the Royal Society B: Biological Sciences 372:20150520.https://doi.org/10.1098/rstb.2015.0520
-
Cell-Level finite element studies of viscous cells in planar aggregatesJournal of Biomechanical Engineering 122:394–401.https://doi.org/10.1115/1.1286563
-
Continuum model of epithelial morphogenesis during Caenorhabditis elegans embryonic elongationPhilosophical Transactions of the Royal Society A: Mathematical, Physical and Engineering Sciences 367:3379–3400.https://doi.org/10.1098/rsta.2009.0088
-
Defect-Mediated morphologies in growing cell coloniesPhysical Review Letters 117:1–5.https://doi.org/10.1103/PhysRevLett.117.048102
-
Guidance of collective cell migration by substrate geometryIntegrative Biology 5:1026–1035.https://doi.org/10.1039/c3ib40054a
-
Vertex models of epithelial morphogenesisBiophysical Journal 106:2291–2304.https://doi.org/10.1016/j.bpj.2013.11.4498
-
Formation of adherens junctions leads to the emergence of a tissue-level tension in epithelial monolayersJournal of Cell Science 127:2507–2517.https://doi.org/10.1242/jcs.142349
-
Drosophila dorsal closure: an orchestra of forces to zip shut the embryoMechanisms of Development 144:2–10.https://doi.org/10.1016/j.mod.2016.12.005
-
Tissue elongation requires oscillating contractions of a basal actomyosin networkNature Cell Biology 12:1133–1142.https://doi.org/10.1038/ncb2124
-
Isotropic actomyosin dynamics promote organization of the apical cell cortex in epithelial cellsJournal of Cell Biology 207:107–121.https://doi.org/10.1083/jcb.201402037
-
Cell surface mechanics and the control of cell shape, tissue patterns and morphogenesisNature Reviews Molecular Cell Biology 8:633–644.https://doi.org/10.1038/nrm2222
-
Physical model of the dynamic instability in an expanding cell cultureBiophysical Journal 98:361–370.https://doi.org/10.1016/j.bpj.2009.10.022
-
Cell motility driven by actin polymerizationBiophysical Journal 71:3030–3045.https://doi.org/10.1016/S0006-3495(96)79496-1
-
Emergence of active nematic behavior in monolayers of isotropic cellsPhysical Review Letters 122:48004.https://doi.org/10.1103/PhysRevLett.122.048004
-
Biology and physics of cell shape changes in developmentCurrent Biology 19:R790–R799.https://doi.org/10.1016/j.cub.2009.07.029
-
Active dynamics of tissue shear flowNew Journal of Physics 19:033006.https://doi.org/10.1088/1367-2630/aa5756
-
BookTransforms and Operators for Directional Bioimage Analysis: A Survey in Focus on Bio-Image InformaticsSpringer.
-
Nature and anisotropy of cortical forces orienting Drosophila tissue morphogenesisNature Cell Biology 10:1401–1410.https://doi.org/10.1038/ncb1798
-
Cortical forces in cell shape changes and tissue morphogenesisCurrent Topics in Developmental Biology 95:93–144.https://doi.org/10.1016/B978-0-12-385065-2.00004-9
-
Orientation and polarity in collectively migrating cell structures: statics and dynamicsBiophysical Journal 100:2566–2575.https://doi.org/10.1016/j.bpj.2011.04.047
-
Mechanical waves during tissue expansionNature Physics 8:628–634.https://doi.org/10.1038/nphys2355
-
cellGPU: massively parallel simulations of dynamic vertex modelsComputer Physics Communications 219:400–406.https://doi.org/10.1016/j.cpc.2017.06.001
-
Modeling the finger instability in an expanding cell monolayerIntegrative Biology 7:1218–1227.https://doi.org/10.1039/C5IB00092K
-
BookChapter Thirty-Five -C. elegans Embryonic MorphogenesisIn: Wassarman P, editors. Essays on Developmental Biology, Part A. Academic Press. pp. 597–616.
-
Signalling through mechanical inputs: a coordinated processJournal of Cell Science 125:3039–3049.https://doi.org/10.1242/jcs.093666
Article and author information
Author details
Guillaume Salbreux

Funding
Department of Biotechnology , Ministry of Science and Technology (BT/06/IYBA/2012)
- Mandar M Inamdar
Industrial Research and Consultancy Centre (IRCC Awards, IIT Bombay)
- Mandar M Inamdar
Cancer Research UK (FC001317)
- Guillaume Salbreux
Medical Research Council (FC001317)
- Guillaume Salbreux
Wellcome Trust (FC001317)
- Guillaume Salbreux
Centre National de la Recherche Scientifique (ANR-10-LABX-0030-INRT)
- Daniel Riveline
Agence Nationale de la Recherche (ANR-10-IDEX-0002-02)
- Daniel Riveline
ciFRC Strasbourg
- Daniel Riveline
University of Strasbourg
- Daniel Riveline
ISIS
- Daniel Riveline
The funders had no role in study design, data collection and interpretation, or the decision to submit the work for publication.
Acknowledgements
We acknowledge M Popovic and R Etournay for stimulating discussions and help with Tissue Miner, J Nelson, P Silberzan, S Coscoy for sharing the MDCK strains, and J Prost, K Dayal and M Zapotocky for helpful suggestions, D Rodriguez, M Lieb and the Riveline Lab. DR and MMI thank MPI-PKS and MPI-CBG for hospitality and many interactions. DR acknowledges support from CNRS (ATIP), ciFRC Strasbourg, the University of Strasbourg, Labex IGBMC, Foundation Cino del Duca. This study with the reference ANR-10-LABX-0030-INRT has been also supported by a French state fund through the Agence Nationale de la Recherche under the frame programme Investissements d’Avenir labelled ANR-10-IDEX-0002–02. MMI acknowledges funding from Department of Biotechnology, Government of India (BT/06/IYBA/2012) and Industrial Research and Consultancy Center (IRCC), IIT Bombay. GS was supported by the Francis Crick Institute which receives its core funding from Cancer Research UK (FC001317), the UK Medical Research Council (FC001317), and the Wellcome Trust (FC001317).
Copyright
© 2021, Comelles et al.
This article is distributed under the terms of the Creative Commons Attribution License, which permits unrestricted use and redistribution provided that the original author and source are credited.
Metrics
-
- 3,274
- views
-
- 556
- downloads
-
- 47
- citations
Views, downloads and citations are aggregated across all versions of this paper published by eLife.
Citations by DOI
-
- 47
- citations for umbrella DOI https://doi.org/10.7554/eLife.57730
Download links
A two-part list of links to download the article, or parts of the article, in various formats.
Downloads (link to download the article as PDF)
Open citations (links to open the citations from this article in various online reference manager services)
Cite this article (links to download the citations from this article in formats compatible with various reference manager tools)
Epithelial colonies in vitro elongate through collective effects
eLife 10:e57730.
https://doi.org/10.7554/eLife.57730


