Genome-wide CRISPR screens of oral squamous cell carcinoma reveal fitness genes in the Hippo pathway
- Head and Neck Cancer Research Team, Cancer Research Malaysia, Head and Neck Cancer Research Team, Malaysia
- Wellcome Sanger Institute, Wellcome Genome Campus, United Kingdom
- Department of Biostatistics and Bioinformatics, Moffitt Cancer Center, United States
- Oncology R&D AstraZeneca, CRUK Cambridge Institute, United Kingdom
- Department of Oral & Maxillofacial Clinical Sciences, Faculty of Dentistry, University of Malaya, Malaysia
Figures
Figure 1 with 1 supplement

Genome-wide CRISPR-Cas9 screen on 21 OSCC cell lines.
(A) Demographic details and genomic profile of the patients of which the 21 OSCC cell lines were derived from, with bar charts depicting the number of essential genes identified by MAGeCK. The presence of mutations/copy number alterations in the top five mutated genes in OSCC is shown. Numbers in first column indicated frequency of mutations (%) among OSCC tumors from TCGA (The Cancer Genome Atlas Network, 2015) while second column indicated frequency of mutation (%) among 21 OSCC cell lines. Bar charts in the lower panel shows the number of significant fitness genes (those with MAGeCK FDR less than or equal to 5%), with the orange bars representing the number of non-core fitness genes. Abbreviations: Ind – Indian; Chi – Chinese, Mal – Malay; Jap – Japanese, Cau – Caucasian; F – Female; M – Male; G – Gingiva; T – Tongue; BM – Buccal Mucosa; FOM – Floor of Mouth; LN – derived from lymph node metastasis. (B) Pie charts showing the proportion of fitness genes among the 18,010 genes screened. 918 non-core fitness genes were shortlisted after filtering out the core fitness genes. (C) Bar chart depicting the number of non-core fitness genes that are found in 1 to 21 dependent cell lines.
-
Figure 1—source data 1
Analysis result from the genome-wide CRISPR-Cas9 screens.
- https://cdn.elifesciences.org/articles/57761/elife-57761-fig1-data1-v2.xlsx
Figure 1—figure supplement 1
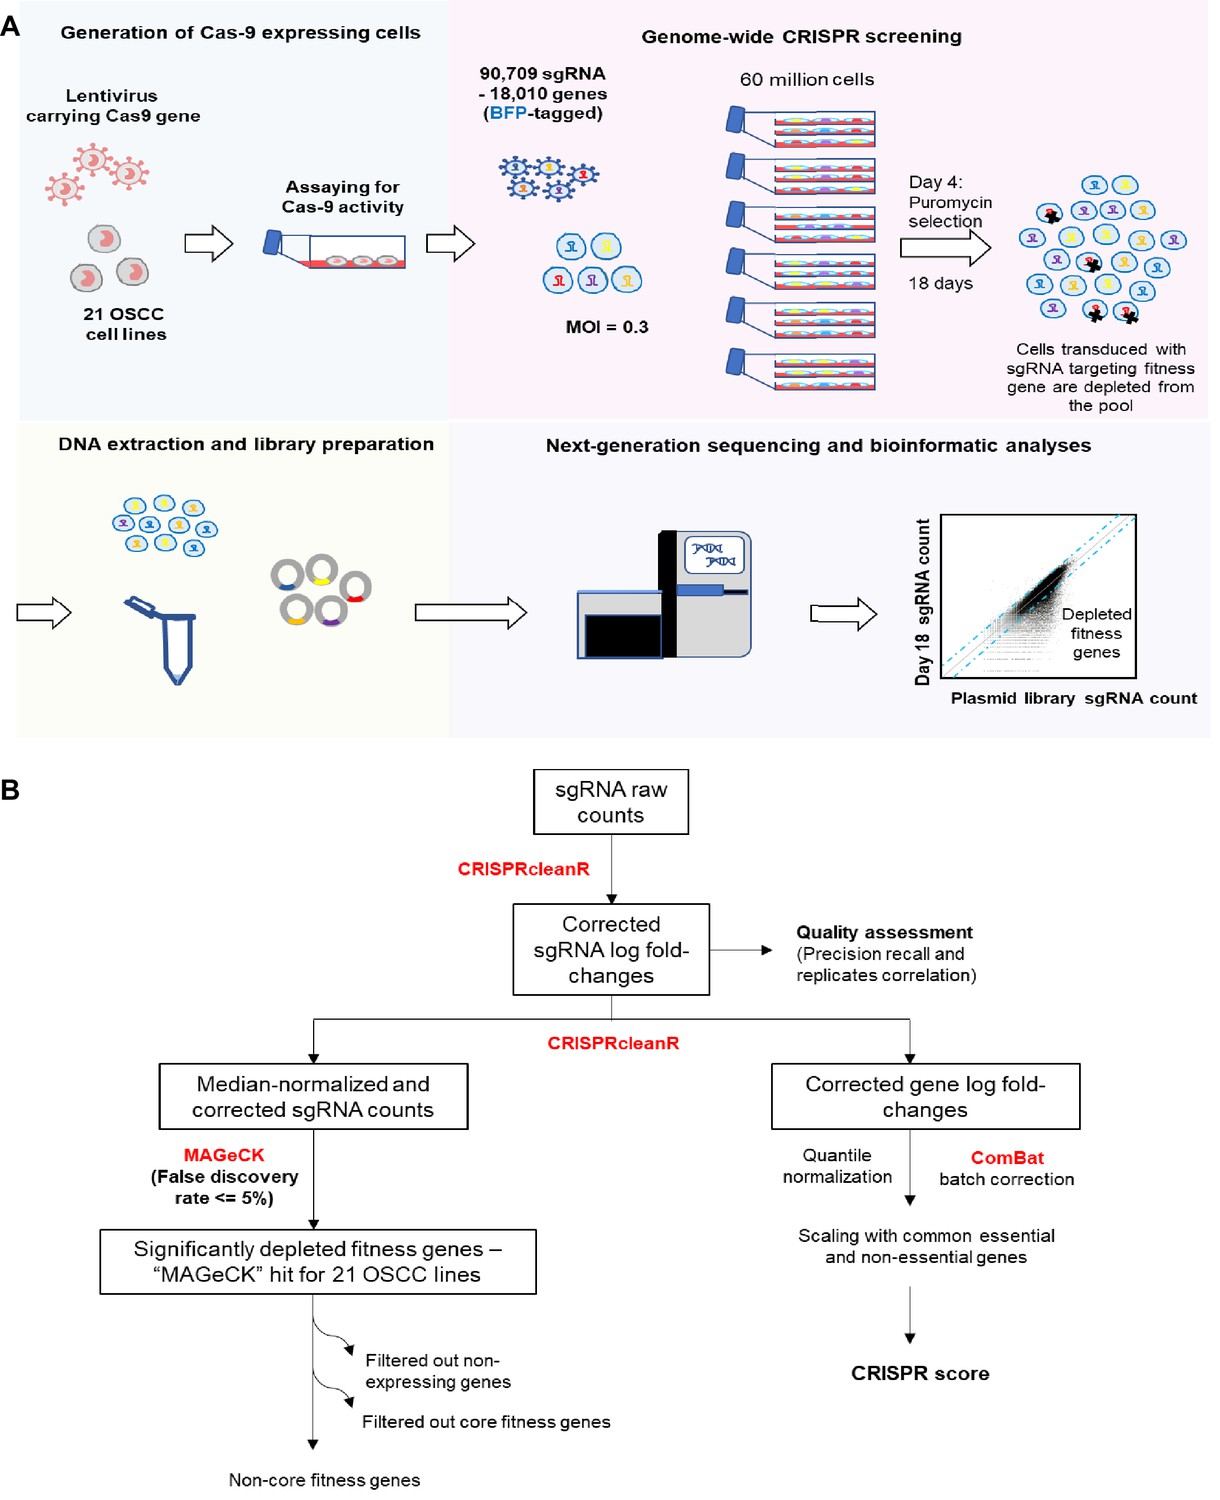
Genome-wide CRISPR-Cas9 screen.
(A) Schematic of the genome-wide CRISPR-Cas9 screening on 21 OSCC cell lines. (B) Workflow of CRISPR data processing and analysis pipeline, from raw sgRNA counts to the list of fitness genes that are significantly depleted during the genome-wide CRISPR screening and quantile normalized, batch corrected, scaled CRISPR score, using various bioinformatic tools/algorithms including CRISPRcleanR, MAGeCK and ComBat (indicated in Red font). For details, please refer to the Materials and methods section.
Figure 2 with 1 supplement

Identification and analysis of targetable genes and pathways in OSCC.
(A) Common oncogenic pathways altered among HNSCC samples of TCGA were annotated with frequency of dependency. Non-core fitness genes are indicated in red and the percentage of OSCC cell lines that were dependent on the genes are shown. The Drug Gene Interaction database (DGIdb) (http://www.dgidb.org/) was used to determine if the gene is clinically actionable while the availability of drugs were determined using Open Targets Platform (https://www.targetvalidation.org/). (B) Heatmap of gene essentiality of the 44 HNSCC cancer genes in the 21 OSCC lines. These are consensus cancer genes for HNSCC curated from Bailey et al., 2018 and Martincorena et al., 2018. (C) CRISPR scores of genes with driver mutations in at least one of the 21 OSCC cell lines. Cell lines labeled in green with mutation are examples of those showing oncogene addiction on mutated genes, for example on PIK3CA (ORL-150, BICR10, and HSC-2) and NFE2L2 (Ho-1-u-1). (D) Pathway enrichment analysis for fitness genes that are differentially enriched among the seven betel-quid associated OSCC. (E) Distribution of the 918 fitness genes based on their small molecule inhibitors tractability assessment. Tractability is defined as detailed in Behan et al., 2019 where: tractability group one included targets with approved drugs (Bucket 1) or drugs in clinical/pre-clinical development (Bucket 2, 3); tractability group two included targets with evidence supporting tractability albeit no drugs are available yet; while the least tractable group three included targets that lacks evidence informing tractability.
-
Figure 2—source data 1
Analysis results of targetable genes and pathways in OSCC.
- https://cdn.elifesciences.org/articles/57761/elife-57761-fig2-data1-v2.xlsx
Figure 2—figure supplement 1
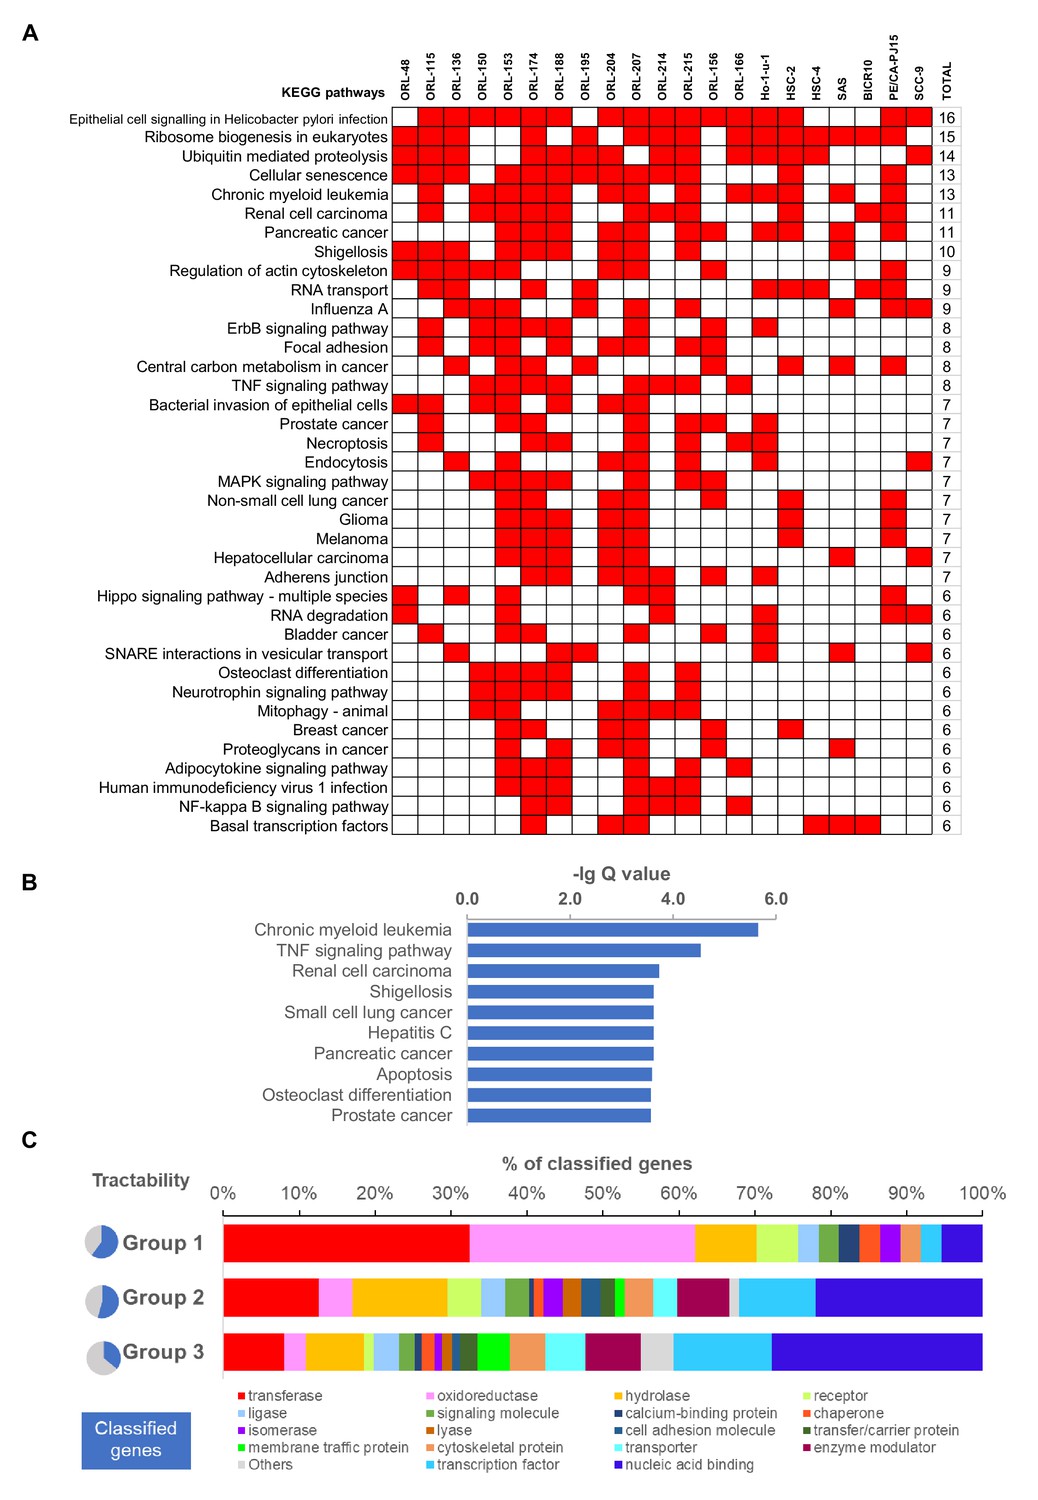
Pathway level enrichment analysis and tractability assessment of fitness genes.
(A) Significantly enriched KEGG pathway based on non-core fitness genes of individual cell lines. Binary heatmap of top 50 most common KEGG pathways enriched by respective non-core fitness genes in the 21 OSCC cell lines. Those with p-values less than 0.05 are indicated in red. (B) KEGG pathway enrichment analysis of the 918 non-core fitness genes shows significant enrichment for cancer-related pathways, potentially harboring more targetable cancer-specific genes. (C) Functional classification of 918 non-core fitness genes using PANTHER protein class database, separated based on their tractability group.
Figure 3 with 4 supplements
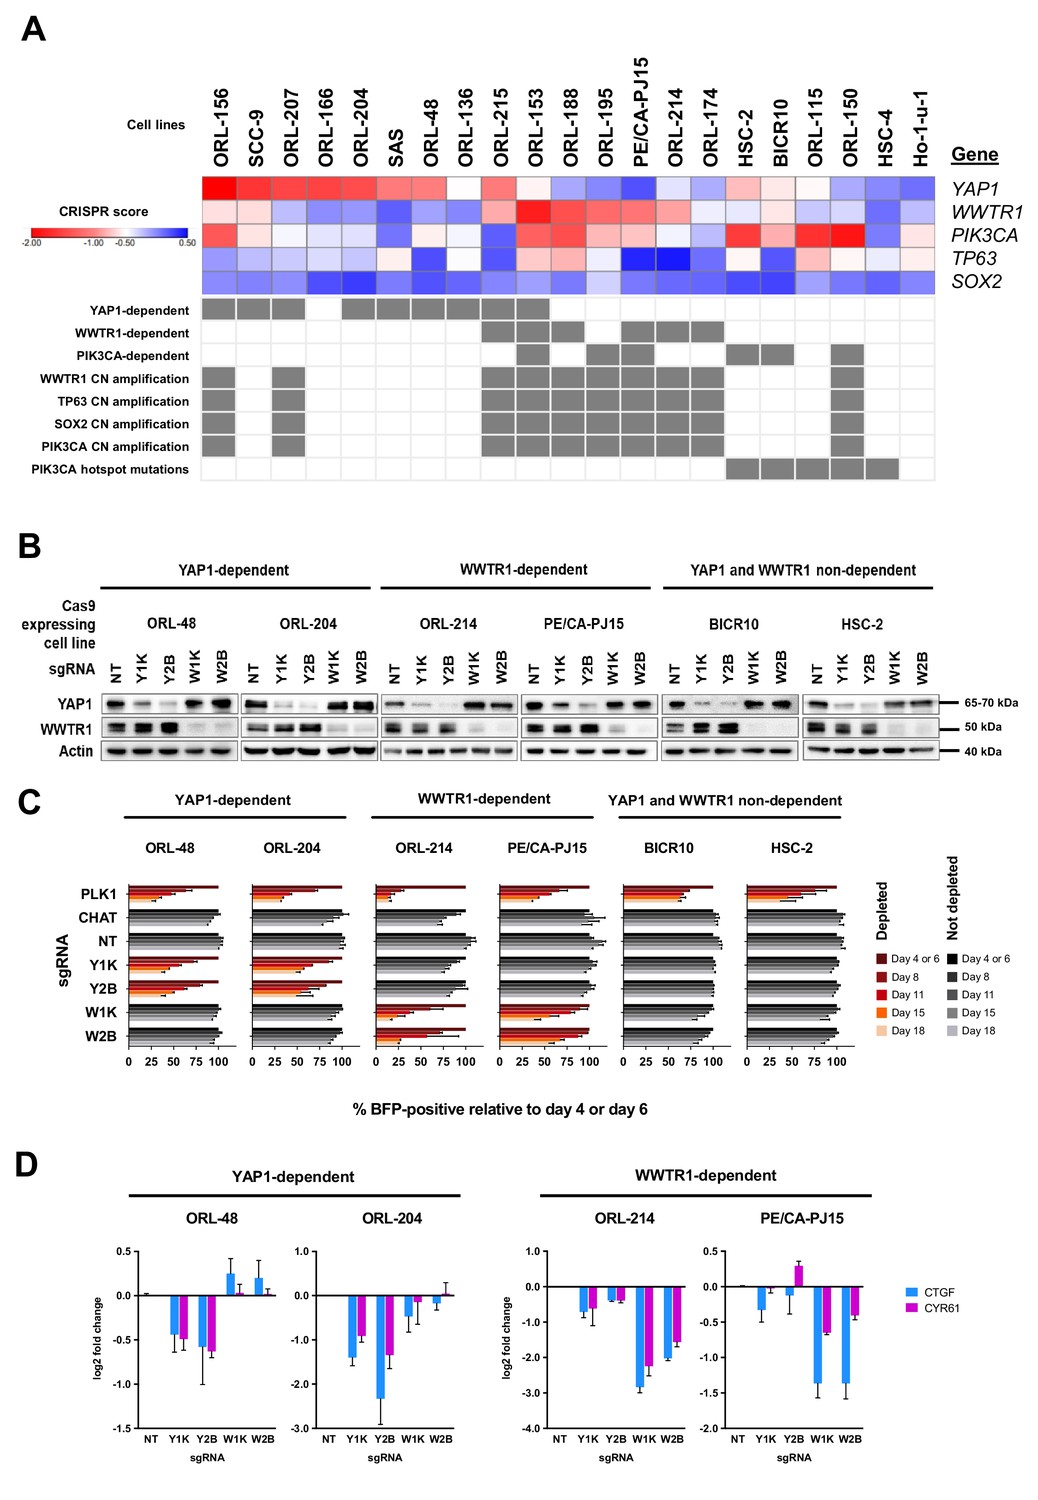
YAP1 and WWTR1 of the Hippo pathway are selectively essential in a distinct subset of OSCC cell lines.
(A) Essentiality profile (depicted with CRISPR scores heatmap) of YAP1, WWTR1, PIK3CA, TP63 and SOX2 across 21 OSCC cell lines derived from the CRISPR/Cas9 screen. Dependency on these genes were depicted as grey box in the bottom panel, according to the MAGeCK definition of significant depletion at FDR ≤ 0.05. No cell lines were dependent on TP63 or SOX2. The degree of essentiality differs across the lines. Some subsets of the cell lines are only dependent on either YAP1 or WWTR1, while neither gene appears to be essential in another subset of cell lines. PIK3CA, TP63 and SOX2 are genes implicated in HNSCC carcinogenesis that are often co-amplified with WWTR1, located on chromosome 3q25-28. All WWTR1-dependent cell lines had copy number amplification on these genes while all PIK3CA mutated cell lines are not dependent on either YAP1 or WWTR1. (B) Western blot images showing the protein level of YAP1 and WWTR1 on day 4 upon transducing the Cas-9 expressing cell lines with lentivirus carrying gene-specific sgRNA. Two sgRNAs were used per target gene. (C) Co-competition assay was used to validate the essentiality of YAP1 and WWTR1 on the selected cell lines. The growth of the BFP-positive transduced population was compared to the non-transduced population throughout the 18 days assay. The percentage of BFP-positive cells obtained at different time points were normalized to the day 4 readings for respective sgRNA (except ORL-204 which had time points normalized to the day 6 readings for respective sgRNA). PLK1 is a core essential gene included as a positive control. Negative controls include CHAT which is a non-essential gene across the panel of cell lines, and NT serves as a non-targeting control. Data are shown as mean ± SD (n = 2 biological repeats). (D) qPCR results show suppression of downstream targets of YAP1 and WWTR1 only when the respective fitness gene is being knocked-out. Down-regulation of CTGF and CYR61 gene expression was observed when YAP1 is knocked-out in the YAP1-dependent cell lines (ORL-48 and ORL-204). In the WWTR1-dependent cell lines (ORL-214, PE/CA-PJ15), CTGF and CYR61 expression is only suppressed when WWTR1 is knocked-out. Data are shown as mean ± SD (n = 2 independent experiments with technical triplicates).
-
Figure 3—source data 1
All raw data related to Figure 3 and its figure supplements on analysis result of YAP1 and WWTR1 as fitness genes for OSCC.
- https://cdn.elifesciences.org/articles/57761/elife-57761-fig3-data1-v2.xlsx
Figure 3—figure supplement 1
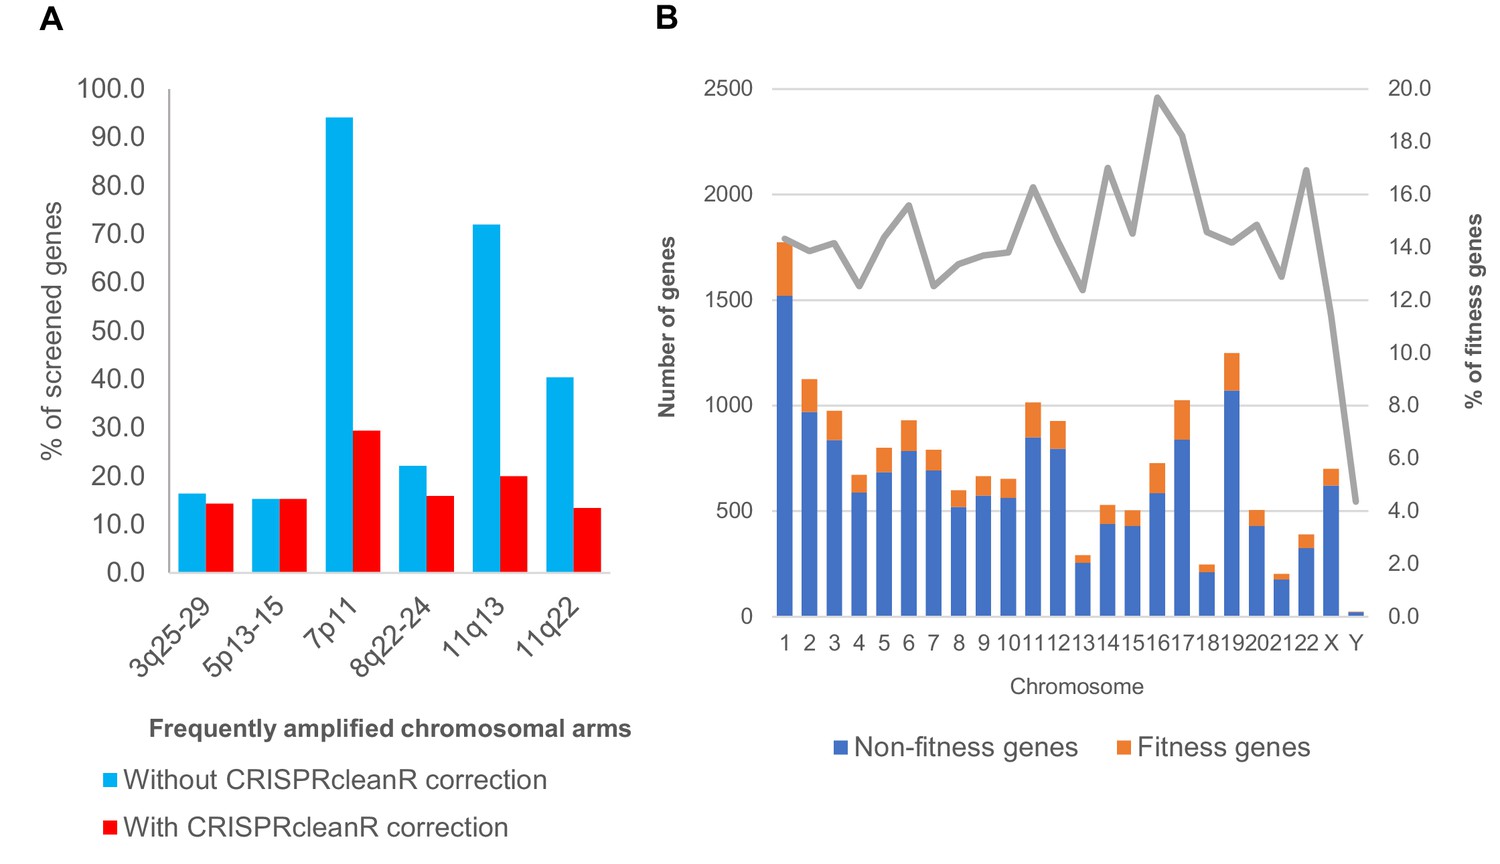
Fitness genes and copy number amplification.
(A) Barcharts showing proportion of screened genes identified by MAGeCK as fitness genes, before and after CRISPRcleanR correction, for those that mapped onto chromosomal region with frequent copy number amplification. (B) Distribution of MAGeCK fitness genes across all chromosomes. As expected, Y chromosome have the least percentage of genes being essential. For the rest of the chromosomes, proportion of MAGeCK fitness genes among screened genes ranged from 12 to 19%. Chromosome with frequent copy number amplification did not show significantly higher number of fitness genes.
Figure 3—figure supplement 2

YAP1 and WWTR1 from the Hippo signaling pathway are fitness genes for OSCC.
(A) KEGG pathway analysis of essential genes found on copy number amplified chromosome shows enrichment of pro-tumorigenic pathway including the Hippo signaling pathway. (B) The Hippo signaling pathway and annotation of genes that are OSCC fitness genes. (C) Oncoprint downloaded from cBioportal showing the copy number alterations of YAP1, WWTR1, PIK3CA, TP63, and SOX2 in the HNSCC samples (n = 295) (TCGA1). Co-amplification of WWTR1 with PIK3CA can be seen in majority of the cases, whereby 40/59 (68%) tumors with PIK3CA amplification also have WWTR1 amplification. (D) Boxplots of CRISPR scores for the five genes, classified into two groups with (n = 11) or without (n = 10) copy number amplification of genes on chromosome 3q25-28. OSCC with copy number amplification showed significantly more negative CRISPR score for WWTR1, i.e. more dependent on WWTR1. This correlation was not found for PIK3CA. TP63 and SOX2 were not essential in any of the 21 OSCC cell lines. Whiskers of boxplot show minimum and maximum values, lines representing median. Unpaired two-tailed t-test was used for calculating statistical difference between two groups. (E) Baseline mRNA expressions of YAP1 and WWTR1 in selected OSCC cell lines were quantified by qPCR. YAP1-dependent ORL-48 and ORL-204 showed upregulation of YAP1 expression. While in other OSCC cell lines, the extend of WWTR1 overexpression is higher than YAP1. OKF6/htert1, an immortalized normal oral epithelial cell line is used as reference control for calculation of relative fold difference of gene expression. Data are shown as mean ± SD (n = 3 technical repeats). (F) Baseline protein expression of YAP1 and WWTR1 protein in selected OSCC cell lines. Actin was probed as a loading control.
Figure 3—figure supplement 3
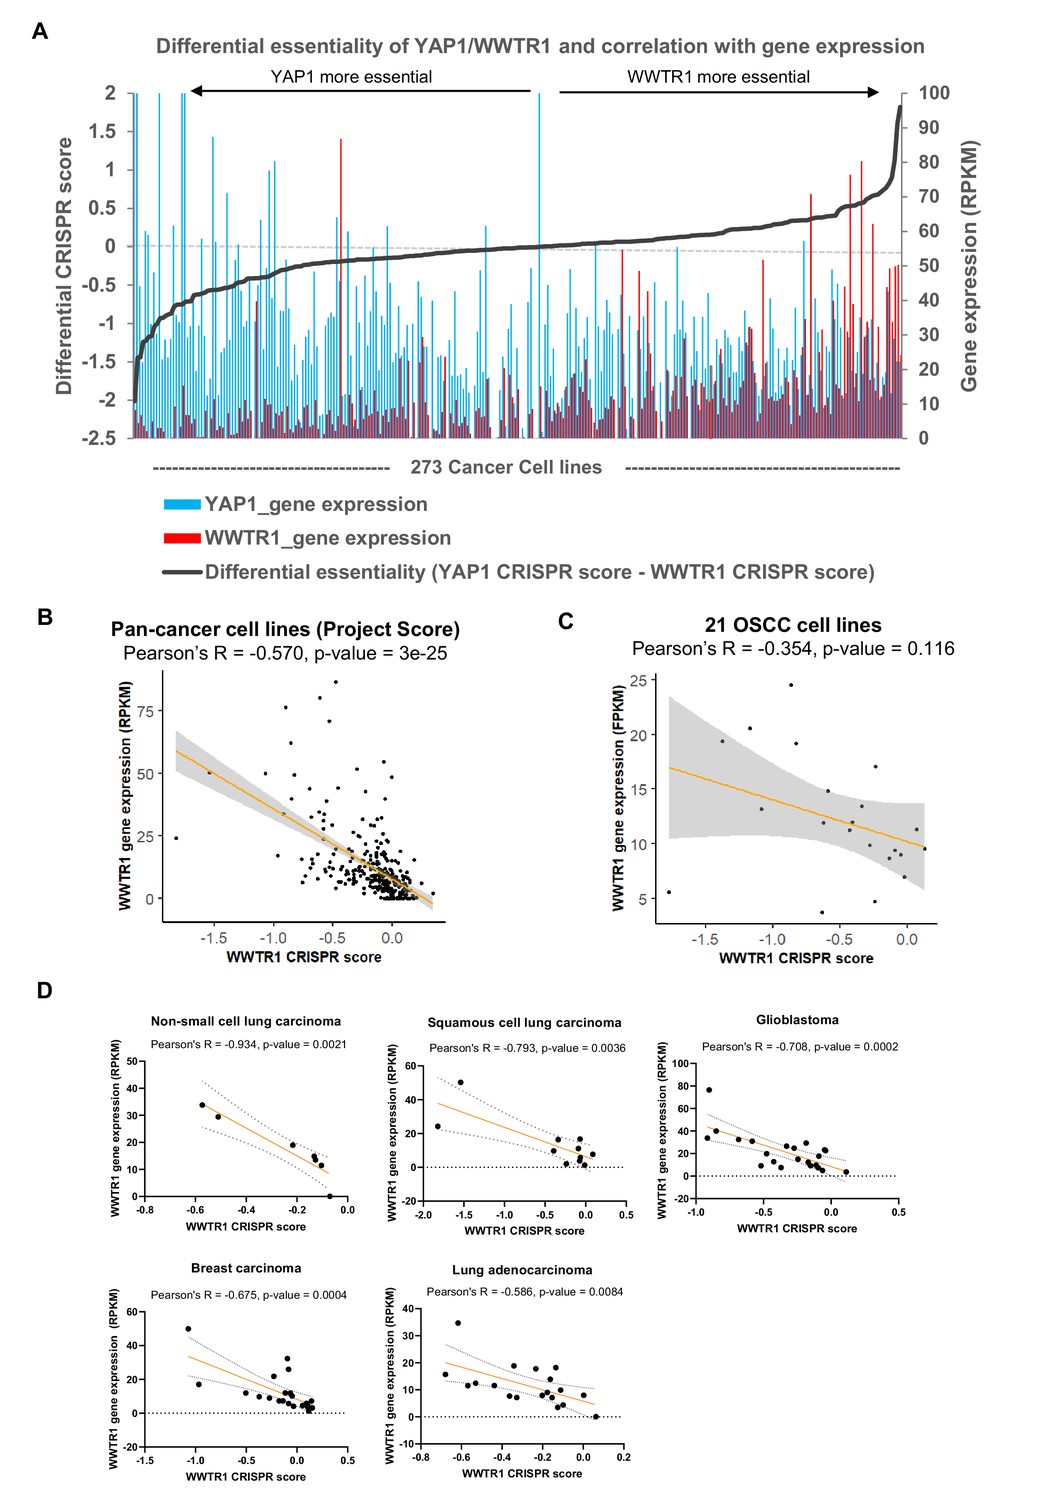
Correlation of gene essentiality and gene expression for YAP1/WWTR1.
(A) Plot of differential essentiality between YAP1 and WWTR1 reveal correlation of essentiality with gene expression. Gene expression and CRISPR score of YAP1 and WWTR1 from Project Score on 273 cancer cell lines were extracted. Those lines that are more dependent on YAP1 over WWTR1 (negative differential CRISPR score) are mostly with high YAP1 (blue) and low WWTR1 (red) expression; On the other hand, cell lines that are more dependent on WWTR1 are among those with overexpression of WWTR1 (red). (B) Significant negative correlation between WWTR1 gene expression and gene essentiality was evident in the 273 cancer cell lines screened in Project Score. Those cell lines that are dependent on WWTR1 (negative CRISPR score) tend to have higher WWTR1 expression. (C) WWTR1 gene expression and gene essentiality also showed non-significant negative correlation among the 21 OSCC lines screened. (D) Other cancer types showing significant negative correlation between WWTR1 gene expression and gene essentiality include non-small cell lung carcinoma, squamous cell lung carcinoma, glioblastoma, breast carcinoma, and lung adenocarcinoma (data from Project Score).
Figure 3—figure supplement 4
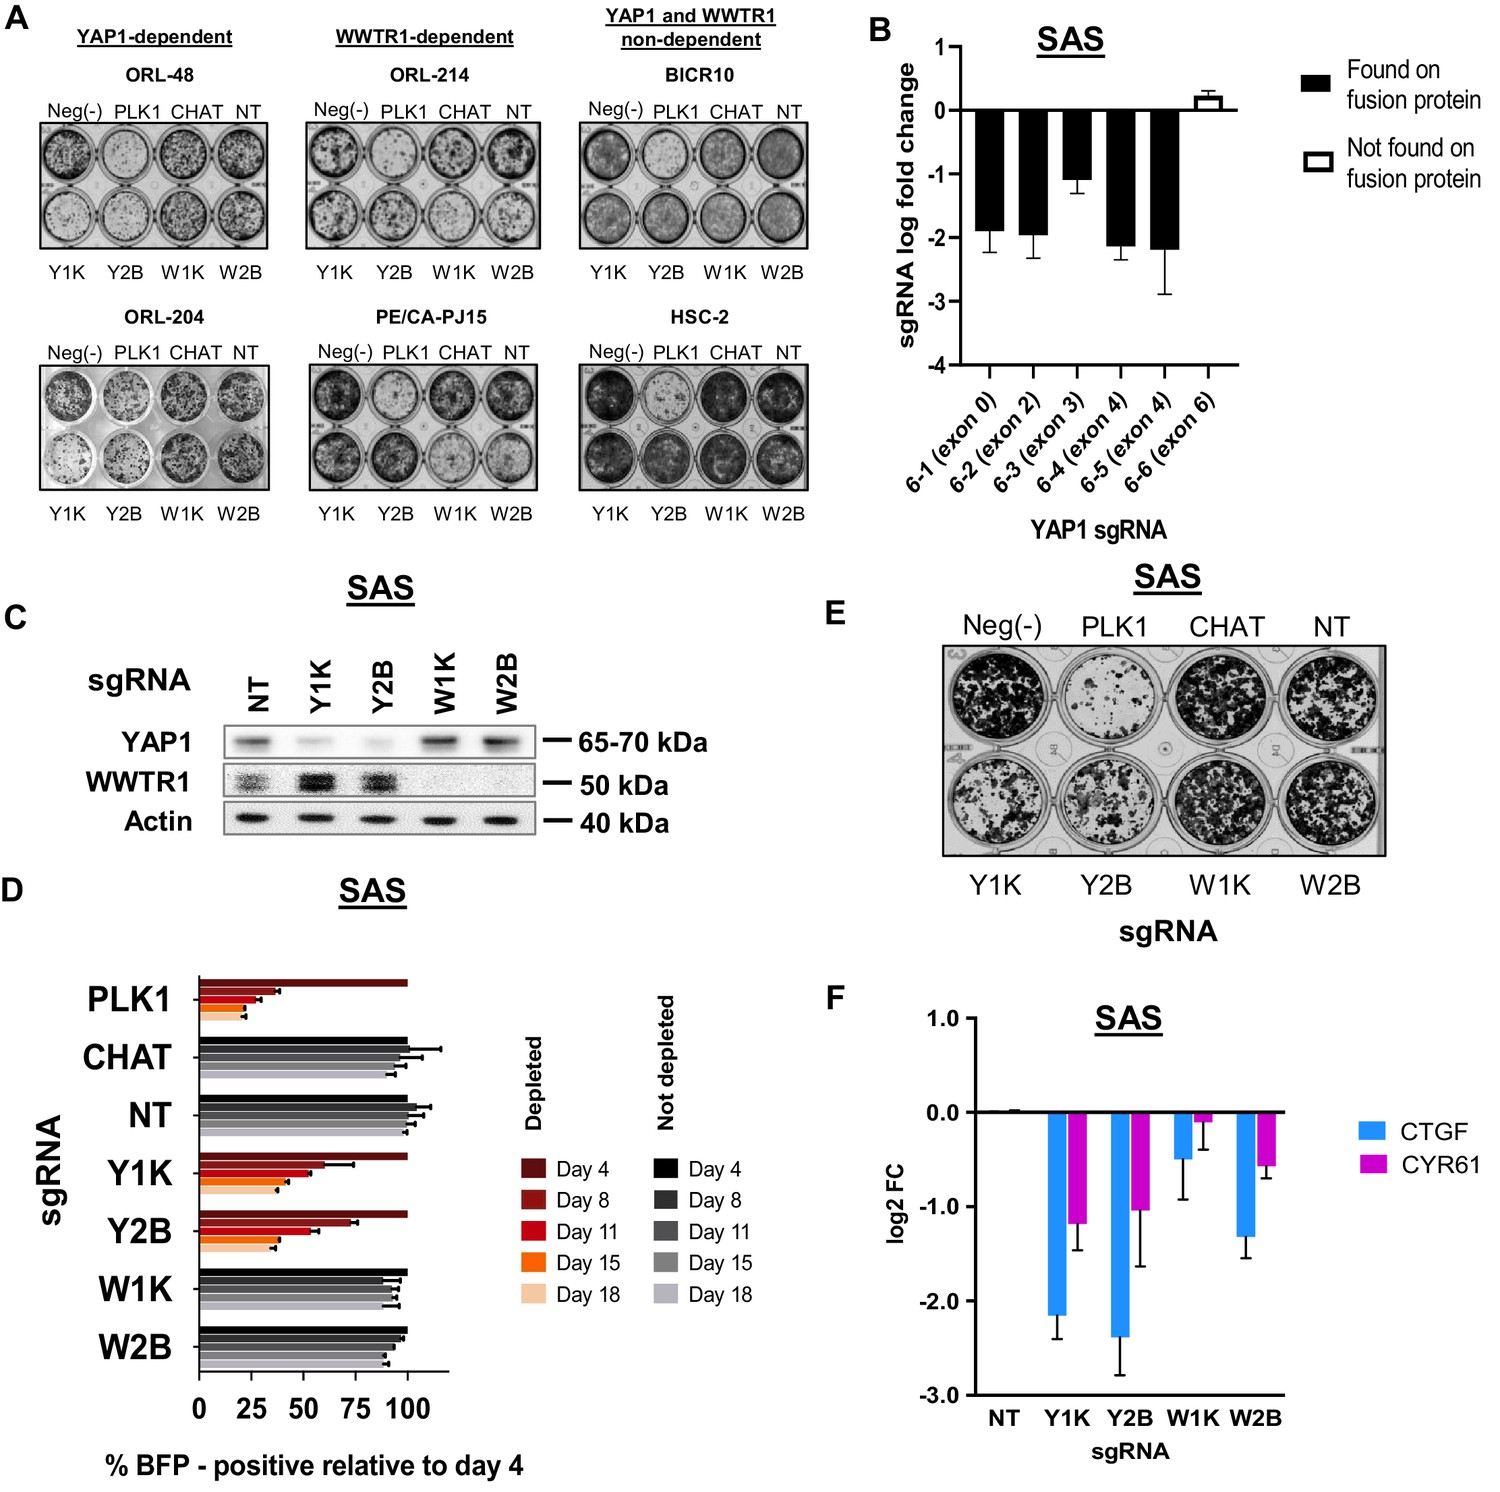
Clonogenic assay of representative lines and validation of YAP1 dependency in SAS.
(A) Clonogenic assay showing inhibitory effect upon knocking out respective fitness genes in YAP1- and WWTR1-dependent lines. In BICR10 and HSC-2 knocking out of either YAP1 or WWTR1 with sgRNAs did not have any impact on clonogenicity. Experiment is performed in technical triplicate and repeated twice. Representative image of one technical repeat is shown. (B) sgRNA level log fold change from triplicate CRISPR screens of SAS. Depletion were seen only in sgRNAs targeting exon 1–4 of YAP1, which were present in YAP1-MAML2 fusion protein, but not seen in sgRNA 6–6 which targets exon 6. Data are shown as mean ± SD (n = 3 biological repeats). (C) Western blot to check efficacy of target protein knockout using CRISPR/Cas9 on SAS. Y1K is one of the sgRNA from the KY library v1, targeting exon 4, while Y2B is an independent sgRNA targeting exon 1 of YAP1. (D) Co-competition assay results for SAS, validating its dependency on YAP1. Previous work by Picco et al., 20192 revealed oncogenic fusion of YAP1 with MAML2 in SAS, rendering the cells to be dependent on the fusion protein. Both our genome-wide screening data and validation data have also confirmed the preferential dependency of SAS on YAP1, over its paralog, WWTR1. (E) Clonogenicity assay confirmed preferential dependency of SAS on YAP1. (F) qPCR of downstream target genes showed relatively stronger suppression when the fitness gene, YAP1 is depleted with sgRNA Y1K or Y2B. Data are shown as mean ± SD (n = 2 independent experiments with technical triplicates).
Figure 4
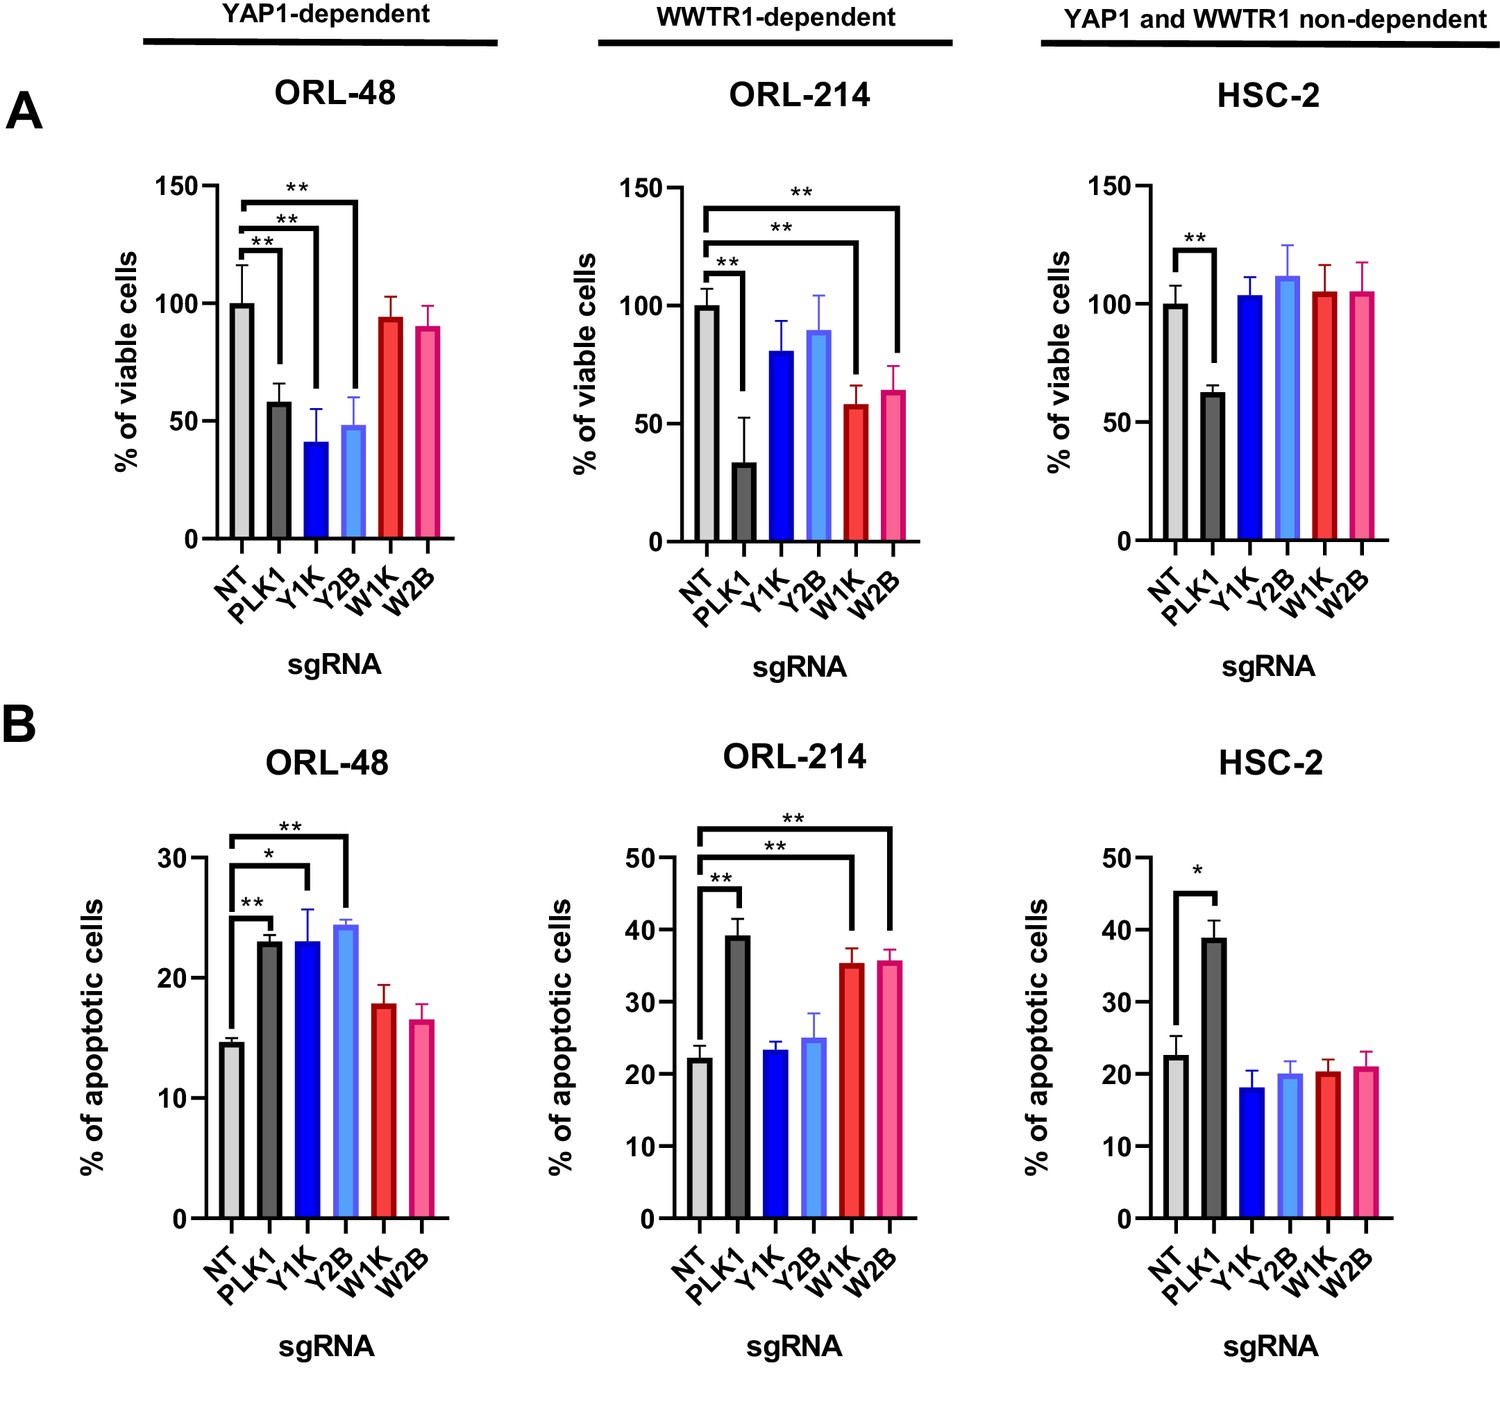
YAP1/WWTR1 knockout impairs proliferation and induces apoptosis in dependent cells.
(A) Knocking out YAP1 or WWTR1 significantly inhibited cell proliferation in the respective dependent cell lines. Cell viability of HSC-2 (a YAP1- and WWTR1-non-dependent cell line) was not affected by depletion of either YAP1 or WWTR1. Experiments are repeated twice in technical triplicates. (n = 3 technical repeats for two biological repeats). Data shown as mean ± SD. *p<0.01; **p<0.001. (B) Apoptosis assay revealed that YAP1 depletion in YAP1-dependent ORL-48 resulted in significant increase in apoptotic cells while WWTR1 depletion in WWTR1-dependent ORL-214 resulted in an increase in apoptotic cells. No significant changes in apoptotic cells were observed in HSC-2 when either YAP1 or WWTR1 was depleted. Experiments are repeated twice in technical triplicates. Data of one experiment are shown as mean ± SD (n = 3 technical repeats). *p<0.01; **p<0.001.
-
Figure 4—source data 1
Data for cell viability and apoptosis assays.
- https://cdn.elifesciences.org/articles/57761/elife-57761-fig4-data1-v2.xlsx
Figure 5
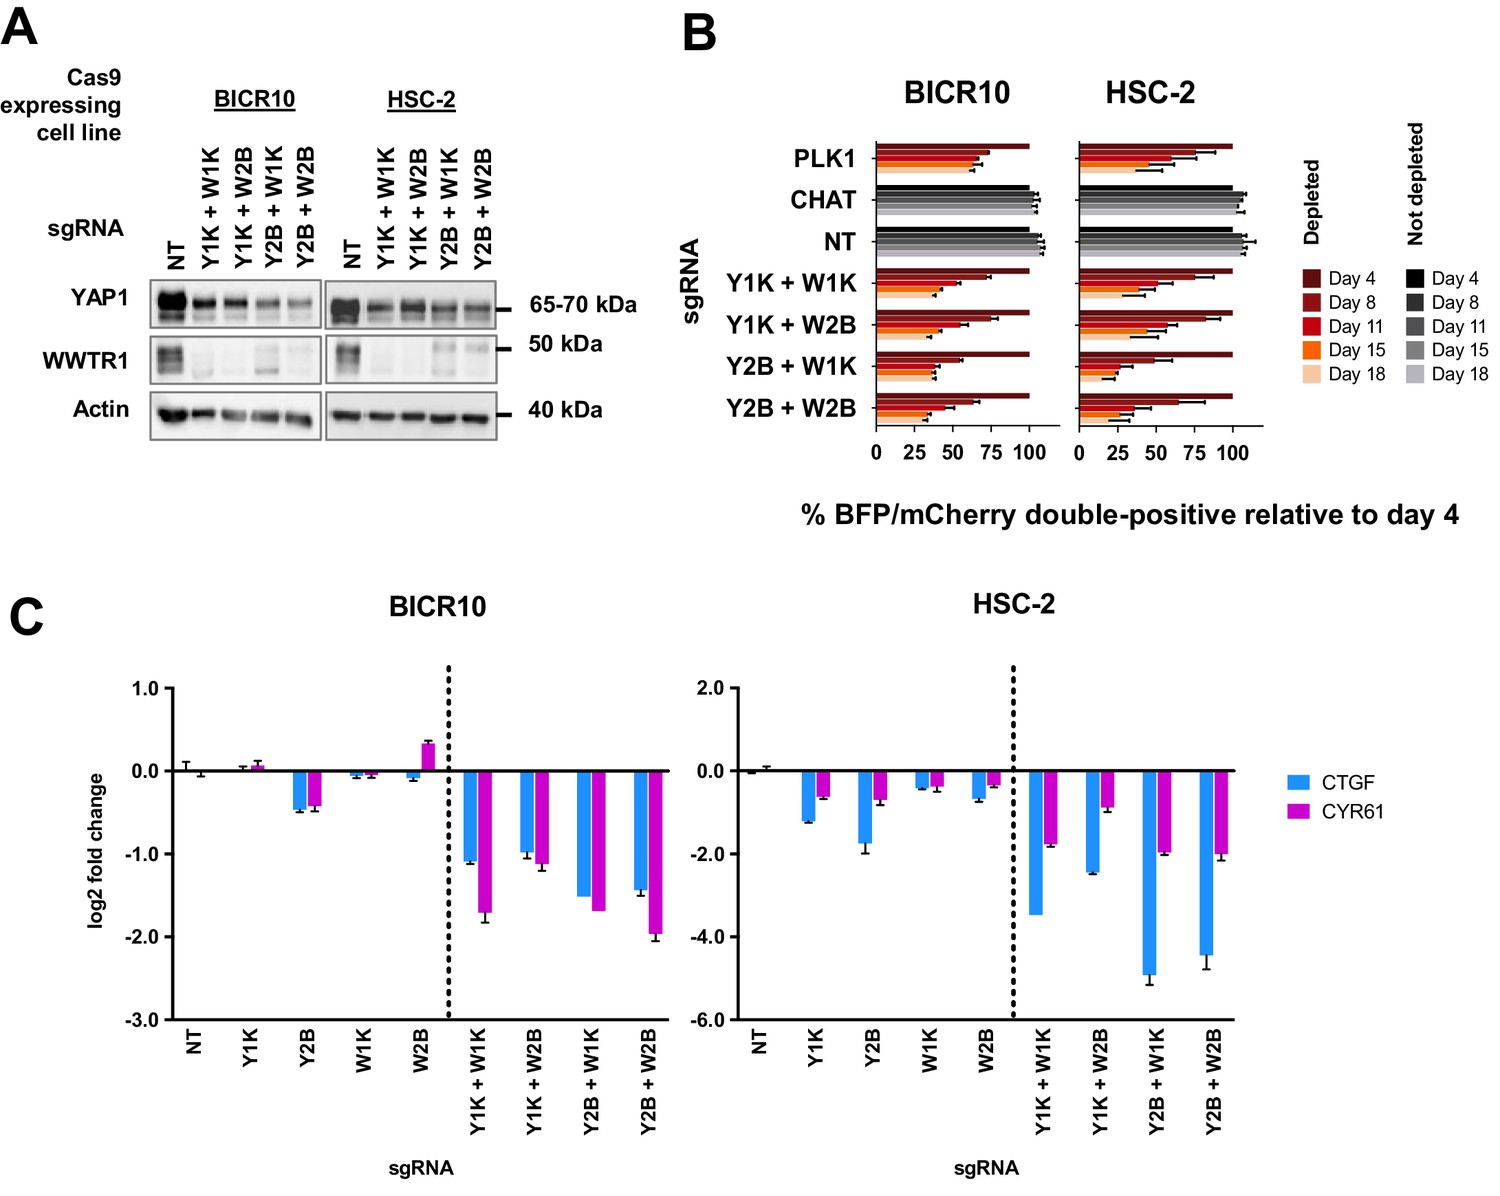
Simultaneous depletion of YAP1 and WWTR1 on BICR10 and HSC-2 inhibited cell growth, suggesting compensatory role of YAP1 and WWTR1.
(A) Western blot showing the protein level of YAP1 and WWTR1 in BICR10 and HSC-2 Cas9 cell lines upon different combinations of YAP1 and WWTR1 sgRNA co-transduction. sgRNAs that targeted YAP1 were tagged with BFP marker and WWTR1 sgRNAs were tagged with mCherry marker respectively, they were simultaneously transduced into the Cas9-expressing cell lines to achieve double knockout of YAP1 and WWTR1. (B) YAP1 and WWTR1 double knockout cells show inhibited growth in co-competitive assay. Simultaneous knockout of YAP1 and WWTR1 in Cas9-expressing BICR10 and HSC-2 resulted in the depletion of sgRNAs-transduced populations, which was not observed upon the depletion of either gene alone. Results shown were normalized to day 4. Data are shown as mean ± SD (n = 2 independent experiments with technical triplicates). (C) qPCR results revealed that strong suppression of CTGF and CYR61 gene expression in BICR10 and HSC-2 is only seen when YAP1 and WWTR1 are simultaneously knocked-out. qPCR was performed in technical triplicates. Data are shown as mean ± SD (n = 3 technical repeats).
-
Figure 5—source data 1
Data for co-competitive assay and qPCR.
- https://cdn.elifesciences.org/articles/57761/elife-57761-fig5-data1-v2.xlsx
Figure 6 with 3 supplements

Identification of YAP1/WWTR1 dependency associated gene signatures in OSCC tumors samples.
(A) Heatmap with hierarchical clustering using the computed signature scores showed clustering of the OSCC cell lines into three groups, based on their validated dependency. (B) Heatmap with hierarchical clustering of OSCC tumors using the computed signature scores. The three clusters found from cell lines were also present among the OSCC tumors. For labeling convenience, OSCC with high YAP1 dependency signature score is referred as ‘YAP1-dependent’; ‘WWTR1-dependent’ – high WWTR1 dependency signature score; ‘Compensable’ – high compensable signature score. (C) GSEA of the OSCC cell lines and those OSCC tumors with similar gene signatures showed overlapping hallmarks enrichment, while distinct hallmarks were associated with each of the three groups. Only common hallmarks (between cell lines and tumors) with positive normalized enrichment score (NES) of >0.5 were shown. Full GSEA results can be found in Supplementary file 7. (D) OSCC with high WWTR1 dependency signature score showed significantly lower stromal infiltration, but higher immune infiltration compared to the other two groups. (E) By comparing the immune expression signatures from Thorsson et al., 2018, OSCCs with high WWTR1 dependency signature score are associated with significantly higher IFN-gamma response and cytolytic CD8 T-cells and lower TGF-beta response. (F) mRNA expression of PD-L1 (CD274) were significantly elevated among OSCC tumors with high WWTR1 dependency signature score. (G) OSCC with high WWTR1 dependency signature score showed significantly higher enrichment score for the 18-gene T-cell inflamed GEP, which is a clinically validated biomarker of response towards checkpoint blockade. For panels D-G, unpaired Welch’s t-test with Welch’s correction was used due to unequal sample size (n = 43, 31, 30, respectively).
Figure 6—figure supplement 1
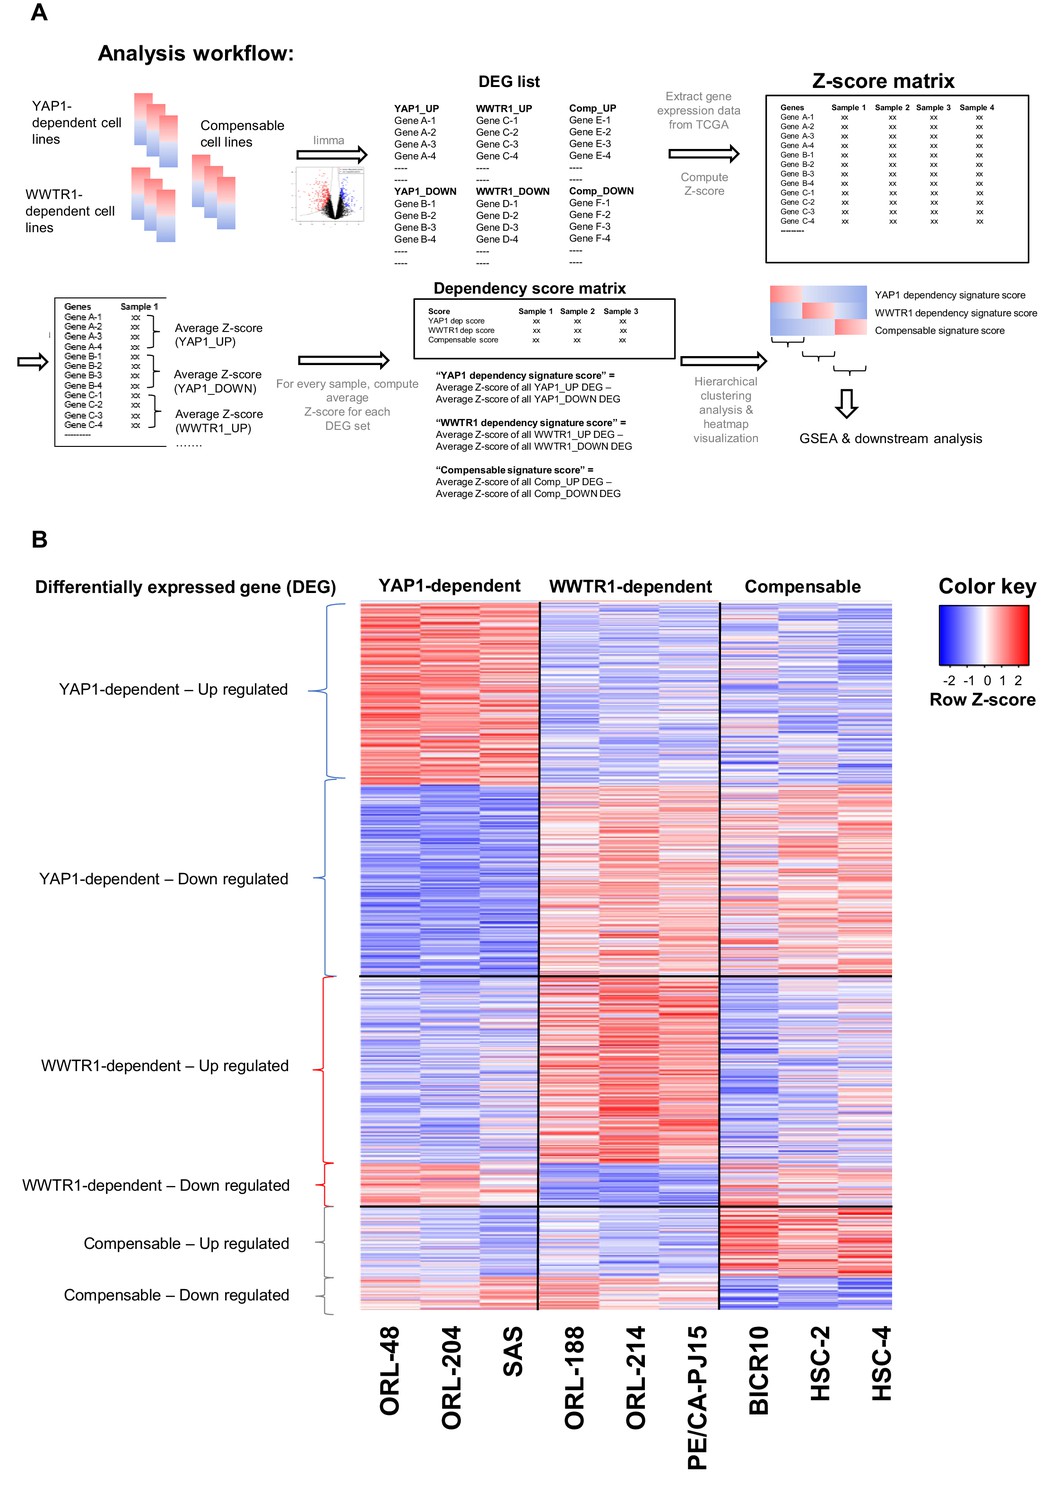
Analysis workflow for computing dependency score and heatmap of gene expression for the differentially expressed genes.
(A) Analysis workflow for using differentially expressed gene (DEG) signature derived from cell lines to compute dependency score and to identify OSCC samples with similar gene signature and predicted dependency on YAP1 and WWTR1. Three representative OSCC cell lines with validated dependency patterns on YAP1 and WWTR1 were selected and used to generate a list of DEGs. Next, gene expression data for 315 OSCC samples (TCGA) were downloaded and for each sample, Z-score was generated for all the DEGs. Z-score for the upregulated genes were averaged, subtracted with the average of all Z-score for the downregulated genes, to derive the respective ‘dependency signature score’/”Compensable signature score’. Samples with YAP1 dependency signature score >0.5 were considered as core samples predicted to be YAP1-dependent; Samples with WWTR1 dependency signature score >0.5 were core samples for WWTR1-dependent; while samples with compensable signature score >0.5 were considered core samples for which YAP1 and WWTR1 can compensate for one another. (B) Heatmap of the gene expression of all DEGs (supervised clustering), used to derive the ‘YAP1 dependency signature score’, ‘WWTR1 dependency signature score’ and ‘Compensable signature score’, from the nine representative OSCC cell lines.
Figure 6—figure supplement 2
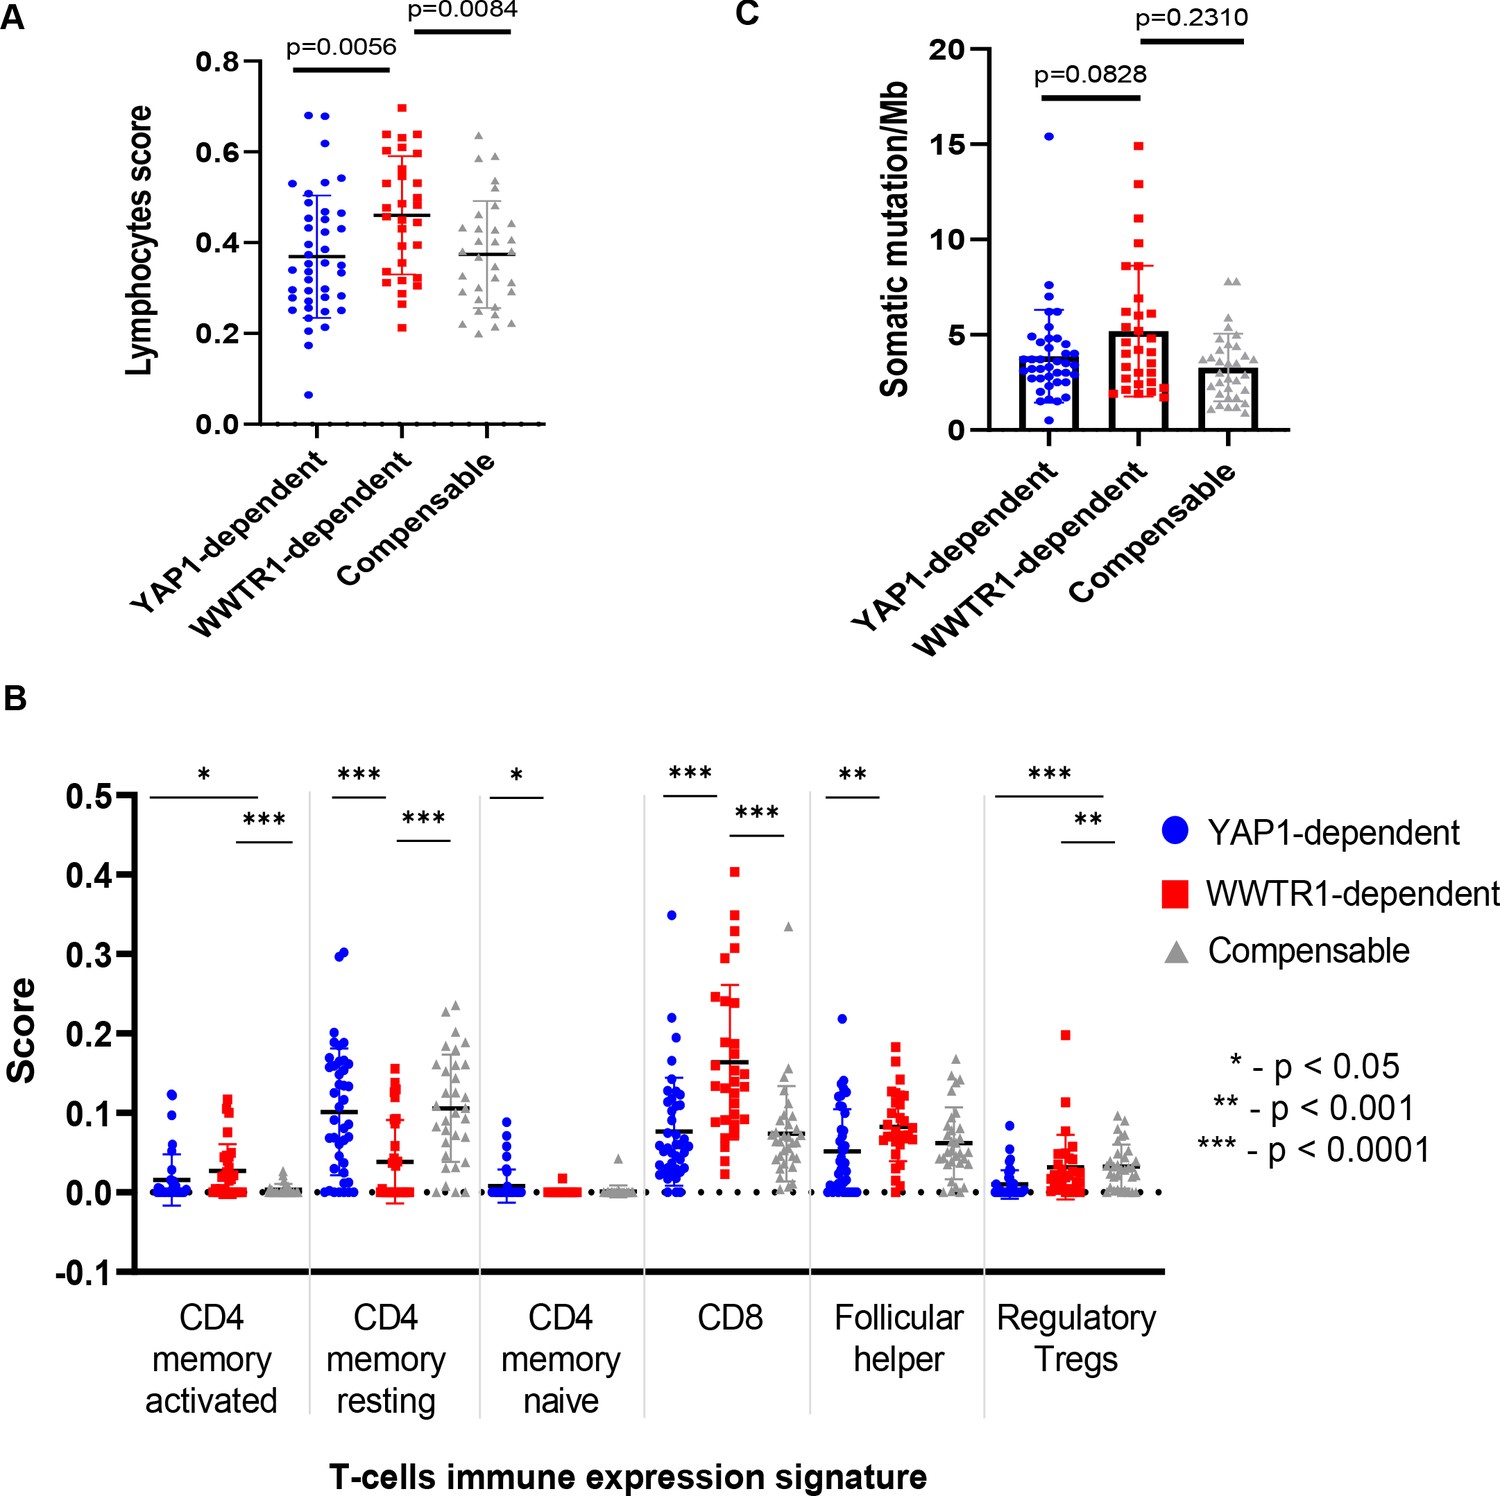
Comparison of lymphocytes score, immune expression signature and tumor mutational burden.
(A) Lymphocytes score of core OSCC samples were derived from Thorsson et al., 2018. OSCC with high WWTR1 dependency signature score have significantly higher lymphocyte infiltration when compared to the other two groups. (B) T-cells immune expression signatures (Thorsson et al., 2018) of OSCC with high WWTR1 dependency signature score varied from the other two groups. Generally, they had significantly lower CD4 resting memory T-cells and higher CD8 T-cells than the other two groups. (C) Tumor mutational burden (number of nonsynonymous mutation/30 Mb) (TMB) of the core OSCC samples. OSCC with high WWTR1 dependency signature score had elevated TMB when compared to the other two groups. All error bars are shown as mean ± SD. Unpaired t-test with Welch’s correction was used for p-values calculation, due to unequal sample size (n = 43, 31, 30, respectively).
Figure 6—figure supplement 3
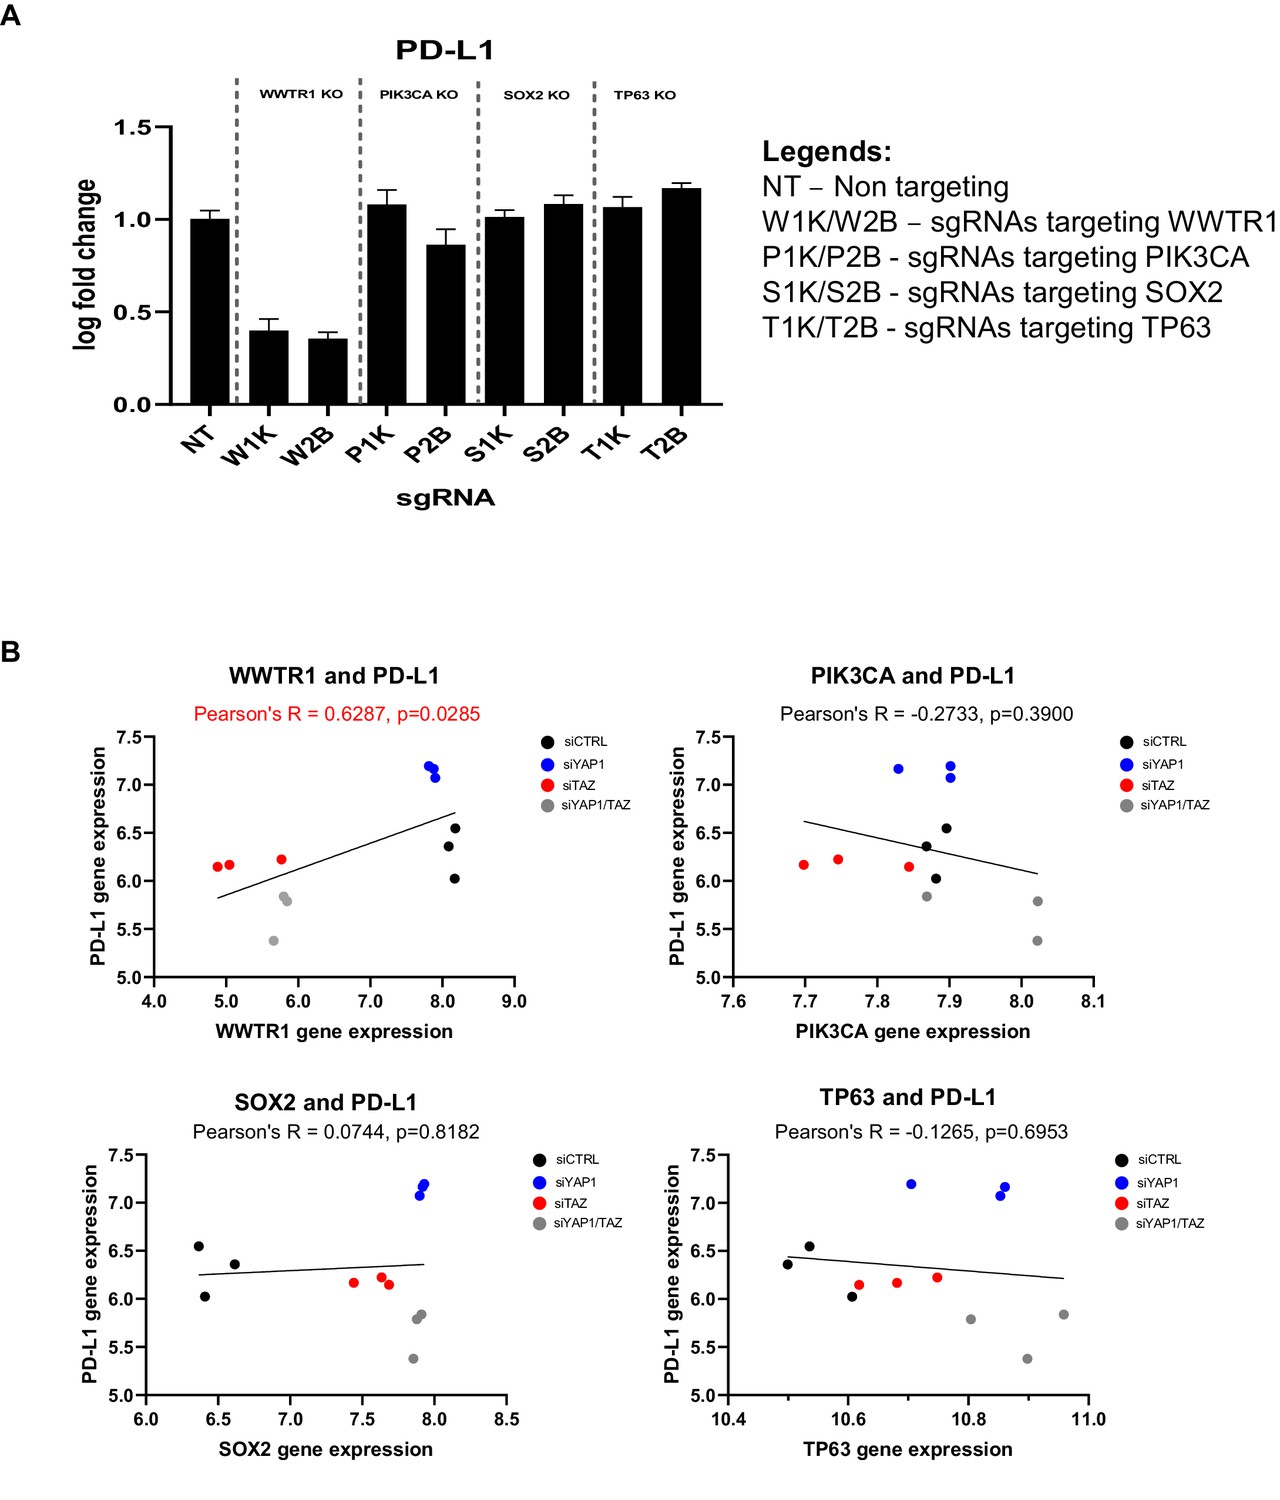
Association with the immune-related gene PD-L1 is specific to WWTR1 but not other co-amplified genes in chromosome 3q25-28.
(A) To demonstrate that the association between WWTR1 dependency signatures with the immune-related gene PD-L1 is specific to WWTR1 but not due to the transcriptional activity of other co-amplified genes, we used sgRNA to deplete WWTR1, PIK3CA, TP63, and SOX2 in the Cas9-expressing, WWTR1-dependent model ORL-214. Two distinct sgRNAs were used for each gene (1K and 2B). qPCR results revealed the strongest suppression of PD-L1 gene expression upon WWTR1 knockout, but the expression remain largely unchanged when the other genes were knockout (PIK3CA, TP63, and SOX2). qPCR was performed in technical triplicates. Data are shown as mean ± SD (n = 3 technical repeats). (B) Global gene expression data measured by microarray of SCC2 cells transfected with control siRNA (siCTRL), or siRNA targeting YAP1 (siYAP) and/or WWTR1 (siTAZ) were retrieved from Hiemer et al., 2015 (GSE66949). Gene expression of PD-L1 was used to correlate with that of WWTR1, PIK3CA, TP63, and SOX2. Only WWTR1 gene expression showed significant positive correlation with that of PD-L1, despite the fact that PIK3CA, TP63, and SOX2 were often co-amplified with WWTR1 in OSCC.
Tables
Appendix 1—key resources table
| Reagent type (species) or resource | Designation | Source or reference | Identifiers | Additional information |
|---|---|---|---|---|
| Recombinant DNA reagent | Human Improved Genome-wide Knockout CRISPR Library v1 (pooled library) | Addgene | #67989 | Containing 90,709 gRNAs, selectable with puromycin |
| Recombinant DNA reagent | pKLV2-EF1α-Cas9Bsd-W (plasmid) | Addgene | #68343 | To express Cas9 constitutively, selectable with blasticidin |
| Recombinant DNA reagent | pKLV2-U6gRNA5 (gGFP)-PGKmCherry2AGFP-W (plasmid) | Addgene | #67982 | Reporter plasmid |
| Recombinant DNA reagent | pKLV2- U6gRNA5(BbsI)-PGKpuro2ABFP-W (plasmid) | Addgene | #67974 | For cloning of single sgRNAs, tag with blue fluorescence protein (BFP) |
| Recombinant DNA reagent | pKLV2-U6gRNA5(BbsI)-PGKpuro2AmCherry-W (plasmid) | Addgene | #67977 | For cloning of single sgRNAs, tag with mcherry |
| Recombinant DNA reagent | pMD2.G (plasmid) | Addgene | #12259 | For lentivirus generation |
| Recombinant DNA reagent | psPAX2 (plasmid) | Addgene | #12260 | For lentivirus generation |
| Chemical compound, drug | jetPRIME reagent and buffer | Polyplus transfection | 114–75 | For transfection |
| Cell line (Homo sapiens) | Cells derived from oral squamous cell carcinoma | Cancer Research Malaysia Fadlullah et al., 2016, PMID:27050151 | ORL-48 | Maintained in DMEM/F12 supplemented with 10% FBS, 1% penicillin/streptomycin |
| Cell line (Homo sapiens) | Cells derived from oral squamous cell carcinoma | Cancer Research Malaysia Fadlullah et al., 2016, PMID:27050151 | ORL-115 | Maintained in DMEM/F12 supplemented with 10% FBS, 1% penicillin/streptomycin |
| Cell line (Homo sapiens) | Cells derived from oral squamous cell carcinoma | Cancer Research Malaysia Fadlullah et al., 2016, PMID:27050151 | ORL-136 | Maintained in DMEM/F12 supplemented with 10% FBS, 1% penicillin/streptomycin |
| Cell line (Homo sapiens) | Cells derived from oral squamous cell carcinoma | Cancer Research Malaysia Fadlullah et al., 2016, PMID:27050151 | ORL-150 | Maintained in DMEM/F12 supplemented with 10% FBS, 1% penicillin/streptomycin |
| Cell line (Homo sapiens) | Cells derived from oral squamous cell carcinoma | Cancer Research Malaysia Fadlullah et al., 2016, PMID:27050151 | ORL-153 | Maintained in DMEM/F12 supplemented with 10% FBS, 1% penicillin/streptomycin |
| Cell line (Homo sapiens) | Cells derived from oral squamous cell carcinoma | Cancer Research Malaysia Fadlullah et al., 2016, PMID:27050151 | ORL-156 | Maintained in DMEM/F12 supplemented with 10% FBS, 1% penicillin/streptomycin |
| Cell line (Homo sapiens) | Cells derived from oral squamous cell carcinoma | Cancer Research Malaysia Fadlullah et al., 2016, PMID:27050151 | ORL-166 | Maintained in DMEM/F12 supplemented with 10% FBS, 1% penicillin/streptomycin |
| Cell line (Homo sapiens) | Cells derived from oral squamous cell carcinoma | Cancer Research Malaysia Fadlullah et al., 2016, PMID:27050151 | ORL-174 | Maintained in DMEM/F12 supplemented with 10% FBS, 1% penicillin/streptomycin |
| Cell line (Homo sapiens) | Cells derived from oral squamous cell carcinoma | Cancer Research Malaysia Fadlullah et al., 2016, PMID:27050151 | ORL-188 | Maintained in DMEM/F12 supplemented with 10% FBS, 1% penicillin/streptomycin |
| Cell line (Homo sapiens) | Cells derived from oral squamous cell carcinoma | Cancer Research Malaysia Fadlullah et al., 2016, PMID:27050151 | ORL-195 | Maintained in DMEM/F12 supplemented with 10% FBS, 1% penicillin/streptomycin |
| Cell line (Homo sapiens) | Cells derived from oral squamous cell carcinoma | Cancer Research Malaysia Fadlullah et al., 2016, PMID:27050151 | ORL-204 | Maintained in DMEM/F12 supplemented with 10% FBS, 1% penicillin/streptomycin |
| Cell line (Homo sapiens) | Cells derived from oral squamous cell carcinoma | Cancer Research Malaysia Fadlullah et al., 2016, PMID:27050151 | ORL-207 | Maintained in DMEM/F12 supplemented with 10% FBS, 1% penicillin/streptomycin |
| Cell line (Homo sapiens) | Cells derived from oral squamous cell carcinoma | Cancer Research Malaysia Fadlullah et al., 2016, PMID:27050151 | ORL-214 | Maintained in DMEM/F12 supplemented with 10% FBS, 1% penicillin/streptomycin |
| Cell line (Homo sapiens) | Cells derived from oral squamous cell carcinoma | Cancer Research Malaysia Fadlullah et al., 2016, PMID:27050151 | ORL-215 | Maintained in DMEM/F12 supplemented with 10% FBS, 1% penicillin/streptomycin |
| Cell line (Homo sapiens) | Cells derived from oral squamous cell carcinoma | Wellcome Sanger Institute | BICR10 | Maintained in DMEM/F12 supplemented with 10% FBS, 1% penicillin/streptomycin |
| Cell line (Homo sapiens) | Cells derived from oral squamous cell carcinoma | Wellcome Sanger Institute | HO-1-u-1 | Maintained in DMEM/F12 supplemented with 10% FBS, 1% penicillin/streptomycin |
| Cell line (Homo sapiens) | Cells derived from oral squamous cell carcinoma | Wellcome Sanger Institute | HSC-2 | Maintained in DMEM/F12 supplemented with 10% FBS, 1% penicillin/streptomycin |
| Cell line (Homo sapiens) | Cells derived from oral squamous cell carcinoma | Wellcome Sanger Institute | HSC-4 | Maintained in DMEM/F12 supplemented with 10% FBS, 1% penicillin/streptomycin |
| Cell line (Homo sapiens) | Cells derived from oral squamous cell carcinoma | Wellcome Sanger Institute | PE/CA-PJ15 | Maintained in DMEM/F12 supplemented with 10% FBS, 1% penicillin/streptomycin |
| Cell line (Homo sapiens) | Cells derived from oral squamous cell carcinoma | Wellcome Sanger Institute | SAS | Maintained in DMEM/F12 supplemented with 10% FBS, 1% penicillin/streptomycin |
| Cell line (Homo sapiens) | Cells derived from oral squamous cell carcinoma | Wellcome Sanger Institute | SCC-9 | Maintained in DMEM/F12 supplemented with 10% FBS, 1% penicillin/streptomycin |
| Cell line (Homo sapiens) | Human embryonic kidney cells | Wellcome Sanger Institute | HEK293 | Maintained in DMEM (high glucose) supplemented with 10% FBS, 1% penicillin/streptomycin |
| Antibody | Anti-human YAP (D8H1X), Rabbit monoclonal | Cell Signaling Technology | #14074 | WB - (1:1000) |
| Antibody | Anti-human TAZ (D361D), Rabbit monoclonal | Cell Signaling Technology | #70148 | WB - (1:1000) |
| Antibody | Anti-human actin (clone C4), Mouse monoclonal | Merck Milipore | MAB1501 | WB – (1:5000) |
| Antibody | Goat anti-rabbit IgG-HRP | Southern Biotec | SB4010-05 | Secondary antibody; WB – (1:10000) |
| Antibody | Goat anti-mouse IgG-HRP | Southern Biotec | SB1010-05 | Secondary antibody; WB – (1:10000) |
| Commercial assay or kit | Q5 Hot Start High-Fidelity 2X Master Mix | New England Biolabs | M0494S | |
| Commercial assay or kit | QIAquick PCR purification kit | Qiagen | 28104 | |
| Commercial assay or kit | Qubit dsDNA broad-range (BR) assay kit | Thermo Fisher Scientific | Q32850 | |
| Commercial assay or kit | KAPA HotStart ReadyMix | Roche | KK2601 | |
| Commercial assay or kit | Agilent High Sensitivity DNA kit | Agilent technologies | 5067–4626 | |
| Commercial assay or kit | QIAprep Spin Miniprep Kit | Qiagen | 27104 | |
| Commercial assay or kit | cDNA reverse transcription kit | Applied Biosystems, Thermo Fisher Scientific | 4368813 | |
| Commercial assay or kit | PowerUp SYBR Green Master Mix | Applied Biosystems, Thermo Fisher Scientific | A25742 | |
| Commercial assay or kit | FITC Annexin V Apoptosis Detection Kit I | BD Bioscience | 556547 | |
| Chemical compound, drug | BbsI enzyme | New England Biolabs | R0539S | |
| Chemical compound, drug | T4 Polynucleotide kinase enzyme | New England Biolabs | M0201 | |
| Chemical compound, drug | T4 ligase and 10x ligase buffer | New England Biolabs | M0202S | |
| Chemical compound, drug | WesternBright Quantum HRP substrate | Advansta | K-12042-D20 | Substrate for Western Blot |
| Chemical compound, drug | TRIzol Reagent | Thermo Fisher Scientific | 15596026 | |
| Software, algorithm | CRISPRcleanR (version 0.5) | Iorio et al., 2018 PMID:30103702 | ||
| Software, algorithm | MAGeCK (version 0.5.7) | Li et al., 2014 PMID:25476604 | ||
| Software, algorithm | Rstudio (version 1.2.1335) | Rstudio Inc | ||
| Software, algorithm | GraphPad Prism (version 8) | GraphPad Software Inc |
Additional files
-
Supplementary file 1
Number of MAGeCK defined fitness genes and percentage overlap with core fitness gene.
- https://cdn.elifesciences.org/articles/57761/elife-57761-supp1-v2.xlsx
-
Supplementary file 2
List of core fitness genes from four different sources.
- https://cdn.elifesciences.org/articles/57761/elife-57761-supp2-v2.xlsx
-
Supplementary file 3
KEGG pathway analysis results for fitness genes.
(A) KEGG pathway analysis results for all 2539 essential genes identified from CRISPR screen of 21 OSCC cell lines. (B) KEGG pathway analysis results for 918 essential genes after filtering out core fitness genes.
- https://cdn.elifesciences.org/articles/57761/elife-57761-supp3-v2.xlsx
-
Supplementary file 4
Details of driver mutations in 43 genes identified from whole exome sequencing on 21 OSCC cell lines.
- https://cdn.elifesciences.org/articles/57761/elife-57761-supp4-v2.xlsx
-
Supplementary file 5
Classification of the 918 non-core essential genes based on target tractability.
- https://cdn.elifesciences.org/articles/57761/elife-57761-supp5-v2.xlsx
-
Supplementary file 6
Differentially expressed genes (DEGs) used to derived Z-score for computing of dependency scores.
- https://cdn.elifesciences.org/articles/57761/elife-57761-supp6-v2.xlsx
-
Supplementary file 7
GSEA enrichment analysis on cancer hallmarks for cell lines and OSCC tumors.
- https://cdn.elifesciences.org/articles/57761/elife-57761-supp7-v2.xlsx
-
Supplementary file 8
Representative figures exemplifying gating strategies in flow cytometry analysis.
- https://cdn.elifesciences.org/articles/57761/elife-57761-supp8-v2.pdf
-
Supplementary file 9
List of primers.
- https://cdn.elifesciences.org/articles/57761/elife-57761-supp9-v2.xlsx
-
Supplementary file 10
Quality assessment of the genome-wide CRISPR-Cas9 screen.
- https://cdn.elifesciences.org/articles/57761/elife-57761-supp10-v2.xlsx
-
Supplementary file 11
List of sgRNA and their sequences.
- https://cdn.elifesciences.org/articles/57761/elife-57761-supp11-v2.xlsx
-
Supplementary file 12
List of antibodies.
- https://cdn.elifesciences.org/articles/57761/elife-57761-supp12-v2.xlsx
-
Supplementary file 13
All uncropped western blot images.
- https://cdn.elifesciences.org/articles/57761/elife-57761-supp13-v2.pdf
-
Transparent reporting form
- https://cdn.elifesciences.org/articles/57761/elife-57761-transrepform-v2.pdf
Download links
A two-part list of links to download the article, or parts of the article, in various formats.
Downloads (link to download the article as PDF)
Open citations (links to open the citations from this article in various online reference manager services)
Cite this article (links to download the citations from this article in formats compatible with various reference manager tools)
Genome-wide CRISPR screens of oral squamous cell carcinoma reveal fitness genes in the Hippo pathway
eLife 9:e57761.
https://doi.org/10.7554/eLife.57761


