Breakage of the oligomeric CaMKII hub by the regulatory segment of the kinase
- Department of Molecular and Cell Biology, University of California, Berkeley, United States
- California Institute for Quantitative Biosciences (QB3), University of California, Berkeley, United States
- Howard Hughes Medical Institute, University of California, Berkeley, United States
- Department of Chemistry, University of California, Berkeley, United States
- Physical Biosciences Division, Lawrence Berkeley National Laboratory, United States
Figures
Figure 1
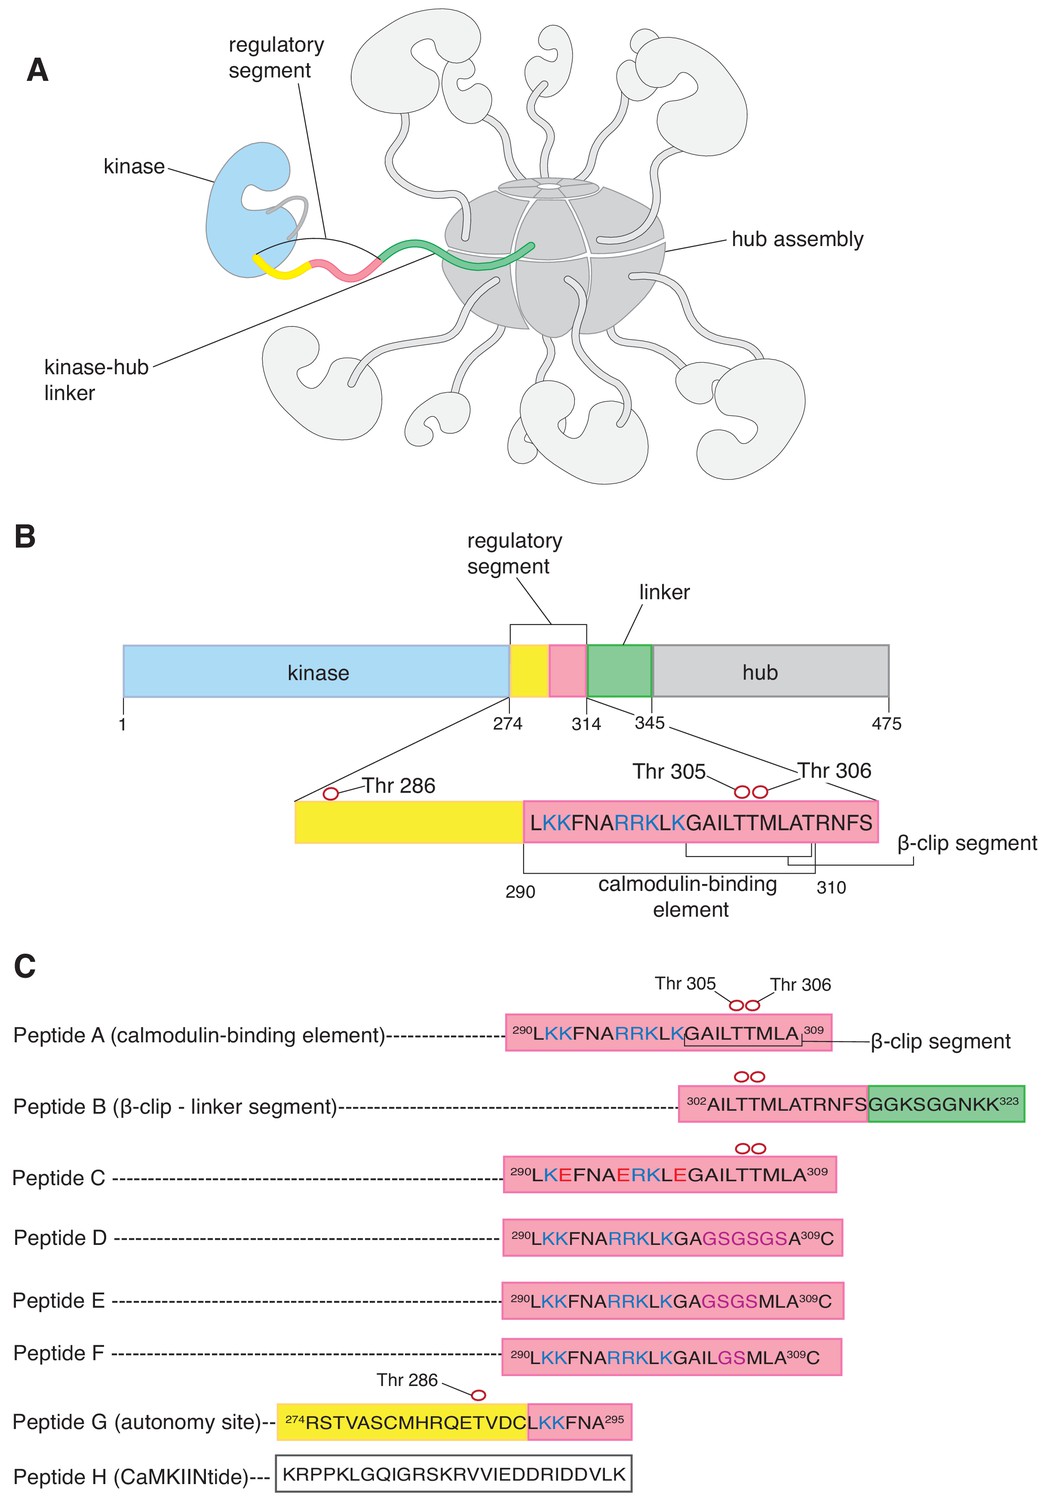
CaMKII architecture and peptides used in mass spectrometry analysis.
(A) The architecture of dodecameric CaMKII, with subunits. The kinase domains are followed by the regulatory segments, which are connected to the hub domains by linkers. The hub domains (in darker grey) associate to form a ring-like hub assembly. For clarity, only a single kinase domain, regulatory segment, and linker are shown in colors, while the remainder are shown in shades of grey. In this subunit, the kinase domain is colored pale blue, the regulatory segment is colored yellow and pale pink, and the unstructured kinase-hub linker is colored green. (B) Domains of a CaMKII-α subunit. The color scheme is the same as in (A). The calmodulin-binding element and the β-clip segment are labeled. The positively charged residues of the calmodulin-binding element are colored deep blue. Phosphorylation sites are shown as empty red circles. (C) Peptides used in the mass spectrometry analyses. All the peptides are derived from the sequence of CaMKII-α, except Peptide H, a peptide that inhibits the kinase domain of CaMKII. The color schemes denote the region of the CaMKII-α subunit that the peptide is derived from and are the same as in (A). All the peptides, except Peptide H, are aligned with respect to Peptide A. Positively charged residues of the calmodulin-binding element are colored blue, and the β-clip segment is labeled in Peptide A. Phosphorylation sites in Peptide A, Peptide B, Peptide C and Peptide G are shown as empty red circles. In Peptide C, positively charged residues that are replaced with negatively charged residues are colored red. In Peptides D, E and F residues that are replaced with glycine and serine residues are colored purple.
Figure 2 with 1 supplement
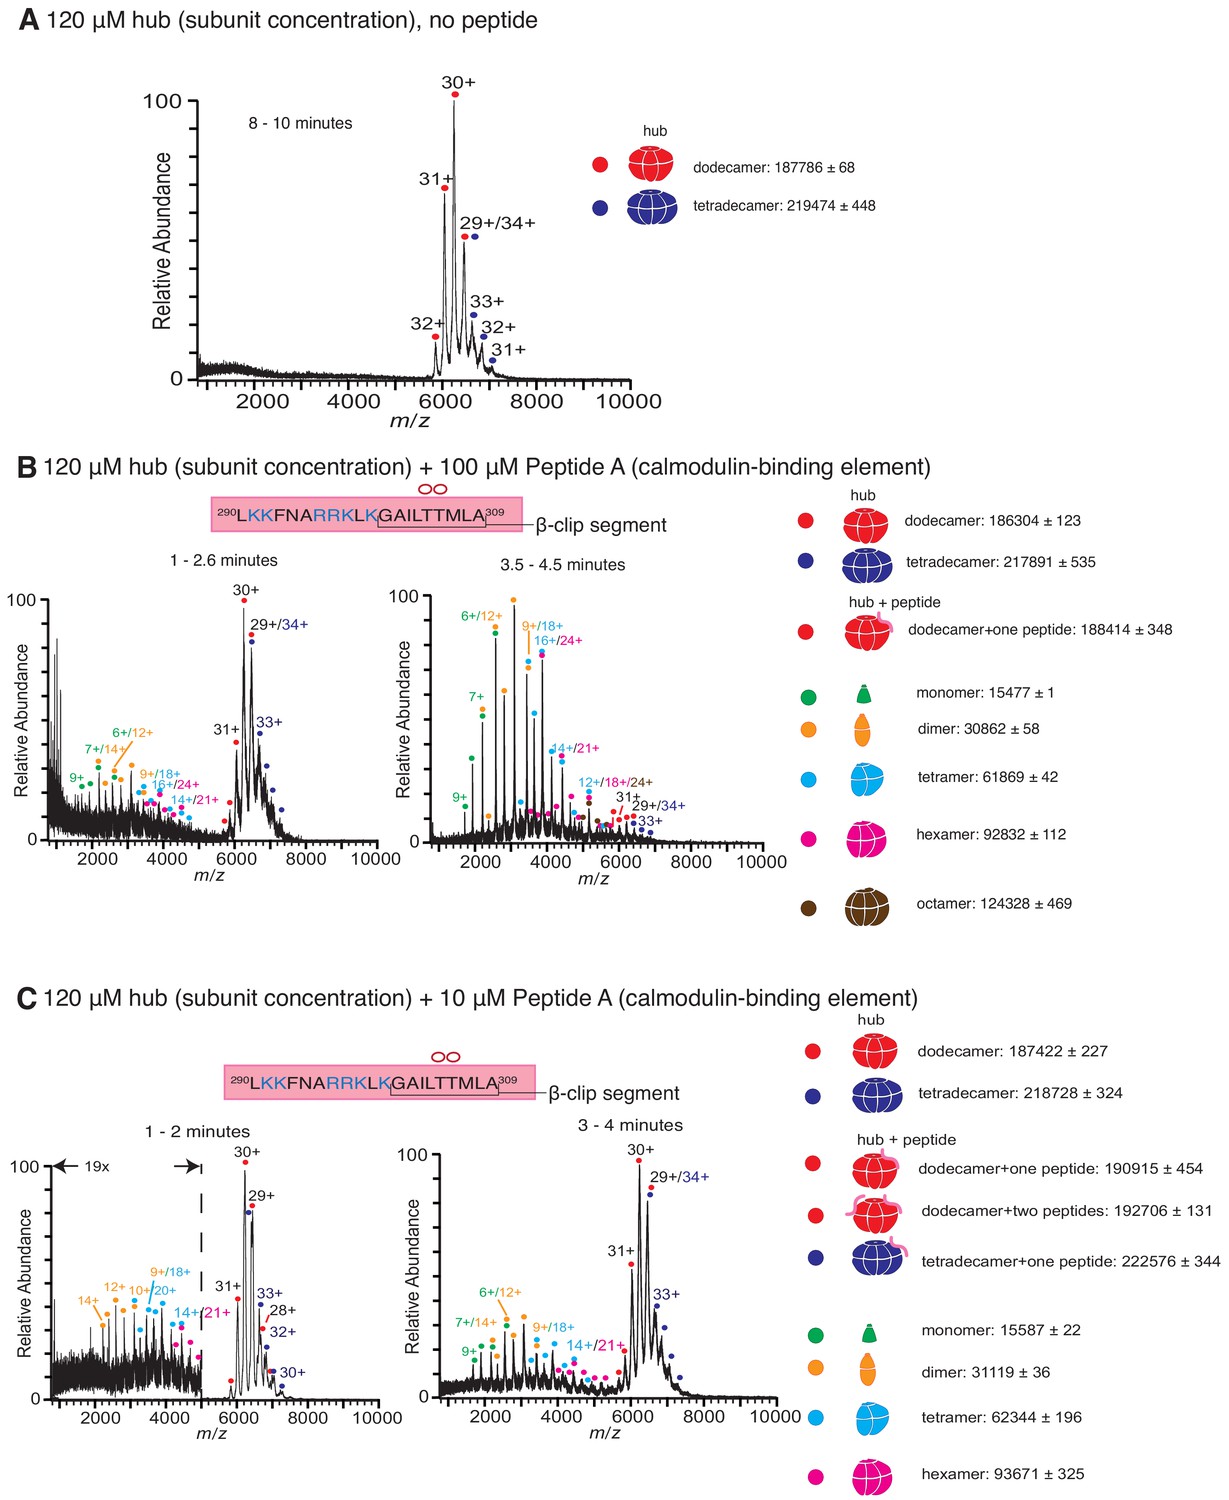
Native mass spectra of the hub incubated with peptides derived from the calmodulin-binding element of CaMKII-α.
The masses (in Daltons) of the respective species are noted. (A) The isolated hub assembly is stable as dodecamers and tetradecamers in the absence of peptides. (B) The hub assembly (120 µM subunit concentration) incubated with 100 µM of Peptide A, shows disassembly within 3 min of initiation ionization (left). In addition to dodecamers and tetradecamers, monomers, dimers, tetramers, hexamers and octamers are observed. At ~ 4 min (right), the smaller oligomers are predominant. (C) The hub assembly (120 µM subunit concentration) incubated with 10 µM of Peptide A shows some release of smaller oligomeric species at ~2 min (left). This becomes more pronounced at 3–4 min (right), although the dodecameric and tetradecameric hub assemblies are also present. In all the spectra of the hub incubated with peptides, species corresponding to dodecameric or tetradecameric hub assemblies with one or two peptides bound are present.
Figure 2—figure supplement 1
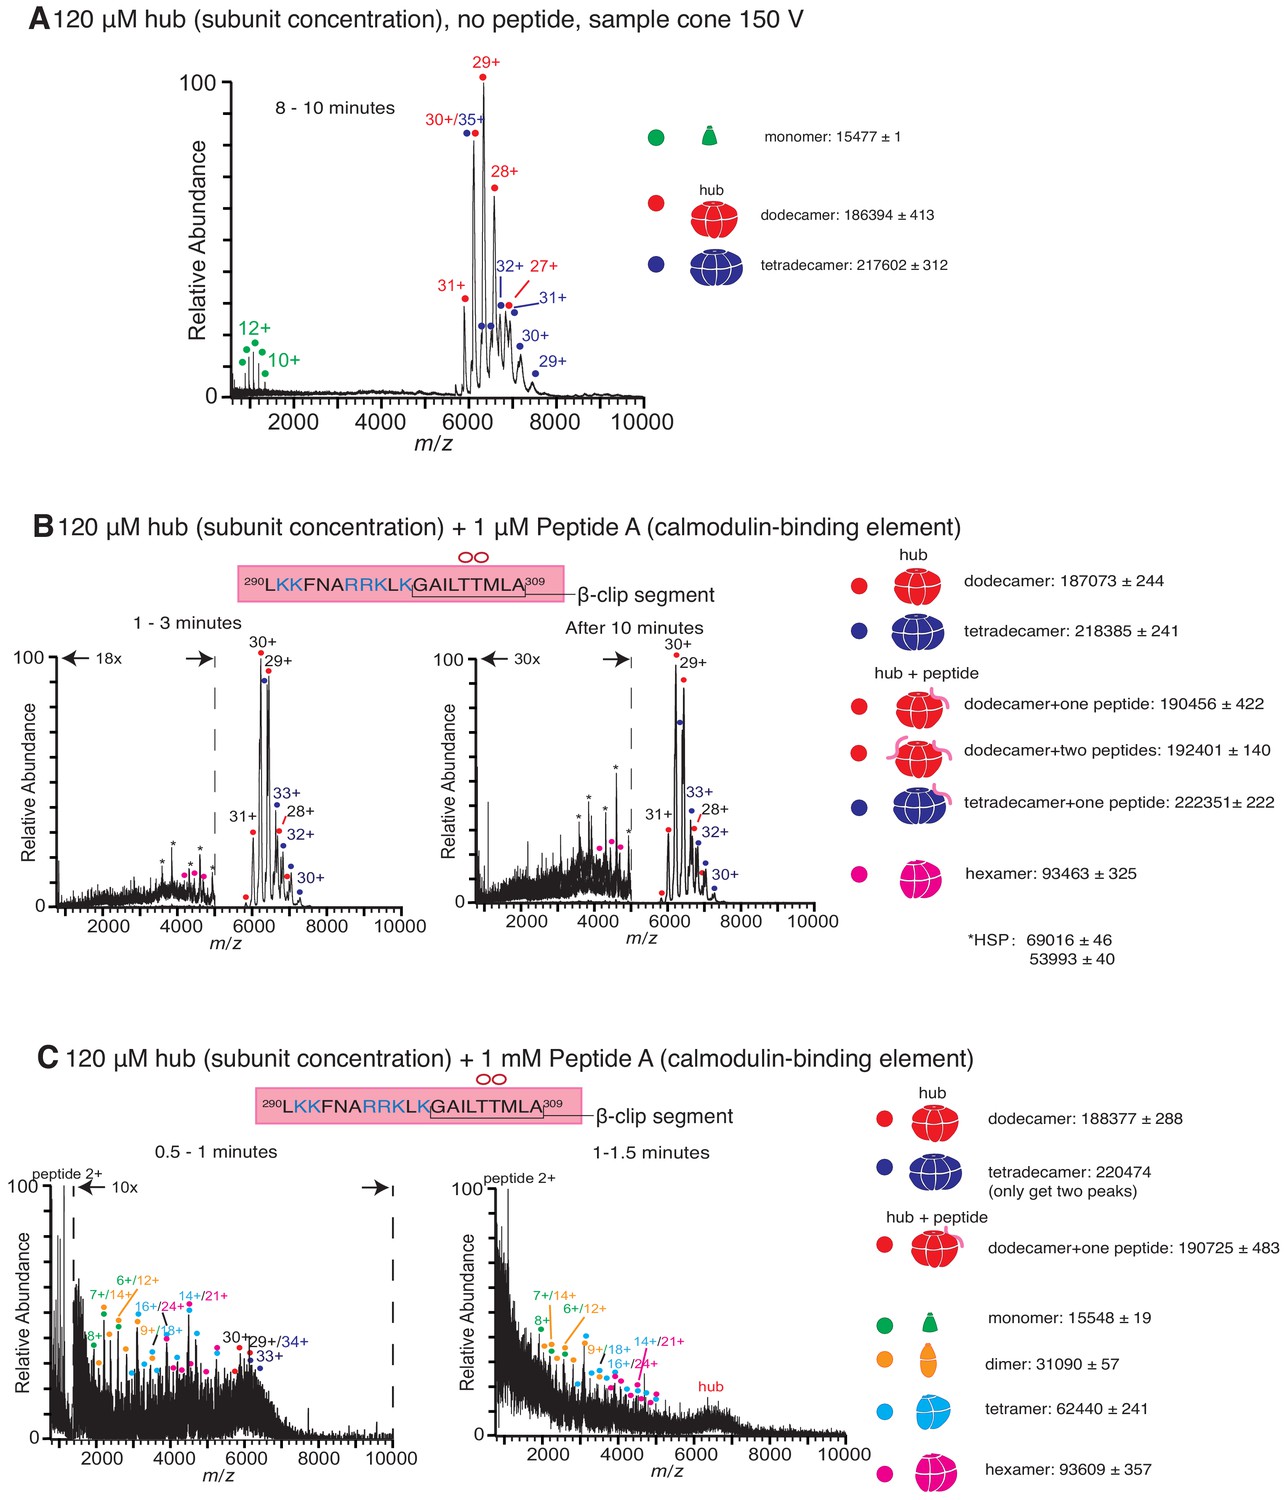
Native mass spectra of the hub incubated with peptides derived from the calmodulin-binding element of CaMKII-α.
(A) Mass spectrum of the isolated hub with a sample cone voltage of 150 V. Monomeric species of the hub assembly are observed at this high sample cone voltage. (B) Incubation of the hub assembly with 1 µM of Peptide A shows no disassembly, even up to 10 min after the start of ionization, and only dodecamers and tetradecamers are observed. (C) Incubation of the hub assembly with 1 mM of Peptide A shows significant protein and peptide aggregation. In all the spectra of the hub incubated with peptides, species corresponding to dodecameric or tetradecameric hub assemblies with one or two peptides bound are present, even when no hub disassembly is observed. The masses (in Daltons) of the respective species are noted.
Figure 3 with 1 supplement
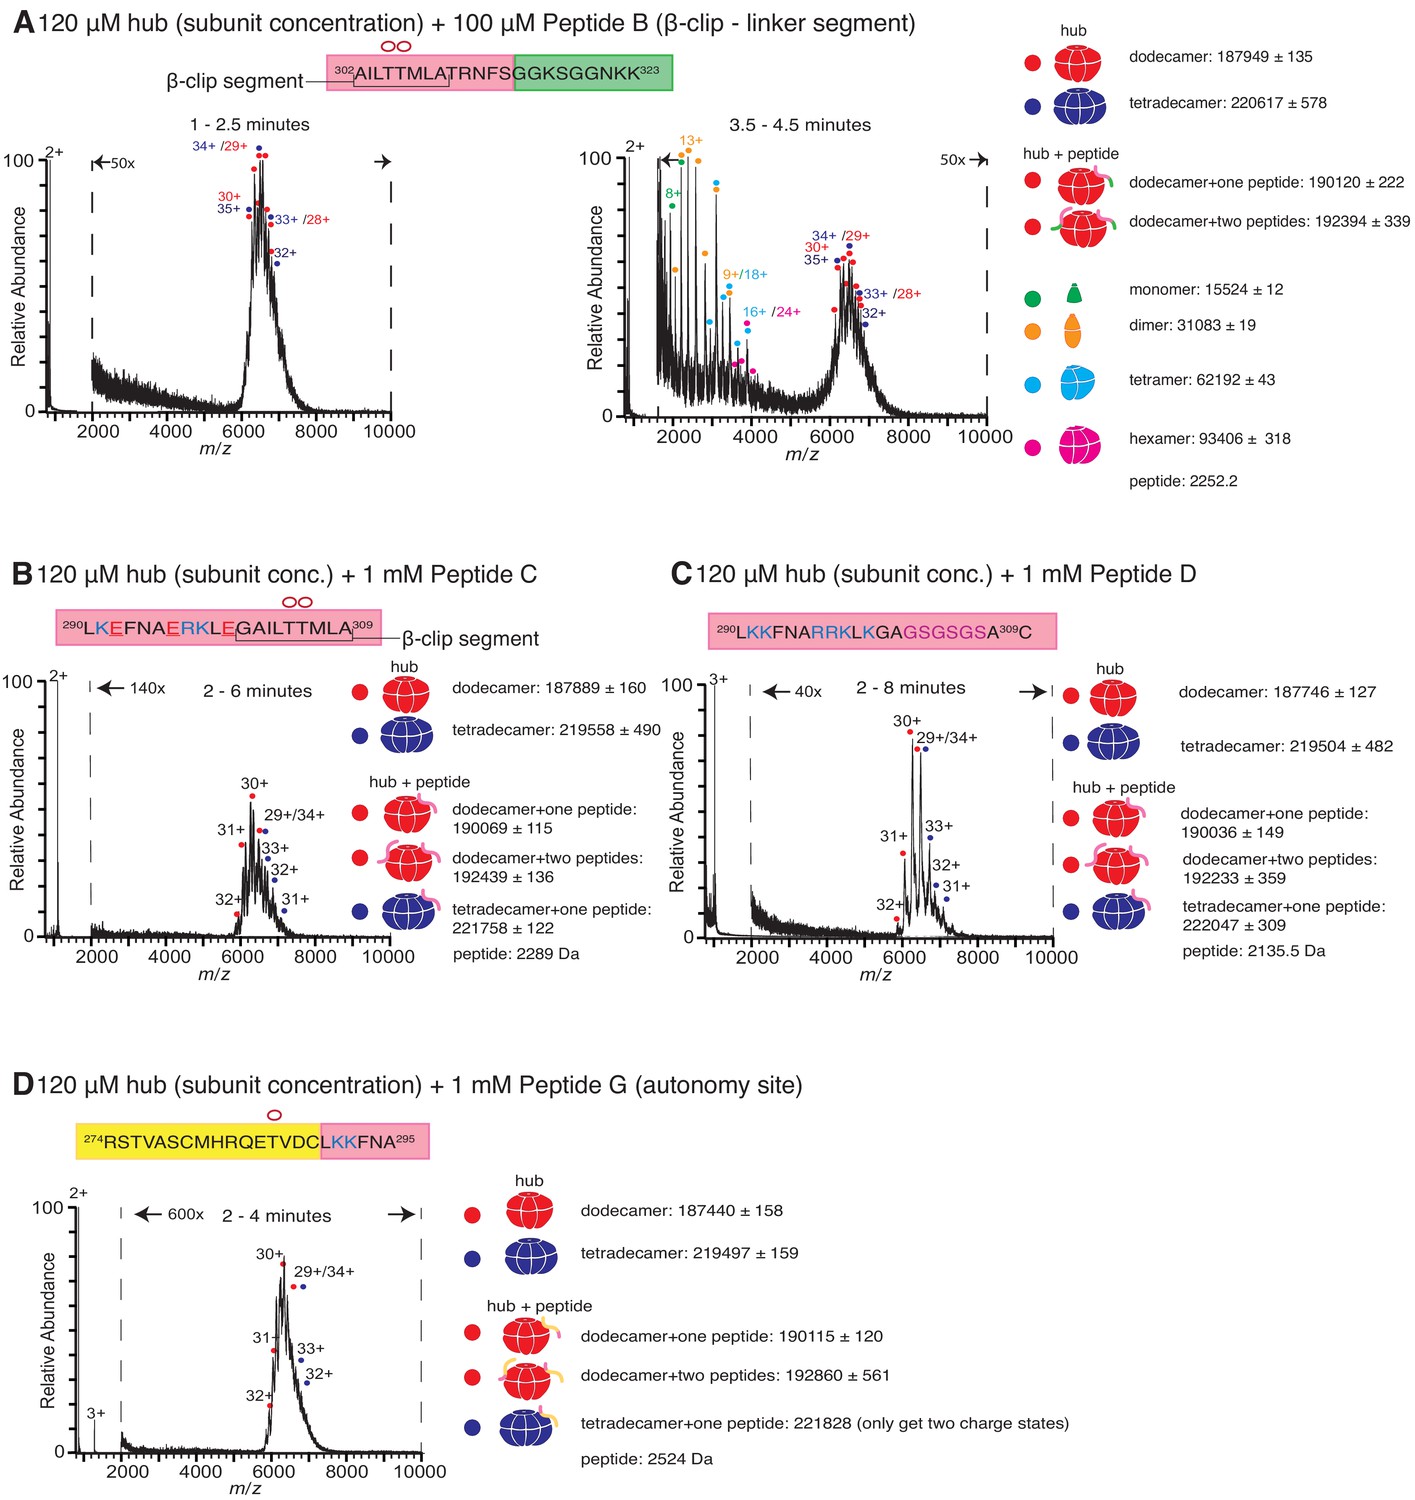
Role of different regions of the calmodulin-binding element of CaMKII-α in inducing hub disassembly.
The masses (in Daltons) of the respective species are noted. (A) Peptide B, which contains the β-clip segment of the calmodulin-binding element, but not the positively charged residues, induces disassembly, but at a slower rate than Peptide A. When 100 µM of Peptide B is incubated with the hub assembly, no smaller species are observed up to ~2.5 min after initiation of ionization (left). At 3.5–4.5 min, smaller oligomeric species corresponding to monomers, dimers, tetramers and hexamers are observed (right). (B) Incubation of the hub assembly with 1 mM of Peptide C, in which three positively charged residues of Peptide A are replaced with negatively charged residues (colored red in sequence), does not result in the release of smaller oligomeric species up to 6 min after ionization, even though the peptide binds to the hub assembly. (C) Modifying the β-clip segment of the calmodulin-binding element abrogates disassembly. Incubation of the hub assembly with 1 mM of Peptide D, in which the β-clip segment of Peptide A is replaced with glycine and serine residues (colored purple) does not result in the release of smaller oligomeric species, and only dodecamers and tetradecamers are observed up to 8 min after ionization. (D) Incubation of the hub assembly with 1 mM of Peptide G, whose sequence corresponds to the autonomy site of the CaMKII-α regulatory segment, does not result in the release of smaller oligomeric species up to 4 min after ionization.
Figure 3—figure supplement 1
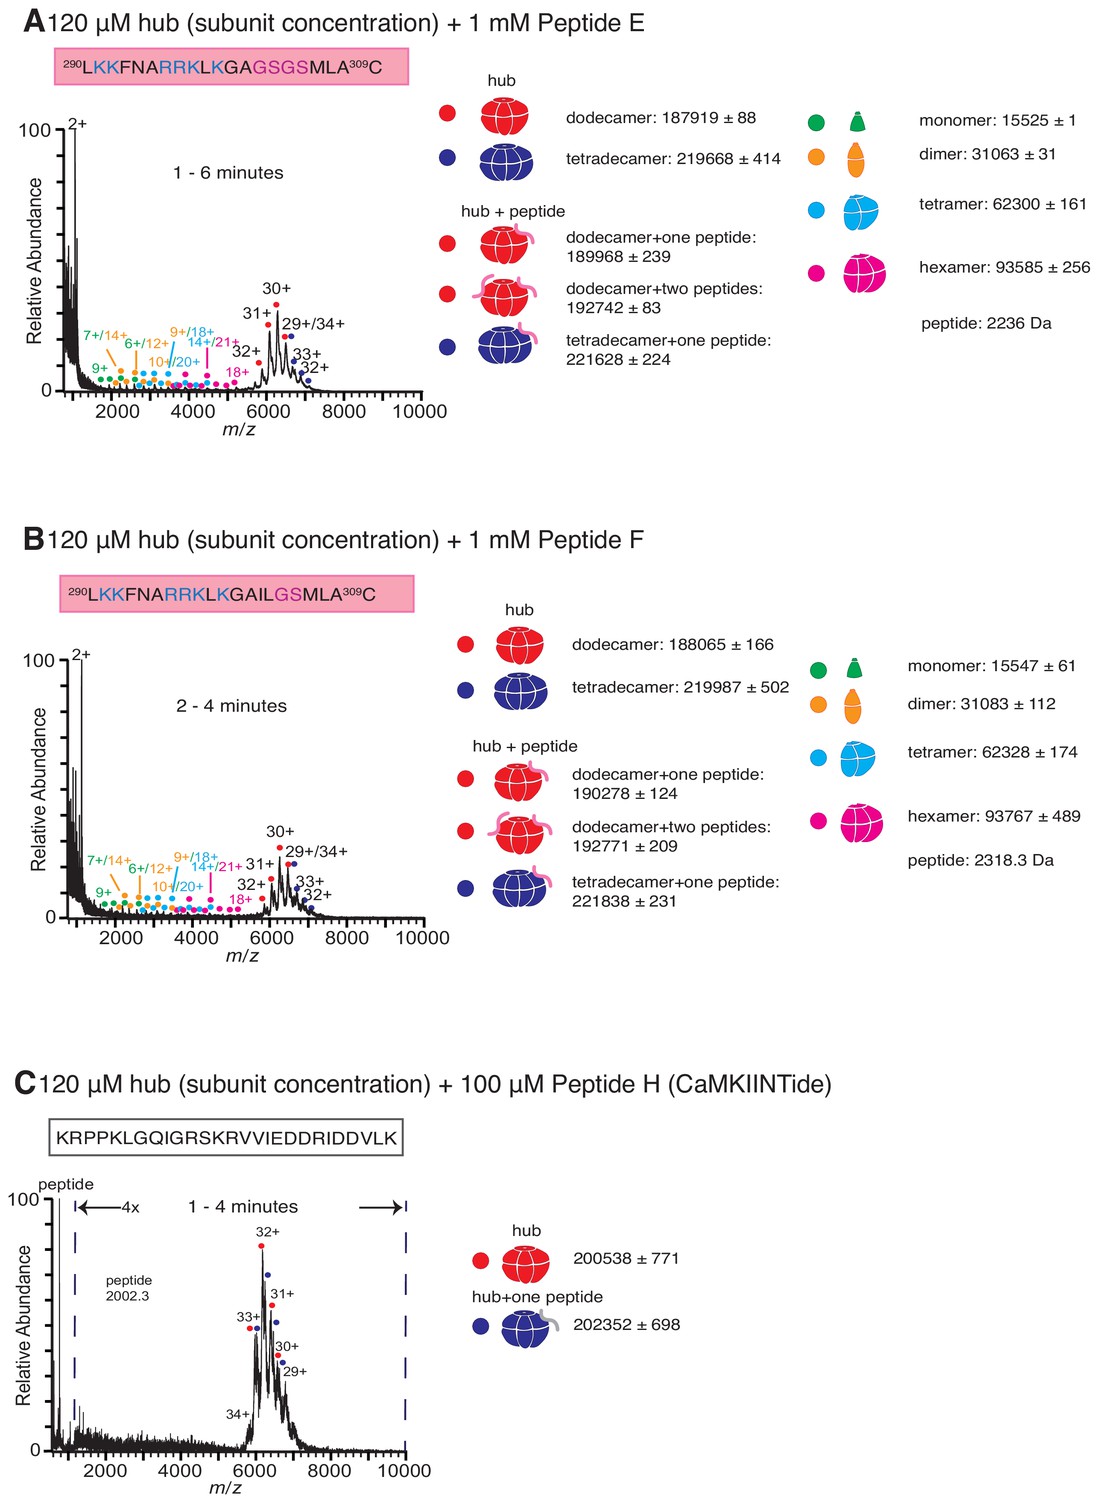
Role of different regions of the calmodulin-binding element of CaMKII-α in inducing hub disassembly.
(A) Incubation of the hub assembly with 1 mM of Peptide E, in which a portion of the β-clip segment of Peptide A is replaced with glycine and serine residues (colored purple) results in the release of some smaller oligomeric species up to 6 min after ionization. (B) Incubation of the hub assembly with 1 mM of Peptide F, in which a portion of the β-clip segment of Peptide A is replaced with glycine and serine residues (colored purple) results in the release of some smaller oligomeric species up to 4 min after ionization. (C) Incubation of the hub assembly with 100 µM of Peptide H (CaMKIINTide), an inhibitor that binds to the substrate-recognition site of the kinase domain of CaMKII, does not result in the release of smaller oligomeric species up to 4 min after the start of ionization. The CAMKII dodecamers and tetradecamers are not resolved in this mass spectra due to the soft instrument source conditions used, and peak broadening that resulted from nonvolatile salts present in the peptide solution. The masses (in Daltons) of the respective species are noted.
Figure 4 with 1 supplement
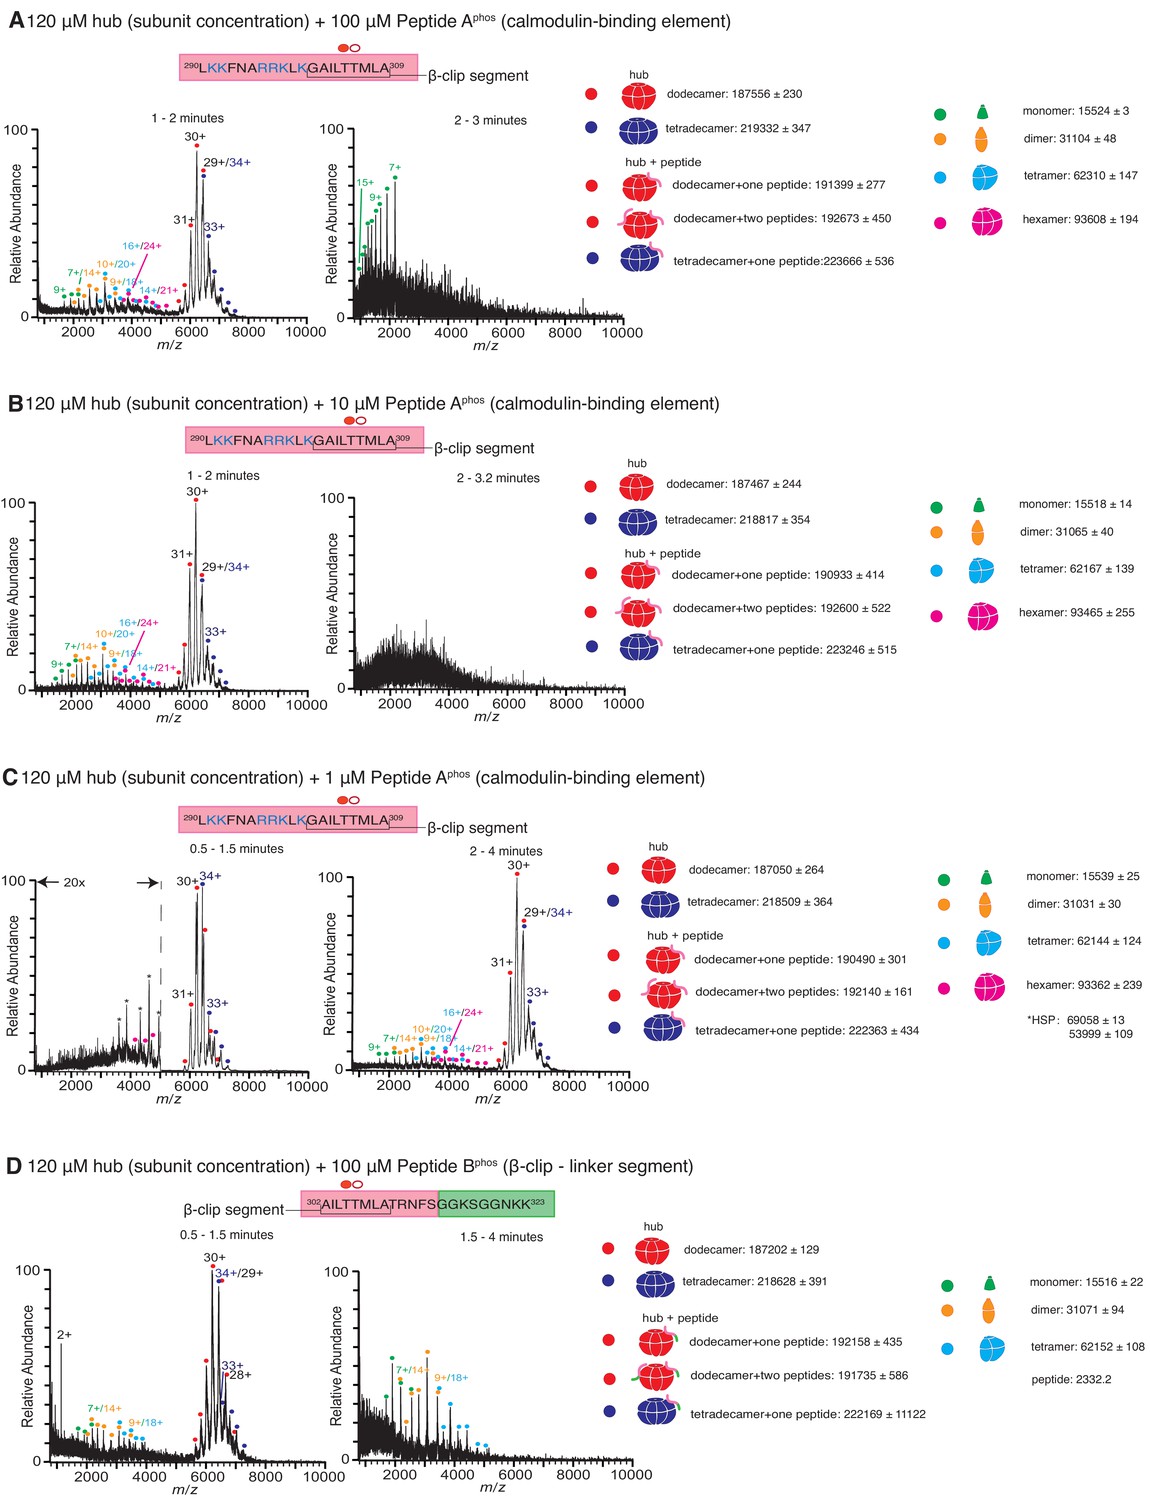
Native mass spectra of the hub incubated with phosphorylated peptides derived from the calmodulin-binding element of CaMKII-α.
Due to the rapid rate at which the hub is destabilized in the presence of phosphorylated peptide, the 5-min incubation step was dispensed which and the sample was injected into the mass spectrometer as soon as the hub was mixed with the peptide. The phosphorylated residue (Thr 305) is indicated with a filled red circle. The masses (in Daltons) of the respective species are noted. (A) The hub assembly (120 µM subunit concentration) incubated with 100 µM of Peptide Aphos shows disassembly within 1–2 min after the start of ionization (left). In addition to dodecamers and tetradecamers, monomers, dimers, tetramers and hexamers are observed. At ~2–3 min (right), the spectra consist primarily of protein and peptide aggregates. (B) The hub assembly (120 µM subunit concentration) incubated with 10 µM of Peptide Aphos also shows disassembly within 1–2 min of ionization (left). In addition to dodecamers and tetradecamers, monomers, dimers, tetramers and hexamers are observed. At ~2–3 min (right), the spectra consist primarily of protein and peptide aggregates. (C) The hub assembly (120 µM subunit concentration) incubated with 1 µM of Peptide Aphos shows almost no disassembly up to ~1.5 min (left). At ~2–4 min smaller species including hexamers, tetramers, dimers and monomers are observed, in addition to dodecamers and tetradecamers. (D) The hub assembly (120 µM subunit concentration) incubated with 100 µM of Peptide Bphos shows some disassembly into tetramers, dimers and monomers within ~1.5 min of initiation of ionization (left). At ~1.5–4 min these smaller species are predominant.
-
Figure 4—source data 1
Numerical data plotted in supplement accompanying Figure 4.
- https://cdn.elifesciences.org/articles/57784/elife-57784-fig4-data1-v3.zip
Figure 4—figure supplement 1
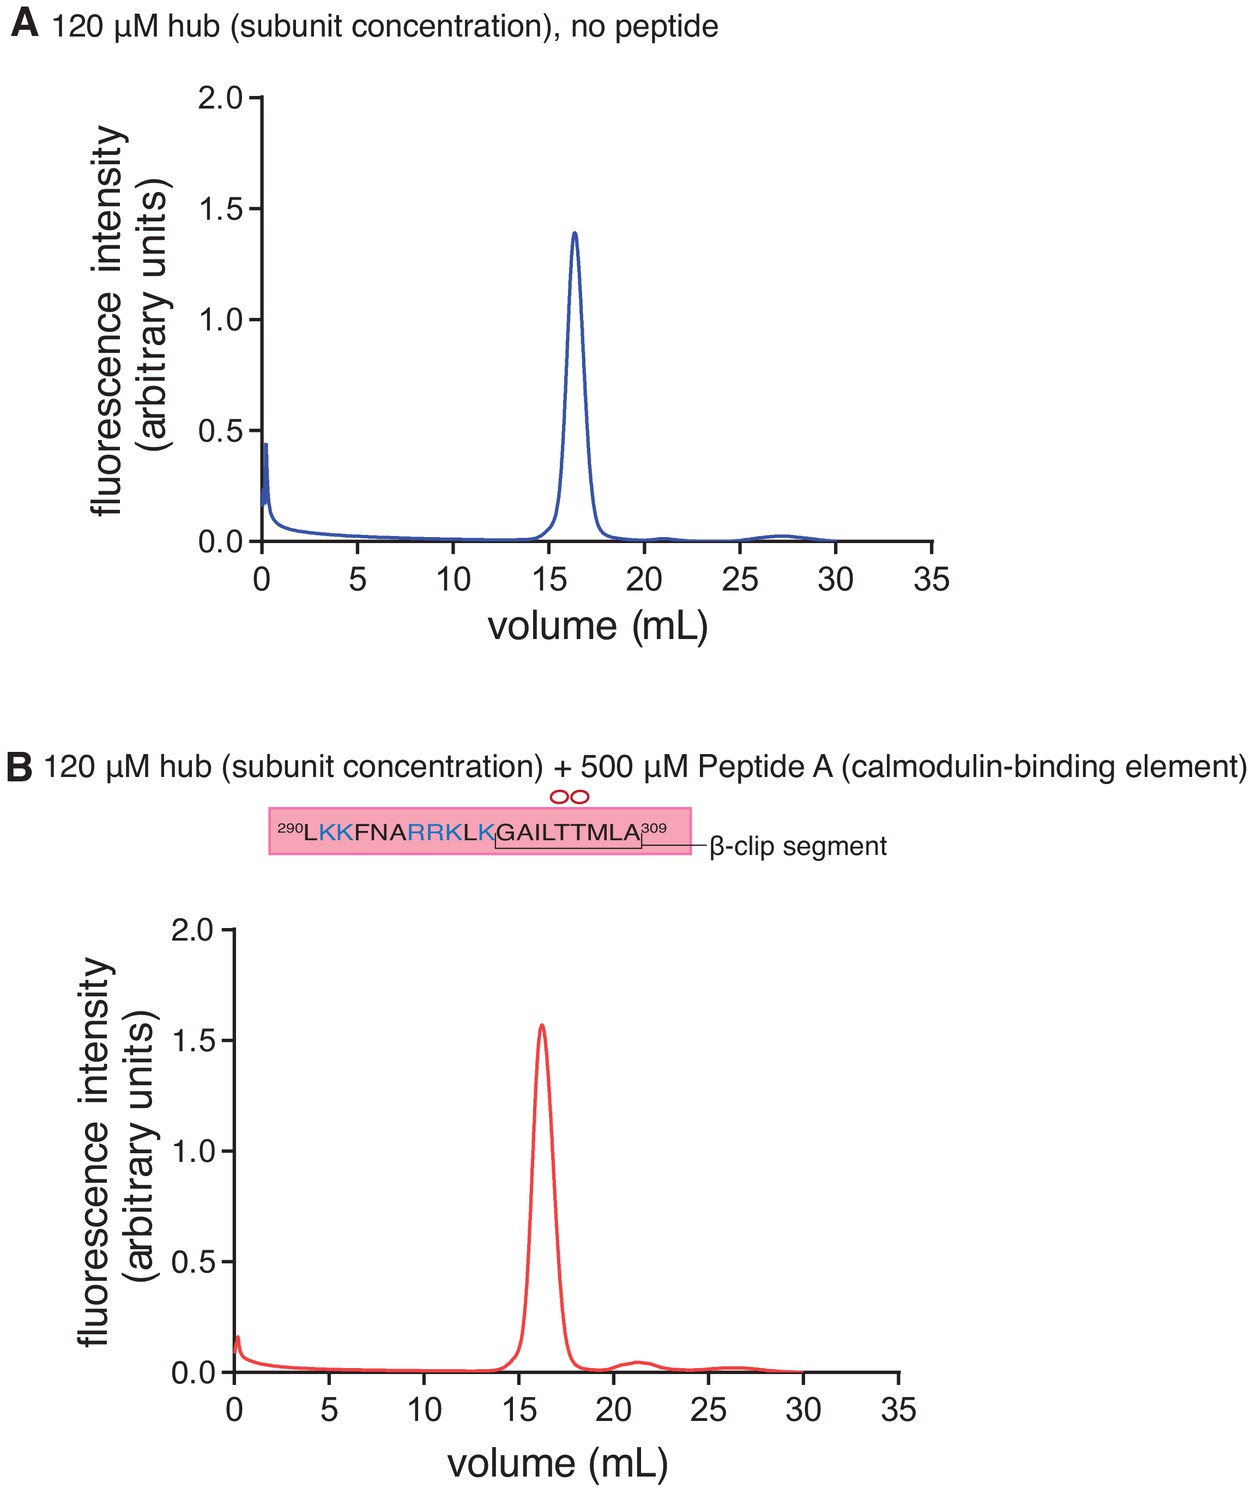
Analytical gel filtration of the CaMKII-α hub with and without Peptide A.
(A) Analytical gel filtration of the isolated hub shows one peak with a retention volume corresponding to the dodecameric/tetradecameric hub assembly. (B) Gel filtration of the hub incubated with 500 µM of Peptide A also shows a single peak with a retention volume that corresponds to the dodecameric/tetradecameric hub assembly.
Figure 5 with 2 supplements
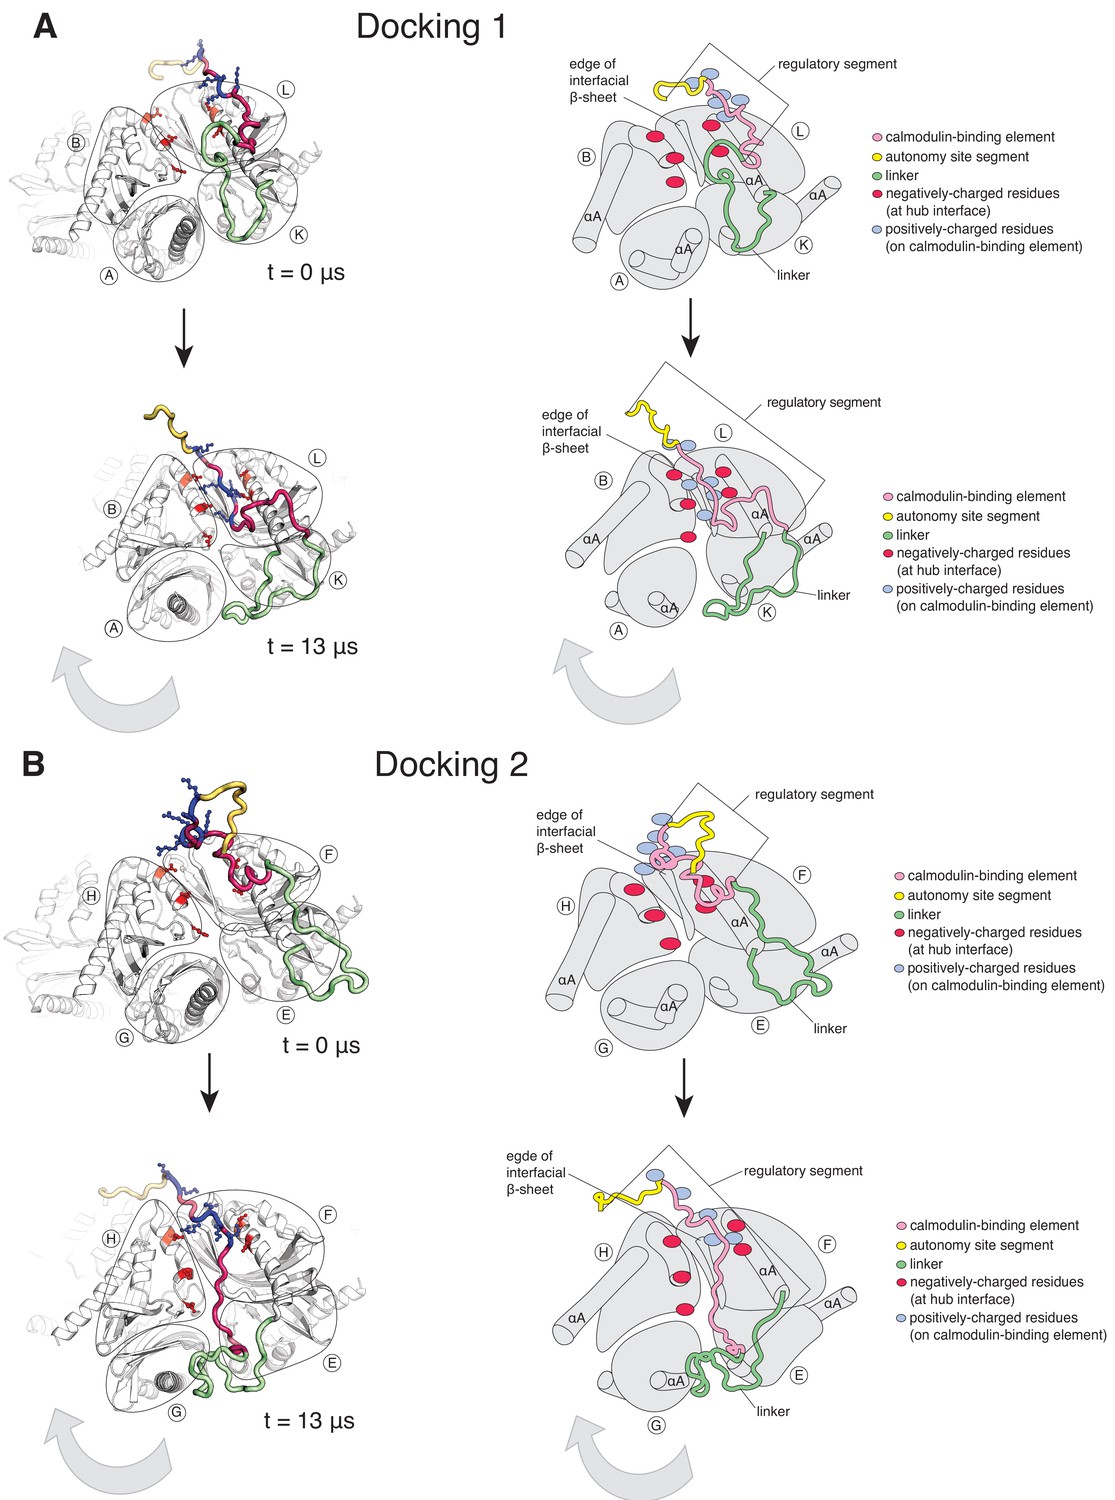
Calmodulin-binding elements from two of the twelve regulatory segments dock on the hub in the simulation of the dodecameric CaMKII-α hub, with considerable distortions at the interfaces where they bind.
The color scheme for the regions of the subunits are the same as in Figure 1A. (A) Instantaneous snapshot from the start (top) and end (bottom) of the simulation showing interface where Docking 1 occurs. The calmodulin-binding element of subunit L docks at the interface between the hub domains of subunits B and L. The positively-charged residues of the regulatory segment (shown in blue) form interactions with the negatively-charged residues (shown in red) that line the interface between subunits B and L. The hub domain of subunit B rotates away from the hub domain of subunit L. (B) Instantaneous snapshot from the start (top) and end (bottom) of the simulation showing interface where Docking 2 occurs. The calmodulin-binding element of subunit F docks at the interface between the hub domains of subunits F and H. The positively-charged residues of the regulatory segment (shown in blue) form interactions with the negatively-charged residues (shown in red) that line the interface between subunits F and H. The hub domain of subunit H rotates away from the hub domain of subunit F.
-
Figure 5—source data 1
Numerical data plotted in supplement accompanying Figure 5.
- https://cdn.elifesciences.org/articles/57784/elife-57784-fig5-data1-v3.zip
Figure 5—figure supplement 1
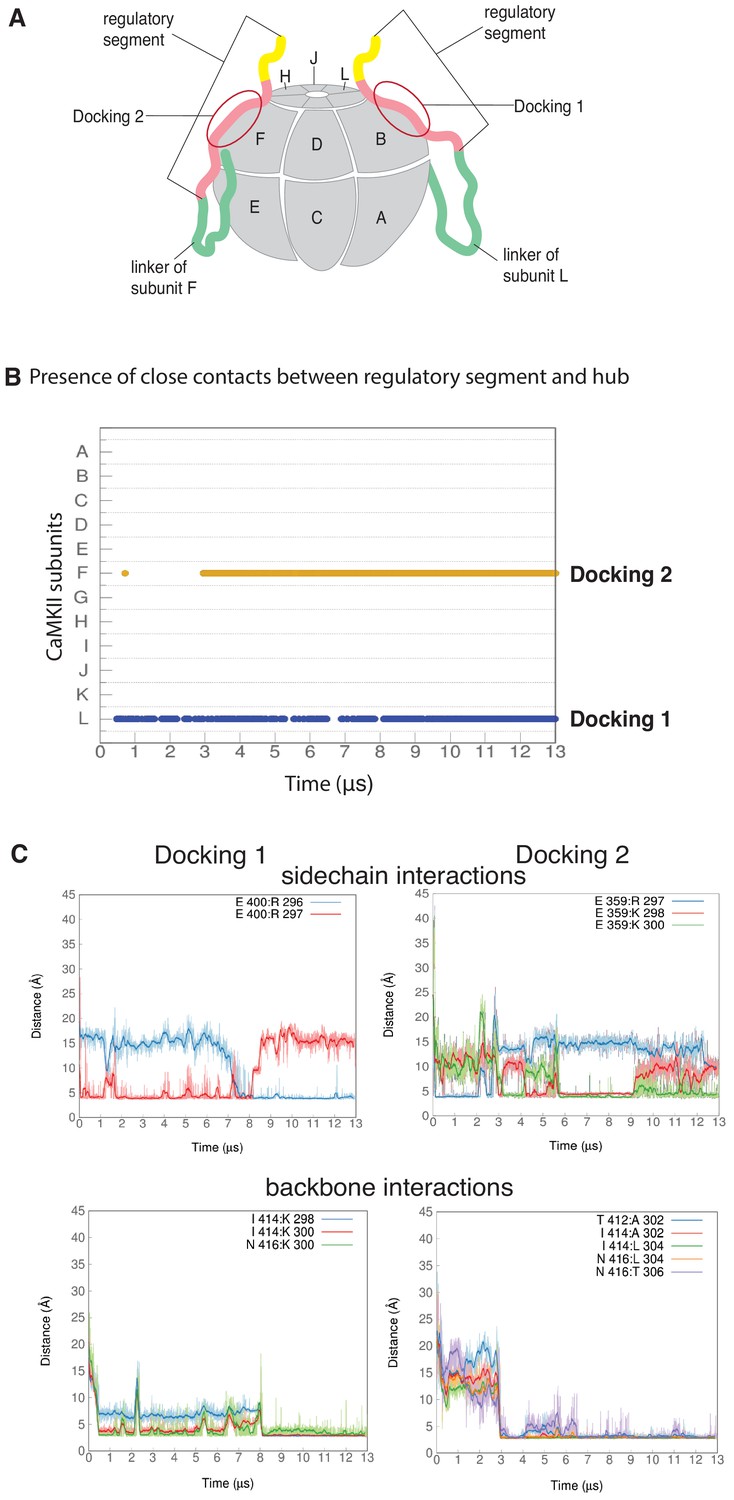
Docking of regulatory segments onto hub assembly.
(A) A schematic representation of the hub assembly with the subunit labeling convention used in this study. The two regulatory segments that dock on the hub assembly are shown, and colored using the same scheme as in Figure 1A. (B) Presence of interactions between residues 298-306 of the calmodulin-binding element of each subunits and the corresponding interfacial β-sheet (residues 410–416) over the course of the simulation. An interaction is considered to be present if at least two backbone hydrogen bonds (distance between donor and acceptor of less than or equal to 3 Å) are formed between the calmodulin-binding element and the β-sheet. (C) Representative sample of distances between residues of the calmodulin-binding element and residues at the interface of the hub assembly from the two docking events. Docking 1 is on the left and Docking 2 is on the right. The darker traces are the time-averaged values of the distances calculated using a moving window of 470 ns while the lighter shades are the actual distances. The two figures on top show distances between positively-charged residues from the calmodulin-binding element and negatively-charged residues that line the interface between two subunits. The terminal carbon atoms of the sidechains were used to calculate distances. The two figures at the bottom show distances between the N and O atoms from residues of the backbone of the calmodulin-binding element and the backbone of the interfacial β-sheet.
Figure 5—figure supplement 2
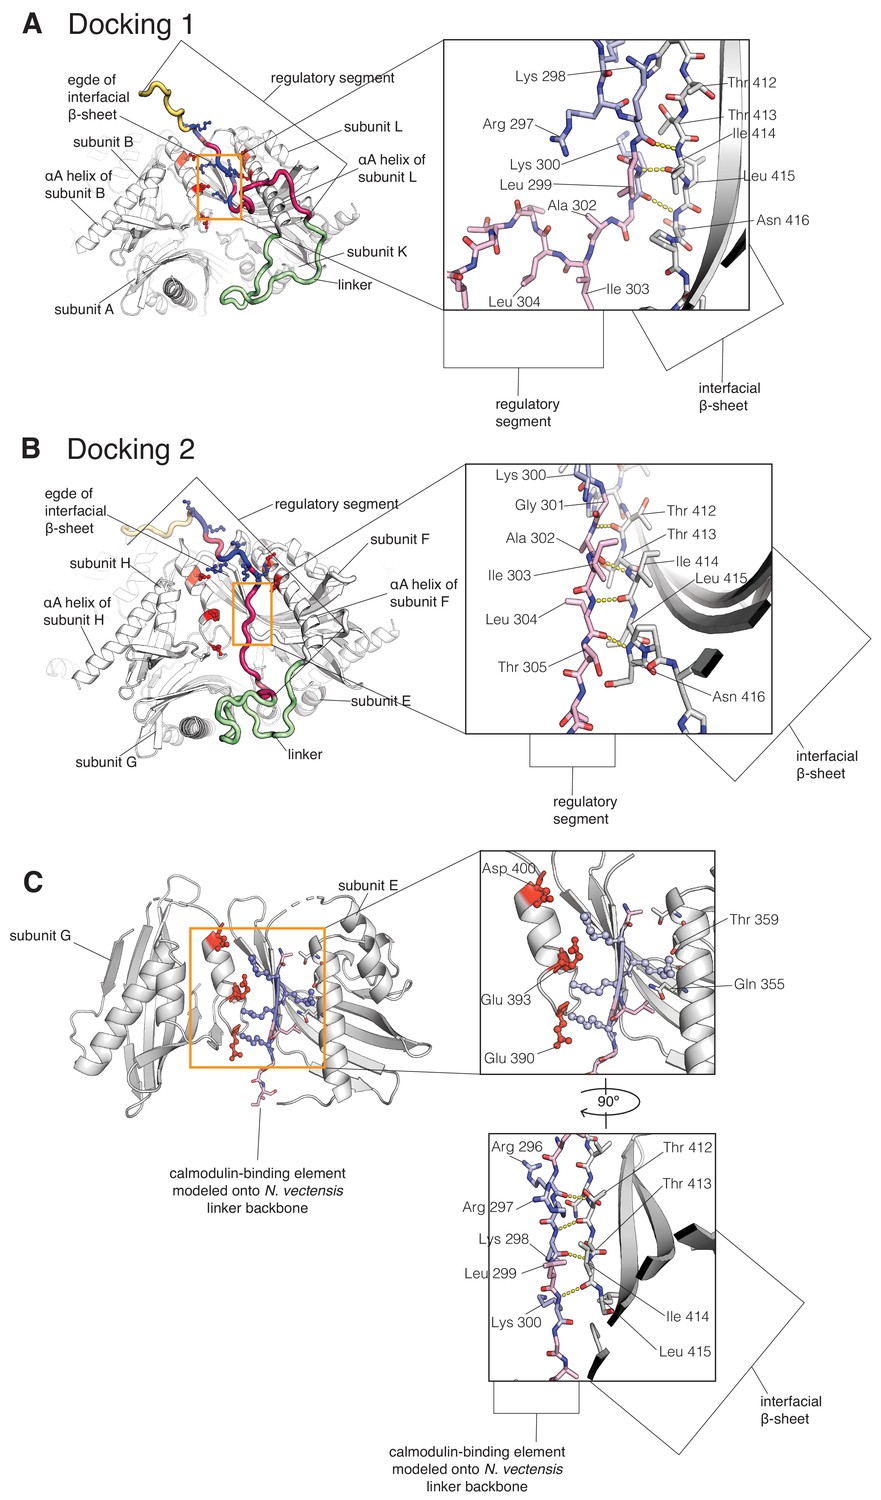
Close-up of two docking events in the simulation, in comparison with a crystal structure where a peptide docks at the interface.
The calmodulin-binding element is colored pale pink, with the positively charged residues colored blue. The interfacial β-sheet is shown in white. (A) Close-up of Docking 1 showing backbone interactions between residues 298–300 of the calmodulin-binding element of subunit L, and residues 412–416 of the edge of the β-sheet of subunit L. (B) Close-up of Docking two showing backbone interactions between residues 301-305 of the calmodulin-binding element of subunit F, and residues 412–416 at the edge of the β-sheet of subunit F. (C) Interface from the crystal structure of CaMKII-B hub from Nematostella vectensis (PDB ID: 5IG5) at pH 4.2 (Bhattacharyya et al., 2016). In this structure, the linker folds back to interact with the hub, extending the interfacial β-sheet. Here, we have replaced the residues of the linker in the crystal structure with residues from the calmodulin-binding element, while maintaining the backbone of the linker, to show how the positively-charged residues from the calmodulin-binding element (in pale blue) might interact with the negatively-charged residues lining the interface (in red), while forming backbone hydrogen bond interactions with the edge of the interfacial β-sheet. This model is quite similar to the structures observed in the simulation.
Figure 6 with 3 supplements
Interfaces at which docking occur are stabilized in an open form, while remaining interfaces close.
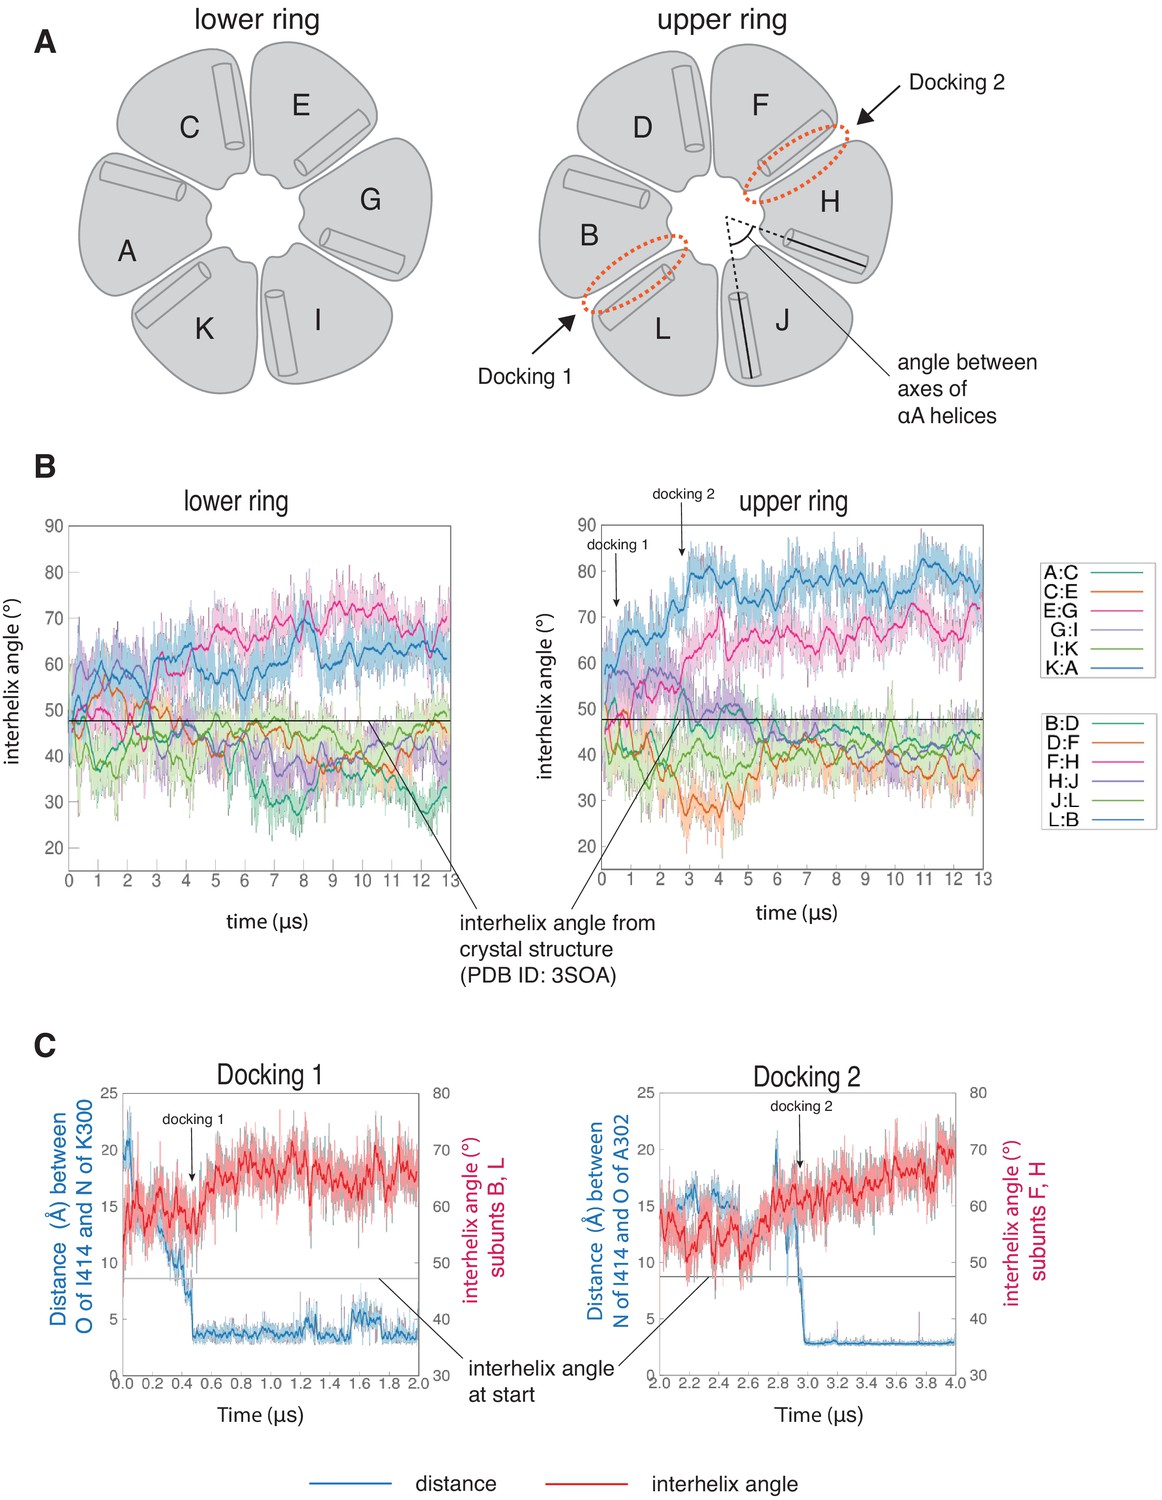
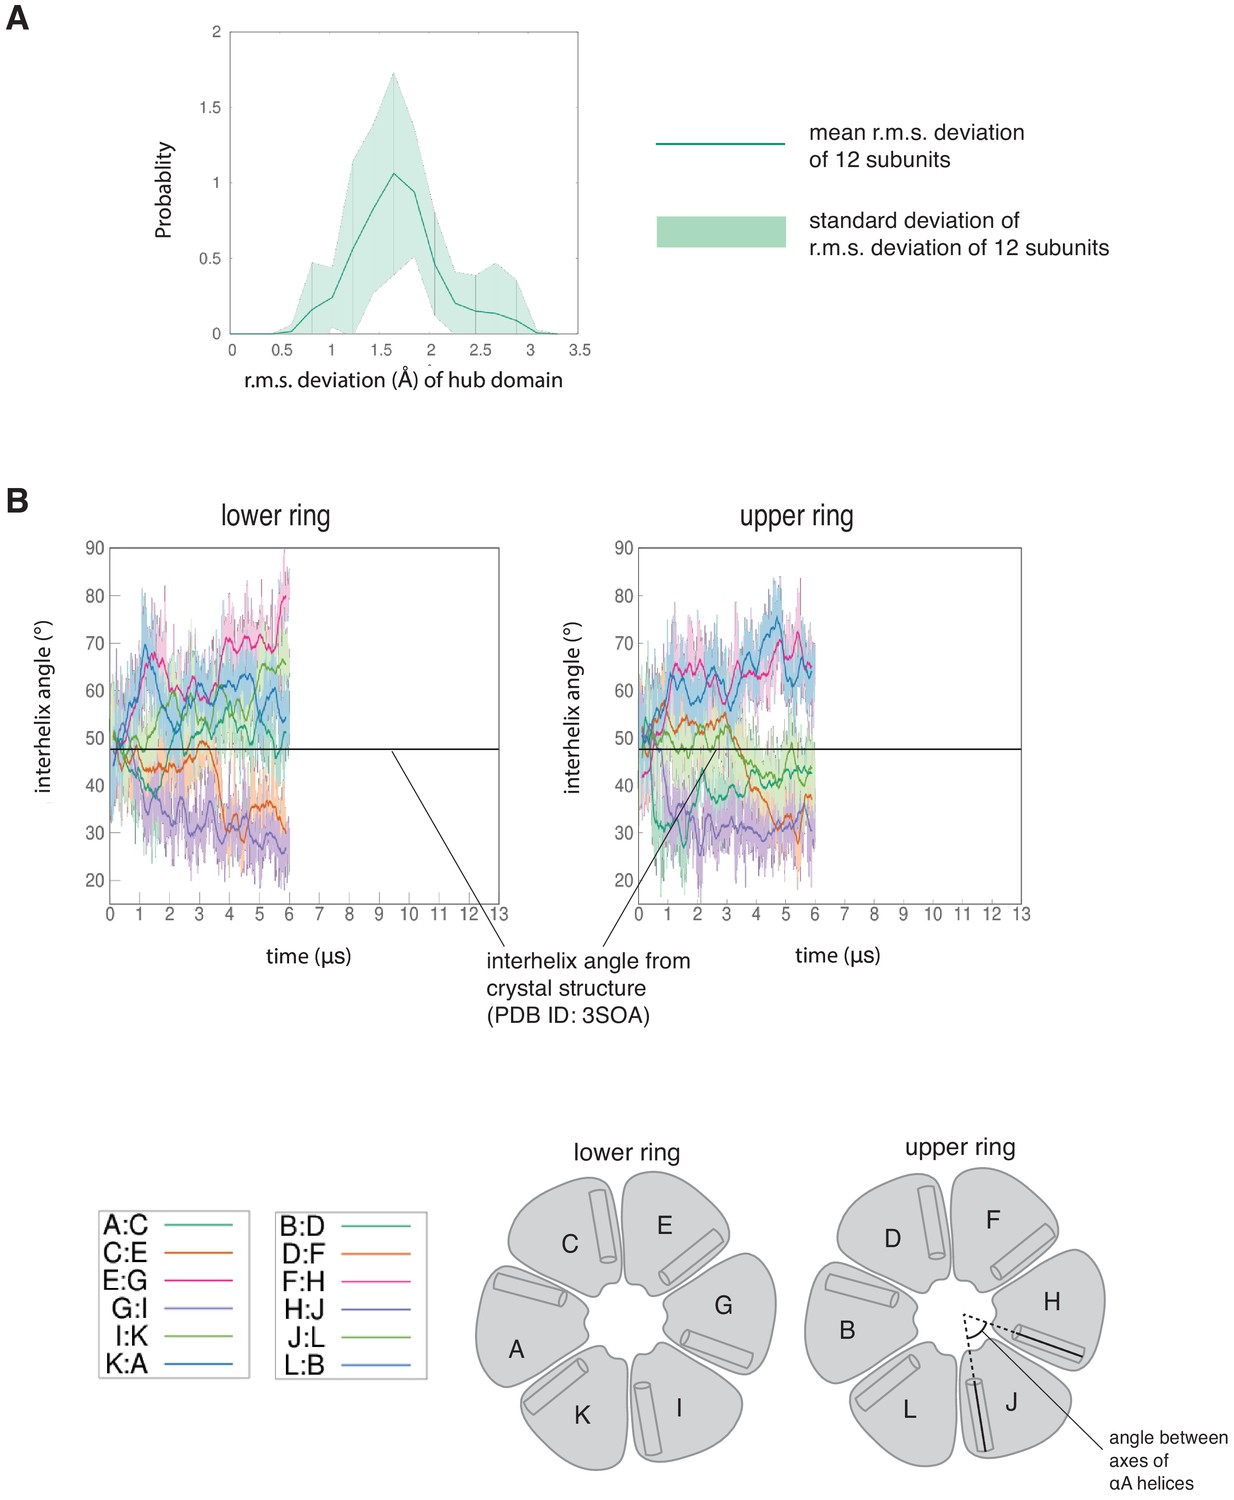
(A) Schematic showing the naming scheme used to identify subunits. The interhelix angle between axes of αA helices are used to measure the rotation of each hub domain with respect to the adjacent hub domain. (B) Variation of the angle between the axes of the αA helices of adjacent subunits in the simulation with the regulatory segment. The darker traces are the time-averaged values of the interhelix angles calculated using a moving window of 240 ns, while the lighter shades are the actual distances. The two interfaces where regulatory segments dock between subunits L and B (colored blue), and between subunits F and H (colored pink) open and the remaining interfaces close. In the lower ring the interfaces mirror the behavior of the interfaces in the upper ring. The interhelix angle between the αA helices of adjacent subunits from the crystal structure of an autoinhibited, dodecameric holoenzyme (PDB ID - 3SOA) (Chao et al., 2011), which is perfectly symmetrical, is indicated by the horizontal black line. (C) Variation in the angle between the axes of the αA helices of hub domains that flank the interfaces where the calmodulin-binding elements dock (shown in red), and the distance between a residue from the calmodulin-binding element and the interfacial β-sheet (shown in blue), over the course of the simulation. The darker traces are the time-averaged values, calculated using a moving window of 12 ns, while the lighter shades are the actual distances. The interhelix angle at the start of the simulation is indicated by a horizontal grey line.
-
Figure 6—source data 1
Numerical data plotted in Figure 6 and accompanying figure supplement.
- https://cdn.elifesciences.org/articles/57784/elife-57784-fig6-data1-v3.zip
Figure 6—figure supplement 1
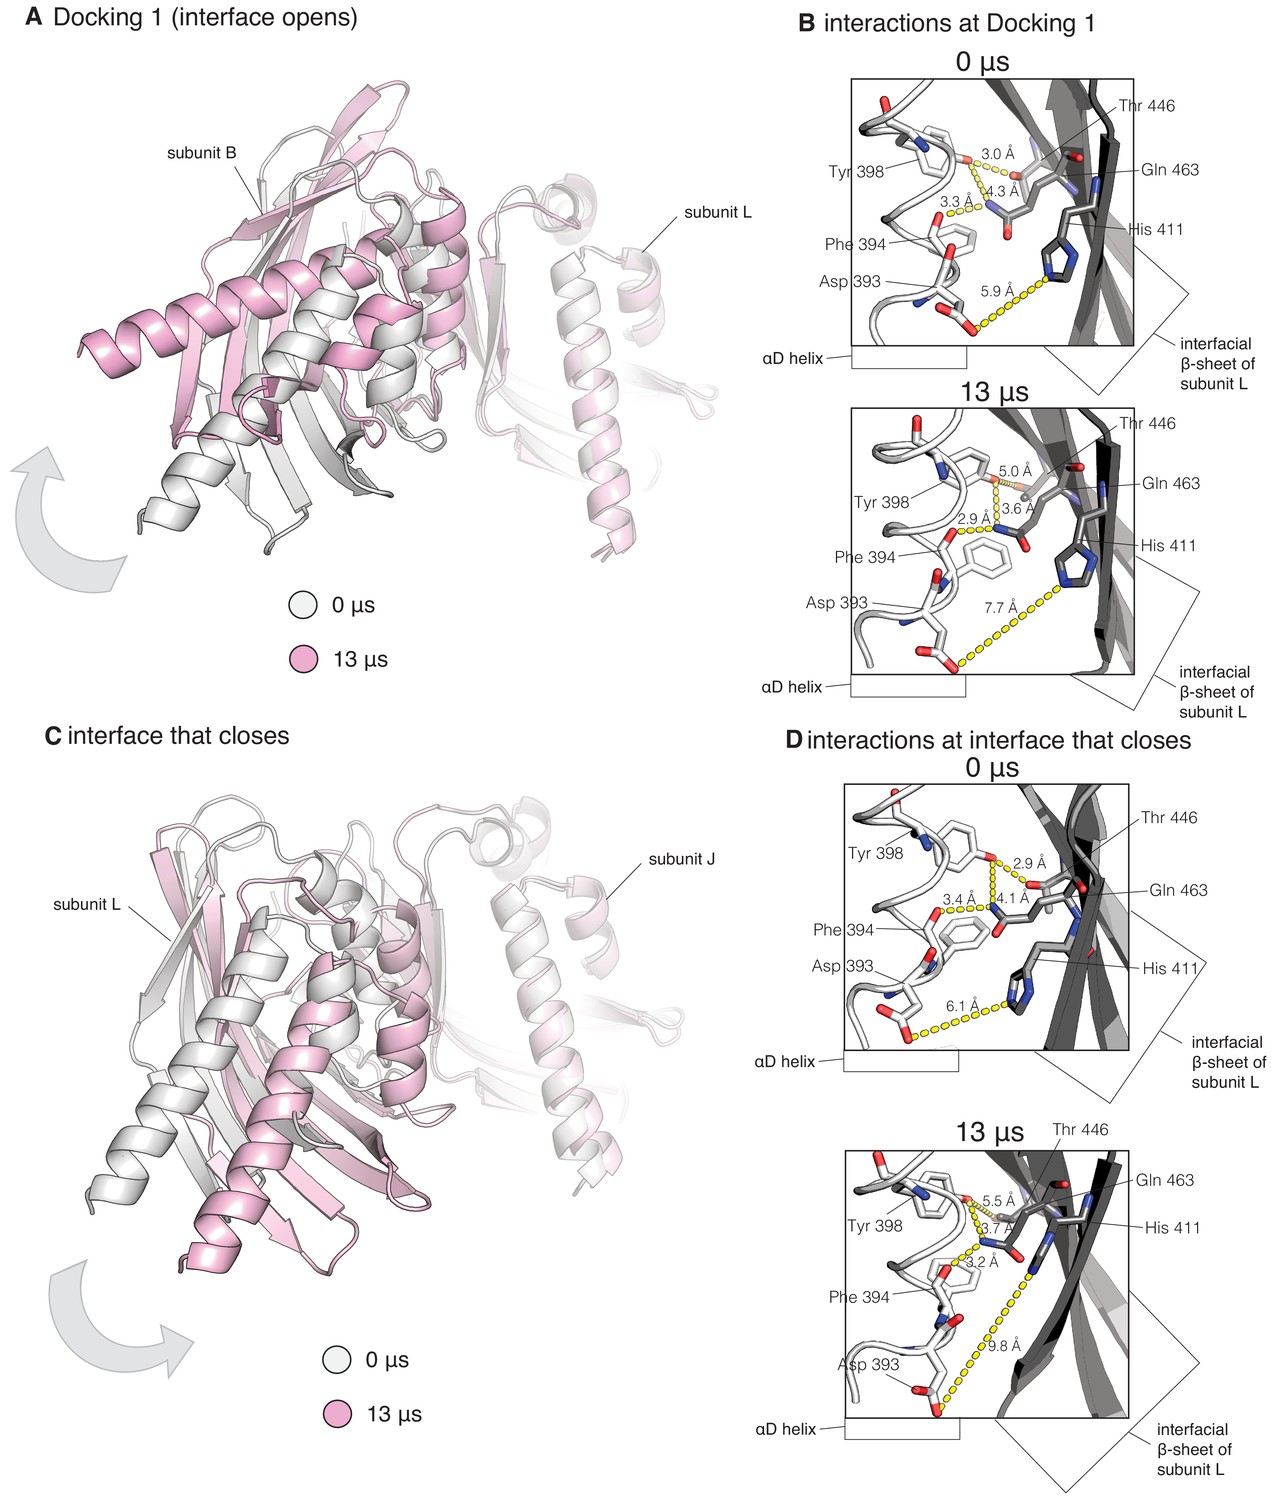
Close-up of hub interfaces from the molecular dynamics simulation of CaMKII-α.
(A) Close-up of interface at which Docking 1 occurs, showing instantaneous snapshots from the end of the simulation overlaid with the start of the simulation, while aligning on the subunit to the right (subunit L). Subunit B (to the left) rotates away from subunit L over the course of the simulation. For clarity, only the hub domains are shown. (B) Hydrogen bond interactions between subunits B and L (same interface as (A)) at the start (top) and end (bottom) of the simulation. (C) Close-up of interface at which a regulatory segment does not dock, showing instantaneous snapshots from the end of the simulation overlaid with the start of the simulation, while aligning on the subunit to the right (subunit J). Subunit L (to the left) rotates toward from subunit J over the course of the simulation. For clarity, only the hub domains are shown. (D) Hydrogen bond interactions between subunits L and J (same interface as (C)) at the start (top) and end (bottom) of the simulation. The hydrogen bonds are intact in both the interface that opens and the interface that closes.
Figure 6—figure supplement 2
Individual subunits of the dodecameric hub are not very dynamic, while the interfaces between the subunits are intrinsically dynamic.
(A) Mean probability distribution of r. m. s. deviation of the 12 hub domains from the simulation of the dodecamer with the regulatory segments and linkers present. The pale green shaded region indicates the standard deviation of the distribution of the r.m.s. deviation of the 12 hub domains. (B) Variation of the angle between the axes of αA helices of adjacent subunits in the simulation without the regulatory segments. The darker traces are the time-averaged values of the interhelix angles calculated using a moving window of 240 ns, while the lighter shades are the actual distances. In this simulation four interfaces in the lower ring open and the remaining two close (left), whereas in the upper ring two interfaces open and four close (right), indicating that the hub assembly is intrinsically highly dynamic. The angle between the axes of the αA helices of adjacent subunits from the crystal structure of an autoinhibited, dodecameric holoenzyme (PDB ID - 3SOA) (Chao et al., 2011), which is perfectly symmetrical, is indicated by the horizontal black line.
Figure 6—figure supplement 3
Model of regulatory segment docked onto the interface between subunits L and J, which closes over the course of the simulation.
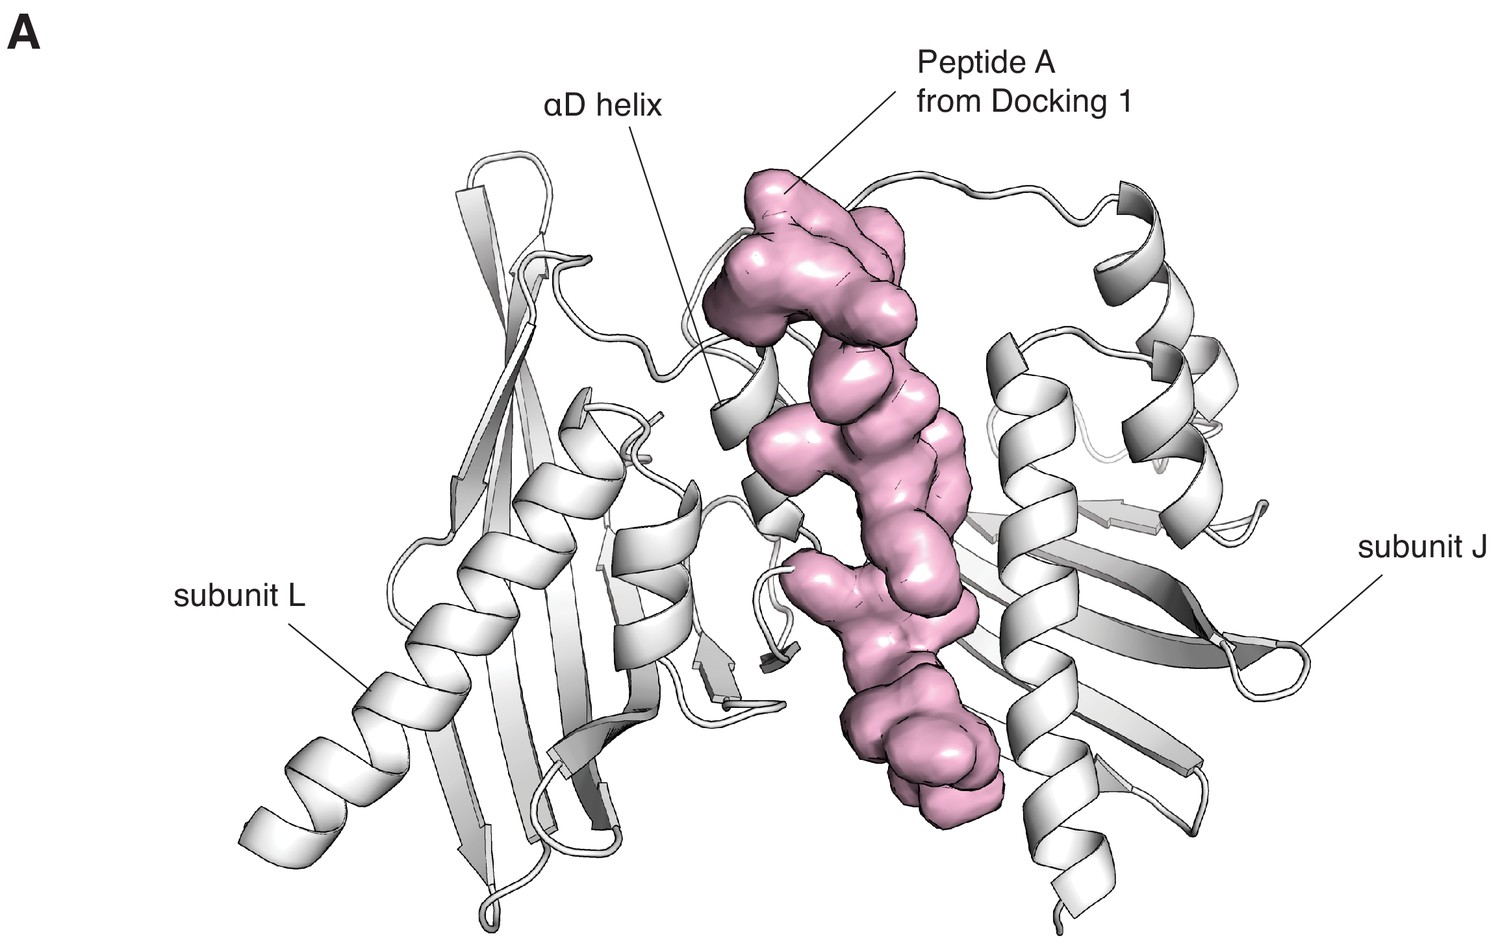
For clarity, only the hub domains on either side of the interface (in white) and the calmodulin-binding element (in pink, with surface representation), are shown. The calmodulin-binding element was taken from subunit L, whose calmodulin-binding element docks at the interface between subunits B and L (Figure 5—figure supplement 2), from a snapshot at the end of the simulation. The model was built by aligning the hub domain of subunit L from a snapshot from the end of the simulation, onto the hub domain of subunit J, also taken from a snapshot at the end of the simulation. This positions the regulatory segment so that it can form backbone interaction with the edge of the inter-facial β-sheet of subunit J, similar to Docking 1. However, there are numerous steric clashes with the αD helix of subunit L on the left, and this interface would have to undergo considerable distortions to accommodate binding by the calmodulin-binding element.
Figure 7

Docking traps the hub assembly in a conformation similar to one of its low-frequency normal modes.
(A) Conformational distortion in interfaces from the molecular dynamics simulation. The cartoon representations show the interfaces at the start of the simulation. Vectors (in pale pink) indicate the movement of the Cα-atoms of the hub domains to the left of the interfaces, with respect to the hub domains to the right of the interfaces, over the course the simulation. The interface at which Docking 1 (left) and Docking 2 (center) occur, open. One of the interfaces that closes is shown (right), and in this the hub domains to the left of the interface moves inwards, toward the interface. For clarity, only vectors from every other Cα-atom are shown. (B) Conformational change of interfaces in internal mode four from the normal mode analysis. The vectors (in pale pink) indicate the movement of the Cα-atoms of the hub domains to the left of the interfaces, with respect to the hub domains to the right of the interfaces, along the vector. Two of the interfaces (left and center) in internal mode four open, just as in the simulation, while the remainder (representative interface shown on right) close. For clarity, only vectors from every other Cα-atom are shown.
Figure 8 with 1 supplement
Activation destabilizes the CaMKII-α holoenzyme.
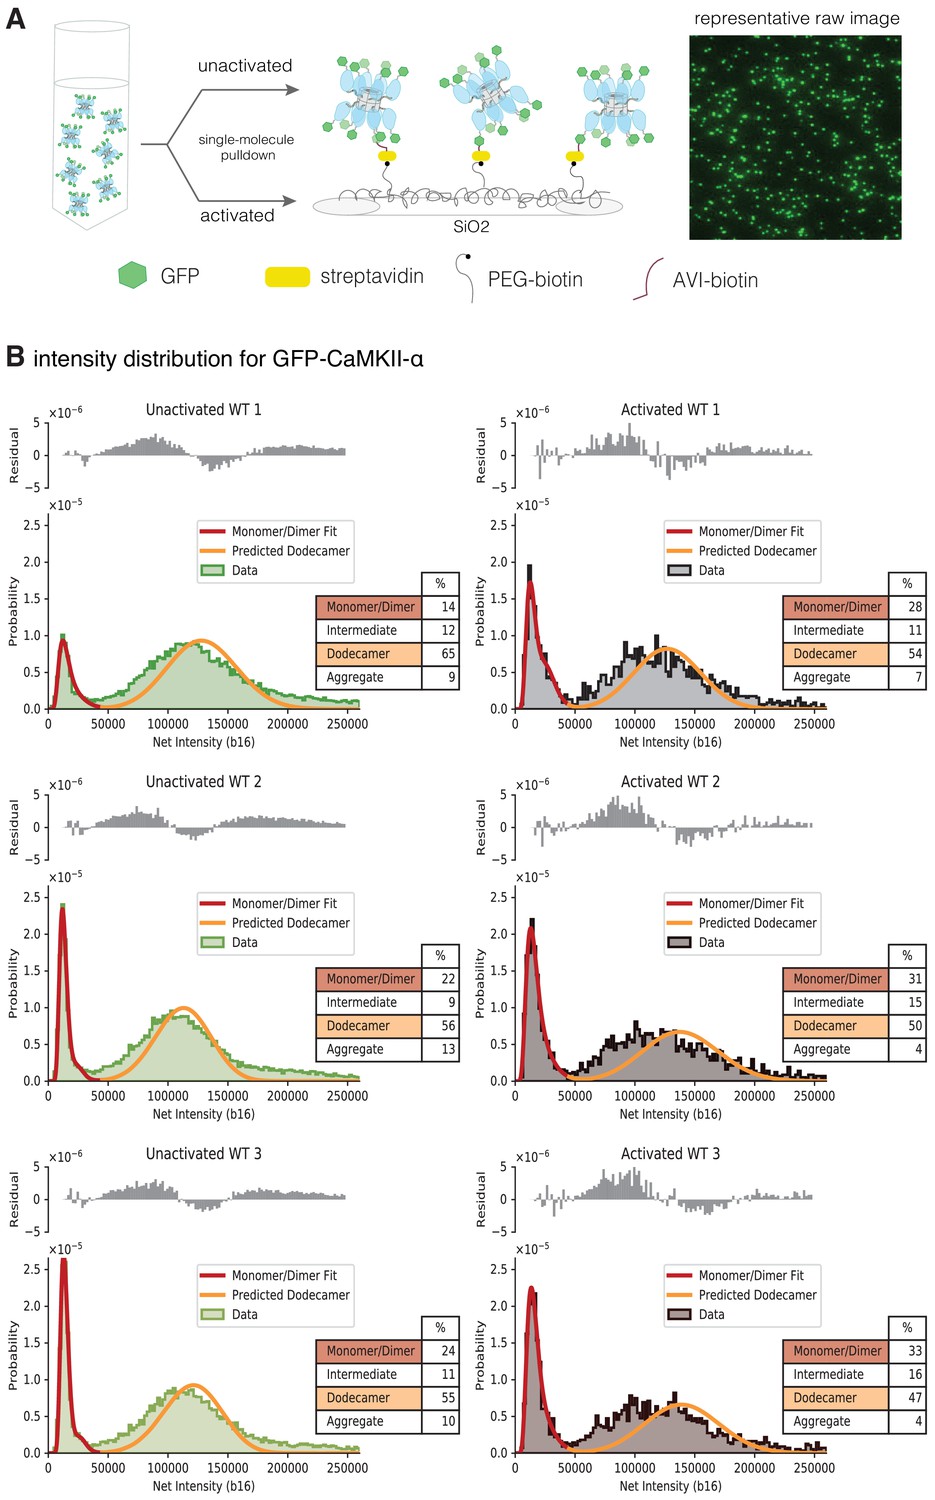
(A) Schematic showing the experimental setup. Biotinylated mEGFP-CaMKII-α was overexpressed in HEK 293 T cells, the cells were lysed and mEGFP-CaMKII-α from the diluted cell lysate was either first activated, or directly pulled down onto a glass coverslip, functionalized with streptavidin, for visualization at single-molecule resolution. The fluorescence intensity of each individual mEGFP-CaMKII-α is correlated with its oligomeric state. (B) Distribution of the intensities for three replicates of unactivated (left) and activated (right) mEGFP-CaMKII-α. Two major peaks are observed, with a peak at lower intensity, and a peak at higher intensity. There is a shoulder in the peak at lower intensity, and together these correspond to a mixture of monomers and dimers, with the dimer intensities occurring in the shoulder. The peak at higher intensities corresponds to intact dodecameric holoenzymes. The intensity data were fit to a mixture comprising of monomers and dimers (red line) and the position of the peak corresponding to dodecamers was predicted (orange line). The majority of the area of the histogram is captured by these three components; however, there are oligomers of intermediate sizes also present. The residual plot shows the deviation from data with the fitted three-component distribution and shows the intermediate oligomeric species (between dimer and dodecamer). The percentage of the smaller, intermediate, dodecameric and aggregate species in the samples, as estimated from the fit are shown. Upon activation, the area of the peak at lower intensity rises, with a ~1.3–2-fold increase across three replicates, indicating that upon activation the holoenzyme undergoes some disassembly to form dimers. The percentage of intermediate oligomeric species also increases upon activation.
-
Figure 8—source data 1
Numerical data plotted in Figure 8 and accompanying figure supplement.
- https://cdn.elifesciences.org/articles/57784/elife-57784-fig8-data1-v3.zip
-
Figure 8—source code 1
Source code used to generate figures plotted in Figure 8 and Figure 9.
- https://cdn.elifesciences.org/articles/57784/elife-57784-fig8-code1-v3.zip
Figure 8—figure supplement 1
Peaks at lower intensities correspond to monomeric and dimeric species of CaMKII-α.
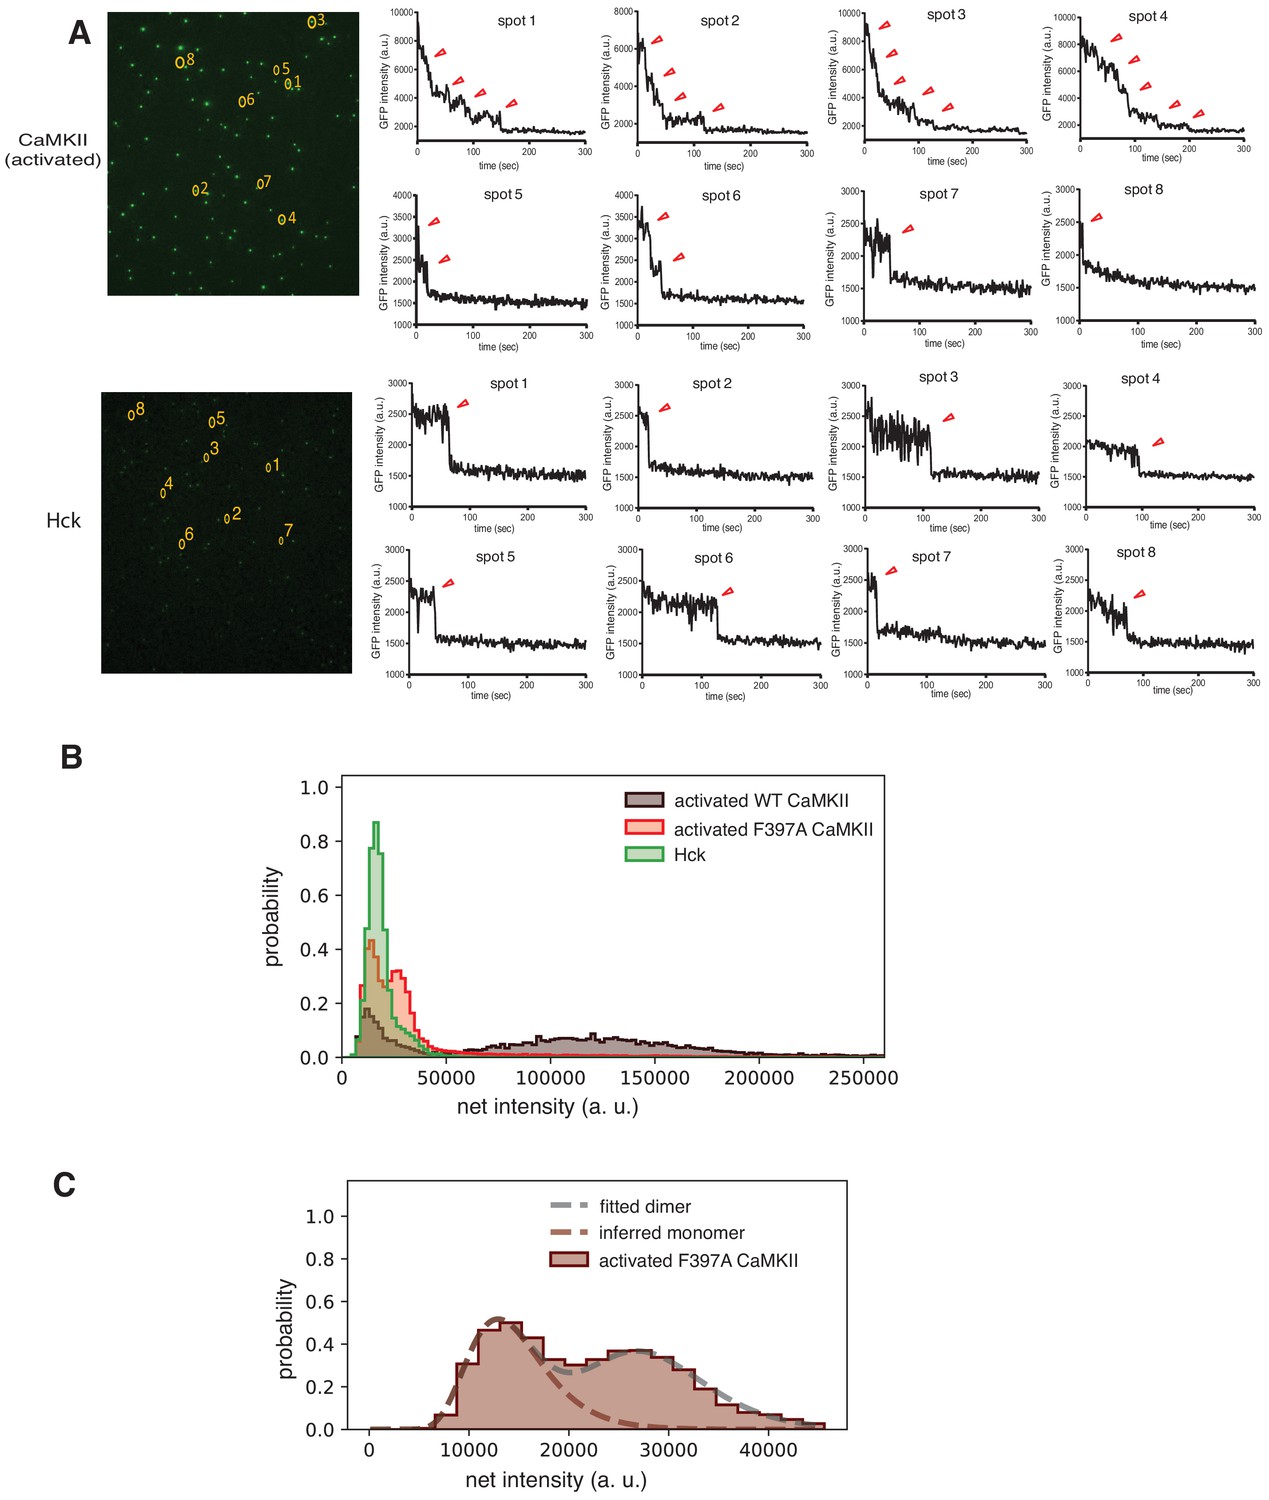
(A) Step photobleaching analyses of mEGFP-CaMKII-α (top) and Hck (bottom). One-step, two-step and multiple-step traces are observed in mEGFP-CaMKII-α. Only one-step traces are observed in Hck. The one-step traces in both samples occur at similar intensities indicating that the lower intensity spots in mEGFP-CaMKII-α correspond to monomers. (B) Intensity distribution curves for activated mEGFP-CaMKII-α, activated F397A mEGFP-CaMKII-α and Hck indicate that the low-intensity peak observed in the CaMKII samples correspond to monomers, with the intensities that correspond to dimers appearing as a shoulder in the monomeric peak in the wild-type sample. In F397A mEGFP-CaMKII-α sample, the low-intensity peak can be clearly resolved into peaks corresponding to monomers and dimers. (C) Intensity distribution curves generated by convolving a log-normal intensity distribution curve from the monomeric species (see Materials and methods for a detailed description). The fit for peak at lower intensity for F397A mEGFP-CaMKII-α is shown, since this peak can clearly be resolved into monomeric and dimeric species. Here, two auto-convolutions of the log-normal distribution of the monomer yields the distribution for the dimeric species. The model curve generated by 12 convolutions matches the experimental intensity distribution curve, indicating that the peak at higher intensity corresponds to a dodecamer.
Figure 9 with 1 supplement
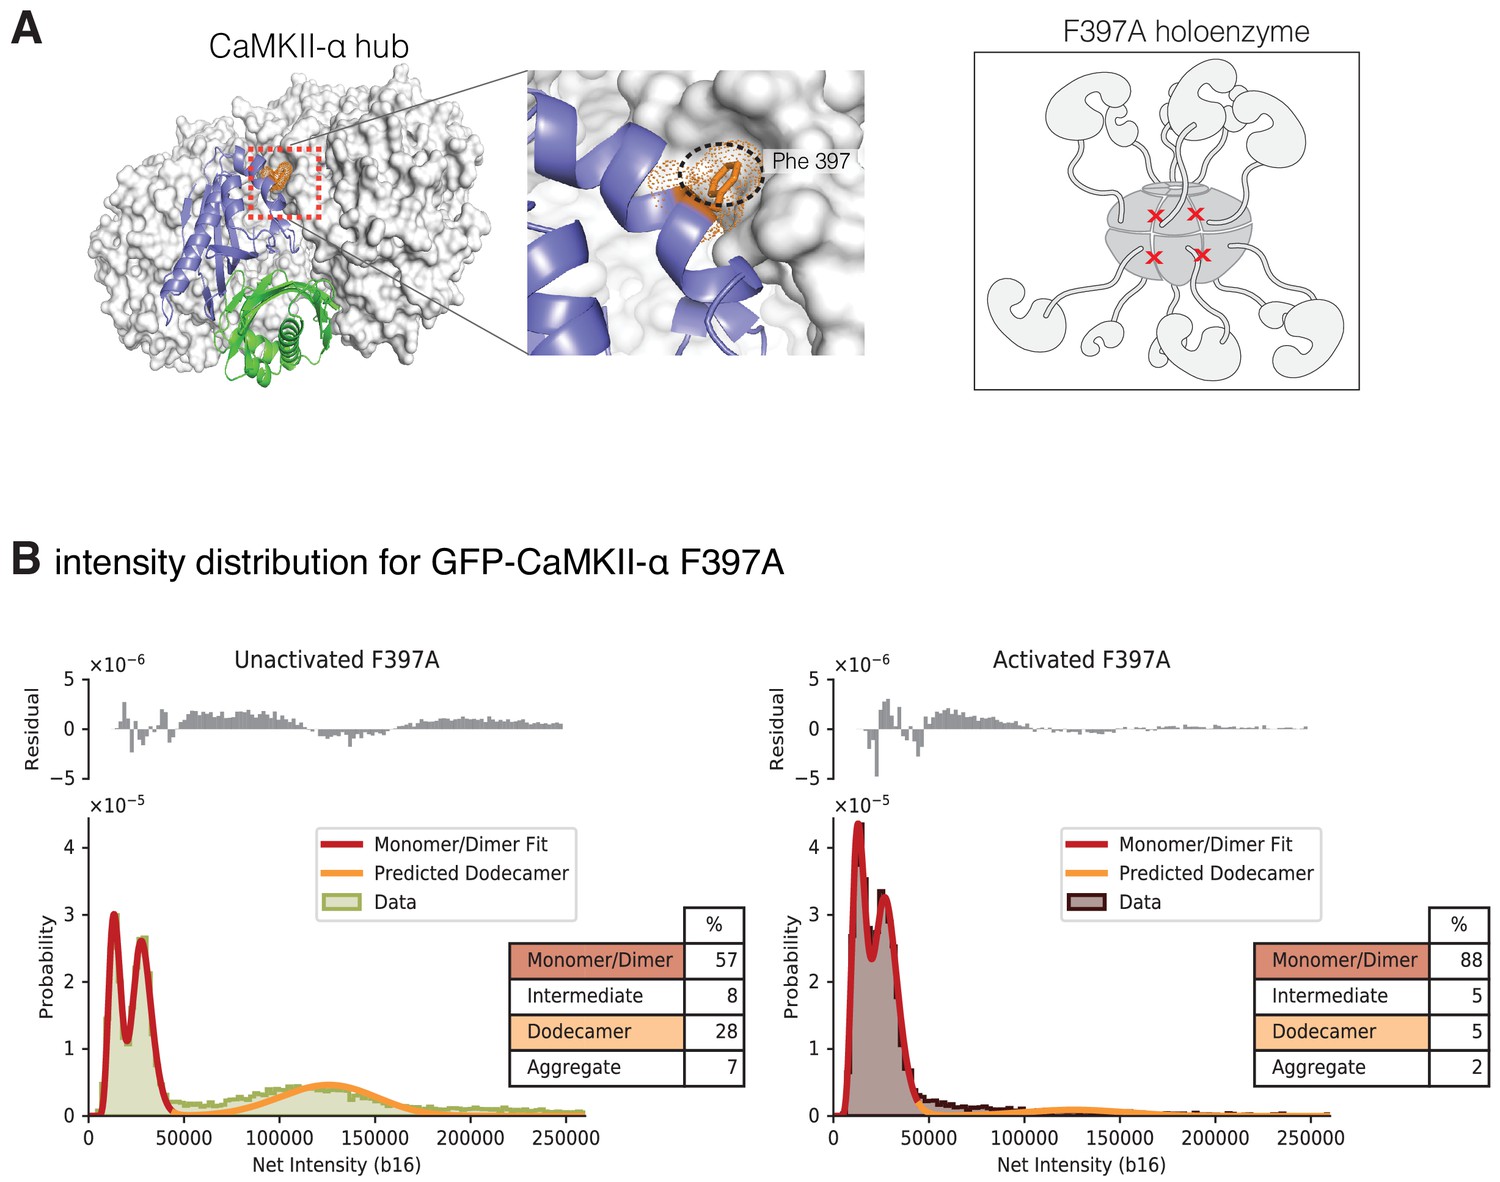
Intensity distribution of F397A mEGFP-CaMKII-α.
(A) Crystal structure of human dodecameric CaMKII-α hub assembly (PDB ID – 5IG3) (Bhattacharyya et al., 2016) with the interface high-lighted. Replacement of Phe 397 at the hub interface with alanine weakens this interface. (B) Distribution of the intensities of unactivated (left) and activated (right) F397A mEGFP-CaMKII-α. At lower intensity, peaks corresponding to monomeric and dimeric species are observed. In the unactivated sample the peak at higher intensity, that corresponds to intact dodecameric holoenzyme is much smaller than in the wild-type sample. Upon activation this peak is no longer observed. As in the experiments with wild-type CaMKII-α, the intensity data were fit to a mixture comprising of monomers and dimers (red line) and the position of the peak corresponding to dodecamers was predicted (orange line). The residual plot shows the deviation from data with the fitted three-component distribution and shows the intermediate oligomeric species (between dimer and dodecamer). The percentage of the smaller, intermediate, dodecameric and aggregate species in the samples, as estimated from the fit, are shown.
-
Figure 9—source data 1
Numerical data plotted in Figure 9 and accompanying figure supplement.
- https://cdn.elifesciences.org/articles/57784/elife-57784-fig9-data1-v3.zip
Figure 9—figure supplement 1
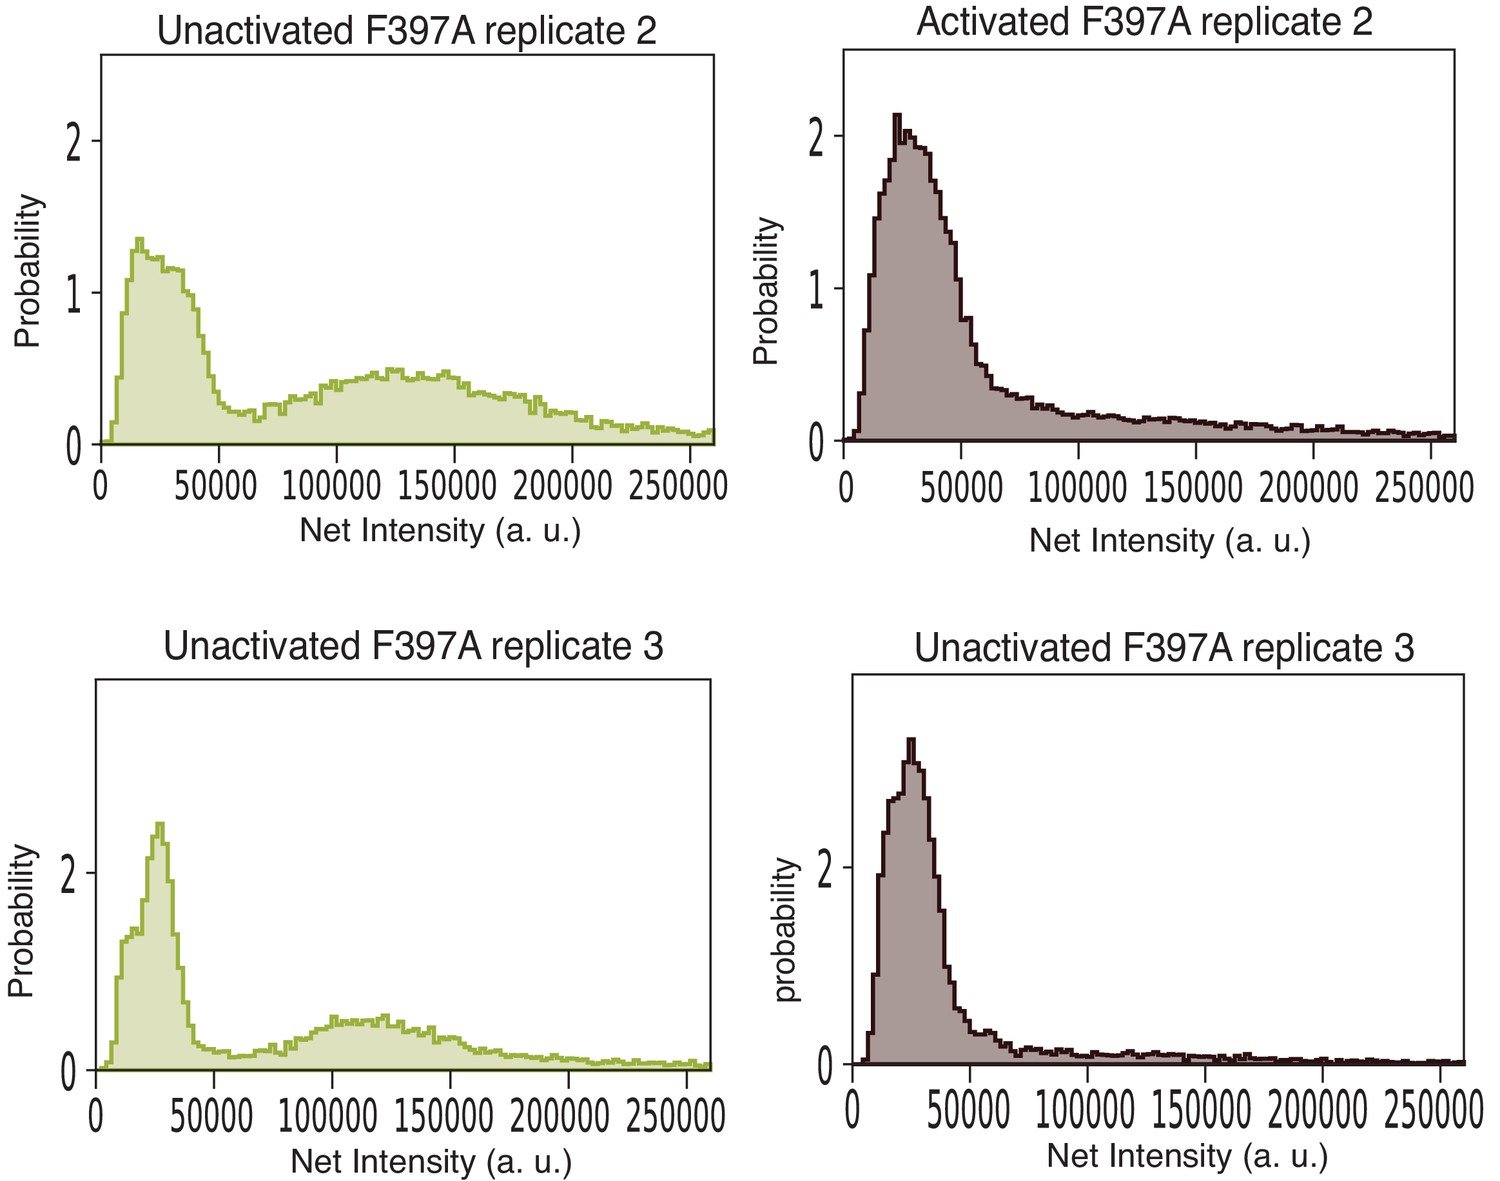
Intensity distribution of F397A mEGFP-CaMKII-α replicates.
These data were collected with a 12-bit camera, and the intensities were rescaled to 16-bits to be consistent with data reported in Figures 8 and 9. For these samples, the particles were localized with the Difference of Gaussian detector with an initial diameter set to five pixels. A threshold value of 150 was used to exclude noisy, low-intensity spots. Only particles within a central area of 350 × 350 pixel2 were included in the calculation. Dark images were not collected, and the correction for uneven illumination and fringe interference effects were not done for these samples. However, both replicates qualitatively agree with the results shown in Figure 9. In both the replicates, the unactivated sample has a large peak at lower intensity that corresponds to a mixture of monomeric and dimeric species. A peak at higher intensity that corresponds to intact dodecameric holoenzymes is observed. Upon activation the area of the peaks at lower intensities in both replicates increases, while the peak at higher intensity is not observed.
Tables
Table 1
Estimated fraction of dark GFP.
| NUs | |
|---|---|
| Unactivated WT 1 | 0.282 |
| Activated WT 1 | 0.279 |
| Unactivated WT 2 | 0.328 |
| Activated WT 2 | 0.287 |
| Unactivated WT 3 | 0.296 |
| Activated WT 3 | 0.299 |
| Unactivated FA | 0.274 |
| Activated FA | 0.332 |
Key resources table
| Reagent type (species) or resource | Designation | Source or reference | Identifiers | Additional information |
|---|---|---|---|---|
| Gene (Homo sapiens) | CAMK2N1 | GenBank | HGNC:HGNC:1460 | |
| Strain, strain background (Escherichia coli) | BL21(DE3) | Sigma-Aldrich | CMC0014 | Chemically competent |
| Cell line (Homo sapiens) | HEK293T | UC Berkeley cell culture facility | Authenticated using STR profiling and tested negative for mycoplasma | |
| Recombinant DNA reagent | pEGFP-C1 (plasmid) | Clontech, Mountain View, CA | Vector backbone for inserting the CaMKII genes | |
| Recombinant DNA reagent | pSNAPf (plasmid) | New England Biolabs, MA | N9183S | Vector backbone |
| Transfected construct (Homo sapiens) | pEGFP-C1-Avi-mEGFP-CaMKII | This paper | pEGFP-C1 vector was modified to have a biotinylation sequence followed by a linker at the N-terminus of mEGFP. Full-length human CaMKII-α is at the C-terminus of mEGFP. | |
| Transfected construct (Homo sapiens) | pET21a-BirA | Addgene | # 20857 | |
| Transfected construct | pcDNA3.1 | Addgene | ||
| Recombinant DNA reagent | pET 28-6xHis-precission- CaMKII Hub | This paper | pET-28 vector was modified to contain a PreScission Protease site between the N-terminal 6-histidine tag and the Human CaMKII-α hub coding sequence | |
| Recombinant DNA reagent | pSNAPf- BirA | This paper | BirA was cloned into the pSNAPf vector after removing the SNAP-tag. | |
| Peptide, recombinant protein | Peptide A (LKKFNARRKLKGAILTTMLA) | Elim Biopharm | ||
| Peptide, recombinant protein | Peptide B (AILTTMLATRNFSGGKSGGNKK) | Elim Biopharm | ||
| Peptide, recombinant protein | Peptide C (LKEFNAERKLEGAILTTMLA) | Elim Biopharm | ||
| Peptide, recombinant protein | Peptide D (LKKFNARRKLKGAGSGSGSAC) | Elim Biopharm | ||
| Peptide, recombinant protein | Peptide G (RSTVASCMHRQETVDCLKKFNA) | Elim Biopharm | ||
| Peptide, recombinant protein | Peptide F (LKKFNARRKLKGAILGSMLAC) | Elim Biopharm | ||
| Peptide, recombinant protein | Peptide H, CaMKIINTide (KRPPKLGQIGRSKRVVIEDDRIDDVLK) | Elim Biopharm | ||
| Peptide, recombinant protein | Peptide Aphos(LKKFNARRKLKGAILpTTMLA) | Elim Biopharm | ||
| Peptide, recombinant protein | Peptide Bphos(AILpTTMLATRNFSGGKSGGNKK) | Elim Biopharm | ||
| Peptide, recombinant protein | Poly-L-lysine PEG (PLL:PEG) | SuSoS, Dübendorf, Switzerland | PLL(20)-g[3.5]- PEG(2) | Preparation of flow chambers |
| Peptide, recombinant protein | streptavidin | Sigma-Aldrich | S0677 | Functionalize the glass substrates for capturing biotinylated CaMKII |
| Peptide, recombinant protein | Calmodulin | Sigma-Aldrich | C4874 | Activation of CaMKII |
| Chemical compound, drug | PEG-Biotin | SuSoS, Dübendorf, Switzerland | PLL(20)-g[3.5]- PEG(2)/PEG(3.4)- biotin(50%) | Preparation of flow chambers |
| Chemical compound, drug | 1% protease inhibitor cocktail | Sigma | P8340 | Protease inhibitor cocktail for lysis buffer |
| Chemical compound, drug | 0.5% phosphatase inhibitor cocktail 2 and 3 | Sigma | P0044 and P5726 | Phosphatase inhibitor cocktails for lysis buffer |
| Software, algorithm | FIJI (ImageJ) | Open access software, see https://imagej.net/Fiji/Downloads | Image processing | |
| Software, algorithm | In-house python code | Open access, see, See Figure 8 and 9 Figure 8—source code 1 | Image processing | |
| Other | Sticky-Slide VI 0.4 | Ibidi | 80608 | Flow chambers |
| Other | Glass coverslips | Ibidi | 10812 | functionalized substrates |
| Software, algorithm | Mass spectrometry data acquisition | Software MassLynx 4.1 SCN 957 | Data collected on a Waters SYNAPT G2Si Mass spectrometer. Version 4.1 SCN 957 or later required to process data | |
| Other | 500 nm opening borosilicate emitters | Generated in the lab with a tip puller |
Additional files
Download links
A two-part list of links to download the article, or parts of the article, in various formats.
Downloads (link to download the article as PDF)
Open citations (links to open the citations from this article in various online reference manager services)
Cite this article (links to download the citations from this article in formats compatible with various reference manager tools)
Breakage of the oligomeric CaMKII hub by the regulatory segment of the kinase
eLife 9:e57784.
https://doi.org/10.7554/eLife.57784


