TANGO1 membrane helices create a lipid diffusion barrier at curved membranes
- Centre for Genomic Regulation, The Barcelona Institute of Science and Technology, Spain
- Department of Cell Biology, Yale School of Medicine, United States
- ICFO-Institut de Ciencies Fotoniques, The Barcelona Institute of Science and Technology, Spain
- Laboratoire de Physique de l’Ecole normale supérieure, ENS, Université PSL, CNRS, Sorbonne Université, Université de Paris, France
- Universitat Pompeu Fabra, Spain
- Institució Catalana de Recerca i Estudis Avançats, Spain
Figures
Figure 1
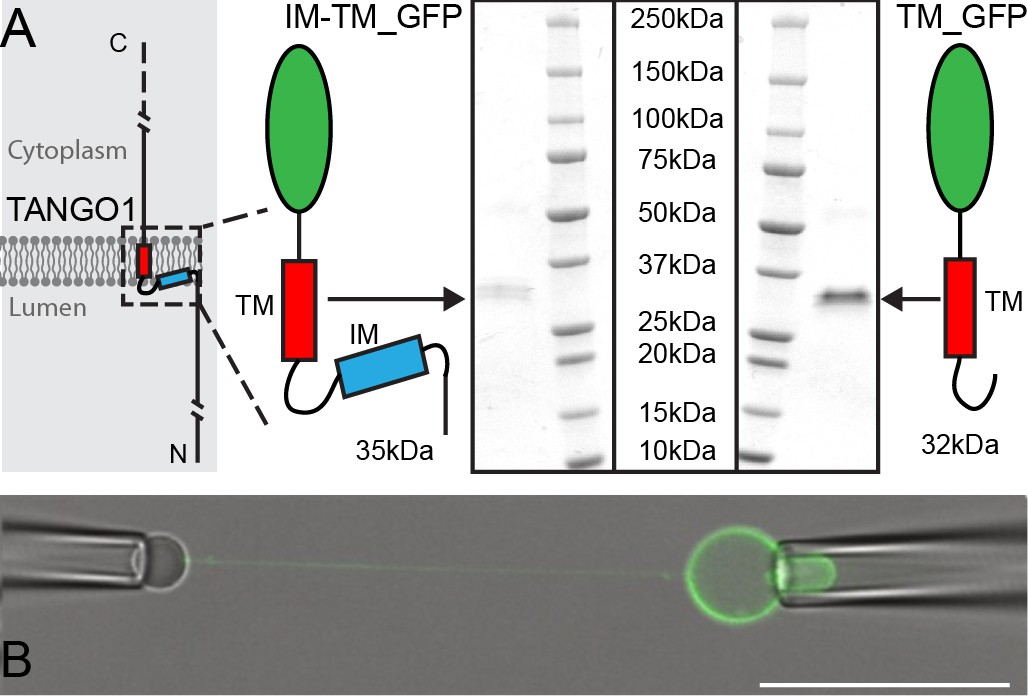
Micromanipulation of TANGO1 transmembrane-domain minimal constructs reconstituted into GUVs.
(A) The two constructs used in this study. Schematics and Coomassie gels of the purified proteins with either both hydrophobic helices (Intramembrane IM, and transmembrane TM) tagged with monomeric superfolder EGFP (IM-TM_GFP left), or the transmembrane alone with the same EGFP tag (TM_GFP right). (B) The proteins (green) were reconstituted into GUVs and a second pipette with a biotin-tagged bead was used to pull a tube from the surface of the GUV. Scale bar 25 μm.
Figure 2 with 1 supplement
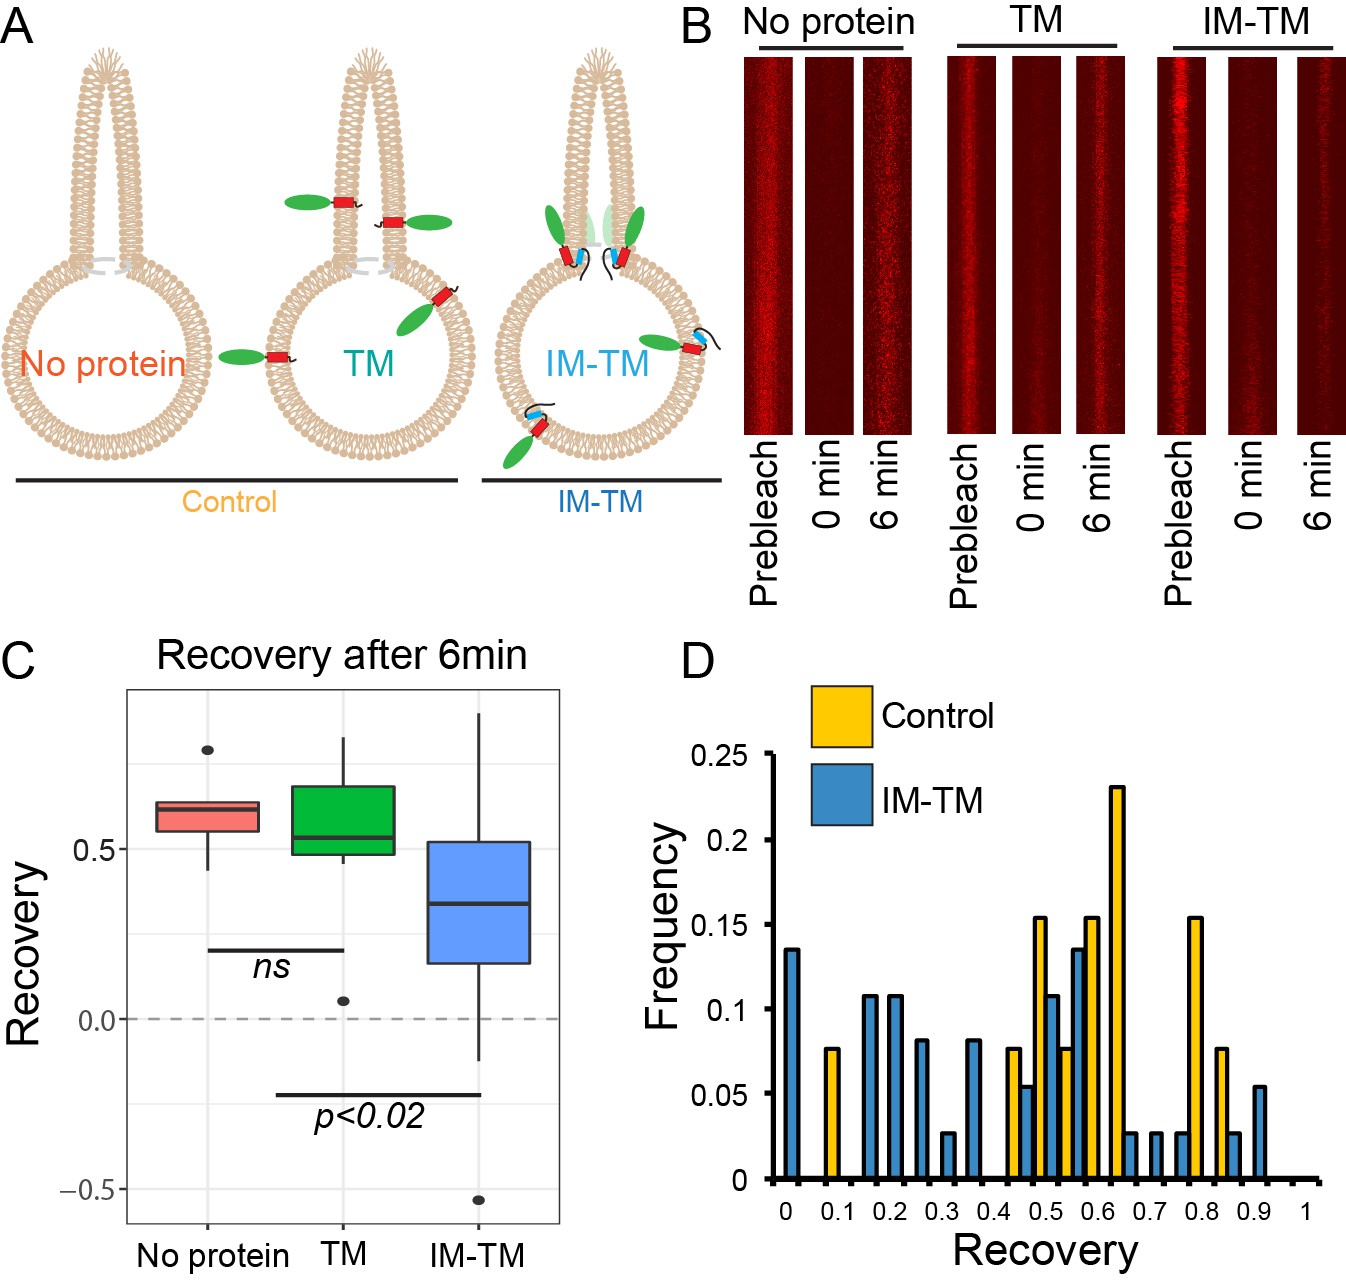
TANGO1 helices are a barrier to diffusion of lipids.
(A) Schematic of the three conditions (no protein, TM, IM-TM) with protein reconstitution into a GUV showing a tube pulled from the GUV; (B) Atto647N-labelled lipids visualised in the pulled tube in all three conditions, before bleaching (prebleach), then immediately after bleaching (0 min) and six minutes later (6 min). (C) Box plot quantification of the fluorescence recovery after 6 min; (D) Frequency histogram showing the extent of fluorescence recovery in tubes pulled from GUVs with no protein or TM pooled (yellow) or GUVs with TM_IM (blue). Most trials with low recovery rates were those where tubes were pulled from GUVs with IM-TM (blue line vs green and red lines). ns – not significant or p<0.02 by ANOVA.
Figure 2—figure supplement 1
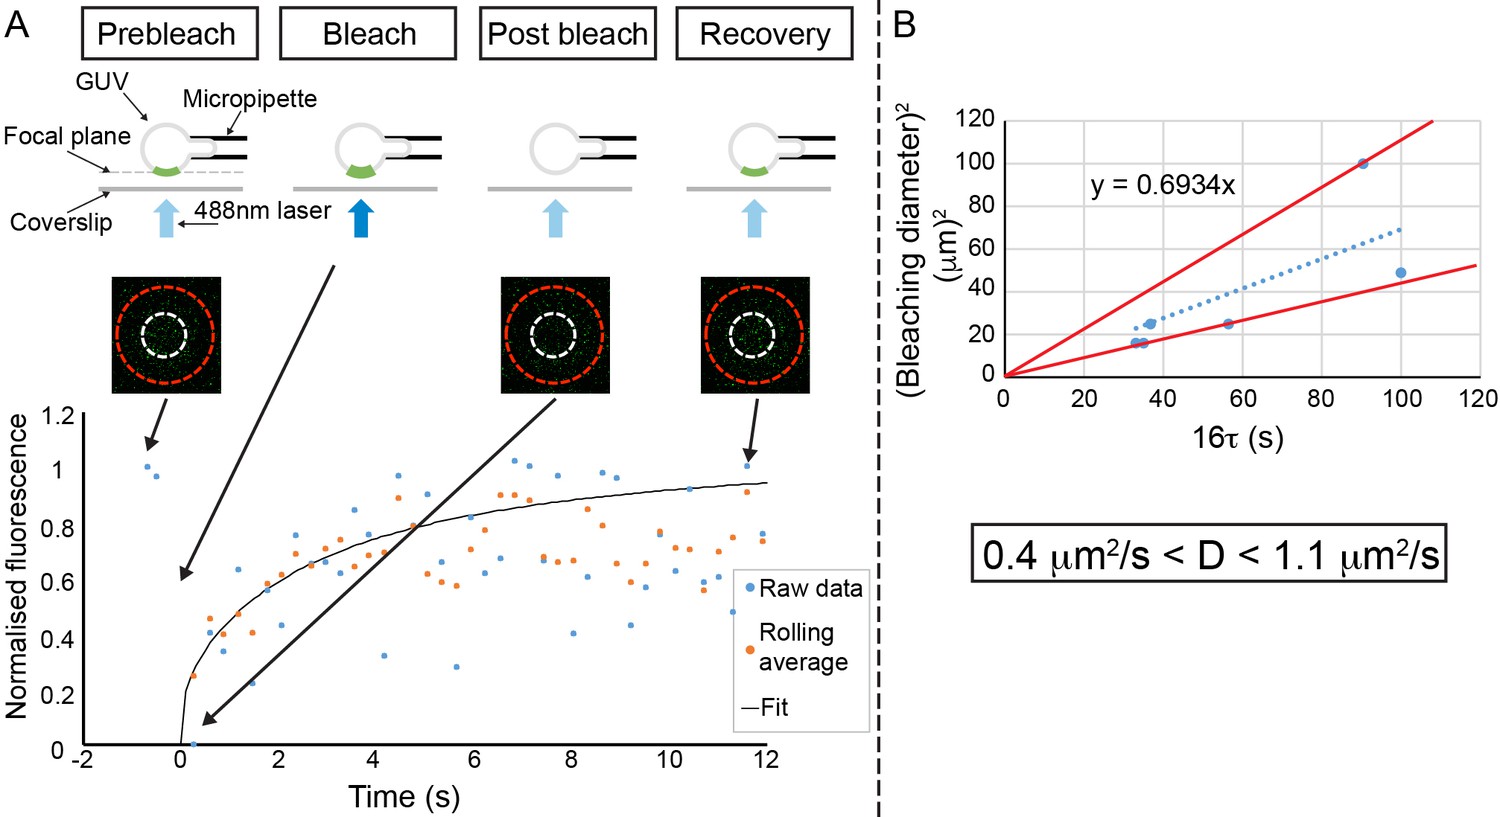
IM-TM diffuses freely.
(A) Schematic of the experiment. A bottom pole of a micromanipulated GUV is placed in the focal plane of the confocal microscope. The fluorescence in a disk-shaped region of interest is monitored before bleaching and during the recovery phase. The three pictures show the pole of the GUV delineated by the red circle, the region of interest delineated by the white circle (here, the diameter is 5 µm) before bleach, right after bleach and after recovery from left to right respectively. The graph shows the raw fluorescence recovery in the region of interest (blue points), the three data-point rolling average (orange) and the fit of the rolling average using the equation indicated in the Materials and methods section. (B) The square of the diameter of the region of interest is plotted vs. the raw values of τ (multiplied by a factor of 16), from the fit of 6 different FRAP experiments (three experiments performed twice on two different days). The slope is equal to the diffusion coefficient, D, here 0.69 µm²/s. At the bottom, the extreme values of D obtained from the data point (red lines) are indicated. Hence, D = 0.7 ± 0.3 µm²/s.
Figure 3 with 1 supplement

Deletion of the intramembrane helix has no effect on TANGO1 recruitment to ERES.
(A) Schematic of TANGO1 constructs used in this study, showing the sequence of the transmembrane and intramembrane helices. (B) The three HA-epitope tagged constructs were expressed in 2H5 cells, which were then imaged for HA and Sec16A. Scale bar: 20μm, Inset: 2μm. (C) Plot of the Manders’ colocalization coefficients of the extent of overlap of HA (TANGO1 constructs) with Sec16A.
Figure 3—figure supplement 1
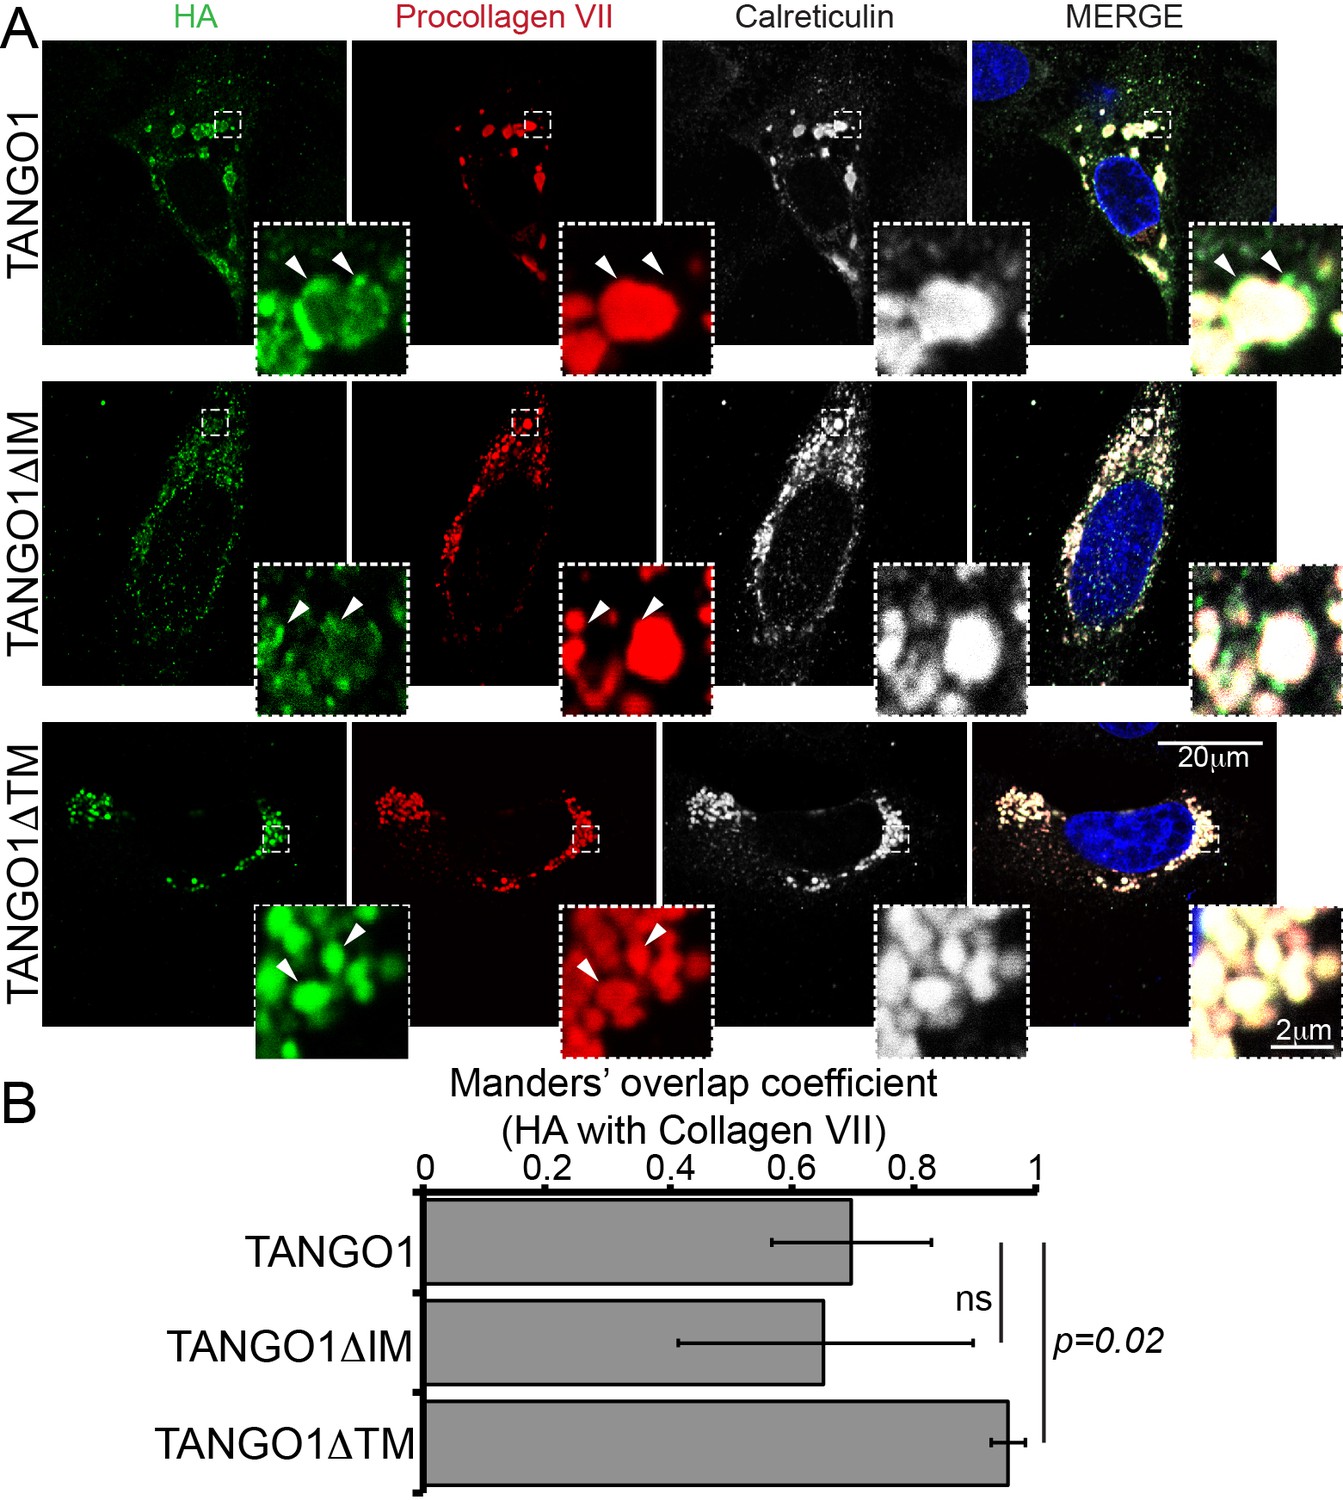
Deletion of the intramembrane has no effect on TANGO1 recruitment to collagen.
(A) TANGO1 or TANGO1ΔIM (green) form distinct puncta at procollagen VII (red) accumulations in the ER (ER marker calreticulin in white). TANGO1 lacking a transmembrane domain (TANGO1ΔTM) does not form ERES puncta at procollagen VII accumulations; instead it uniformly coats the collagen. Arrowheads indicate representative features in each channel. Scale bar: 20 μm, Inset: 2 μm. (B) Plot of the Manders’ colocalization coefficients of the extent of overlap of HA (TANGO1 constructs) with procollagen VII. ns: not significant, p<0.02 by Student’s t test.
Figure 4 with 1 supplement
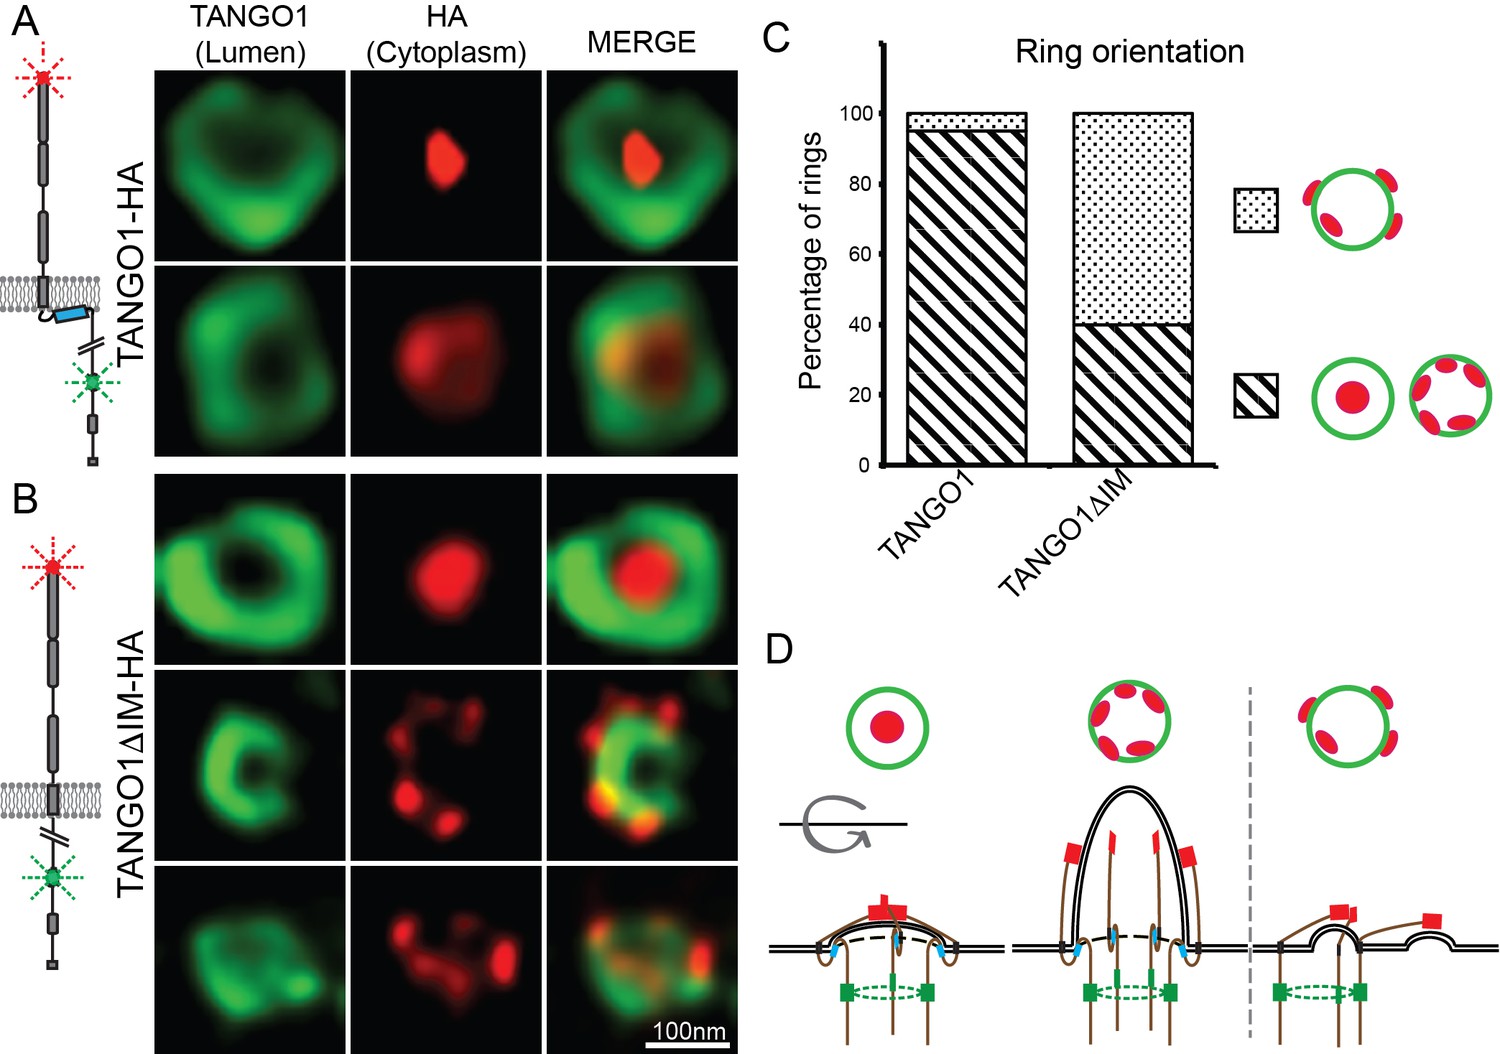
TANGO1 intramembrane helix orients a ring of TANGO1 molecules.
Two different epitopes on TANGO1 are visualised concomitantly. The ER-lumenal epitope in green, the c-terminal HA epitope in red (A) TANGO1, (B) TANGO1ΔIM. (C) Quantification of the number of rings observed in each configuration. Regions with diagonal bars refer to rings with HA signal (red) contained within the lumenal signal (green), while the dotted region refers to rings with at least some HA signal (red) contained outside, but apposed to, the lumenal signal (green). (D) Schematic model of the different configurations of TANGO1 molecules in a ring.
Figure 4—figure supplement 1

Targeted disruption of the intramembrane helix, replacing two phenylalanines with arginines (TANGO1-FMF-RMR), mimics the effect of deleting the helix entirely.
(A) TANGO1 Lumenal epitope (green), when visualised as a ring could have the C-terminal HA epitope (red) randomly oriented with respect to the ring, or encircled entirely within the ring. (B) Quantification of the number of rings observed in each configuration. Regions with diagonal bars refer to rings with HA signal (red) contained entirely within the lumenal signal (green), while the dotted region refers to rings with at least some HA signal (red) contained outside, but apposed to, the lumenal signal (green).
Figure 5
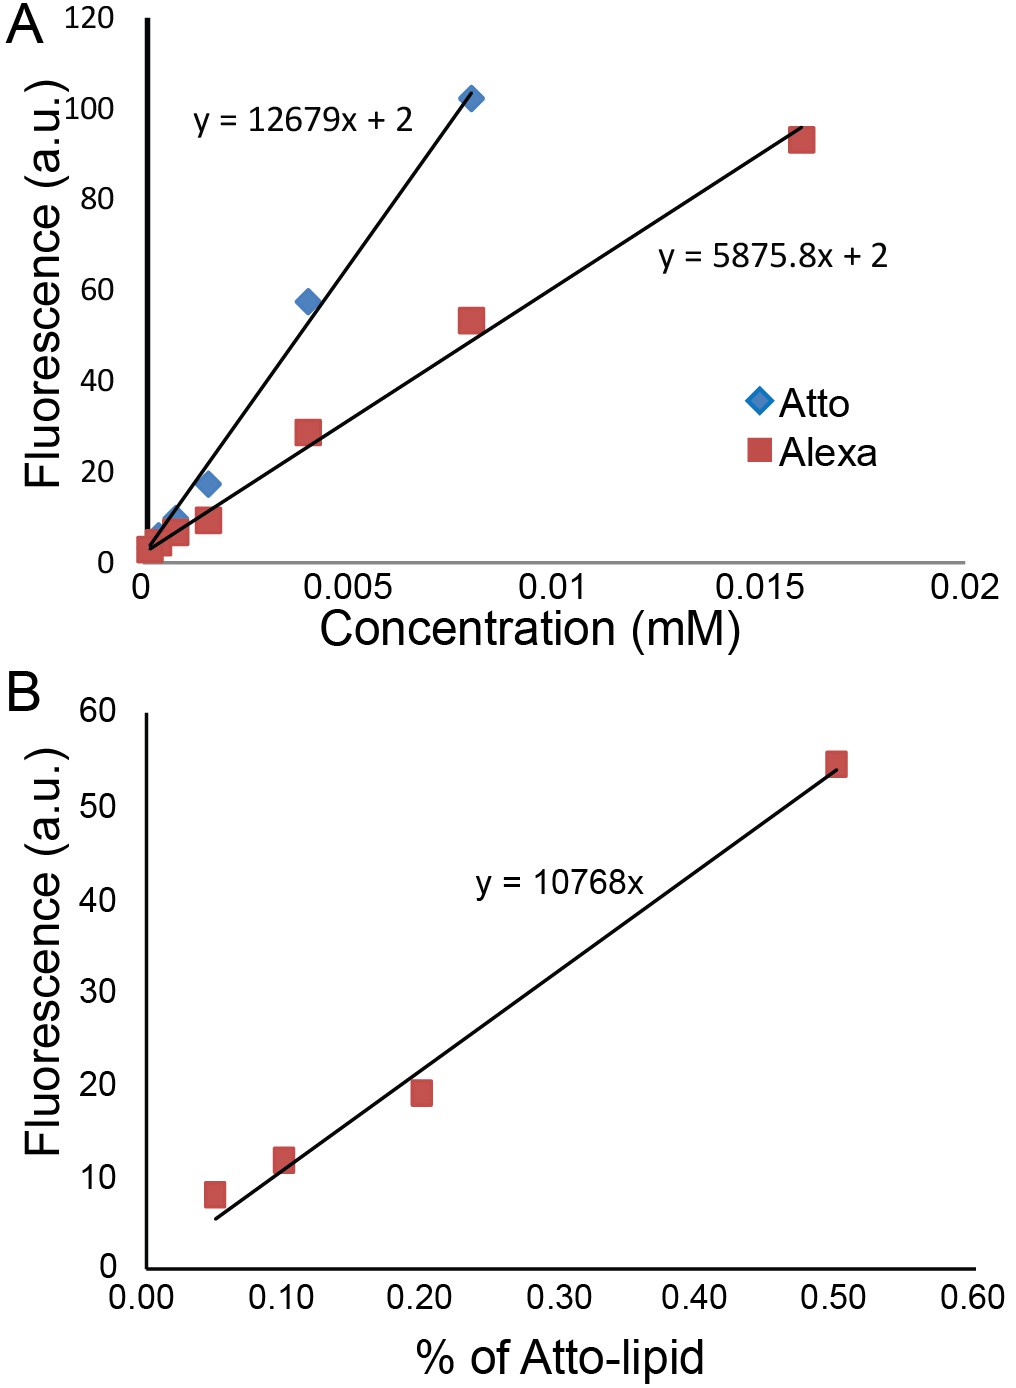
Quantification of protein concentration.
(A) Alexa488 and Atto488 intensities in solution at different concentrations. (B) Atto488 lipid intensity increases linearly with concentration.
Figure 6
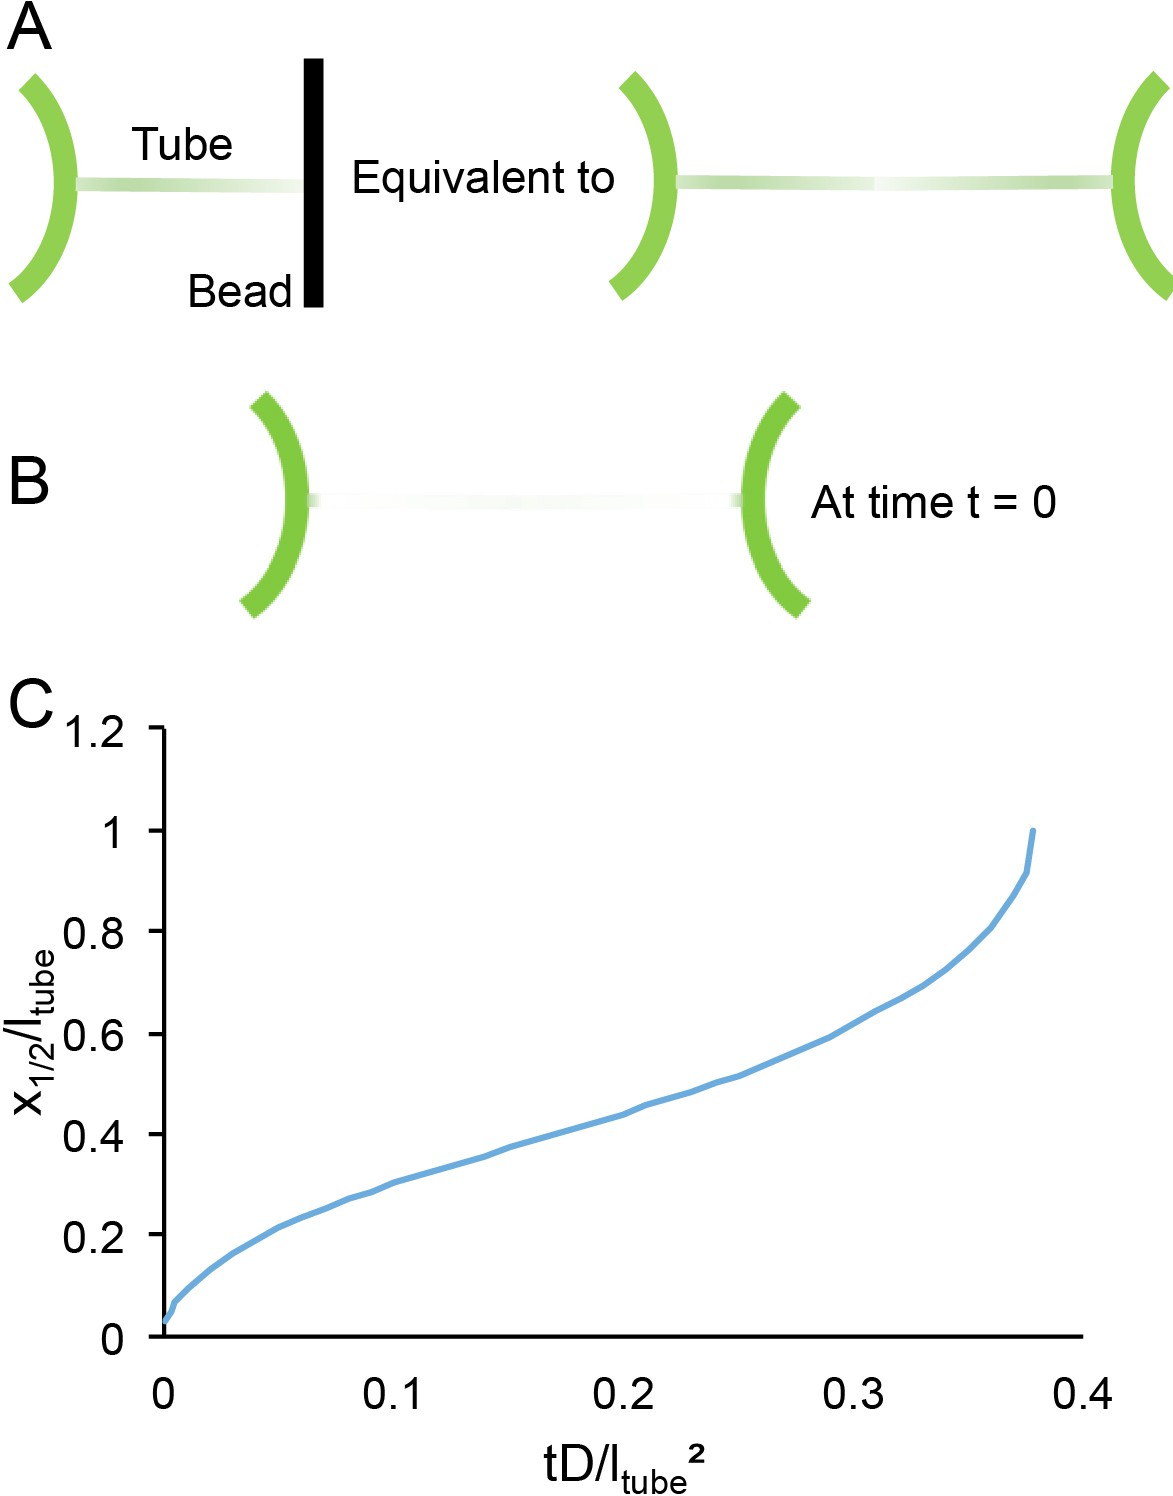
Time scales of lipid diffusion in the GUV-tube system.
(A) Schematic of the system. (B) Schematic of system under boundary conditions at time t = 0. (C) Kinetics of recovery.
Additional files
Download links
A two-part list of links to download the article, or parts of the article, in various formats.
Downloads (link to download the article as PDF)
Open citations (links to open the citations from this article in various online reference manager services)
Cite this article (links to download the citations from this article in formats compatible with various reference manager tools)
TANGO1 membrane helices create a lipid diffusion barrier at curved membranes
eLife 9:e57822.
https://doi.org/10.7554/eLife.57822


