A Drosophila screen identifies NKCC1 as a modifier of NGLY1 deficiency
- Department of Human Genetics, University of Utah School of Medicine, United States
- Department of Internal Medicine, Division of Nephrology and Hypertension, and Molecular Medicine Program, University of Utah, United States
- Department of Computational and Systems Biology, University of Pittsburgh, United States
- Genetic Resource Science, The Jackson Laboratory, United States
- Medical Service, Veterans Affairs Salt Lake City Health Care System, United States
Figures
Figure 1 with 1 supplement
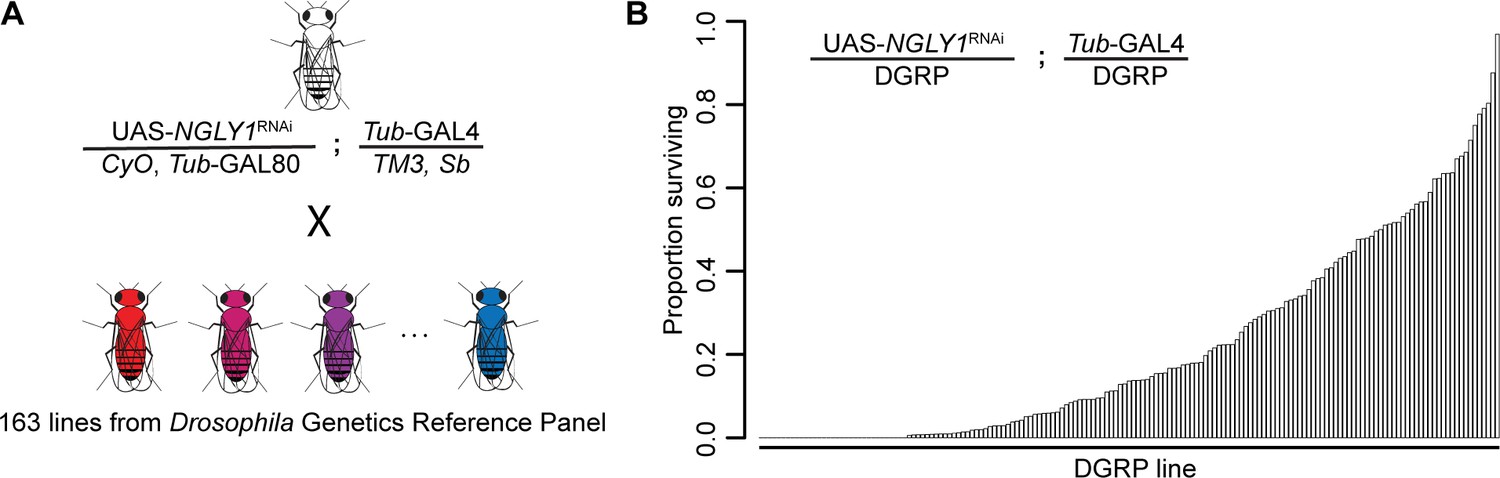
Lethality phenotype of NGLY1 knockdown is highly modifiable by strain background.
(A) Drosophila cross for NGLY1 knockdown in each Drosophila genetic reference panel (DGRP) strain. (B) Proportion of NGLY1 knockdown flies surviving for each cross was calculated based on the number eclosing compared to the expected number. Expected number was based on the largest control balancer class for each cross.
Figure 1—figure supplement 1
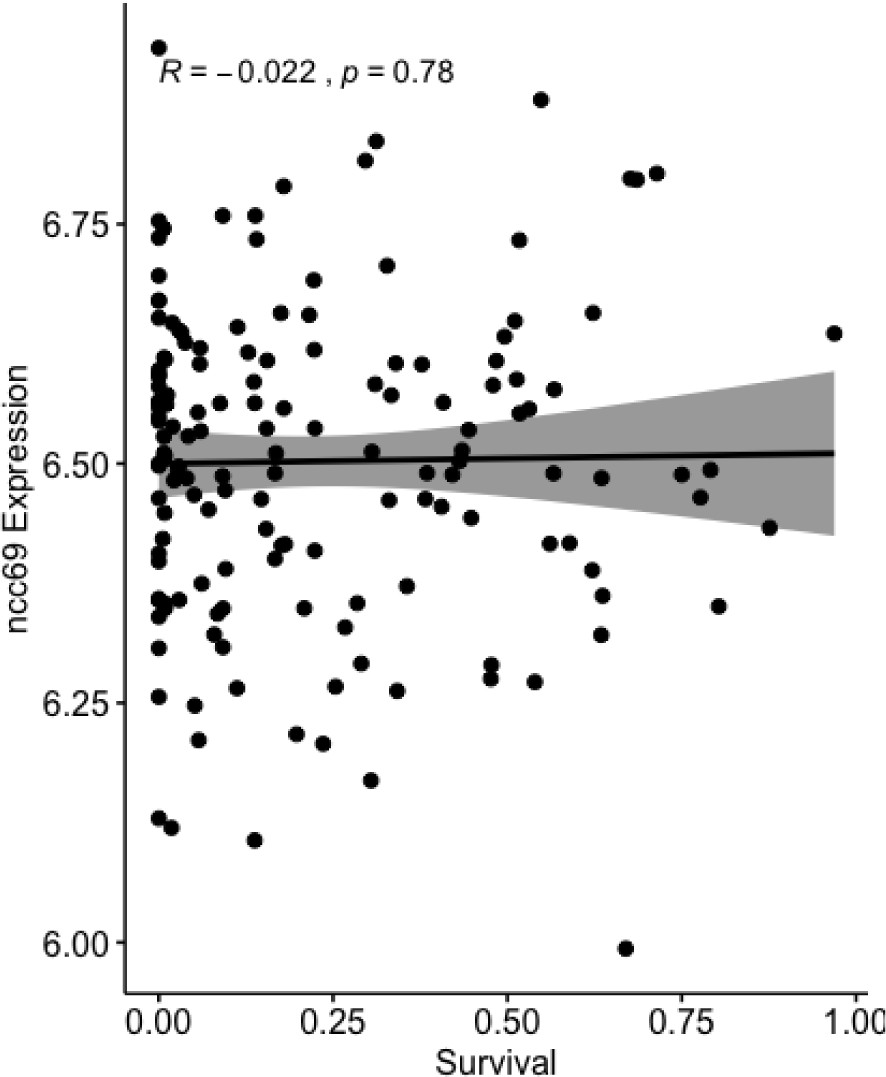
Ncc69 expression is not correlated with survival.
Survival upon knockdown of NGLY1 was plotted versus baseline expression levels of Ncc69 in the DGRP (r = −0.022, N = 154, p=0.78). DGRP gene expression data was taken from Huang et al., 2014.
Figure 2 with 1 supplement

Gene set enrichment analysis.
Top significant ontological categories identified by GSEA. p-values are indicated by red-to-blue gradient, with red the lowest p-values and blue the highest p-values. Gene number identified in each category is indicated by the size of the circle.
Figure 2—figure supplement 1
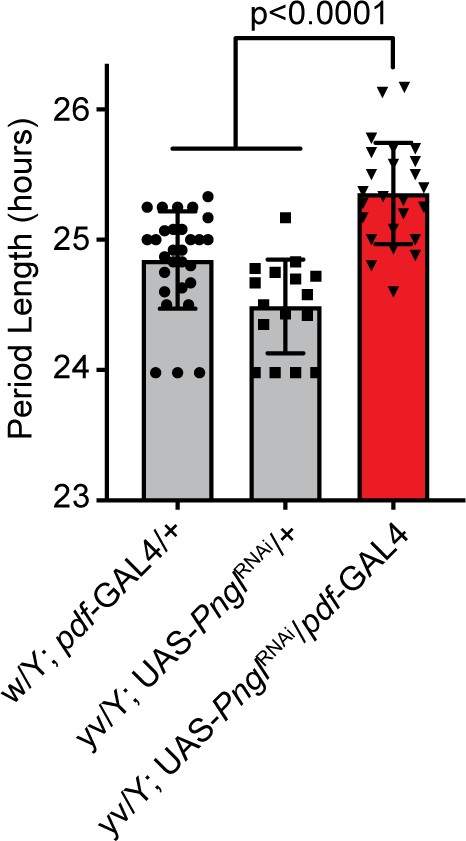
NGLY1 knockdown causes circadian rhythm defect.
Activity monitor was used to analyze 2- to 5-day-old flies for 1 week in complete darkness after 3 days of entrainment in a 12 hr light, dark cycle. At least 15 flies were analyzed for each genotype. Period length was calculated from activity using ClockLab. One-way ANOVA gave an overall p<0.0001. Subsequently Tukey’s test was used to calculate individual adjusted p-values between genotypes shown on the graph.
Figure 3

NGLY1 and Ncc69 interact genetically in Drosophila.
(A) Proportion of flies surviving to eclosion in ubiquitous knockdowns. NGLY1 knockdown (KD) are UAS-PnglRNAi/+; Tubulin-GAL4/+. Ncc69 KD are UAS-Ncc69RNAi/+; Tubulin-GAL4/+. NGLY1 Ncc69 double knockdown (DKD) are UAS-PnglRNAi/+ UAS-Ncc69RNAi/Tubulin-GAL4/+. Four separate matings were performed for each cross with at least 40 offspring generated for the balancer control for each. Fraction surviving is calculated compared to balancer offspring. Chi-square analysis was performed for the total number of flies compared to expected Mendelian numbers. NGLY1 KD χ2 = 109.7, p<0.0001; Ncc69 KD χ2 = 1.002, p=0.3168, and NGLY1 Ncc69 DKD χ2 = 186, p<0.0001. (B) Bang sensitivity assay to assess seizures in glial knockdown flies. WT flies are attP2 and attP40. NGLY1 KD are UAS-PnglRNAi/+; repo-GAL4/+. Ncc69 KD are UAS-Ncc69RNAi/+; repo-GAL4/+. NGLY1 Ncc69 DKD are UAS-PnglRNAi/+; UAS-Ncc69RNAi/ repo-GAL4. For each genotype, at least 45 4- to 7-day-old females were used to calculate the percent seizing at a given time after vortexing. Repeated measures ANOVA p-value=0.000176.
Figure 4 with 1 supplement
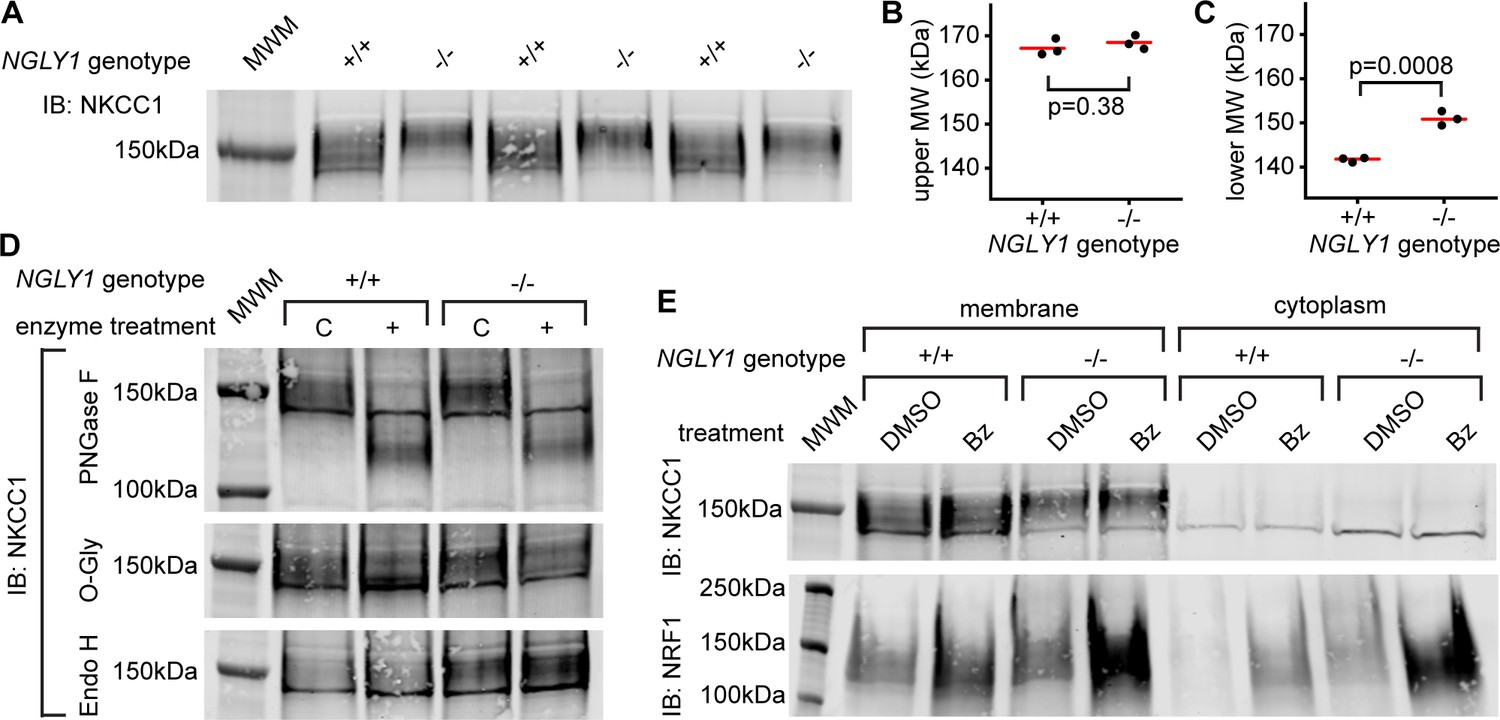
Endogenous NKCC1 is altered in NGLY1-deficient MEFs.
(A) Control (+/+) and NGLY1 null (-/-) MEFs were grown to confluency and then lysed to isolate the membrane and cytoplasmic fractions. Three separate membrane lysates for both genotypes were analyzed by immunoblotting for NKCC1 compared to a molecular weight marker (MWM). Blot was used for molecular weight calculations of the upper-most limit (see un-cropped blot in Figure 4—figure supplement 1) (B) And the lower-most limit (C) of the protein band. Red bar represents the mean. Two-tailed t-test was used to calculate p-values. (D) Membrane lysates from MEFs were treated with N-Glycosidase F (PNGase F), O-Glycosidase (O-Gly), or Endoglycosidase H (Endo H) for 1 hr then analyzed by immunoblot. Control (C)Samples were treated in all the same conditions but without the added enzyme. (E) MEFs were treated with 500 nM bortezomib (Bz) or equal volume of vehicle control (DMSO) for 4 hr then lysed to collect membrane and cytoplasmic fractions. Lysates were analyzed by immunoblotting for NKCC1. NRF1 was analyzed as a positive control of proteasome inhibition. Dark band at about 140 kDa in both (A), (D), and (E) is believed to be non-specific.
Figure 4—figure supplement 1
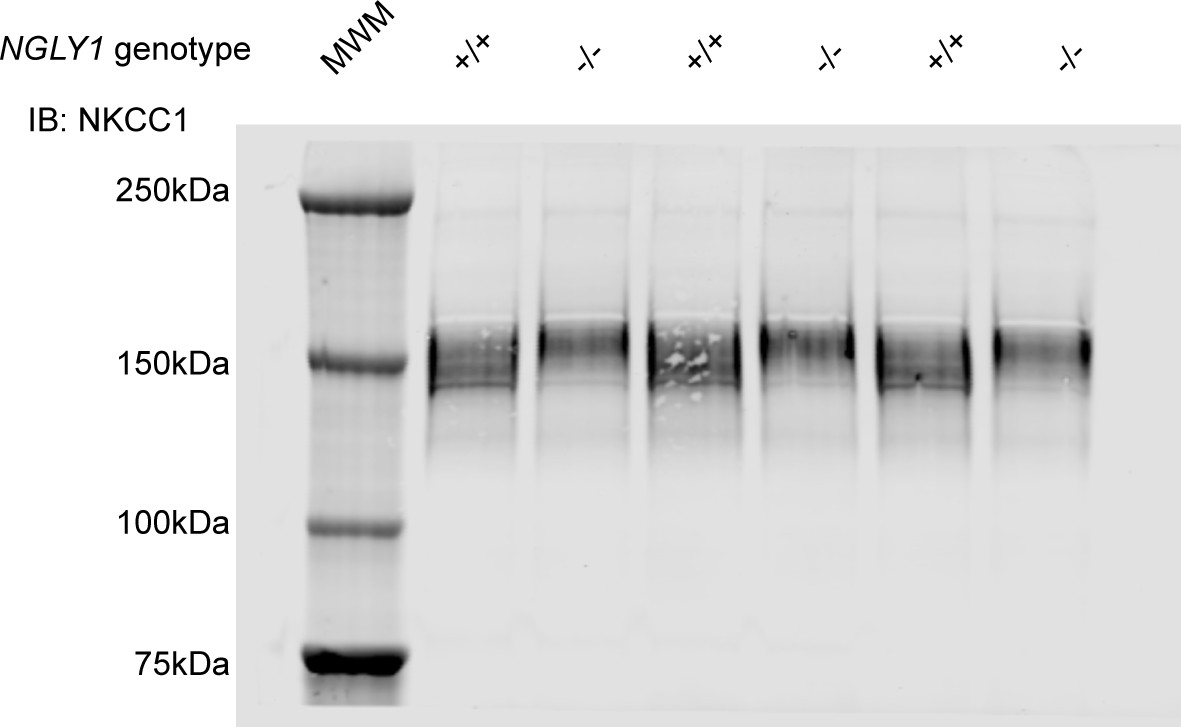
Full western blot of NKCC1 in NGLY1 +/+ and -/- MEFs.
Tris-acetate gel was run at 150V for 2.5 hr to sufficiently distinguish between the different molecular weights of NKCC1, and therefore the 75 kDa band of the protein marker was the bottom-most band. The 250, 150, 100, and 75 kDa molecular weights were used for a standard curve in the Li-cor software Image Studio, so that the molecular weight of the NKCC1 bands could be calculated.
Figure 5 with 1 supplement
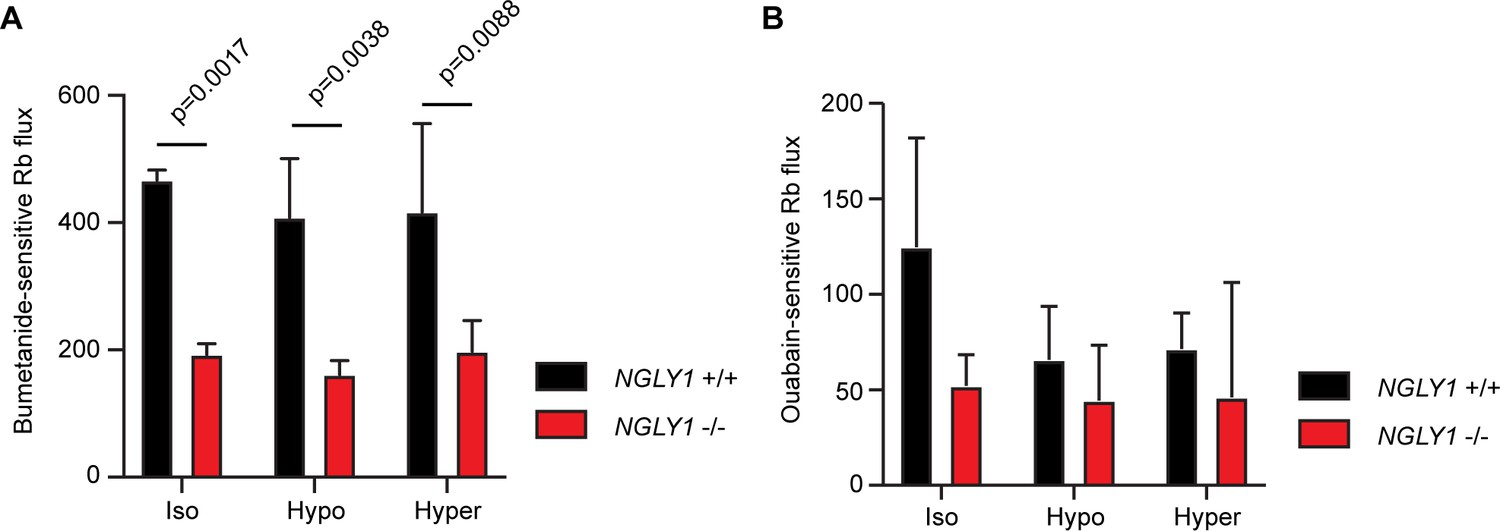
NGLY1 -/- MEFs show decreased NKCC1-specific ion flux.
(A) Bumetanide-sensitive 86Rb flux was measured in NGLY1 +/+ and NGLY1 -/- MEFs to measure NKCC1 activity. Flux was examined in three bath conditions, isotonic (iso), hypotonic (hypo), and hypertonic (hyper). There was a significant effect of genotype (p<0.0001) in two-way ANOVA, with no significant effect of condition (p=0.5756) or interaction (p=0.8075). Adjusted p-values for Sidak’s multiple comparisons test between NGLY1 +/+ and NGLY1 -/- are shown in the figure. (B) Ouabain-sensitive 86Rb flux was measured in NGLY1 +/+ and NGLY1 -/- MEFs to measure Na+/K+-ATPase activity in the same three conditions as in A. There were no significant effects of genotype (p=0.0516), condition (p=0.3047) or interaction (p=0.4711) by two-way ANOVA, indicating the NGLY1 knockout has a specific effect on NKCC1 activity without affecting Na+/K+-ATPase activity.
Figure 5—figure supplement 1
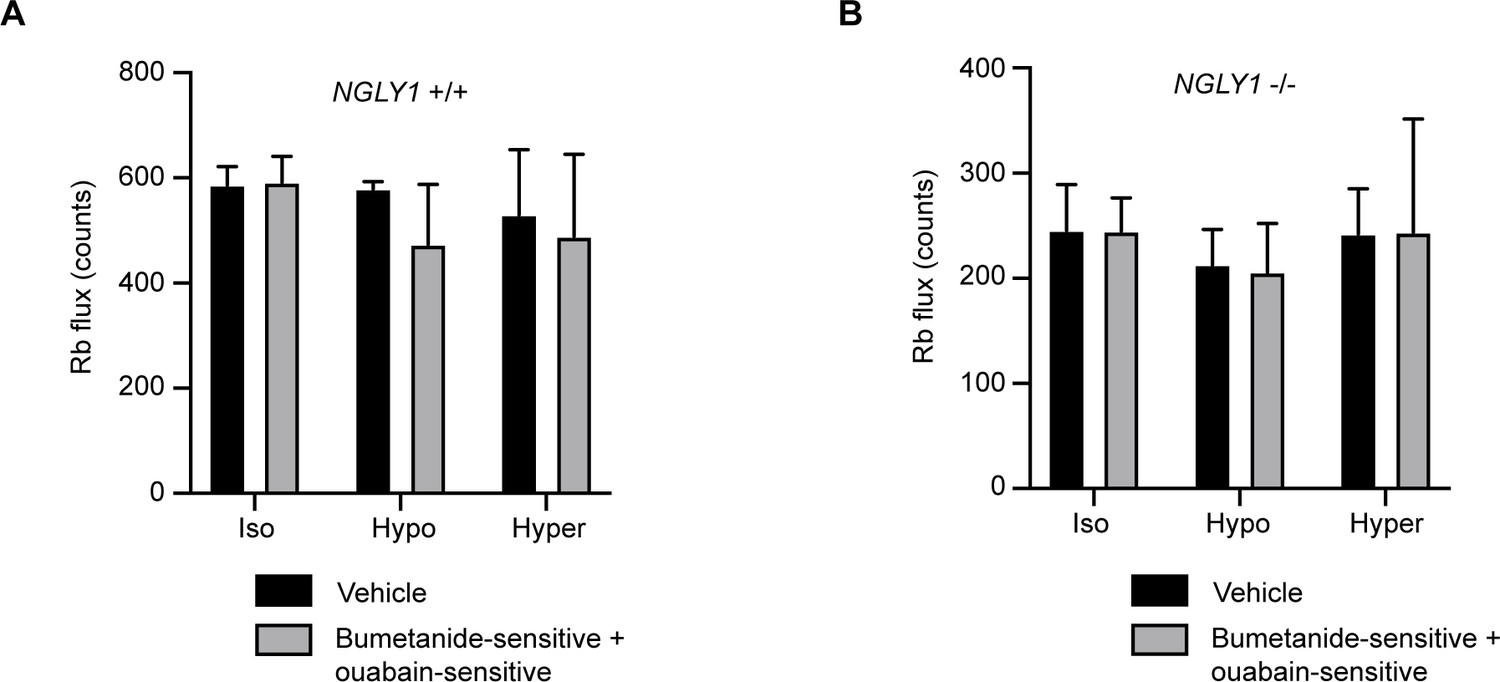
86Rb uptake in MEFs occurs through bumetanide-sensitive and ouabain-sensitive pathways.
Either NGLY1 +/+ (A) or NGLY1 -/- (B) MEFs were incubated with DMSO as a vehicle control or with the NKCC1 inhibitor, bumetanide, or the Na+/K+-ATPase inhibitor, ouabain. 86Rb flux was measured in three conditions: isotonic (iso), hypotonic (hypo), and hypertonic (hyper). The sum of bumetanide-sensitive and ouabain-sensitive flux was compared to vehicle control. There were no significant effects of genotype (p=0.3267), condition (p=0.3602) or an interaction (p=0.6244) in NGLY1 +/+ cells, nor of genotype (p=0.9422), condition (p=0.4987) or an interaction (p=0.9909) in NGLY1 -/- cells by two-way ANOVA, indicating that in both cell types 86Rb flux was comprised of the bumetanide-sensitive and ouabain-sensitive activities.
Author response image 1

Tables
Table 1
Candidate modifier genes identified from GWA.
Rank order of candidate genes was established based on the most significant associated SNP in the respective gene.
| Rank order | Gene | FBgn | Human ortholog | Periphery/membrane | Proteostasis |
|---|---|---|---|---|---|
| 1 | exp | FBgn0033668 | --- | no | no |
| 2 | Ncc69 | FBgn0036279 | NKCC1/2 | yes | no |
| 3 | CG5888 | FBgn0028523 | --- | yes | no |
| 4 | CG16898 | FBgn0034480 | --- | no | no |
| 5 | bru3 | FBgn0264001 | CELF2/3/4/5/6 | no | no |
| 6 | CG31690 | FBgn0051690 | TMTC2 | no | yes |
| 7 | CG7227 | FBgn0031970 | SCARB1 | no | no |
| 8 | CR44997 | FBgn0266348 | --- | no | no |
| 9 | rgn | FBgn0261258 | Many | no | no |
| 10 | M6 | FBgn0037092 | GPM6A | yes | no |
| 11 | Rab26 | FBgn0086913 | RAB26 | yes | yes |
| 12 | Obp56i | FBgn0043532 | --- | no | no |
| 13 | 5-HT1A | FBgn0004168 | HTR1A | yes | no |
| 14 | CG33012 | FBgn0053012 | ERMP1 | no | yes |
| 15 | rst | FBgn0003285 | --- | yes | no |
| 16 | CR43926 | FBgn0264547 | --- | no | no |
| 17 | CG7337 | FBgn0031374 | WDR62 | no | no |
| 18 | hiw | FBgn0030600 | MYCBP2 | yes | yes |
| 19 | fid | FBgn0259146 | TRMT9B | no | no |
| 20 | nmo | FBgn0011817 | NLK | no | no |
| 21 | Sirup | FBgn0031971 | SDHAF4 | no | no |
| 22 | tst | FBgn0039117 | SKIV2L | no | no |
| 23 | Mdr50 | FBgn0010241 | many | yes | no |
| 24 | Cpr49Aa | FBgn0050045 | --- | no | no |
| 25 | COX7C | FBgn0040773 | COX7C | no | no |
| 26 | Eip63E | FBgn0005640 | CDK14/15 | yes | no |
| 27 | CG30048 | FBgn0050048 | PKD1 | no | no |
| 28 | CG15040 | FBgn0030940 | --- | no | no |
| 29 | SP2353 | FBgn0034070 | EGFLAM | no | no |
| 30 | Mf | FBgn0038294 | --- | no | no |
| 31 | ome | FBgn0259175 | many | no | no |
| 32 | esn | FBgn0263934 | PRICKLE1-3 | no | no |
| 33 | haf | FBgn0261509 | many | no | no |
| 34 | dally | FBgn0263930 | GPC3/5 | yes | no |
| 35 | robo2 | FBgn0002543 | ROBO1/2/3/4 | no | no |
| 36 | Gyc32E | FBgn0010197 | NPR1/2 | yes | no |
| 37 | CG8170 | FBgn0033365 | many | no | no |
| 38 | CG8405 | FBgn0034071 | TMEM259 | no | yes |
| 39 | scaf | FBgn0033033 | --- | yes | no |
| 40 | borr | FBgn0032105 | CDCA8 | yes | no |
| 41 | Syx7 | FBgn0267849 | STX7/12 | yes | no |
| 42 | DIP-delta | FBgn0085420 | many | yes | no |
| 43 | cv-c | FBgn0285955 | DLC1 | yes | no |
| 44 | Snmp2 | FBgn0035815 | CD36/SCARB1 | no | no |
| 45 | Mer | FBgn0086384 | NF2 | yes | no |
| 46 | sba | FBgn0016754 | --- | no | no |
| 47 | Hsromega | FBgn0001234 | --- | no | yes |
| 48 | CCAP-R | FBgn0039396 | NPSR1 | yes | no |
| 49 | Hrd3 | FBgn0028475 | SEL1L | no | yes |
| 50 | blue | FBgn0283709 | NEURL4 | no | yes |
| 51 | CG6262 | FBgn0034121 | TREH | no | no |
| 52 | CG45186 | FBgn0266696 | SVIL | no | no |
| 53 | Spn | FBgn0010905 | PPP1R9A | yes | no |
| 54 | dnc | FBgn0000479 | PDE4A/B/C/D | no | no |
| 55 | CG4374 | FBgn0039078 | many | no | no |
| 56 | sff | FBgn0036544 | many | no | yes |
| 57 | CG42383 | FBgn0259729 | NSFL1C | no | yes |
| 58 | Dyb | FBgn0033739 | DTNB | yes | no |
| 59 | CG34371 | FBgn0085400 | --- | no | no |
| 60 | CG4341 | FBgn0028481 | TMTC2 | no | yes |
| 61 | CG30043 | FBgn0050043 | ERMP1 | no | yes |
Key resources table
| Reagent type (species) or resource | Designation | Source or reference | Identifiers | Additional information |
|---|---|---|---|---|
| Gene (Drosophila melanogaster) | Pngl | GenBank | ID:35527 Dmel_CG7865 | |
| Gene (Drosophila melanogaster) | Ncc69 | GenBank | ID: 39410 Dmel_CG4357 | |
| Gene (Mus musculus) | NGLY1 | GenBank | ID: 59007 | |
| Gene (Mus musculus) | NKCC1 | GenBank | ID: 20496 | Slc12a2 |
| Genetic reagent (Drosophila melanogaster) | Pngl-RNAi | Bloomington Drosophila Stock Center | RRID:BDSC_54853 | y1 v1; P{y+t7.7 v+t1.8=TRiP.HMJ21590}attP40 |
| Genetic reagent (Drosophila melanogaster) | Tubulin-GAL4 | Bloomington Drosophila Stock Center | RRID:BDSC_5138 | y1 w*; P{w+mC = tubP-GAL4}LL7/TM3, Sb1 Ser1 |
| Genetic reagent (Drosophila melanogaster) | Tubulin-GAL80 | Bloomington Drosophila Stock Center | RRID:BDSC_5190 | y1 w[*]; P{w[+mC]=tubP-GAL80}LL9 P{w[+mW.hs]=FRT(w[hs])}2A/TM3, Sb1 |
| Genetic reagent (Drosophila melanogaster) | Drosophila Genetics Reference Panel | Bloomington Drosophila Stock Center | Set of 194 strains, example strain: BDSC:55014, RRID:BDSC_55014 | |
| Genetic reagent (Drosophila melanogaster) | Pdf-GAL4 | Bloomington Drosophila Stock Center | RRID:BDSC_6899 | P{w[+mC]=Pdf-GAL4.P2.4}X, y1 w[*] |
| Genetic reagent (Drosophila melanogaster) | UAS-Pngl-RNAi | Bloomington Drosophila Stock Center | RRID:BDSC_42592 | y1 sc* v1 sev21; P{y+t7.7 v+t1.8=TRiP.HMS02424}attP40 |
| Genetic reagent (Drosophila melanogaster) | UAS-Ncc69-RNAi | Bloomington Drosophila Stock Center | RRID:BDSC_28682 | y1 v1; P{y+t7.7 v+t1.8=TRiP.JF03097}attP2 |
| Cell line (Mus musculus) | Mouse embryonic fibroblasts (MEF) | Jackson Labs | Primary line from mouse #027060,https://www.jax.org/strain/027060 | |
| Antibody | Anti-NKCC1 (Rabbit polyclonal) | Cell Signaling | Cat#14581, RRID:AB_2798524 | IB: 1:1000 |
| Antibody | Anti-TCF11/NRF1 (Rabbit monoclonal) | Cell Signaling | Cat#8052, RRID:AB_11178947 | IB: 1:1000 |
| Antibody | IRDye 800CW Goat-anti-rabbit | Abcam | Cat#216773 | IB: 1:10,000 |
| Commercial assay or kit | Cell Fractionation Kit | Cell Signaling | Cat#9038 | |
| Chemical compound, drug | Bortezomib | EMD Millipore | Cat# 179324-69-7 | |
| Software, algorithm | Genome Wide Association | Chow et al., 2016 | ||
| Software, algorithm | Gene Set Enrichment Analysis | Subramanian et al., 2005 | ||
| Software, algorithm | Evolution Rate Covariation | Clark et al., 2012 | ||
| Software, algorithm | R | https://www.r-project.org/ |
Additional files
-
Supplementary file 1
NGLY1 DGRP cross progeny counts.
The number of eclosed flies were scored for each resulting genotype. The ‘no marker’ column represents flies expressing the NGLY1 RNAi. The largest balanced genotype was used as ‘expected’ for percent survival.
- https://cdn.elifesciences.org/articles/57831/elife-57831-supp1-v3.xlsx
-
Supplementary file 2
GWA analysis for survival in NGLY1 DGRP screen.
Single-nucleotide polymorphisms (SNPs) are listed by chromosome position and rs ID.
- https://cdn.elifesciences.org/articles/57831/elife-57831-supp2-v3.zip
-
Supplementary file 3
Top associated SNPs.
The top 125 variants. SNPs are listed in rank order of significance.
- https://cdn.elifesciences.org/articles/57831/elife-57831-supp3-v3.xlsx
-
Supplementary file 4
Gene set enrichment analysis (GSEA).
Gene Ontology (GO) terms are listed by rank significance. Individual genes within each category are listed with the FBgn#.
- https://cdn.elifesciences.org/articles/57831/elife-57831-supp4-v3.xlsx
-
Supplementary file 5
Evolutionary rate covariance (ERC).
Co-evolving genes are listed by rank significance (sumnlogpvbest). Genes that are known to cause a Congenital Disorder of Glycosylation (CDG) are highlighted in red.
- https://cdn.elifesciences.org/articles/57831/elife-57831-supp5-v3.xlsx
-
Transparent reporting form
- https://cdn.elifesciences.org/articles/57831/elife-57831-transrepform-v3.docx
Download links
A two-part list of links to download the article, or parts of the article, in various formats.
Downloads (link to download the article as PDF)
Open citations (links to open the citations from this article in various online reference manager services)
Cite this article (links to download the citations from this article in formats compatible with various reference manager tools)
A Drosophila screen identifies NKCC1 as a modifier of NGLY1 deficiency
eLife 9:e57831.
https://doi.org/10.7554/eLife.57831


