The architecture of EMC reveals a path for membrane protein insertion
- MRC Laboratory of Molecular Biology, United Kingdom
- Diamond Light Source, United Kingdom
- Department of Biochemistry and Molecular Biology, The University of Chicago, United States
Figures
Figure 1 with 3 supplements
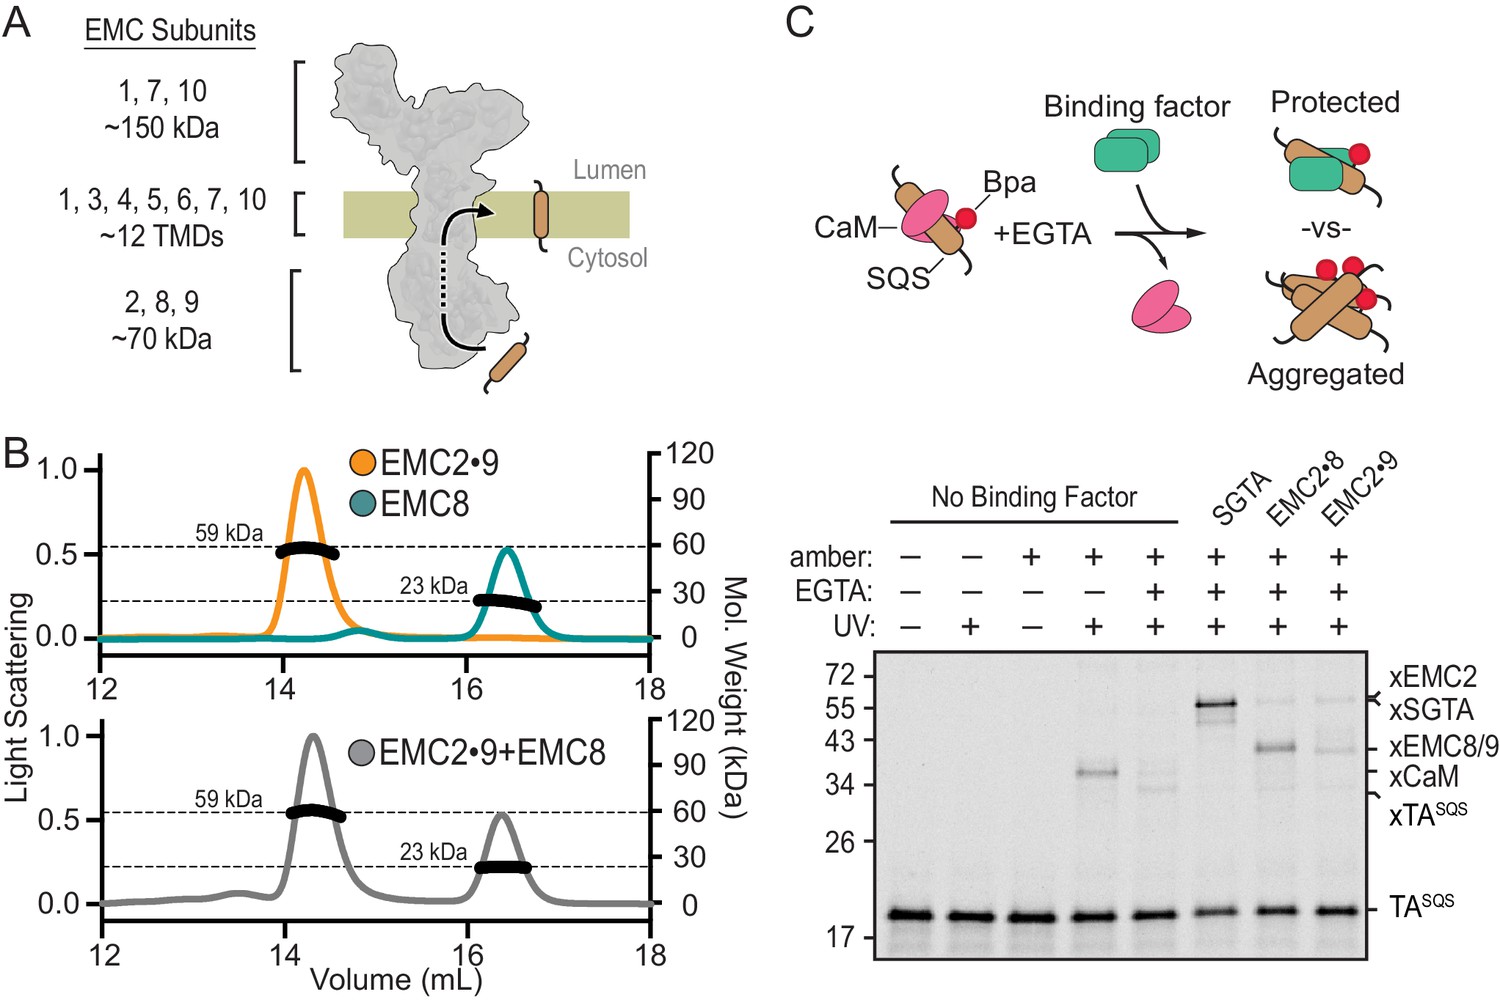
EMC2•EMC8 and EMC2•EMC9 form complexes that can bind a TMD.
(A) Diagram of predicted EMC mass distribution and subunits. (B) Size exclusion chromatography coupled to multi-angle light scattering (SEC-MALS) analysis of recombinant EMC2•EMC9 reveals a stable complex in a 1:1 ratio at the expected molecular weight of 59 kDa (orange). Recombinantly expressed EMC8 analyzed independently has a Mw of 23 kDa consistent with a monomeric state (teal). Addition of EMC8 to a pre-formed EMC2•EMC9 complex does not result in the formation of a ternary complex (grey). (C) 35S-methionine-labeled TASQS containing the benzoyl-phenylalanine (Bpa) photo-crosslinker within the TMD was produced as a defined complex with CaM using the PURE in vitro translation system. Bpa is incorporated into the TMD by amber suppression. Addition of EGTA releases CaM. The released TASQS will either aggregate or be protected from aggregation by a TMD-binding protein. The outcome can be monitored by UV-mediated crosslinking via Bpa to nearby proteins. The position of crosslinks between TASQS and various partners are indicated. No UV-mediated crosslinks are seen when TASQS does not contain an amber codon (lanes 1 and 2).
Figure 1—figure supplement 1
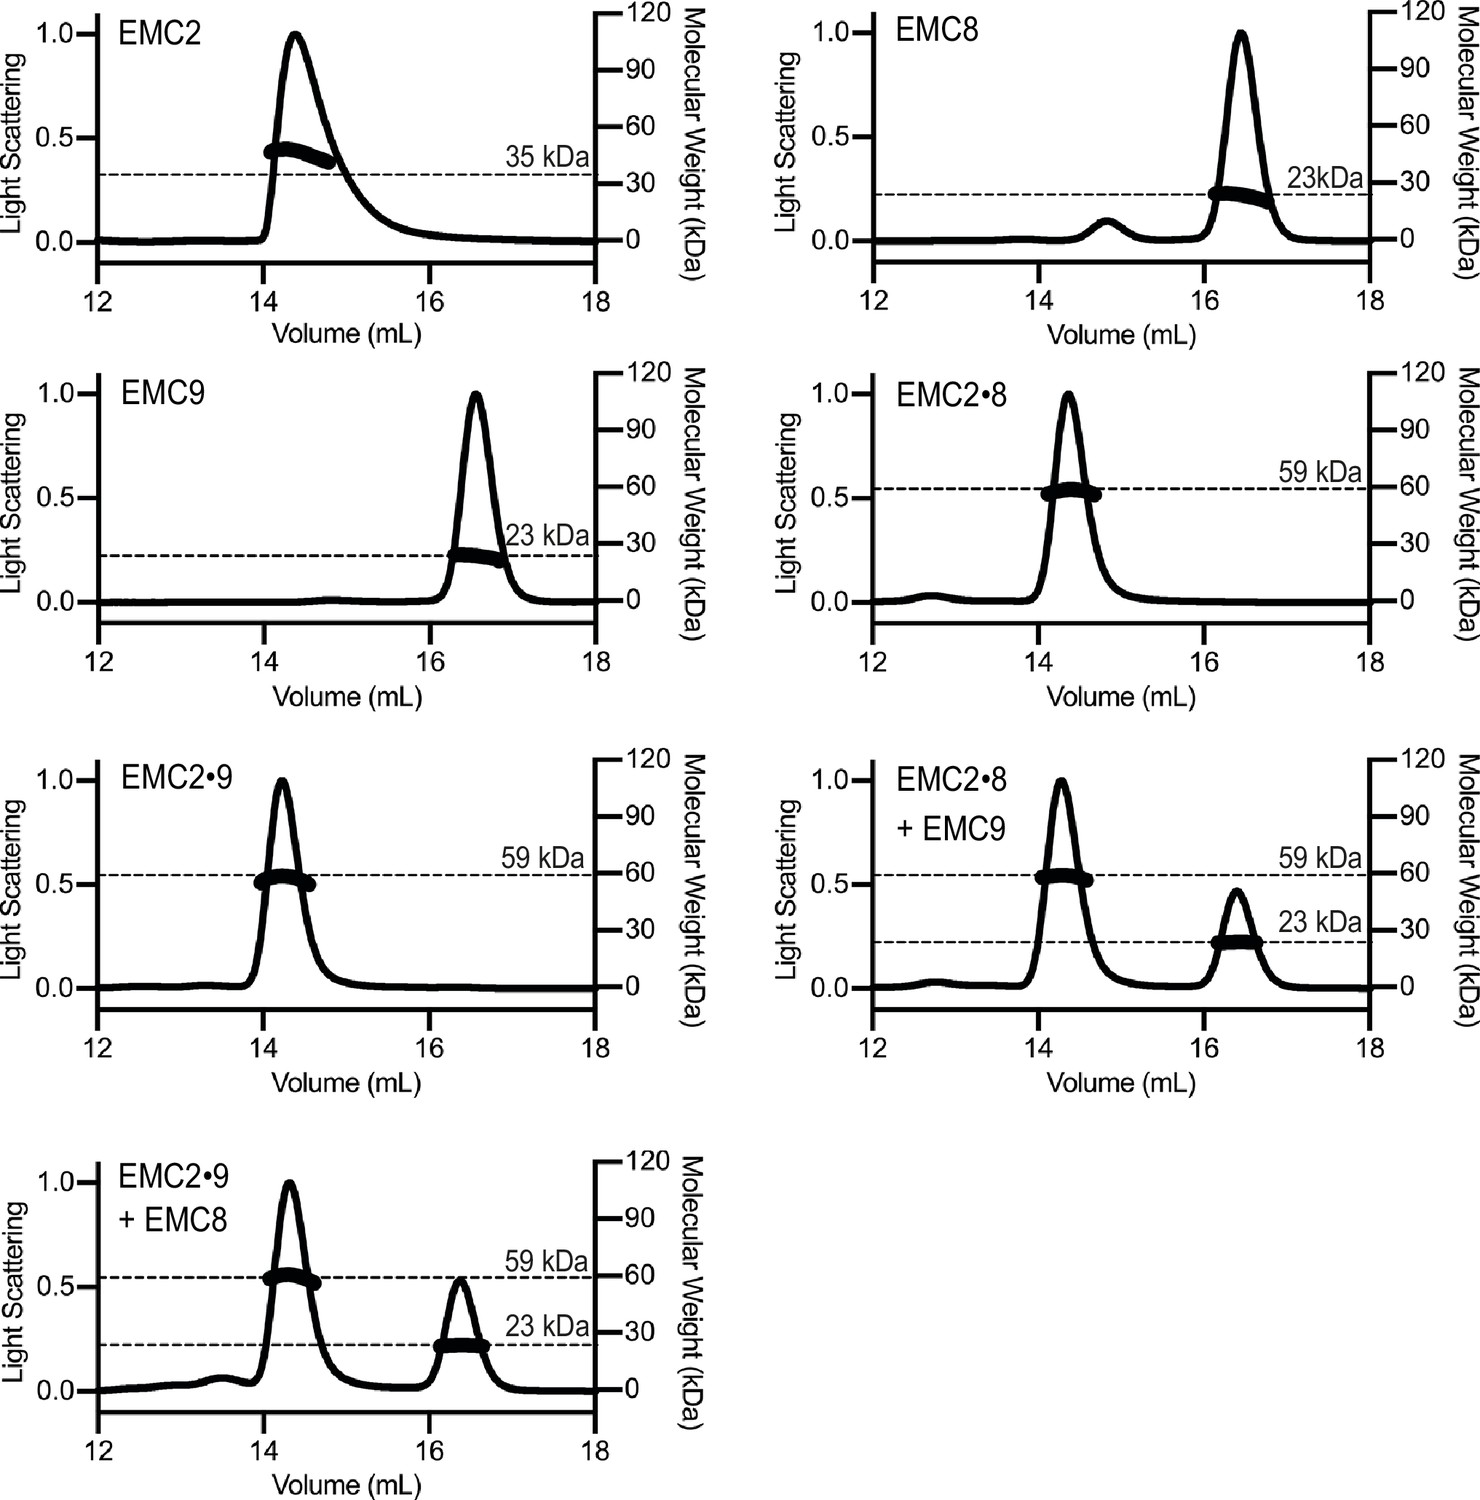
SEC-MALS of individual and complexed cytoplasmic EMC-subunits.
Size Exclusion Multi Angle Light Scattering (SEC-MALS) analysis of recombinant EMC2, EMC8 and EMC9. The signal from the 90°-scattering detector is plotted on the left y-axis as a solid line and the calculated molecular weight is plotted on the right y-axis and depicted as points across the elution peak. A dotted line notated with text indicates the theoretical molecular weight for each protein. The calculated molecular weights are consistent with those predicted for monomeric subunits and complexed subunits. Neither addition of EMC8 to a preformed EMC2•EMC9 complex nor addition of EMC9 to a pre-formed EMC2•EMC8 complex resulted in the formation of a ternary complex.
Figure 1—figure supplement 2
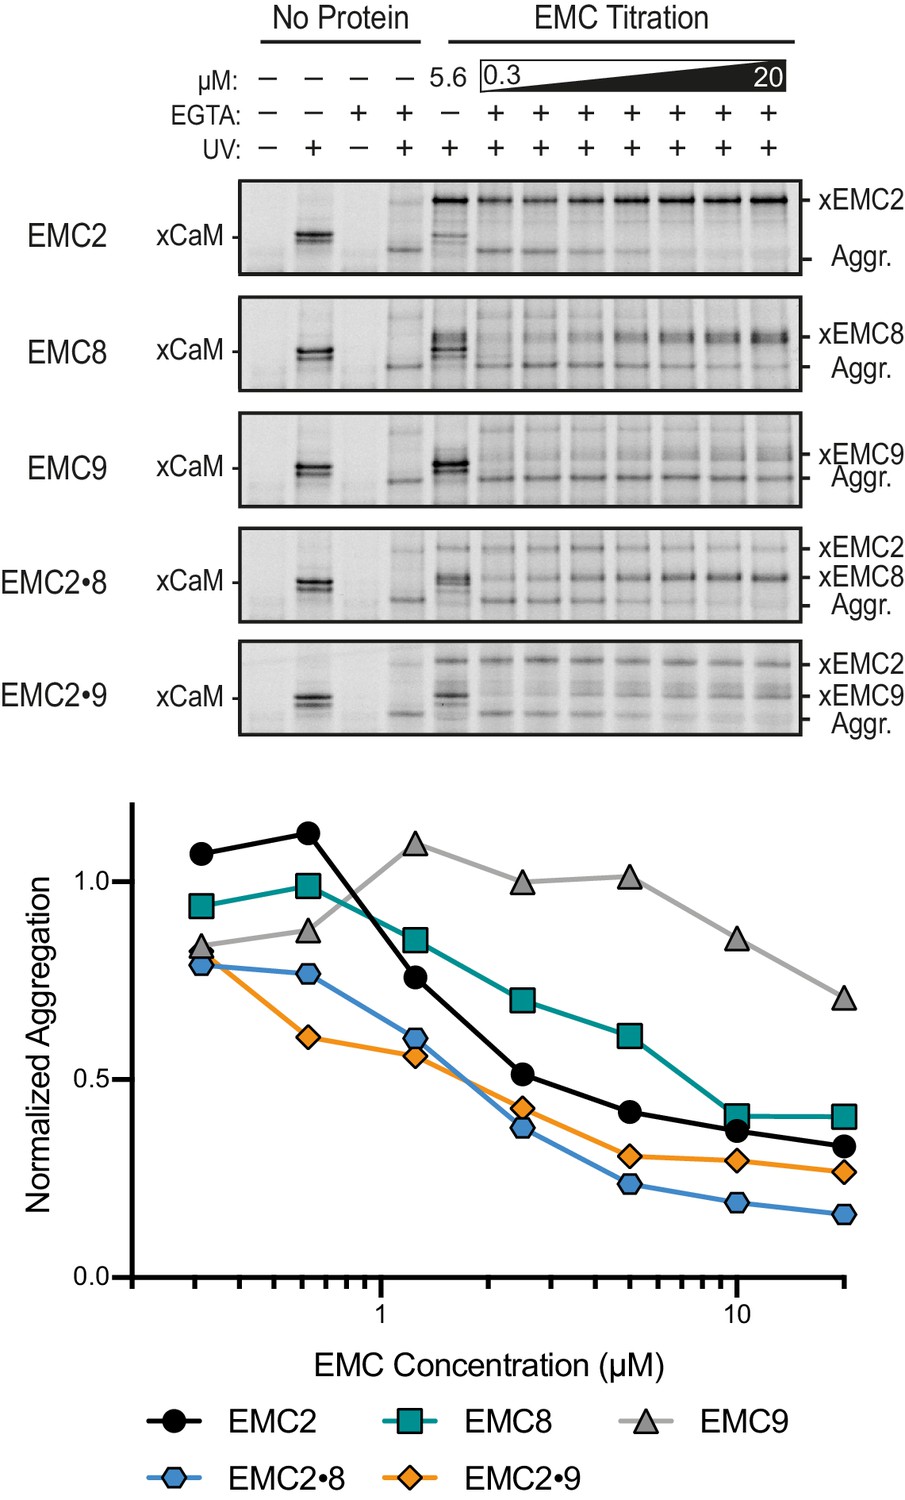
Activity of EMC cytosolic subunits in preventing TMD aggregation.
35S-methionine labeled SQS containing the benzoyl-phenylalanine (Bpa) photo-crosslinker within the TMD was prepared in complex with CaM as characterized in Figure 1C. The complex was mixed with various concentrations of different proteins (indicated on the left), treated with EGTA to release the substrate from CaM, and substrate interactions monitored by UV-mediated crosslink formation. Release from CaM in the absence of any additional protein results in UV-dependent self crosslinks indicating of aggregation (Aggr.). This aggregate product is progressively reduced to a comparable extent by the inclusion of EMC2, EMC2•EMC8, or EMC2•EMC9. By contrast, EMC9 alone is not able to reduce aggregation, while EMC8 alone has a partial effect on aggregation. Note that the crosslinking observed to EMC9 when it is added in isolation is probably due to its co-aggregation with substrate and not a protective interaction because the substrate aggregate product is not diminished appreciably. The plot below the gels quantifies the relative intensity of the aggregate band normalized to the sample without added protein.
Figure 1—figure supplement 3
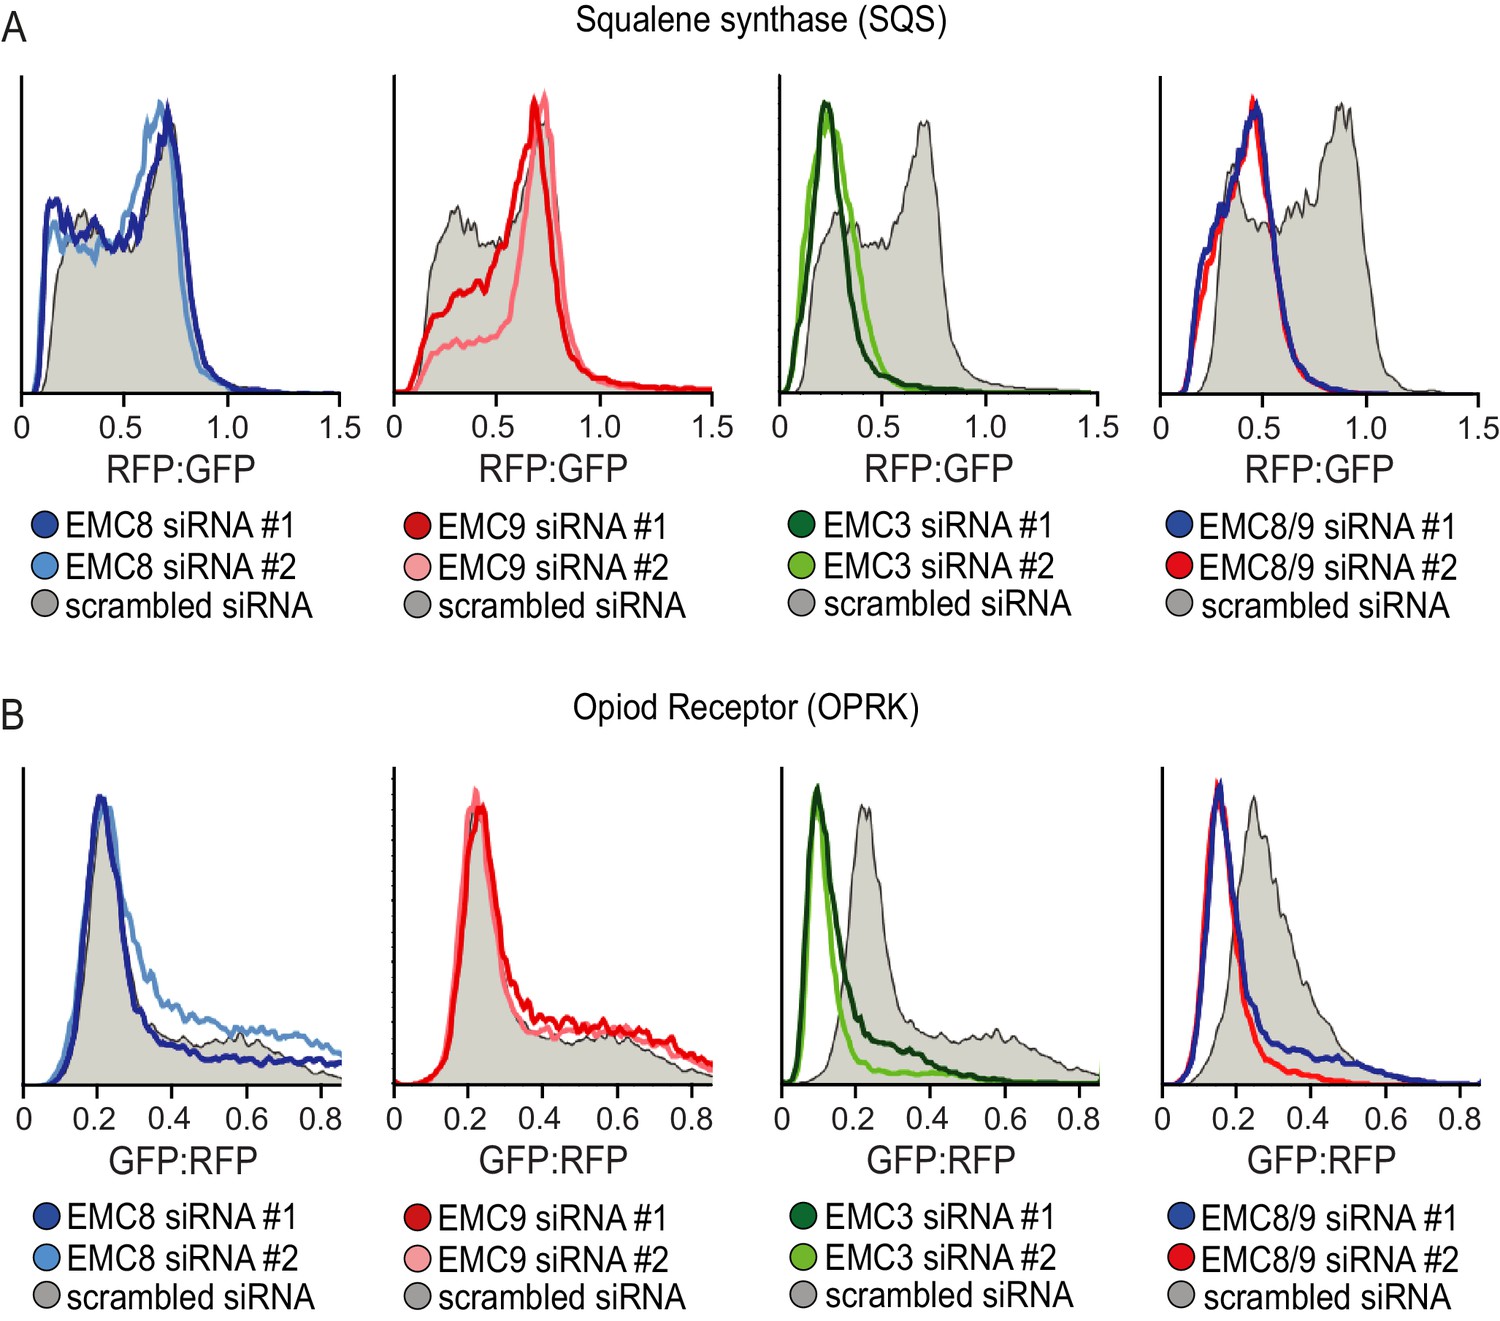
EMC8 and EMC9 necessary for membrane protein biogenesis but are functionally redundant.
(A) Flow cytometry analysis of a tail-anchored RFP-squalene synthase (RFP-SQS) substrate, relative to an internal GFP expression control. SQS is an established EMC substrate (Guna et al., 2018; Volkmar et al., 2019). Reduced biogenesis of the TMD substrate results in a shift of the histogram ratio to the left. siRNA mediated knockdown of either EMC8 or EMC9 had minimal impact on RFP-squalene synthase biogenesis compared to knockdown of the integral transmembrane component EMC3. Combined knockdown of EMC8 and EMC9 resulted in a significant defect in RFP-SQS biogenesis. (B) The same experiment as in panel A but using the mu opioid receptor (GFP-OPRK), a multi-pass membrane protein, as the substrate. Here, OPRK is GFP-tagged and RFP serves as the internal expression control. Previous studies have shown that OPRK is an EMC substrate (Chitwood et al., 2018).
Figure 2 with 2 supplements
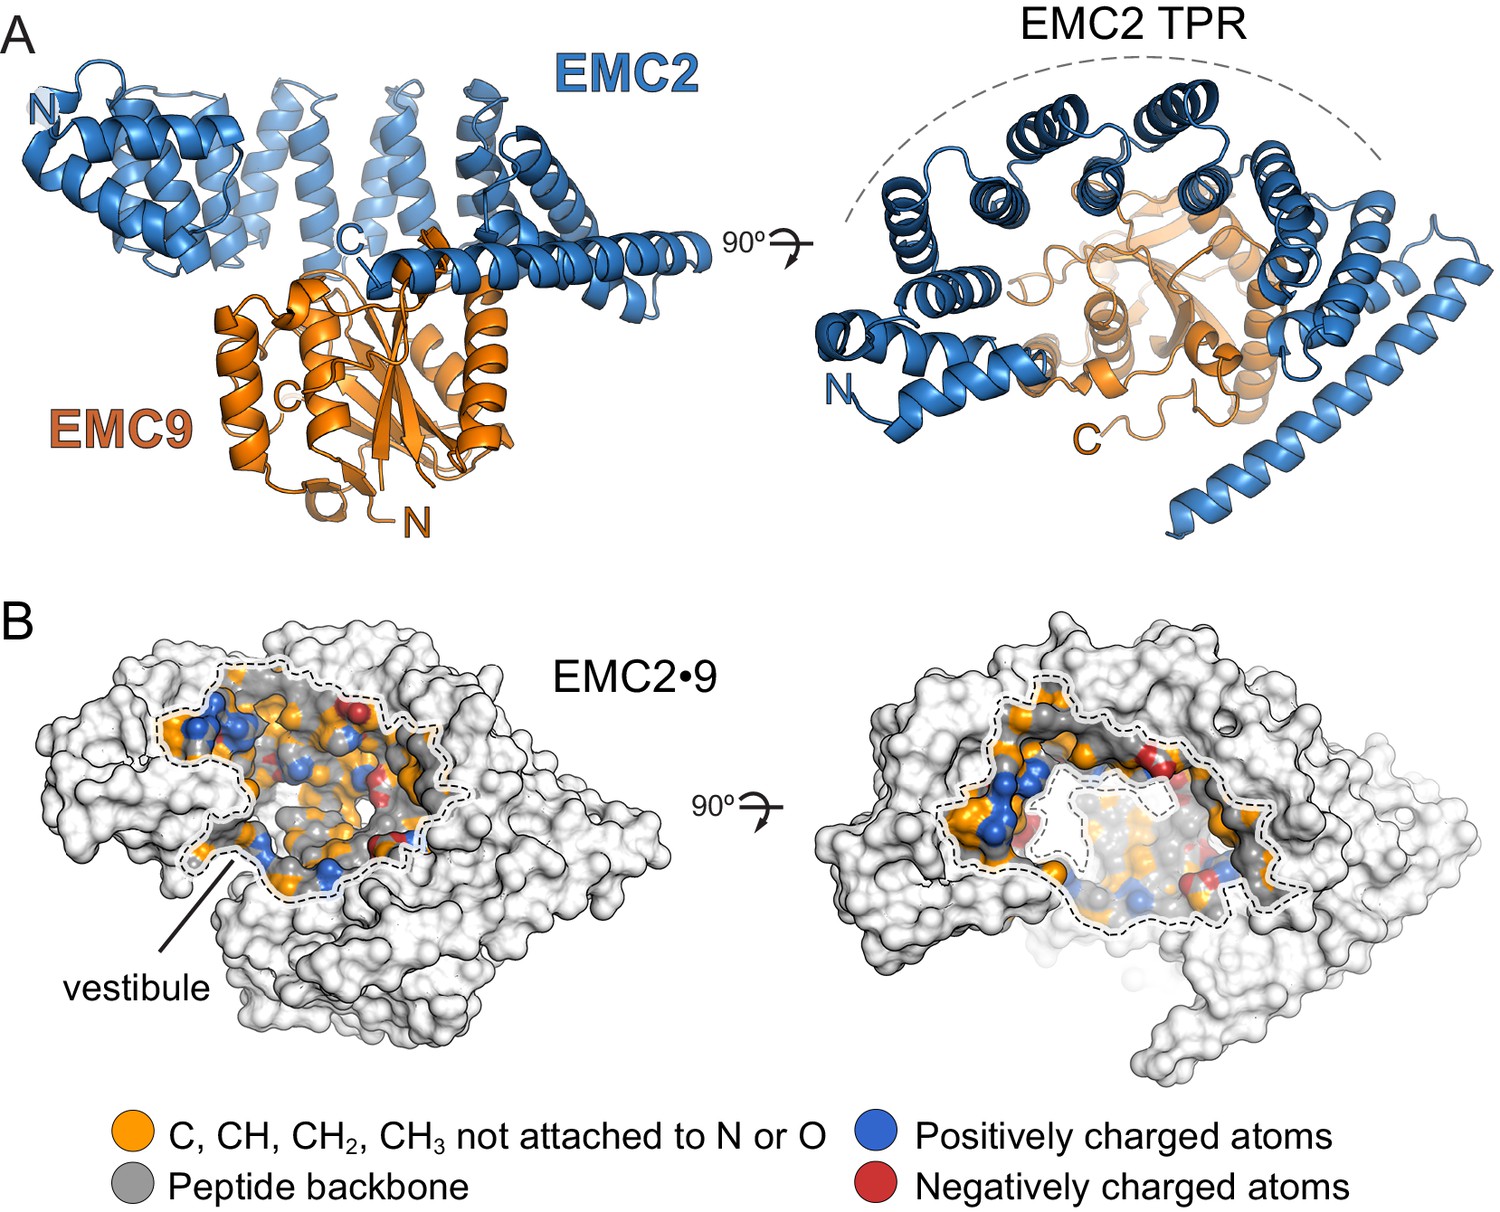
Structure of the EMC2•EMC9 complex.
(A) Crystal structure of the EMC2•EMC9 heterodimer (PDB: 6Y4L). The heterodimer consists of EMC2 (residues 11–274), depicted in blue, and EMC9 (residues 1–200), depicted in orange. The TPR-repeat motif of EMC2 is indicated. (B) Physicochemical properties of a vestibule in the EMC2•EMC9 complex. Surface rendering of crystal structures coloured according to chemical properties (Hagemans et al., 2015).
Figure 2—figure supplement 1
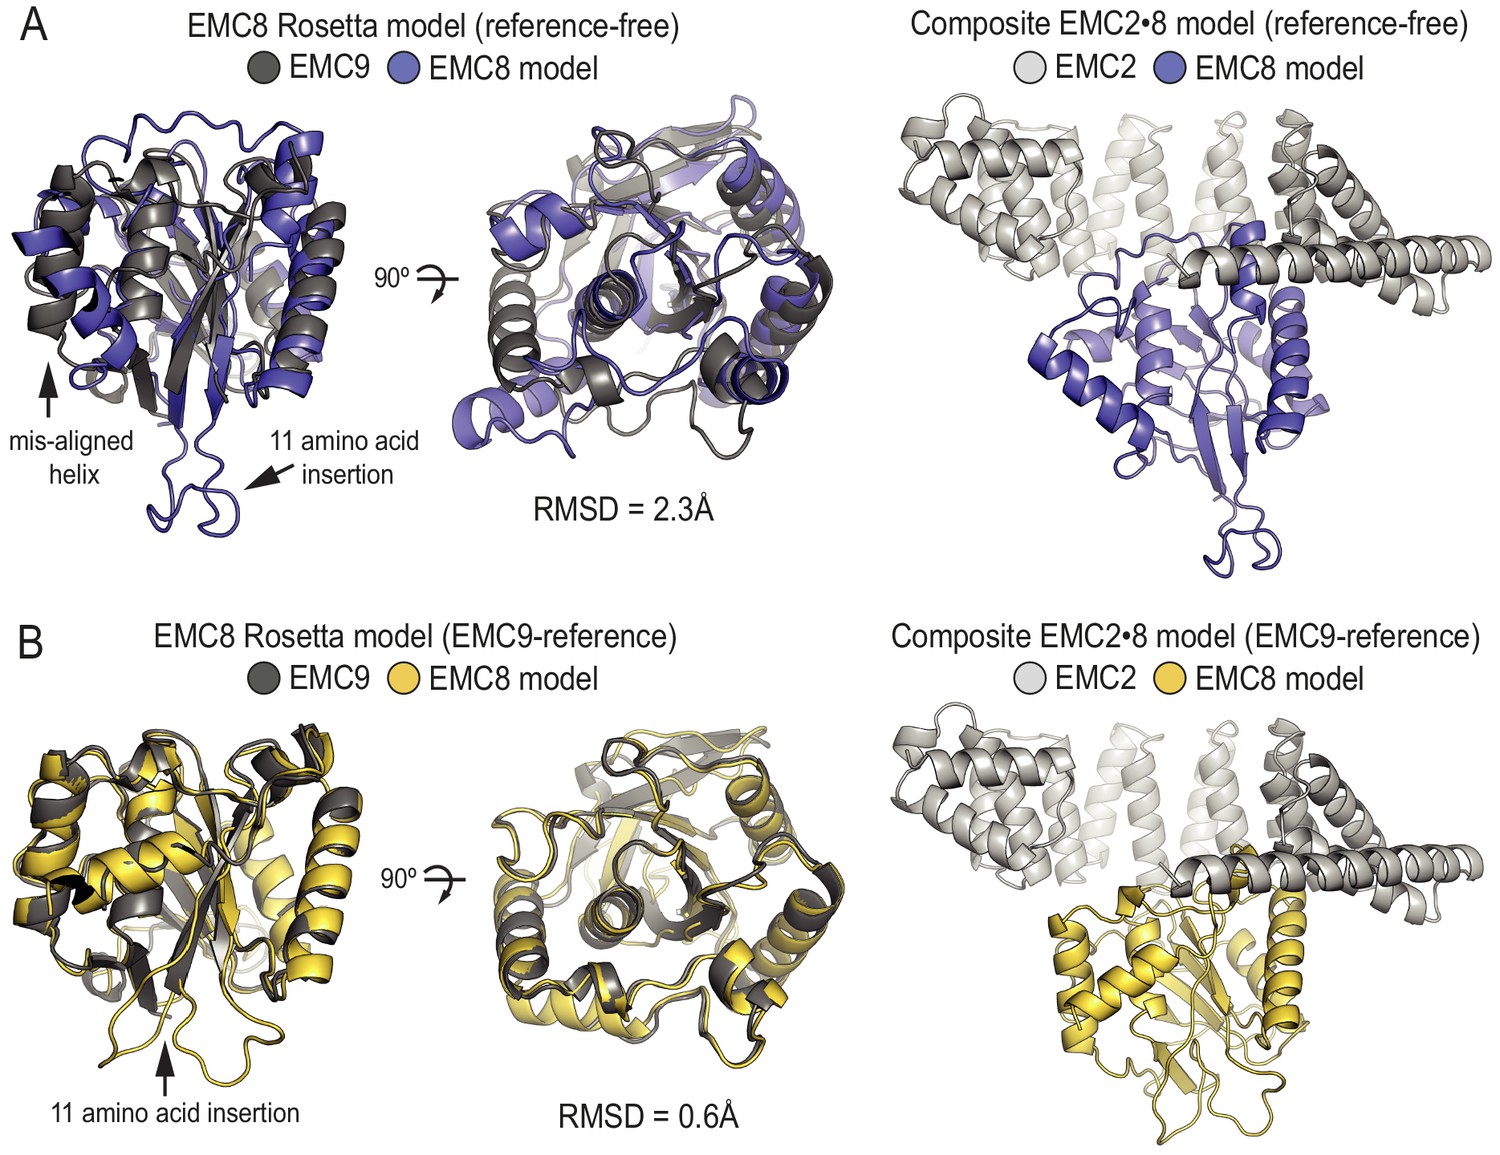
Protein structure prediction confirms structural homology between EMC9 and EMC8.
(A) Reference free ab initio modelling of EMC8 (blue) using Robetta results in a model with an overall RMSD of 2.3 Å when aligned to the EMC9 crystal structure (grey). The majority of this disparity is the result of a single misaligned helix and the location of an 11 residue insertion in a loop in EMC8. Docking of the predicted structure into the EMC2•EMC9 structure in the place of EMC9 results in a good fit with no steric violations. (B) Ab initio modelling of EMC8 (yellow) using Robetta with the EMC9 crystal structure (grey) as a template results in an improved model with an overall RMSD of 0.6 Å. As with the reference-free model, the template-based model of EMC8 yields the same core fold and fits well when substituted into the EMC2•EMC9 crystal structure.
Figure 2—figure supplement 2
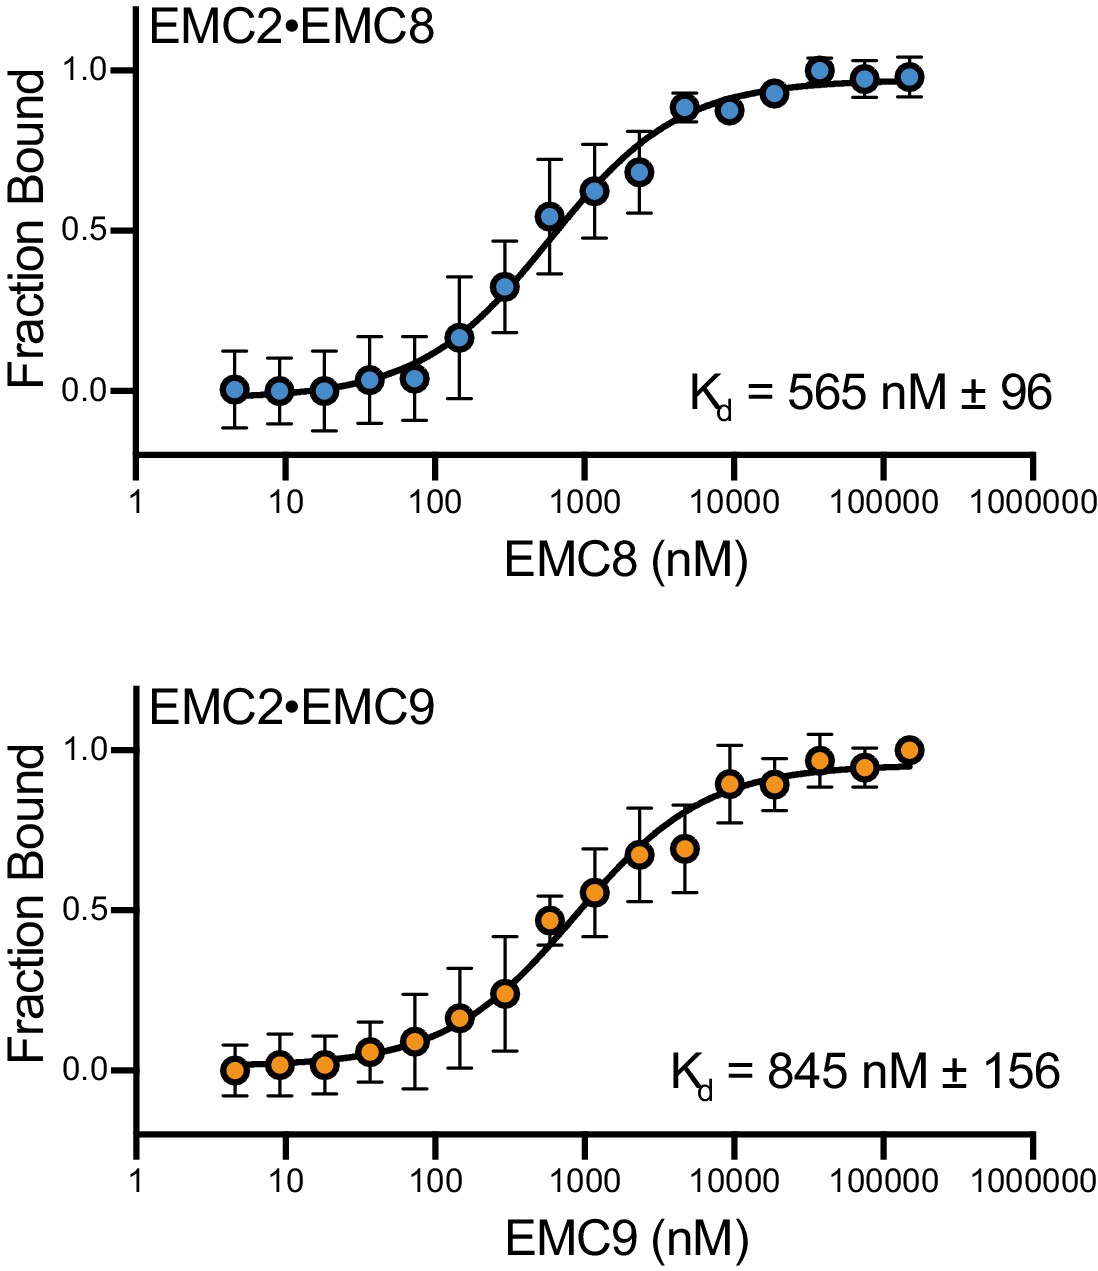
EMC8 and EMC9 have similar affinities for EMC2.
Microscale thermophoresis was used to determine affinities of the heterodimer. An endogenous solvent accessible cysteine in EMC2 was labeled with maleimide-OG488 and held at a fixed concentration of 50 nM. Either EMC8 or EMC9 were titrated from 4 nM - 150 µM. Affinities calculated for EMC2•EMC8 (blue) and EMC2•EMC9 (orange) were ~550 nM and ~850 nM respectively. Thermophoresis data were fit using NanoTemper’s in software quadratic model, and equivalent results were attained using nonlinear fit model in Prism GraphPad. Data consist of two biological replicates with two technical replicates each. Data points represent the mean and error bars represent standard deviation.
Figure 3 with 2 supplements
Functional analysis of the EMC2•EMC9 cytosolic vestibule.
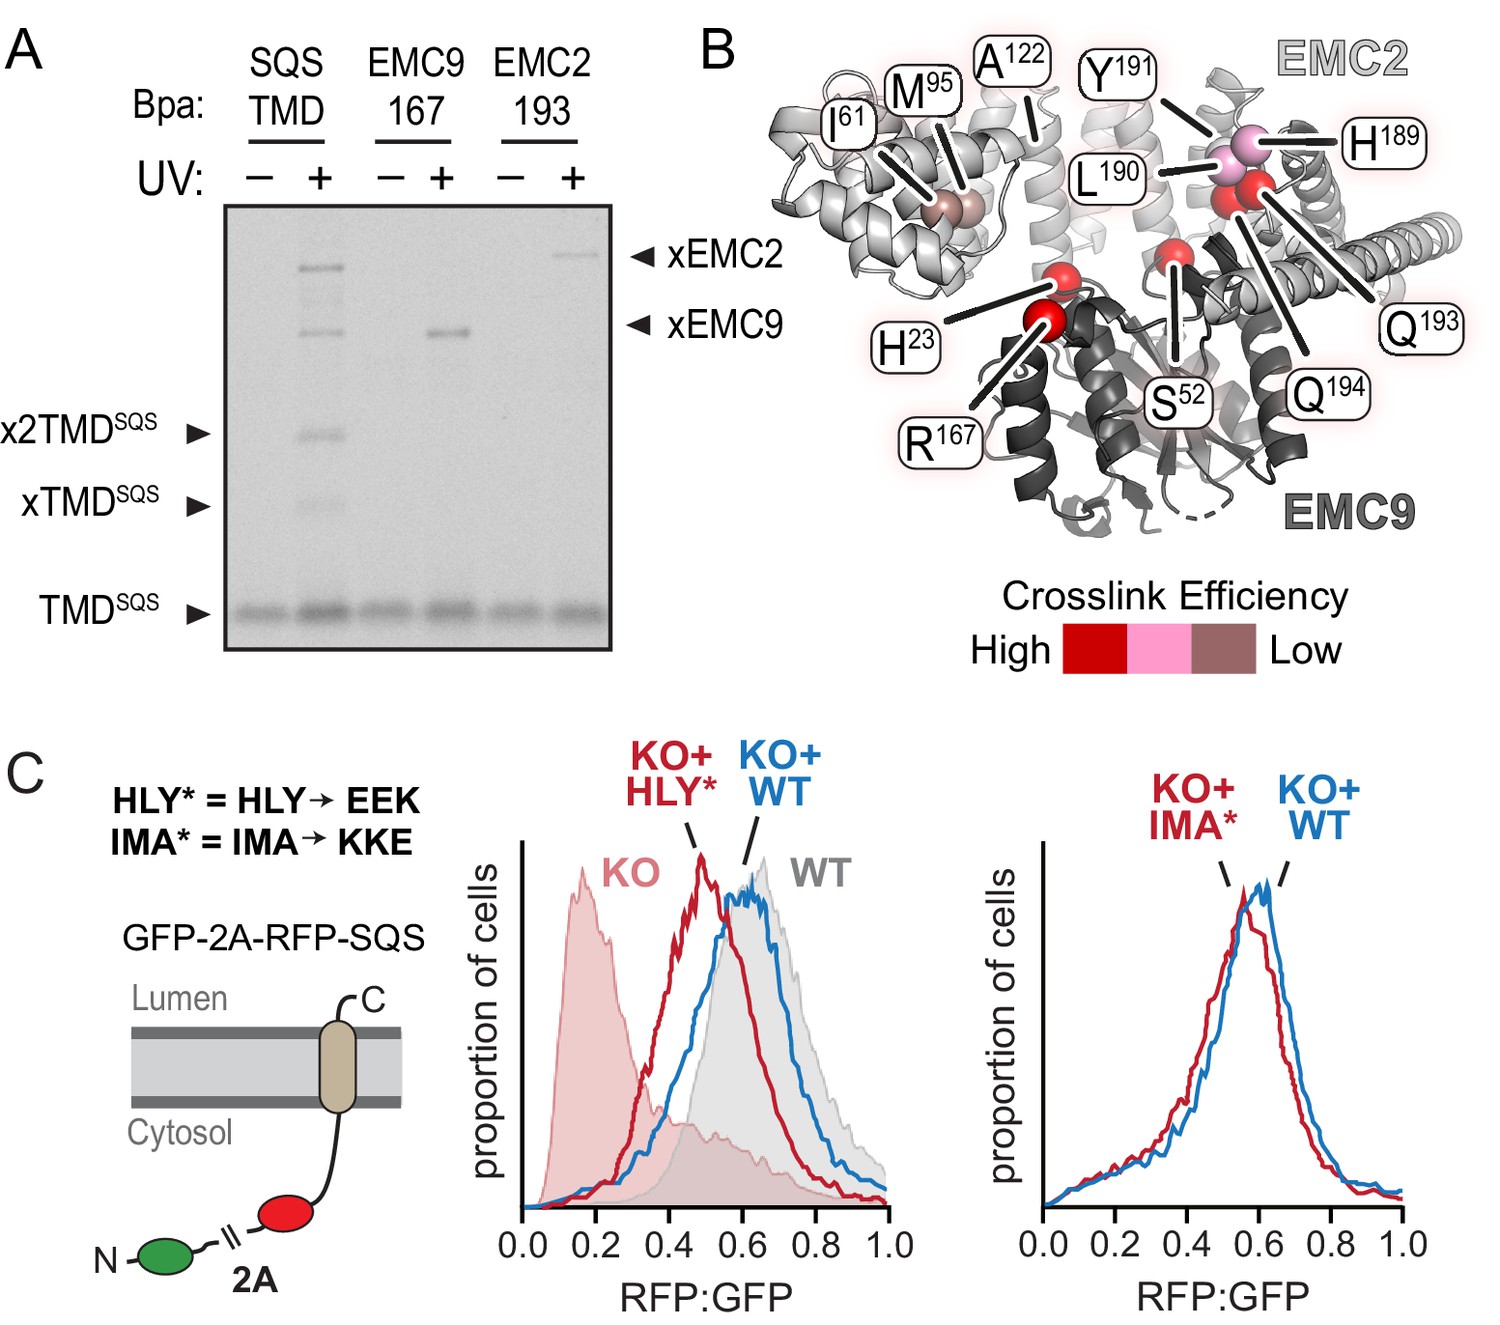
(A) 35S-methionine-labeled TMD of SQS was mixed with recombinant purified EMC2•EMC9 complex as in Figure 1 and analyzed directly or after UV irradiation as indicated. The photocrosslinking amino acid benzoyl-phenylalanine (Bpa) was incorporated into either the SQS substrate, EMC9 (at codon 167), or EMC2 (at codon 193) as indicated. Both R167 in EMC9 and Q193 in EMC2 line the vestibule. (B) Bpa was incorporated at different positions within the vestibule of the EMC2•EMC9 complex and crosslinking efficiency to SQS was determined as in panel A. Locations of the Bpa are annotated as spheres on the EMC2•EMC9 heterodimer. The sphere colors correspond to the intensity of the resulting crosslink. Position 191 (obscured behind L190 in this view) showed no crosslinking to substrate, consistent with its rearward facing location. (C) Shown on the left is a diagram of the dual color reporter for insertion of the TMD of SQS. Expression of this reporter results in a free GFP protein and an RFP-tagged SQS protein due to ribosomal skipping at the a viral 2A sequence. The left graph shows flow cytometry analysis of the SQS reporter in WT cells (grey), EMC2 knockout (KO) cells (shaded pink), KO cells complemented with WT EMC2 (blue line), and KO cells complemented with the HLY* EMC2 mutant (red line). The data are represented as histograms of the RFP to GFP ratio. The right graph shows a comparison of the SQS reporter in KO cells complemented with either WT EMC2 or the IMA* EMC2 mutant. The mutated amino acids, whose positions are shown in panel B, are: H189E, L190E, Y191K, I61K, M95K, and A122E.
Figure 3—figure supplement 1
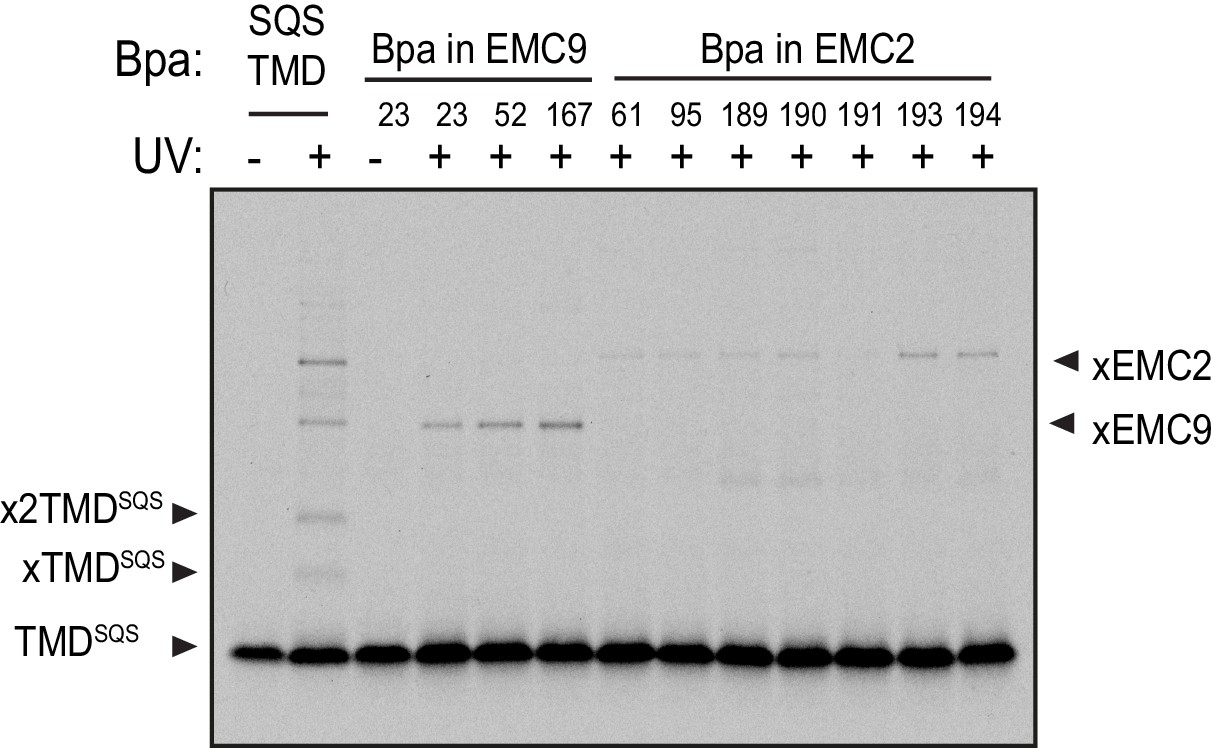
Crosslinking analysis of the EMC2•EMC9 cytosolic vestibule.
35S-methionine-labeled TMD of SQS was mixed with recombinant purified EMC2•EMC9 complex as in Figure 1 and analyzed directly or after UV irradiation as indicated. The photocrosslinking amino acid benzoyl-phenylalanine (Bpa) was incorporated into either the SQS substrate, EMC9, or EMC2 as indicated.
Figure 3—figure supplement 2
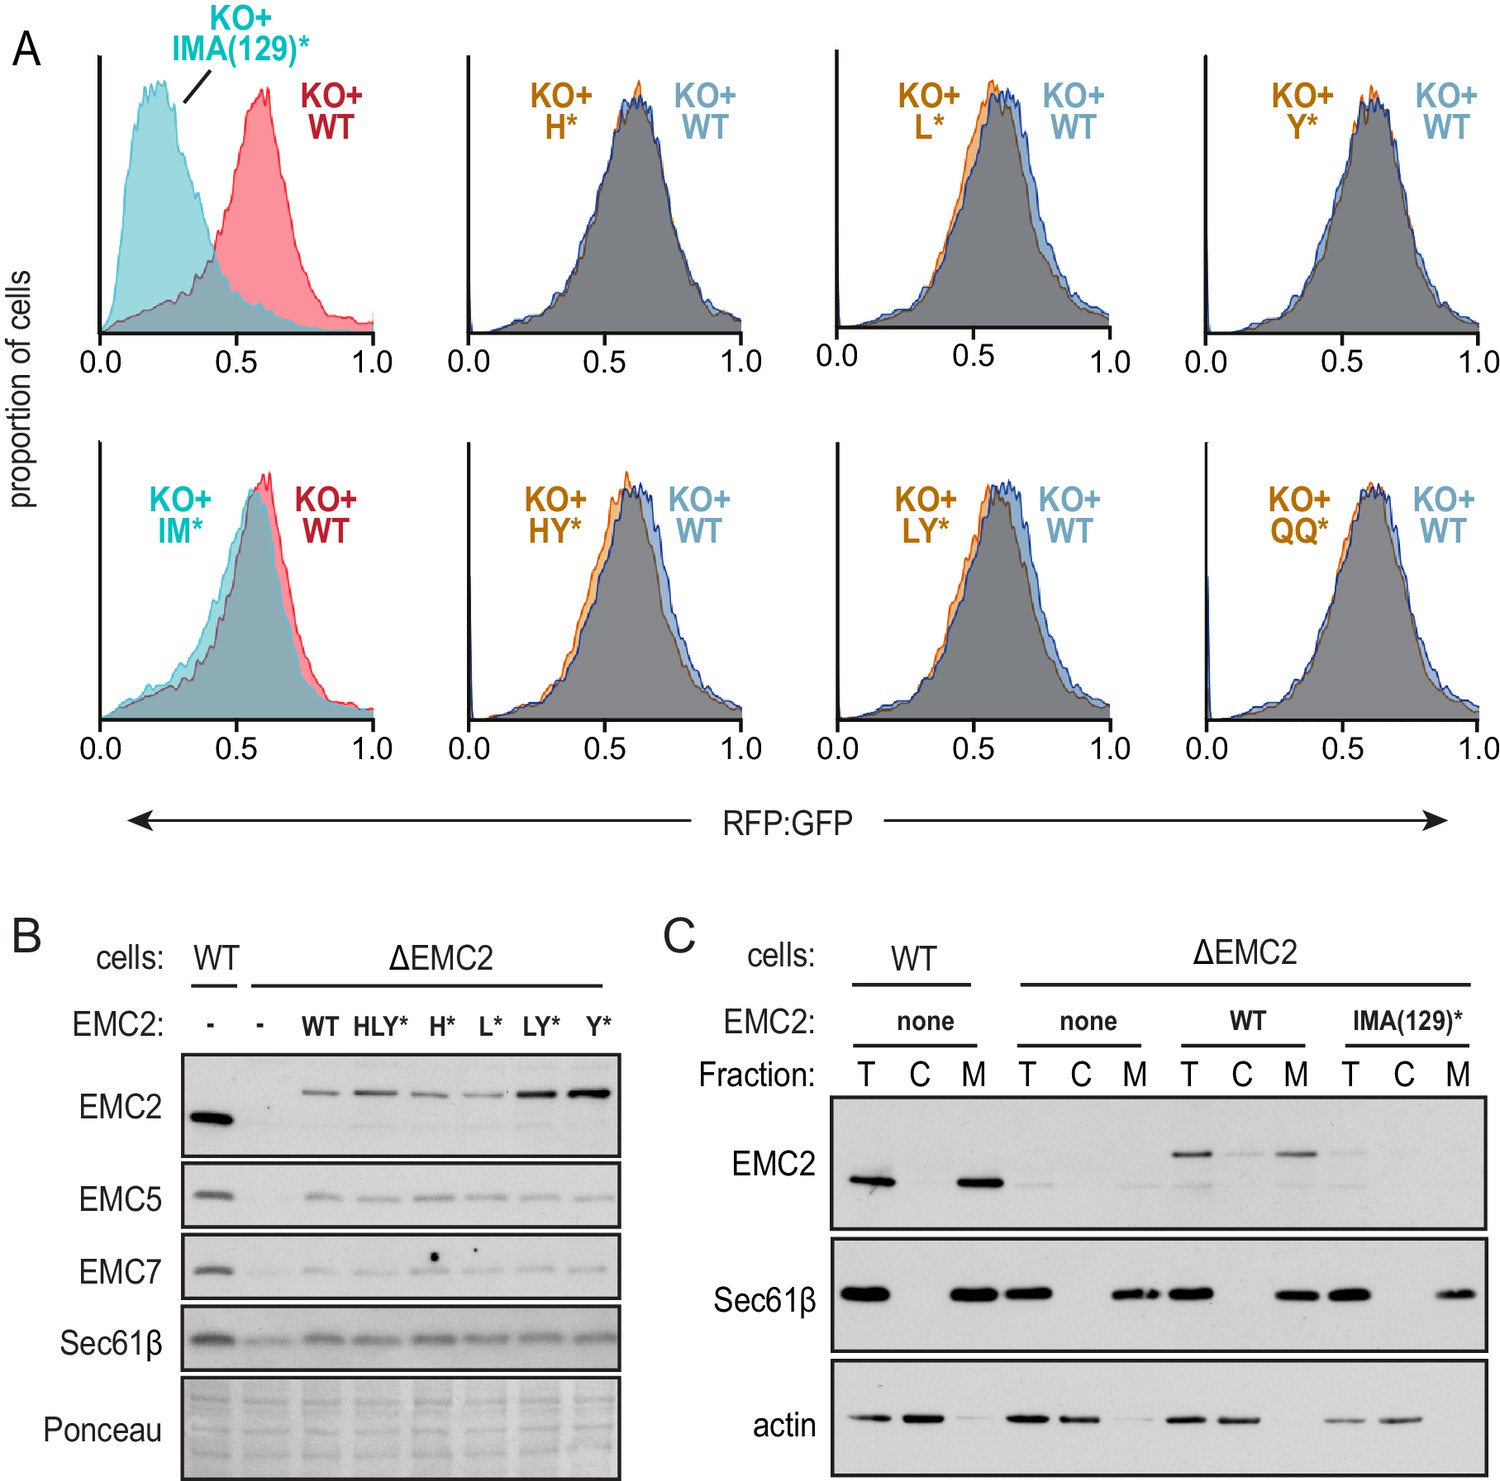
Functional analysis of the EMC2•EMC9 cytosolic vestibule.
(A) Expression of the dual color SQS reporter in EMC2 knockout cells complemented with either WT EMC2 or the indicated EMC2 mutants. The data are represented as histograms of the RFP to GFP ratio. The two left graphs are from a different experiment from the remainder of graphs (which were analyzed together) and are colored differently to indicate this. The knockout-like phenotype of the IMA(129)* mutation is apparently due to the A129K mutation since the IM* mutation shows almost complete rescue. The mutated amino acids are: I61K, M95K, A129K, H189E, L190E, Y191K, Q193E, and Q194K. (B) Immunoblotting of whole cell extracts from WT or ΔEMC2 cells transfected with the indicated EMC2 constructs. A section of the Ponceau-stained blot shows equal loading. (C) WT and ∆EMC2 cells transfected with the indicated EMC2 constructs were fractionated into cytosol (C) and membrane (M) fractions and analyzed by immunoblotting for EMC2 relative to an equivalent amount of total (T) cell lysate. The membrane marker Sec61β and cytosolic marker actin were included as controls. Note that relative to WT EMC2 expressed in ∆EMC2 cells or endogenous EMC2 in WT cells, the IMA(129)* mutant is very poorly expressed. This is presumably due to its degradation secondary to inefficient assembly with other EMC subunits, explaining its strong phenotype in the flow cytometry assay.
Figure 4 with 2 supplements
The position of EMC2•EMC9 within native EMC.
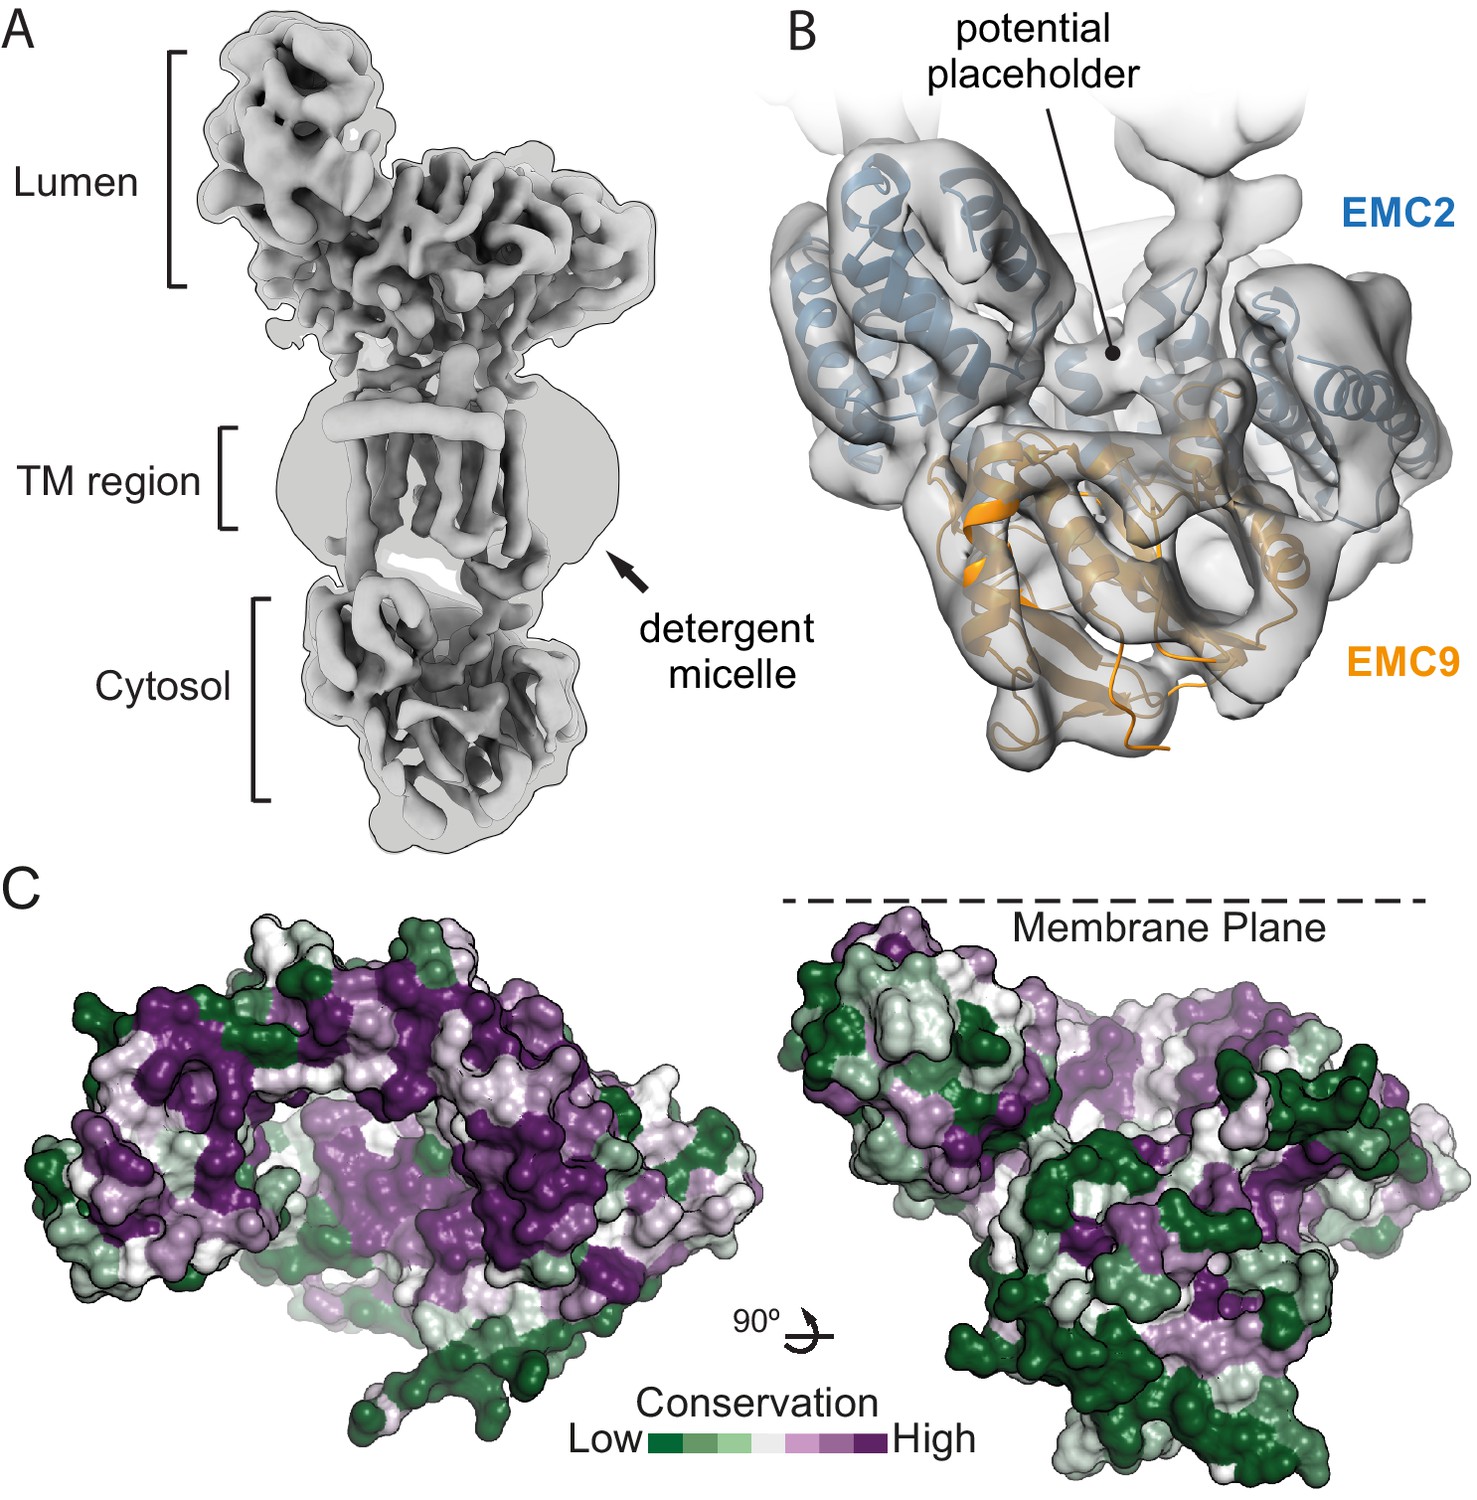
(A) Cryo-EM map of the EMC at 6.4 Å resolution reveals the architecture of the complex. The map is shown at two contour levels: a stringent contour that illustrates secondary structure features (0.21) superimposed with a liberal contour that shows the detergent micelle (0.15). (B) Refinement of the EMC2•EMC9 crystal structure (blue and orange) into the cytosolic density (grey) using Flex-EM, Coot and PHENIX. (C) Surface rendering of the EMC2•EMC9 crystal structure coloured by residue conservation (Ashkenazy et al., 2016) from highly conserved (purple) to weakly conserved (green). The top rim of EMC2’s TPR is highly conserved. This surface faces the membrane and regions of it interact with other EMC-subunits. The substrate binding vestibule also exhibits high conservation in comparison to the remaining solvent exposed surface of the EMC2•EMC9 heterodimer.
Figure 4—figure supplement 1
Cryo-electron microscopy data processing.
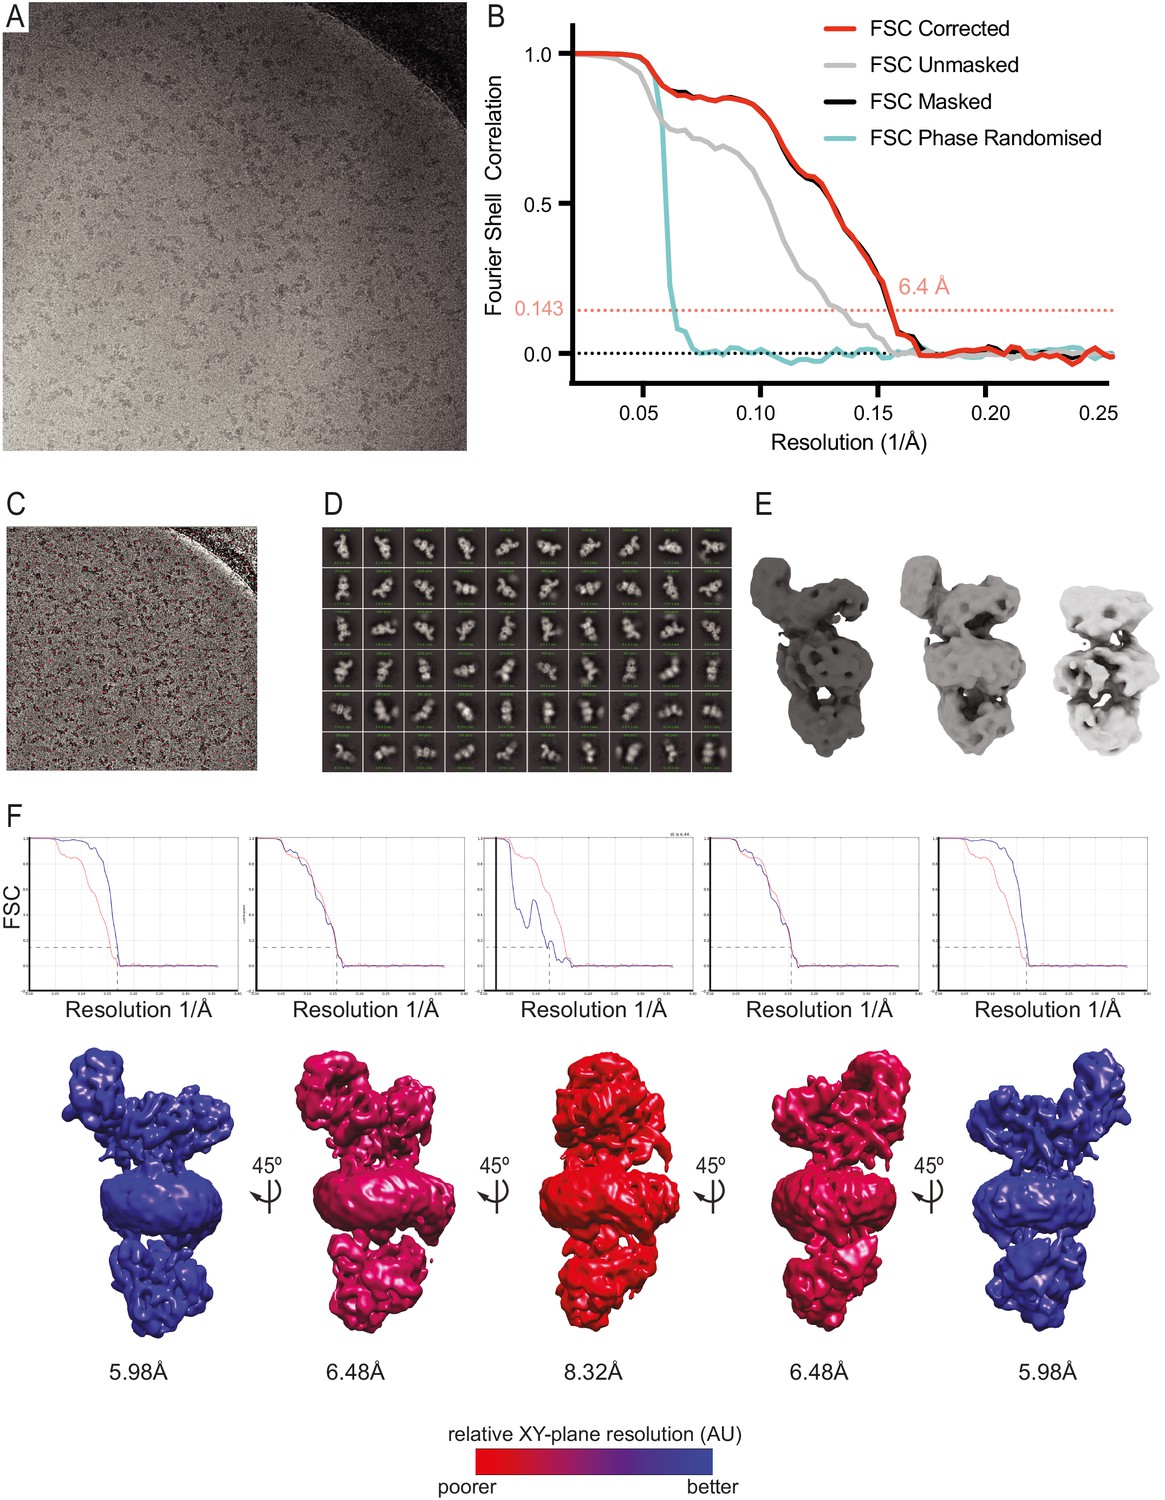
(A) Micrograph showing EMC particles imaged at −0.5 µm defocus with volta phase plate at a nominal pixel size of 1.38 Å using a K2 summit detector. (B) Fourier Shell Correlation (FSC) curves for phase randomised, unmasked, masked and corrected 3D reconstructions. Representative images of template-based autopicking (C), 2D-classification (D) and 3D classification (E) stages during the processing of dataset 1. (F) 3D FSC curves demonstrating resolution anisotropy during reconstruction of a map of the human EMC. 5 views of the same map are shown in rotational increments of 45°. Each view is accompanied by an FSC plot comparing the FSC in the respective viewing orientation (blue) to the global FSC (red). Resolution values given below the maps are calculated from the FSC plots above the maps using the 0.143 criterion. Maps are coloured from blue (high) to red (low) to indicate reconstruction resolution from different angles. Maps generated using 3DFSC implemented in CryoSPARC (Tan et al., 2017).
Figure 4—figure supplement 2
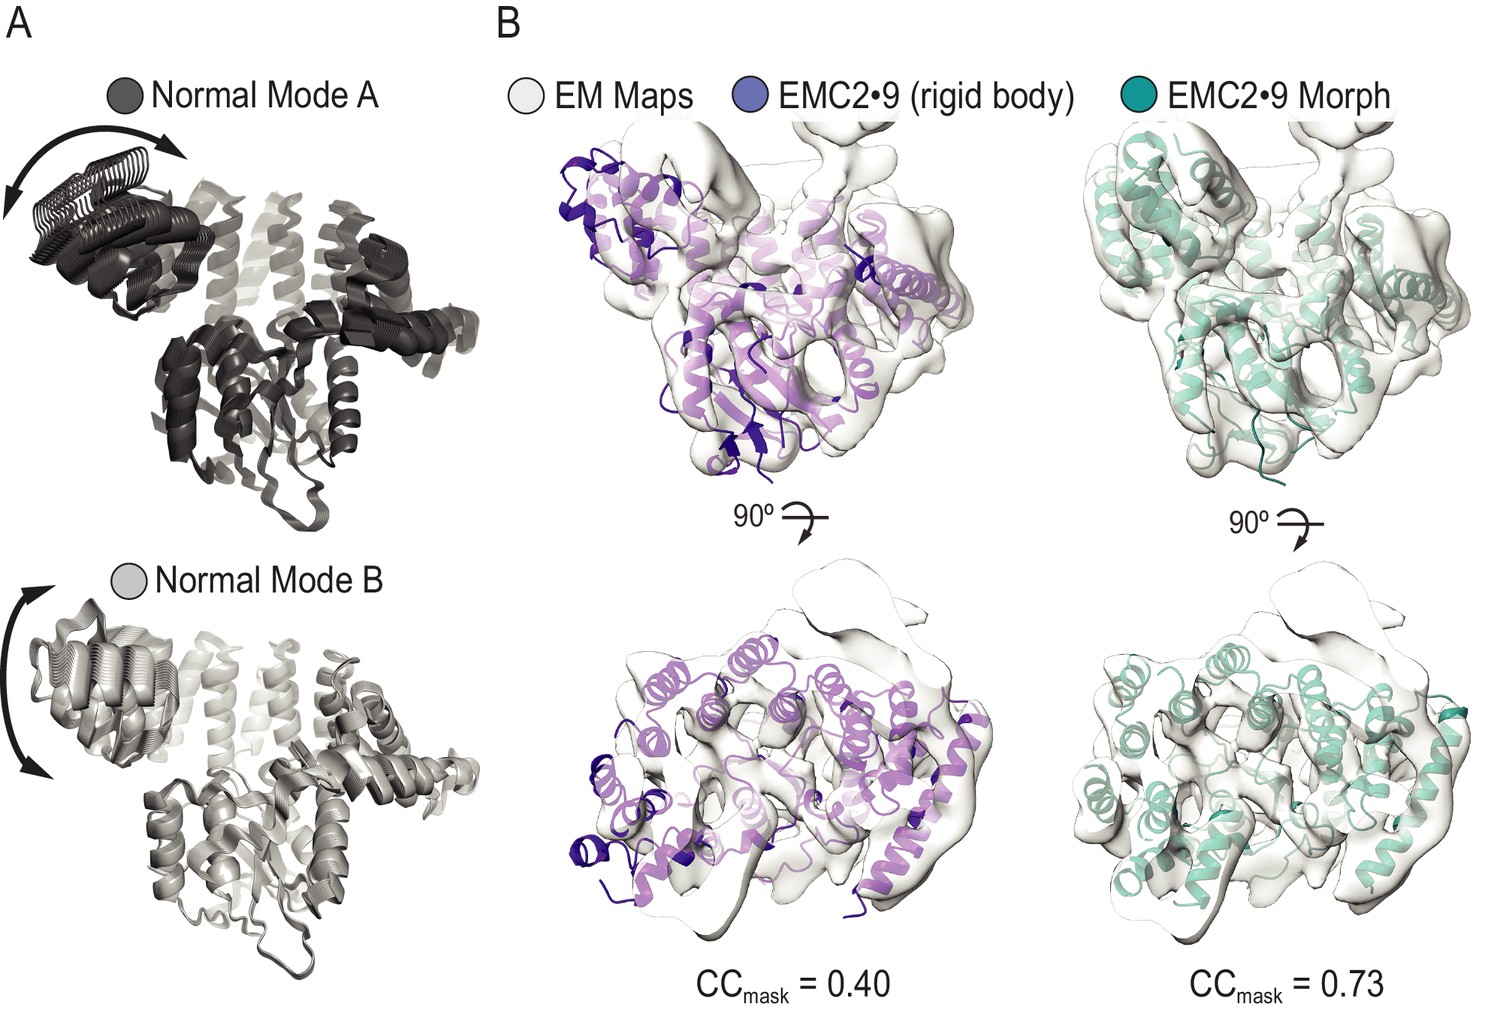
Normal mode analysis and flexible fitting of the EMC2•EMC9 crystal structure into the full EMC cryo-EM map.
(A) Normal mode analysis using the el Némo server (Suhre and Sanejouand, 2004) reveals conformational flexibility in the N-terminal region of EMC2•EMC9. All calculated states are shown for modes A and B in dark and light grey, respectively. Arrows indicate direction of motion. (B) Rigid body docking of the EMC2•EMC9 crystal structure (purple) into the experimental cryo-EM density (grey) is in overall good agreement with the exception of EMC2’s N-terminal region. The fit is improved (teal) following flexible fitting conducted with Flex-EM, and real space refinement in Coot and PHENIX. The map to model CCmask calculated in PHENIX real space refine increases from 0.40 for the rigid body fit to 0.73 for the flexibly fitted structure. During flexible fitting the largest movements occurred in the N-terminal helical bundle of EMC2, consistent with the normal mode analysis.
Figure 5 with 5 supplements

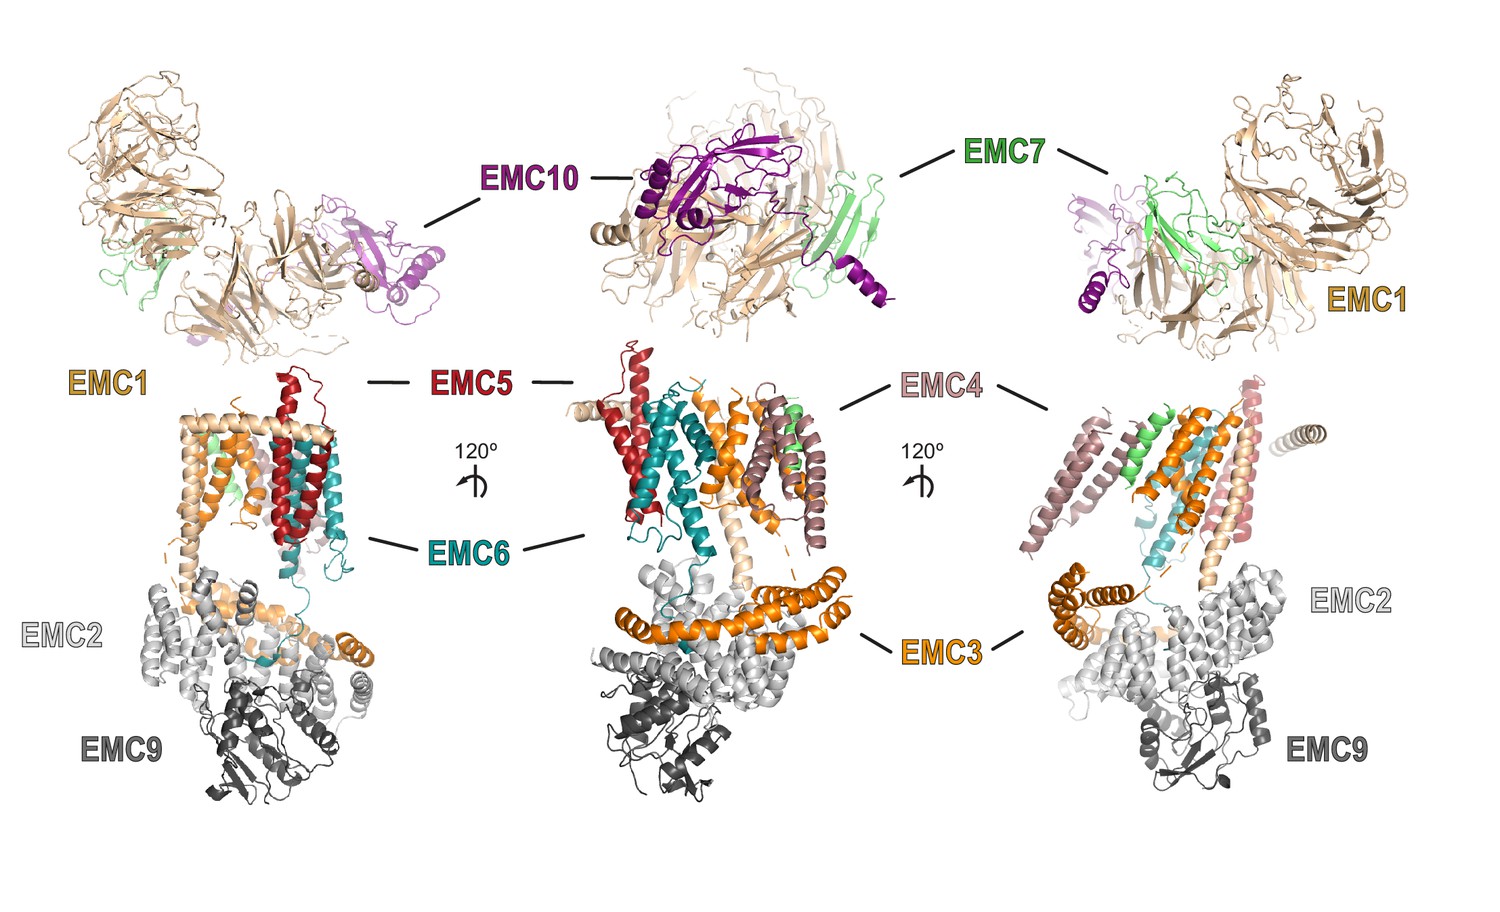
A composite model of EMC’s membrane and lumenal domains.
(A) Cross section through the TMD region of the cryo-EM map of EMC (light grey) identifies 13 helix-like densities (dark blue) that define an intramembrane groove (red star) open to the lipid bilayer. Density corresponding to the annular detergent micelle is indicated. (B) Ab initio trRosetta models fitted into cryo-EM density for the EMC membrane domain are shown for EMC1 (wheat), EMC3 (orange), EMC4 (light pink), EMC5 (red), EMC6 (teal), and EMC7 (green). The horizontal density at the membrane-lumen interface termed the ‘crossbar’ is assigned to an amphipathic helix in EMC1. (C) EMC3-3xFLAG constructs containing amber codons (amb.) at the indicated positions were expressed together with an amber suppressor tRNA and cognate aminoacyl-tRNA synthetase that accepts the UV-activated crosslinking amino acid 3'-azibutyl-N-carbamoyl-lysine (AbK). Cells were left untreated or irradiated with UV and analyzed by immunoblotting for EMC3-3xFLAG. A prominent UV-dependent crosslink is seen from position 23 and to a lesser extent, position 26. Native FLAG immunoprecipitation (IP) recovers EMC1 (indicating that EMC3-3xFLAG is incorporated into EMC), which shifts with UV. Denaturing EMC1 IP confirms the crosslinked product contains both EMC1 and EMC3. (D) TMD helices positioned based on docking of ab initio models overlayed with AbK-mediated crosslinks (see Figure 5—figure supplement 3). The positions where AbK was incorporated are shown as spheres, with magenta lines showing the closest point of the target protein in the model. (E) Composite model of the EMC lumenal domain generated by ab initio modelling in trRosetta and real-space refinement in PHENIX. Cryo-EM density has been colored according to subunit identity and the composite lumenal domain model accounts for almost all the lumenal EM density. (F) Cross-section through EMC at the plane of the membrane-lumen interface illustrating that a pore is not evident across the membrane. All EM data visualized in UCSF ChimeraX with EM maps contoured at 0.15 (panel A) and 0.21 (panels B, E, and F) with hide dust setting of 10. Panel D was generated in PyMOL.
Figure 5—figure supplement 1

Ab initio prediction of EMC subunit structure and flexible fitting using real-space refinement.
Structures were predicted for 9 EMC subunits using the trRosetta server. The best ranked solution for each subunit was then docked into the cryo-EM density and subject to real-space refinement in PHENIX. Number of alignments in the multiple sequence alignment (MSA) is indicated along with the resulting distance contact heat map. The top five ranked models were aligned for the core folds used in EM docking to show modelling confidence. A comparison of the model before and after real space refinement illustrates only subtle changes (green vs grey, RMDS is indicated). Soluble and membrane proteins (EMC2, EMC9, and Sec61a) were modelled and compared to their known structures.
Figure 5—figure supplement 2
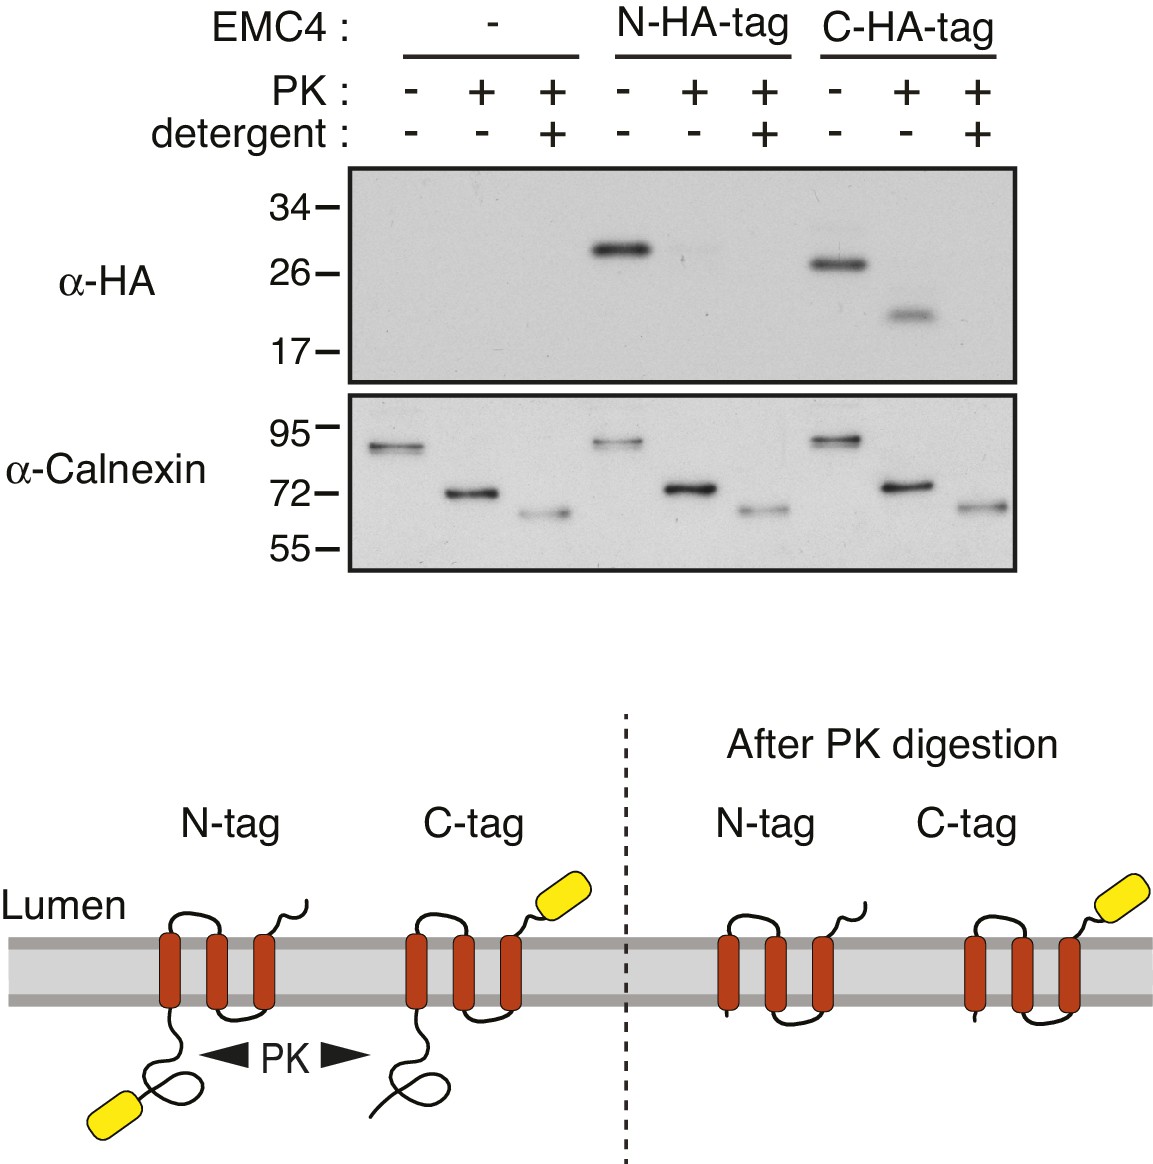
Protease-protection analysis of EMC4 topology.
Microsomes isolated from HEK293T cells transfected with an empty vector, EMC4 with an N-terminal 3xHA tag (N-HA-tag), or EMC4 with a C-terminal 3xHA tag (C-HA-tag) were analyzed by a protease-protection assay. Equal aliquots were left untreated, treated with proteinase K (PK), or treated with PK in the presence of detergent (Triton X-100) and analyzed by immunoblotting for the HA tag and the N terminus of calnexin. The N-terminal 3xHA tag was accessible to PK in the absence of detergent, suggesting the N-terminus is exposed to the cytosol. The C-terminal 3xHA tag was protected from PK digestion in the absence, but not presence, of detergent, suggesting that the C-terminus is in the ER lumen. This supports a three TMD model in which the loop between TMD2 and TMD3 is too short to be accessible to PK. A schematic of the results and proposed topology of EMC4 is also shown. In principle, the protease-digestion results are also consistent with a single-spanning topology with the N-terminus facing the cytosol. However, this is unlikely given that all topology prediction algorithms predict at least two TMDs and trRosetta predicts a three helix bundle. Note that the core region in the N-terminal lumenal domain of calnexin is resistant to complete PK digestion.
Figure 5—figure supplement 3
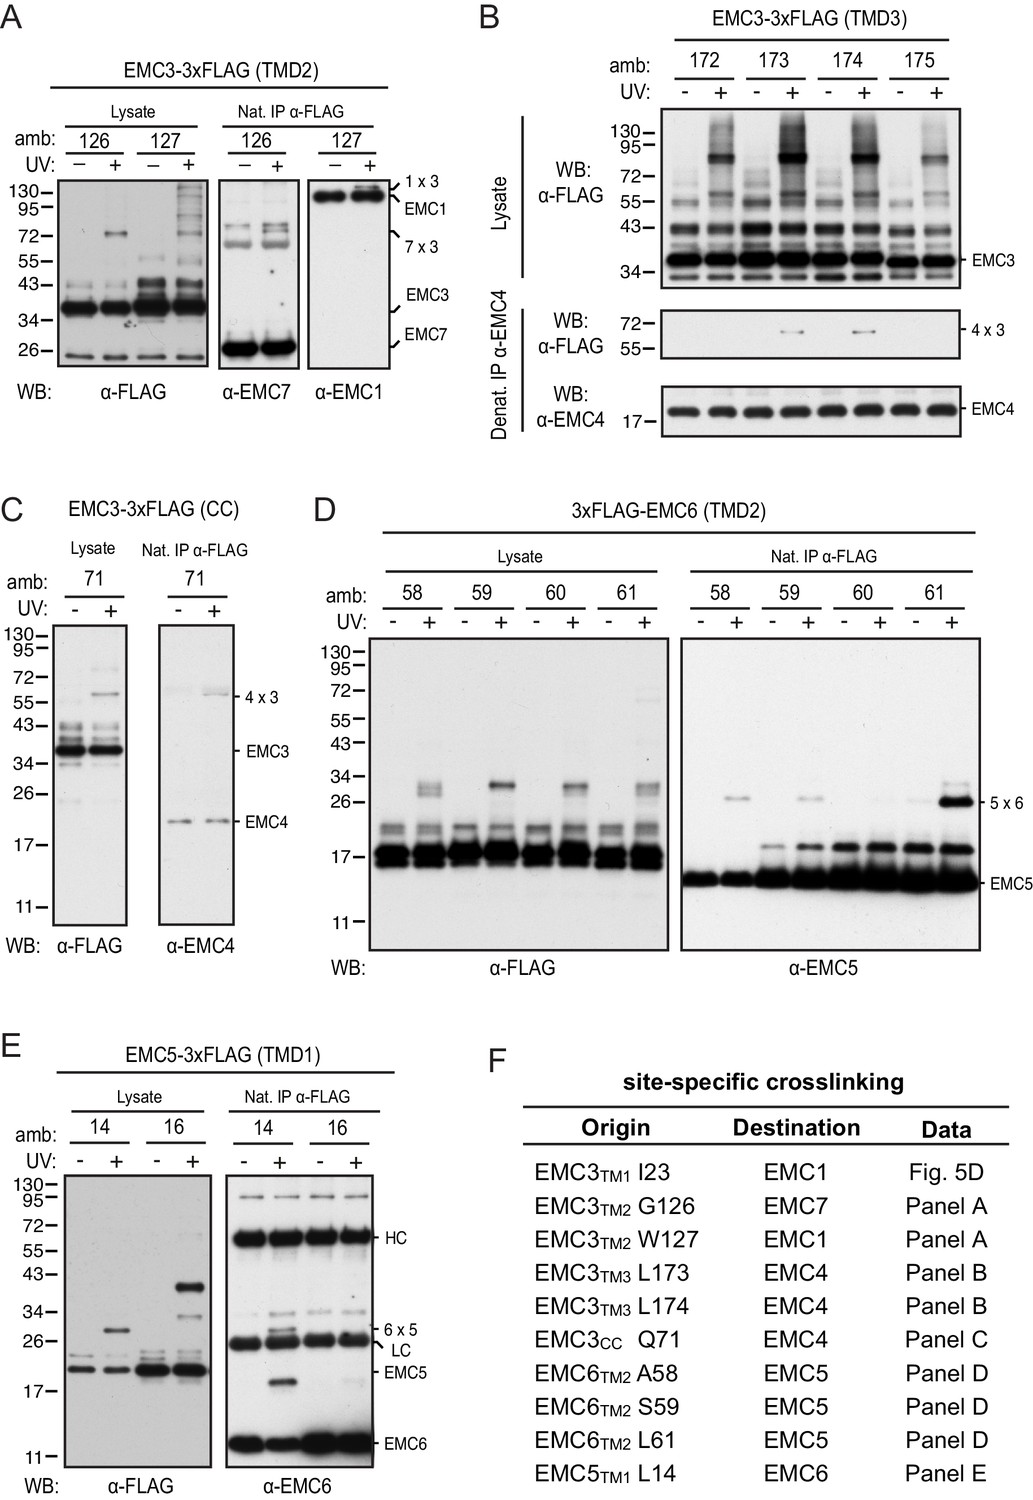
Site-specific photocrosslinking between EMC subunits.
(A–E) Experiments similar to that shown in Figure 5C are displayed for the key crosslinks depicted in Figure 5D. In each case, the FLAG-tagged construct indicated on top and containing amber codons (amb.) at the indicated positions was expressed together with an amber suppressor tRNA and cognate aminoacyl-tRNA synthetase that accepts the UV-activated crosslinking amino acid 3'-azibutyl-N-carbamoyl-lysine (AbK). Cells were left untreated or irradiated with UV and analyzed by immunoblotting for the FLAG epitope in total lysate as indicated. In panels A, C, D, and E, lysates were subjected to native FLAG immunoprecipitation (IP) and immunoblotted for the indicated targets. In panel B, lysates were subjected to denaturing EMC4 IP and blotted for the FLAG tag and EMC4 as indicated. (F) Summary of the observed crosslinks and where the primary data are displayed in the figure. Note that various positions from which crosslinks to an particular target was not observed are not shown for brevity.
Figure 5—figure supplement 4
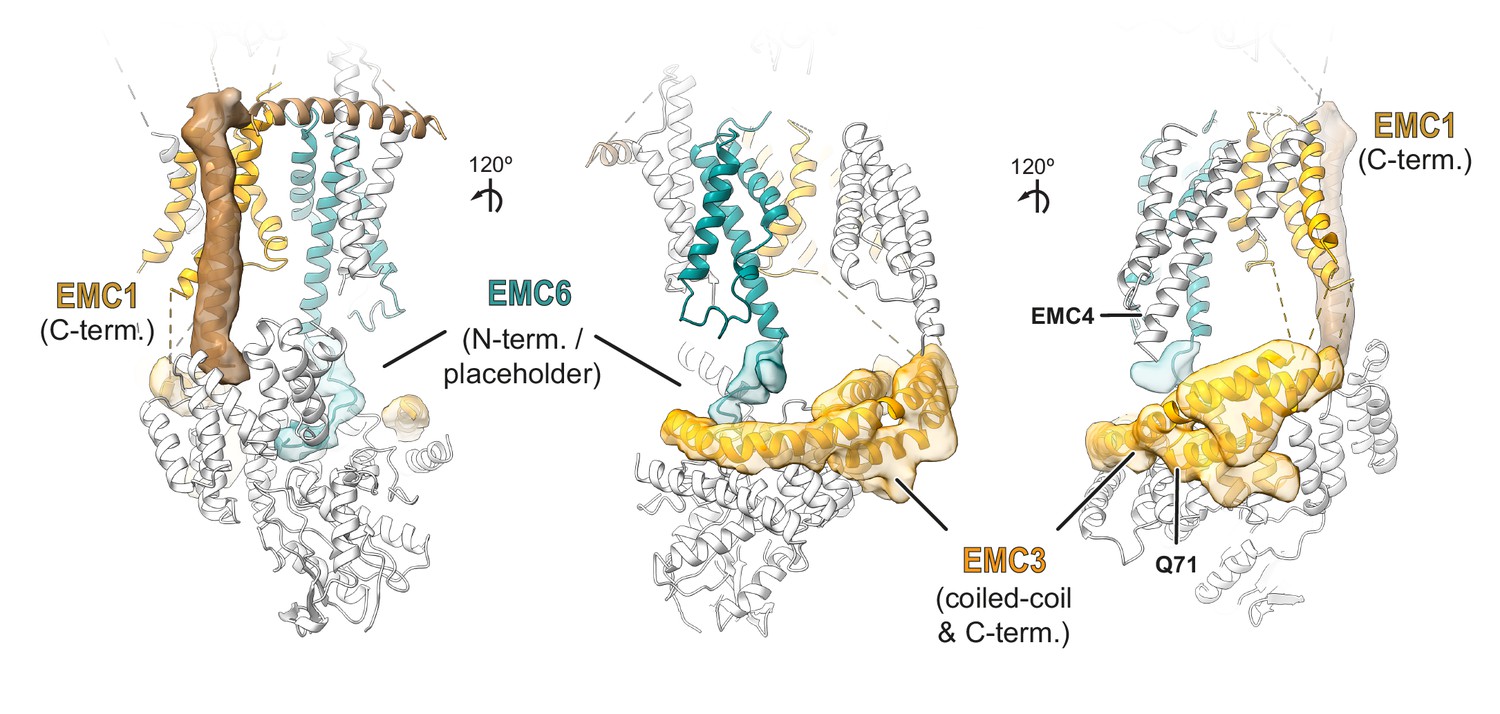
Provisional assignment of non-EMC2•EMC9 cytosolic density.
Semi-automated segmentation in UCSF chimera revealed regions of density in the cytosolic domain of the cryo-EM map of the EMC which are not accounted for by the EMC2•EMC9 heterodimer (translucent densities). Based on the position and connectivity to the respective TMDs in the membrane portions of this density were provisionally assigned to EMC1 (brown) and the N-terminus of EMC6 (teal) which is proposed to form a ‘placeholder’ in the cytosolic substrate binding pocket. A predicted three-helix bundle formed from a coiled-coil between TMD1 and TMD2 of EMC3 interacting with a helix in EMC3’s C-terminal tail was fit into a similarly shaped and sized density. In this fitted model, Q71 of EMC3 is surface-exposed and near where the N-terminal tail of EMC4 might reside. AbK incorporated at Q71 shows a UV-dependent crosslink to EMC4 (Figure 5—figure supplement 3), consistent with our assignments. The remaining density is continuous with the C-terminal helix in this three-helix bundle and was therefore provisionally assigned to the rest of EMC3’s C-terminal tail.
Figure 5—figure supplement 5
Views of the composite EMC model.
Shown are multiple views of the composite EMC model which contains all nine EMC subunits. Where possible, the same color scheme as used throughout the main figures was employed with EMC1 (tan), EMC2 (light grey), EMC3 (orange), EMC4 (dark pink), EMC5 (red), EMC6 (teal), EMC7 (lime), EMC9 (dark grey), and EMC10 (purple).
Figure 6
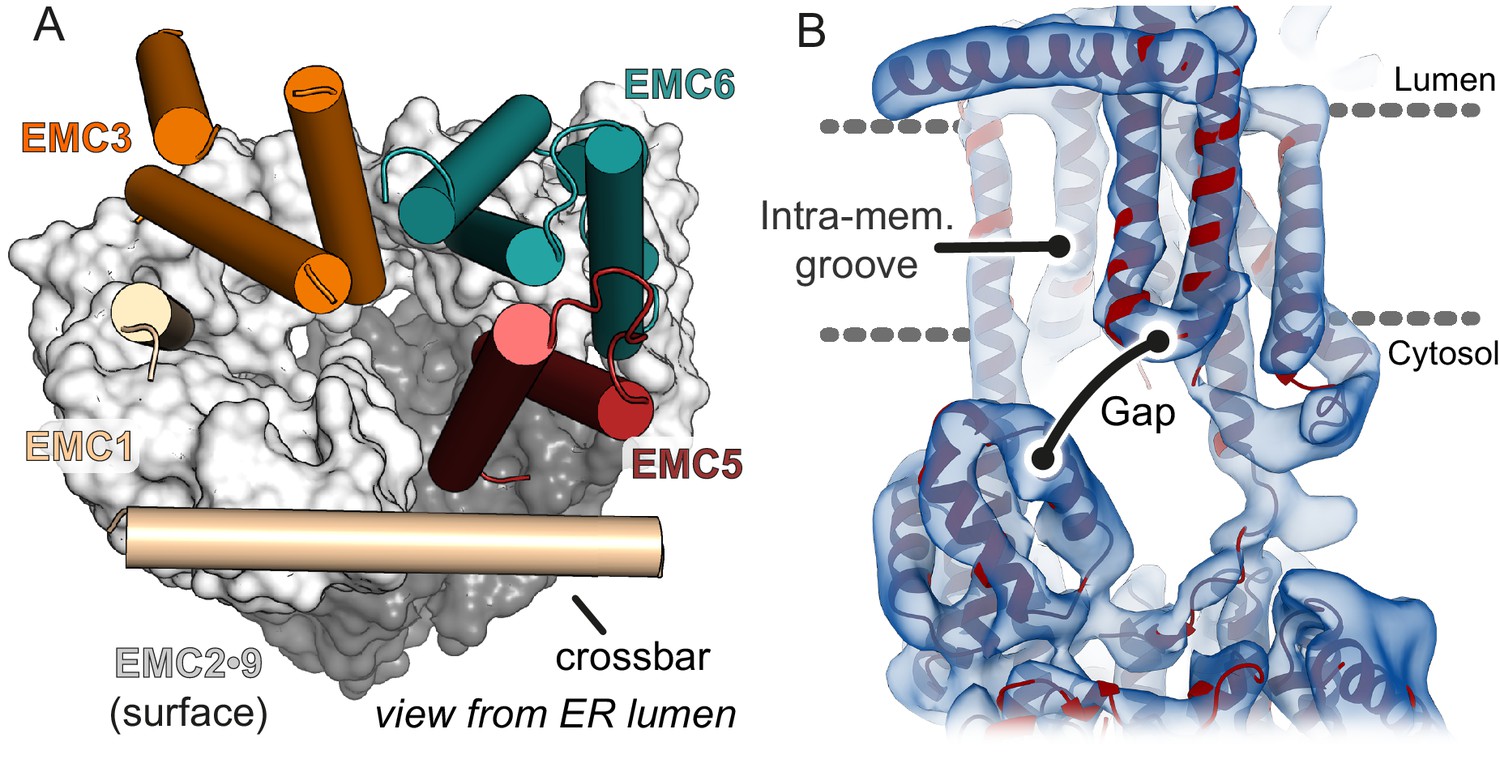
The cytosolic vestibule leads into an intramembrane groove.
(A) The cytosolic vestibule in EMC2•EMC9 (grey surface) is contiguous with a horseshoe-shaped intramembrane groove lined by the TMDs of EMC1, EMC3, EMC5, and EMC6. The lumenal domain of EMC and the TMDs of EMC7 and EMC4 are not shown for clarity. (B) Fitting the composite EMC model (red) into cryo-EM density (blue) reveals a ~ 6–12 Å gap between the cytosolic and membrane domains of EMC. A substrate with a TMD in the intramembrane groove can be released from EMC with the cytosolic flanking polypeptide passing through this gap.
Figure 7
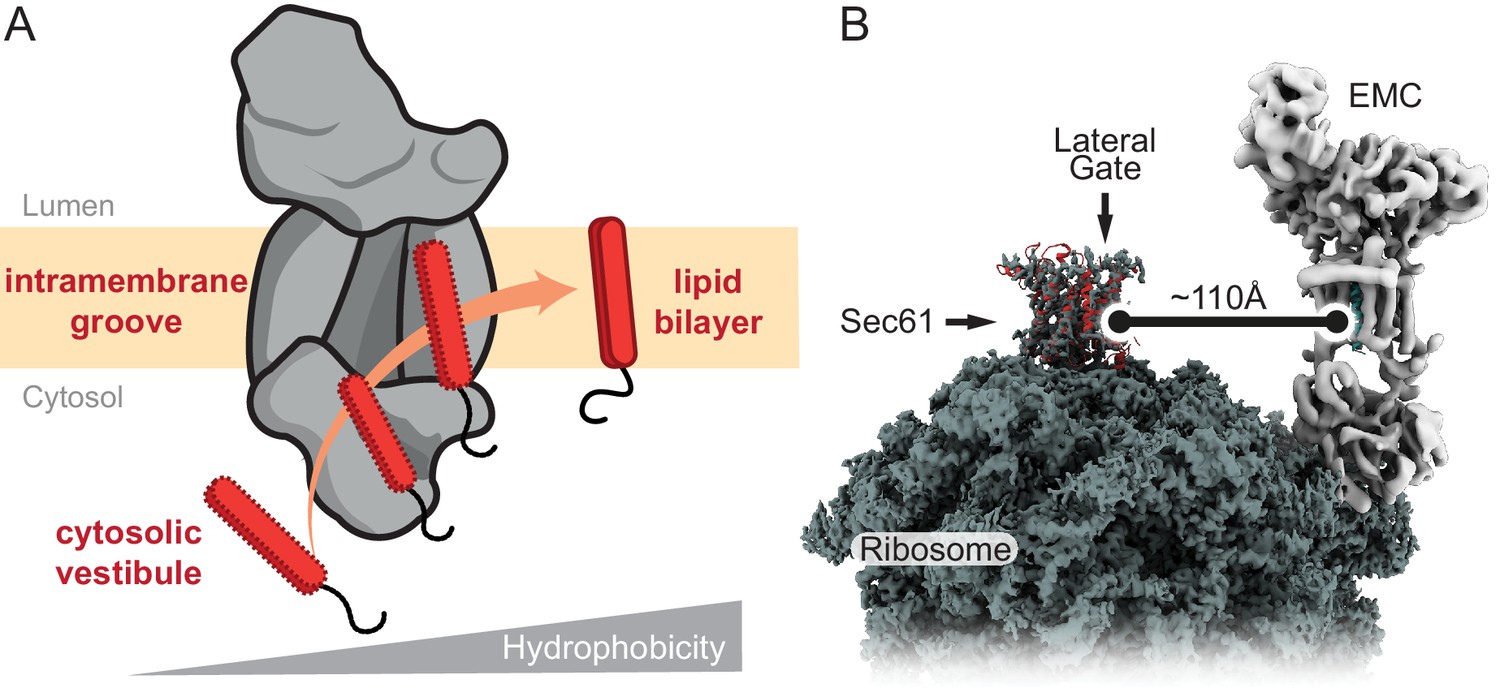
Model for EMC-mediated TMD insertion.
(A) TMDs follow a gradient of increasing hydrophobicity from the cytosol through EMC and into the lipid bilayer. TMDs first enter the cytosolic vestibule formed by either the EMC2•EMC8 or EMC2•EMC9 complex. This vestibule leads into an intramembrane groove that is laterally open toward the lipid bilayer. (B) The ribosome-Sec61 complex is depicted with EMC at the same scale in the same membrane plane. The minimum distance from the Sec61 lateral gate to the intramembrane groove of EMC is ~110 Å. This implies that EMC can only mediate TMD insertion before ribosomes bind to Sec61 or if the polypeptide downstream of a TMD can span this distance. EMC cannot capture TMDs at the Sec61 lateral gate.
Tables
Table 1
X-ray data collection and refinement statistics.
| EMC2•EMC9 | EMC2•EMC9 | |
|---|---|---|
| (S-SAD phasing) | (Molecular replacement) | |
| Data collection | ||
| X-ray source | Diamond I23 | Diamond I03 |
| X-ray wavelength (Å) | 2.7552 | 0.9763 |
| Space group | P212121 | P212121 |
| Unit cell parameters | ||
| a, b, c (Å) | 53.2 82.8 124.0 | 52.6 84.9 122.6 |
| α, β, γ (°) | 90.0 90.0 90.0 | 90.0 90.0 90.0 |
| Resolution range (Å) | 49.6–2.65 (2.78–2.65) | 49.7–2.20 (2.27–2.2) |
| No. of reflections | ||
| Total | 668148 (73113) | 1486886 (128644) |
| Unique | 16468 (2109) | 28668 (2433) |
| Completeness (%) | 99.7 (98.9) | 100.0 (100.0) |
| Multiplicity | 40.6 (34.7) | 51.9 (52.9) |
| I/σ(I) | 36.8 (1.8) | 17.6 (1.9) |
| Rmeas (%) | 6.4 (214.6) | 17.2 (465.7) |
| Rmerge (%) | 6.3 (211.5) | 17.0 (461.3) |
| Rpim (%) | 1.0 (35.3) | 2.4 (63.7) |
| CC1/2 (%) | 100.0 (81.7) | 100.0 (92.6) |
| Refinement | ||
| Rwork/Rfree (%) | - | 20.3/25.0 |
| RMS deviations | ||
| Bond length (Å) | - | 0.007 |
| Bond angle (°) | - | 0.848 |
| No. of atoms | ||
| Protein | - | 3454 |
| Ligands | - | 72 |
| Water | - | 80 |
| Average B-factors (Å2) | ||
| Total | - | 70.6 |
| Protein | - | 71.7 |
| Ligands and waters | - | 65.4 |
| Ramachandran (%) | ||
| Favored | - | 96.4 |
| Outliers | - | 0.0 |
| PDB Code: | - | 6Y4L |
-
*(*) Values in brackets are for the highest resolution bin.
Table 2
Cryo-EM data collection and processing.
| Dataset 1 | Dataset 2 | Dataset 3 | Dataset 4 | Dataset 5 | |
|---|---|---|---|---|---|
| Microscope | Titan Krios (m06 eBIC) | Titan Krios (m06 eBIC) | Titan Krios (m06 eBIC) | Titan Krios (MRC-LMB) | Titan Krios (MRC-LMB) |
| Pixel Size | 1.380 | 1.380 | 1.380 | 1.179 | 1.390 |
| Voltage | 300 | 300 | 300 | 300 | 300 |
| Spherical Aberation | 2.7 | 2.7 | 2.7 | 2.7 | 2.7 |
| Total exposure (e-/Å2) | 39.60 | 42.50 | 37.77 | 39.36 | 44.36 |
| Exposure Length (s) | 5.0 | 11.02 | 14 | 11 | 11 |
| Frames | 25 | 44 | 40 | 44 | 40 |
| Defocus Range (µm) | −0.5 to −1.5 | −0.5 to −1.5 | −0.5 to −1.5 | −0.5 to −1.5 | −0.5 to −1.5 |
| Micrographs | 2776 | 2484 | 1206 | 4228 | 932 |
| Microscope tilt (degrees) | 0 | 0 | 30 | 20 | 20 |
| Volta Phase Plate | ✓ | ✓ | ✓ | ✓ | ✓ |
| Pre-merge processing | Dataset 1 | Dataset 2 | Dataset 3 | Dataset 4 | Dataset 5 |
| Motion Correction and CTF estimation (micrographs) | 2776 | 2484 | 1206 | 4228 | 932 |
| Blob-based autopicking (particles) | 1,298,488 | 541,233 | 319,989 | 1,145,157 | 223,613 |
| 2x iterations of 2D classification (particles) | 63,180 | 63,315 | 51,371 | 305,685 | 28,662 |
| Template based autopicking (particles) | 467,323 | 687,645 | 826,006 | N/A | 273,852 |
| 2D classification (particles) | 11,862 | 71,977 | 63,881 | 113,852 | 66,799 |
| Ab Initio 3D classification (particles) | 103,105 | 71,977 | 46,349 | 113,852 | 50,232 |
| Post-merge processing | Combined Datasets | ||||
| 2x Iterations ab initio 3D classification (particles) | 405,515 | ||||
| Non-uniform Refinement (particles) | 167,294 | ||||
| Per-particle CTF refinement | 6.71 Å map | ||||
| Non-uniform refinement with local resolution estimation and filtering | 6.4 Å map | ||||
| EMDB Deposition code | EMD-11058 | ||||
Table 3
EM refinement statistics.
| Resolution for refinement (Å) | 6.4 |
| CCMask | 0.72 |
| RMS deviations | |
| Bond length (Å) | 0.005 |
| Bond angle (°) | 1.028 |
| No. of atoms | 9412 |
| Protein residues | 1906 |
| Ramachandran Outliers (%) | 0.49 |
| Mean B-factors (2) | 200.0 |
| MolProbity score | 2.77 |
| Clash score | 31.03 |
| PDB code | 6Z3W |
Key resources table
| Reagent type (species) or resource | Designation | Source or reference | Identifiers | Additional information |
|---|---|---|---|---|
| Strain, strain background (E. coli) | BL21 NEB Express competent cells | New England Biolabs | Cat# C2523 | |
| Cell line (Homo-sapiens) | HEK293 TRex EMC5-FLAG | Guna et al., 2018 | MBP04 | EMC5-FLAG (see below) integrated into FRT site of HEK293 TRex-Flp-in cell line. Adapted for growth in FreeStyle suspension media |
| Cell line (Homo-sapiens) | HEK293 TRex GFP-P2A-RFP-SQS | Chitwood et al., 2018 | ||
| Cell line (Homo-sapiens) | HEK293 TRex OPRK-GFP-P2A-RFP | Chitwood et al., 2018 | ||
| Cell line (Homo-sapiens) | HEK293T | ATCC | ATCC-CRL-3216 | |
| cell line (Homo-sapiens) | U2OS Flp-in TRex | Volkmar et al., 2019 | ||
| Cell line (Homo-sapiens) | U2OS Flp-in TRex ∆EMC2 | Volkmar et al., 2019 | EMC2 disrupted using CRISPR-Cas9 | |
| Antibody | ANTI-FLAG M2 Affinity Gel (mouse monoclonal) | Sigma | Cat# A4596 | |
| Antibody | Mouse monoclonal ANTI-FLAG M2-HRP conjugated | Sigma | Cat# A8592, RRID:AB_439702 | WB (1:10000) |
| Antibody | Rabbit polyclonal EMC1 | Thermo Fisher Scientific | Cat# A305-605A-M, RRID:AB_2782763 | WB (1:1000), IP (0.1 µg/sample) |
| Antibody | Rabbit polyclonal EMC4 | Thermo Fisher Scientific | Cat# A305-752A-M, RRID:AB_2782909 | IP (0.4 µg/sample) |
| Antibody | Rabbit polyclonal EMC4 (TMEM85) | Abcam | Cat# ab123719, RRID:AB_10951091 | WB (1:1000) |
| Antibody | Rabbit polyclonal EMC5 (MMGT1) | Abcam | Cat# ab174366, RRID:AB_2750837 | WB (1:1000) |
| Antibody | Rabbit polyclonal EMC6 (TMEM93) | Abcam | Cat# ab84902, RRID:AB_1925516 | WB (1:1000) |
| Antibody | Rabbit polyclonal EMC7 (C15orf24) | Proteintech | Cat# 27550–1-AP | WB (1:3000) |
| Antibody | Rabbit polyclonal EMC7 | Thermo Fisher Scientific | Cat# A305-678A-M, RRID:AB_2782836 | WB (1:1000) |
| Antibody | Rabbit polyclonal Calnexin N-terminus | Enzo Life Sciences | Cat# ADI-SPA-865, RRID:AB_10618434 | WB (1:5000) |
| Antibody | Rabbit polyclonal HA tag | This paper | Custom antibody raised against HA peptide conjugated to KLH. | WB (1:5000) |
| Recombinant DNA reagent | pET28a-6xHIS-SUMO-EMC2 | This paper | Human EMC2, Residues 1–297 | |
| Recombinant DNA reagent | pET21-EMC2-6xHIS | This paper | Human EMC2, Residues 1–297 | |
| Recombinant DNA reagent | pET28a-6xHIS-SUMO-EMC8 | This paper | Human EMC8, Residues 1–210 | |
| Recombinant DNA reagent | pET21-EMC9-6xHIS | This paper | Human EMC9, Residues 1–208 | |
| Recombinant DNA reagent | pET21-EMC2-6xHIS | This paper | Human EMC2, Residues 11–274, for crystallization | |
| Recombinant DNA reagent | pET21-EMC9-6xHIS | This paper | Human EMC9, Residues 1–200 for crystallization | |
| Recombinant DNA reagent | pET28a-6xHIS-ULP | This paper | Yeast ULP1 protease (Uniprot: Q02724), Residues 403–621, for SUMO cleavage | |
| Recombinant DNA reagent | SEC61-SQS(amber)−3 F4 | Guna et al., 2018 | T7-based PURExpress plasmid (New England Biolabs), SQS TMD residues 378–410, Amber mutation at F389 | |
| Recombinant DNA reagent | SQS(amber)−3 F4 | This paper | T7-based PURExpress plasmid (New England Biolabs), SQS TMD residues 378–410, Amber mutation at F389 | |
| Recombinant DNA reagent | Clonetech-GFP-P2A-RFP-SQS | Guna et al., 2018 | ||
| Recombinant DNA reagent | pcDNA5-EMC2-3xHA | This paper | Human EMC2, Residues1–297, Tet operator removed with Sac1 | |
| Recombinant DNA reagent | pEVOL-pBpF | Chin et al., 2002 | ||
| Recombinant DNA reagent | pcDNA5/FRT/TO-EMC3-Xamb-3xFLAG | This paper | Human EMC3 with an amber codon at position X and a C-terminal 3xFLAG tag. Individual constructs where X = 23, 24, 25, 26, 71, 124, 125, 126, 127, 172, 173, 174, and 175 were produced. | |
| Recombinant DNA reagent | pcDNA5/FRT/TO- EMC5-Xamb-3xFLAG | This paper | Human EMC5 with an amber codon at position X and a C-terminal 3xFLAG tag. Individual constructs where X = 14, 15, 16, 17, 54, 55, 56, and 57 were produced. | |
| Recombinant DNA reagent | pcDNA5/FRT/TO-3xFLAG-EMC6-Xamber | This paper | Human EMC6 with an amber codon at position X and an N-terminal 3xFLAG tag. Individual constructs where X = 58, 59, 60, 61, 94, 95, 96, and 97 were produced. | |
| Recombinant DNA reagent | pAS-Pyl-AF | This paper | Methanosarcina mazei pyrrolysyl-tRNA synthetase with Y306A/Y384F mutations and its cognate tRNA carrying a U25C mutation | |
| Recombinant DNA reagent | pcDNA5/FRT/TO-3xHA-EMC4 | This paper | Human EMC4 with an N-terminal 3xHA tag | |
| Recombinant DNA reagent | pcDNA5/FRT/TO-EMC4-3xHA | This paper | Human EMC4 with a C-terminal 3xHA tag | |
| Sequence-based reagent | siRNA #1 against EMC3 | Ambion | Custom synthesis | GGCACUAGAUGAUGUCGAAtt |
| Sequence-based reagent | siRNA #2 against EMC3 | Ambion | Custom synthesis | CCUACUAUGUUGACAGACAtt |
| Sequence-based reagent | siRNA #1 against EMC8 | Ambion | Custom synthesis | AGAUCAUAGCUACGUGAUUtt |
| Sequence-based reagent | siRNA #2 against EMC8 | Ambion | Custom synthesis | GCUGGUUAUUAUCAAGCUAtt |
| Sequence-based reagent | siRNA #1 against EMC9 | Ambion | Custom synthesis | GUACUUAUUAUGUUGGAUAtt |
| Sequence-based reagent | siRNA #2 against EMC9 | Ambion | Custom synthesis | AUGCAGCUGUGAACGAUCAtt |
| Peptide, recombinant protein | 3X FLAG Peptide | Sigma-Aldrich | Cat# F4799 | |
| Peptide, recombinant protein | Human SGTA | Shao et al., 2017 | ||
| Peptide, recombinant protein | Human CaM | Shao et al., 2017 | ||
| Peptide, recombinant protein | Human EMC2 | This paper | Purified from NEB BL21express cells | |
| Peptide, recombinant protein | Human EMC8 | This paper | Purified from NEB BL21express cells | |
| Peptide, recombinant protein | Human EMC9 | This paper | Purified from NEB BL21express cells | |
| Peptide, recombinant protein | ULP1 Protease | This paper | Purified from NEB BL21express cells | |
| Commercial assay or kit | PURE in vitro translation system | Shao et al., 2017 | ||
| Chemical compound, drug | deoxy big CHAP (DBC) | Anatrace | Cat# 256455 | |
| Chemical compound, drug | Lauryl Maltose Neopentyl Glycol (LMNG) | Anatrace | Cat# NG310 5 GM | |
| Chemical compound, drug | Bpa | BACHEM | Cat# 4017646 | |
| Chemical compound, drug | AbK | Iris Biotech GmbH | Cat# HAA3110 | |
| Software, algorithm | CryoSPARC version 2.12.4. | Punjani et al., 2017 | RRID:SCR_016501 | |
| Software, algorithm | UCSF ChimeraX Version 1.0 | Goddard et al., 2018 | RRID:SCR_015872 | |
| Software, algorithm | trRosettta Structure Prediction Server | Yang et al., 2020 | ||
| Software, algorithm | PHENIX Version 1.17 | Adams et al., 2010; Afonine et al., 2018 | RRID:SCR_014224 | |
| Software, algorithm | Coot Version 0.9-pre | Emsley et al., 2010 | RRID:SCR_014222 | |
| Software, algorithm | XDS Version 20190315 | Kabsch, 2010 | RRID:SCR_015652 | |
| Software, algorithm | PyMol Version 2.1 | DeLano Scientific LLC | RRID:SCR_000305 | |
| Software, algorithm | DIALS Version 2.2 | Winter et al., 2018 | ||
| Software, algorithm | BLEND CCP4i 7.0.076 | Foadi et al., 2013 | ||
| Software, algorithm | Pointless CCP4i 7.0.076 | Evans and Murshudov, 2013 | RRID:SCR_014218 | |
| Software, algorithm | Aimless CCP4i 7.0.076 | Evans, 2011 | RRID:SCR_015747 | |
| Software, algorithm | SHELXD Version 2013/2 | Sheldrick, 2008 | ||
| Software, algorithm | FlowJo Version 9.9.6 | FlowJo, LLC | RRID:SCR_008520 | |
| Software, algorithm | FlexEM | Topf et al., 2008 | ||
| Other | 1.2/1.3 UltrAu Foil grids | Quantifoil | Direct Order Form System | |
| Other | Au 200 2/2 grids | Quantifoil | Direct Order Form System | |
| Other | HEK293 FreeStyle culture media | ThermoFisher Scientific | Cat# 12338001 | For HEK293 suspension adapted cell growth |
Additional files
Download links
A two-part list of links to download the article, or parts of the article, in various formats.
Downloads (link to download the article as PDF)
Open citations (links to open the citations from this article in various online reference manager services)
Cite this article (links to download the citations from this article in formats compatible with various reference manager tools)
The architecture of EMC reveals a path for membrane protein insertion
eLife 9:e57887.
https://doi.org/10.7554/eLife.57887


