Stress-activated MAPK signaling controls fission yeast actomyosin ring integrity by modulating formin For3 levels
- Yeast Physiology Group, Departamento de Genética y Microbiología, Facultad de Biología. Universidad de Murcia, Spain
- Instituto de Biología Funcional y Genómica (IBFG), Consejo Superior de Investigaciones Científicas, Universidad de Salamanca, Spain
Figures
Figure 1 with 6 supplements
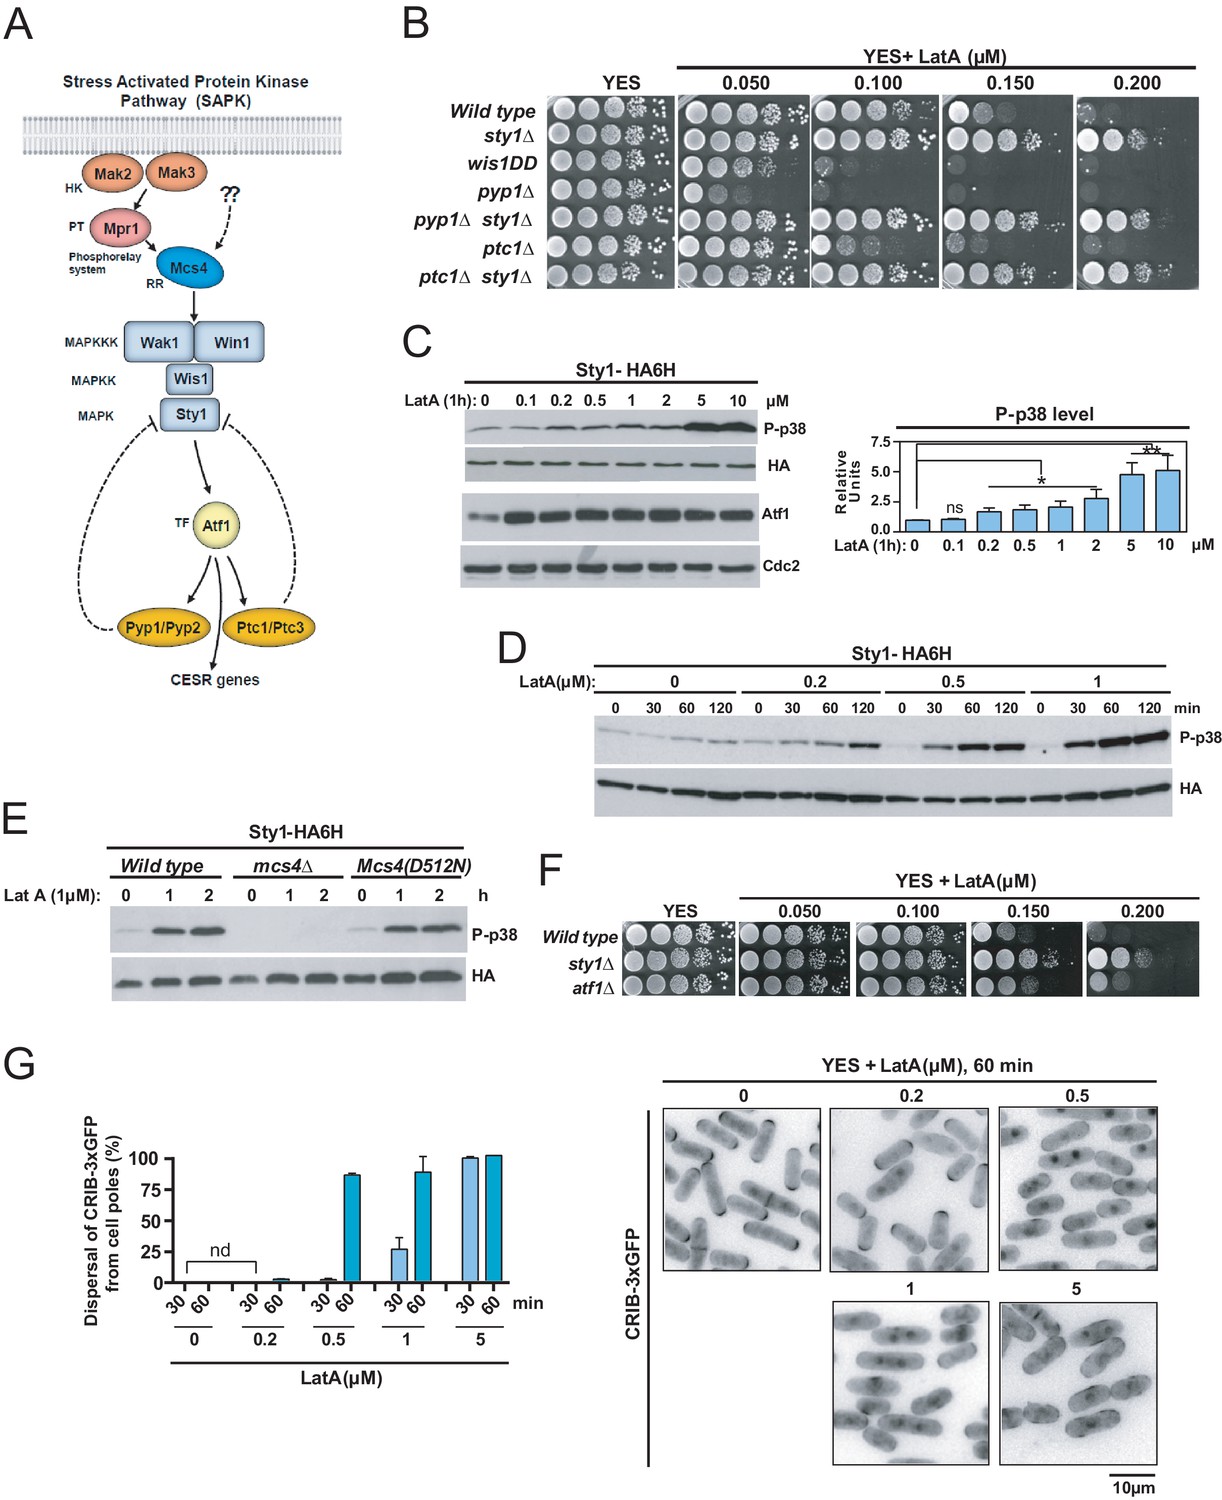
The SAPK pathway becomes activated and negatively controls S. pombe growth in the presence of low Latrunculin A concentrations.
(A) The stress activated MAPK pathway (SAPK) in S. pombe. Please see text for a detailed description of its main components and functions. (B) Decimal dilutions of strains of the indicated genotypes were spotted on YES and YES solid plates with a range of concentrations of LatA, incubated at 30°C for 3 days, and photographed. A representative experiment is shown. (C) Left panel: S. pombe wild type cells expressing a genomic Sty1-HA6his fusion were grown in YES medium to mid-log phase, and remained untreated (0), or treated with a range of concentrations of LatA for 1 hr. Activated/total Sty1 were detected with anti-phospho-p38 and anti-HA antibodies, respectively. Total Atf1 levels were detected with anti-Atf1 antibody. Anti-Cdc2 was used as a loading control. Right panel: Relative units as mean ± SD (biological triplicates) for Sty1 phosphorylation (anti-phospho-p38 blot) were determined with respect to the internal control (anti-HA blot). **, p<0.005; *, p<0.05; ns, not significant, as calculated by unpaired Student's t test. (D) S. pombe wild-type cells expressing a genomic Sty1-HA6his fusion were grown in YES medium to mid-log phase, and remained untreated (0), or treated with a range of concentrations of LatA for the indicated times. Activated/total Sty1 were detected with anti-phospho-p38 and anti-HA antibodies, respectively. (E) S. pombe wild type, mcs4∆ and Mcs4(D512N) cells expressing a genomic Sty1-HA6his fusion were grown in YES medium to mid-log phase, and treated with 1 µM LatA for the indicated times. Activated/total Sty1 were detected with anti-phospho-p38 and anti-HA antibodies, respectively. A representative experiment is shown. (F) Decimal dilutions of strains of the indicated genotypes were spotted on YES and YES solid plates with a range of concentrations of LatA, incubated at 30°C for 3 days, and photographed. (G) S. pombe wild-type cells expressing a CRIB-3xGFP fusion were grown in YES medium to mid-log phase, and remained untreated (0) or treated with a range of concentrations of LatA for 30 and 60 min. Left panel: The percentage of cells at G1 and G2 that show dispersal of the CRIB-3xGFP fusion from the cell poles was estimated in each case by fluorescence microscopy, and is presented as mean ± SD (biological duplicates). nd: no dispersal from the cell poles is detected. Right panel: representative fluorescence micrographs of control and LatA-treated cells.
-
Figure 1—source data 1
Values used for graphical representations and statistical analysis in Figure 1.
- https://cdn.elifesciences.org/articles/57951/elife-57951-fig1-data1-v2.xlsx
Figure 1—figure supplement 1
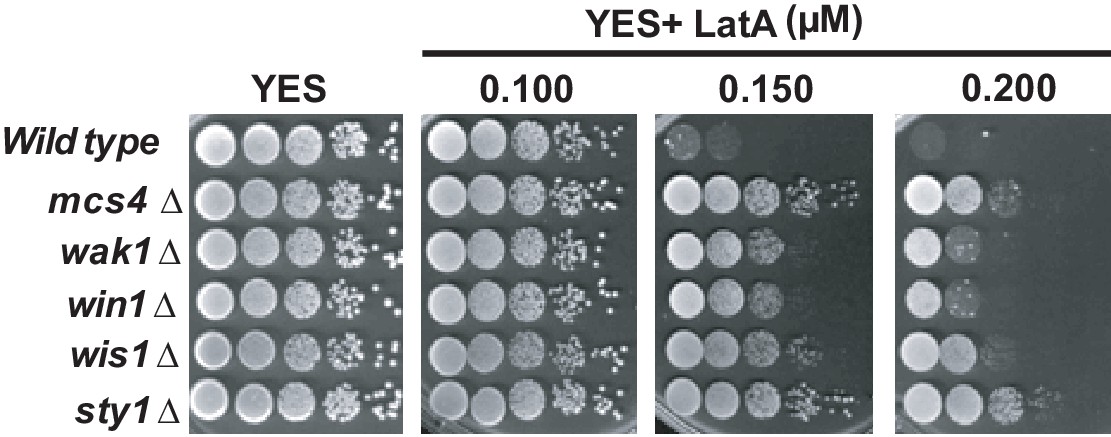
Growth of SAPK null mutants in the presence of LatA.
Decimal dilutions of strains of the indicated genotypes were spotted on YES and YES solid plates with a range of concentrations of LatA, incubated at 30°C for 3 days, and photographed.
Figure 1—figure supplement 2
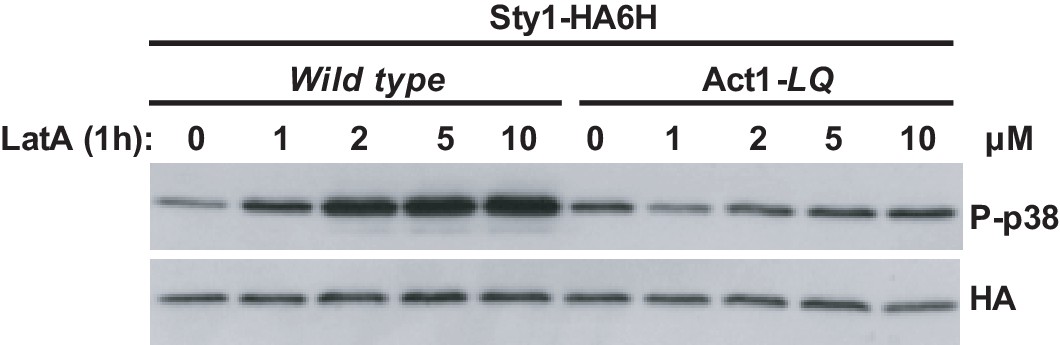
Sty1 activation with LatA in wild type cells vs a LatA-insensitive mutant.
S. pombe wild-type and Act1-LQ (LatA-insensitive mutant) cells expressing a genomic Sty1-HA6his fusion were grown in YES medium to mid-log phase, and remained untreated (0), or treated with the indicated concentrations of LatA for 1 hr. Activated/total Sty1 were detected with anti-phospho-p38 and anti-HA antibodies, respectively. Results from a representative experiment are shown.
Figure 1—figure supplement 3
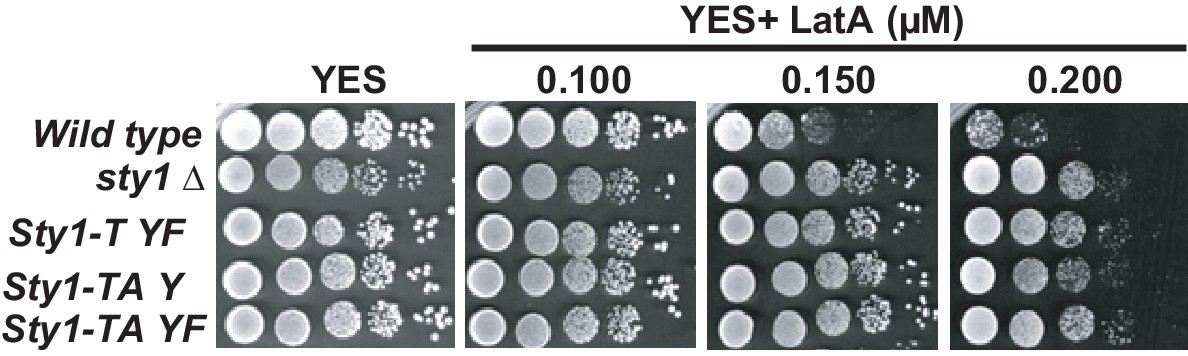
Growth of Sty1 phosphorylation mutants in the presence of LatA.
Decimal dilutions of sty1Δ cells expressing either dually phosphorylated (wild type), threonine monophosphorylated (Sty1-T YF), tyrosine monophosphorylated (Sty1-TA Y), or unphosphorylated (Sty1-TA YF) Sty1 versions were spotted on YES and YES solid plates with a range of concentrations of LatA, incubated at 30°C for 3 days, and photographed.
Figure 1—figure supplement 4
Effect of LatA on growth of a plasma membrane-bound Sty1 mutant.
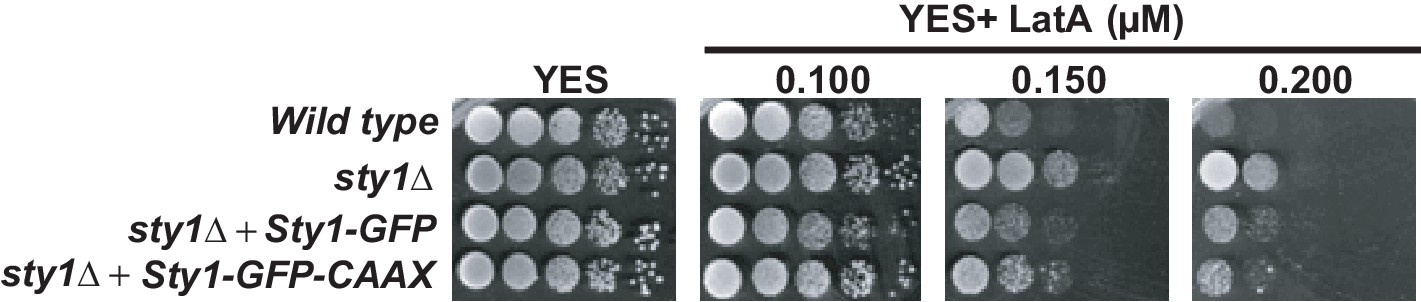
Decimal dilutions of sty1Δ cells expressing either nucleo-cytoplasmic (Sty1-GFP) and constitutive plasma-membrane bound (Sty1-GFP-CAAX) GFP-fused Sty1 versions were spotted on YES and YES solid plates with a range of concentrations of LatA, incubated at 30°C for 3 days, and photographed.
Figure 1—figure supplement 5
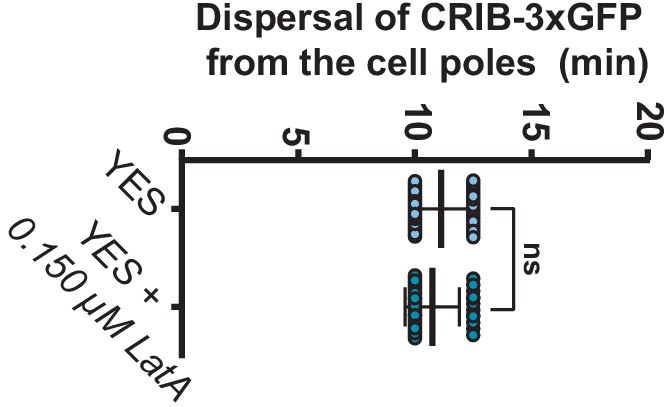
Dispersal of active Cdc42 from the cell poles in the presence or absence of LatA.
Time of dispersal of the CRIB-3xGFP fusion from the cell poles after initial SPB separation was estimated in exponentially growing S. pombe cells (n > 40) expressing Pcp1-mCherry (SPB marker; reference for mitotic onset) and Rlc1-mCherry fusions by time-lapse microscopy (time interval: 2.5 min) in the presence or absence of 0.15 µM LatA. Data as presented as dot plots (biological triplicates) with mean ± SD. ns, not significant, as calculated by unpaired Student´s t test.
Figure 1—figure supplement 6
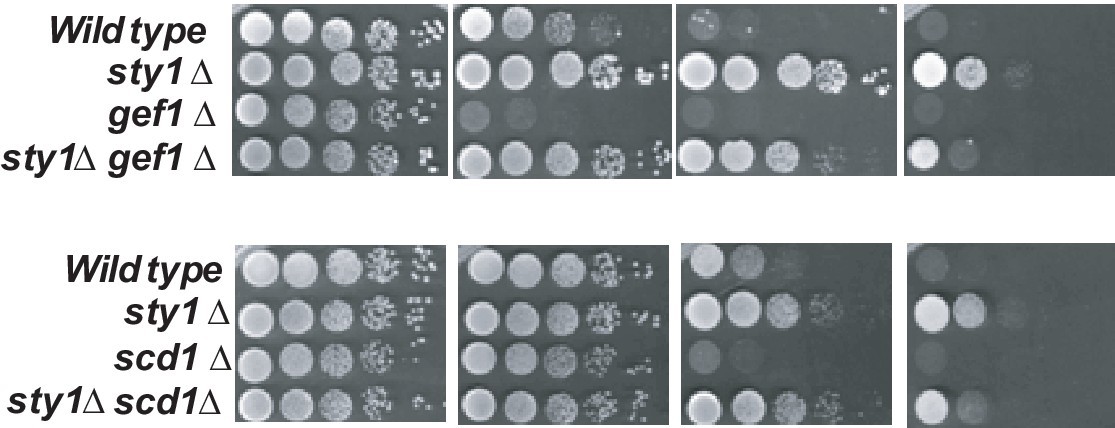
Sty1 deletion alleviates LatA-sensitivity of mutants lacking Cdc42 GEF´s.
Decimal dilutions of strains of the indicated genotypes were spotted on YES and YES solid plates with a range of concentrations of LatA, incubated at 30°C for 3 days, and photographed.
Figure 2 with 5 supplements
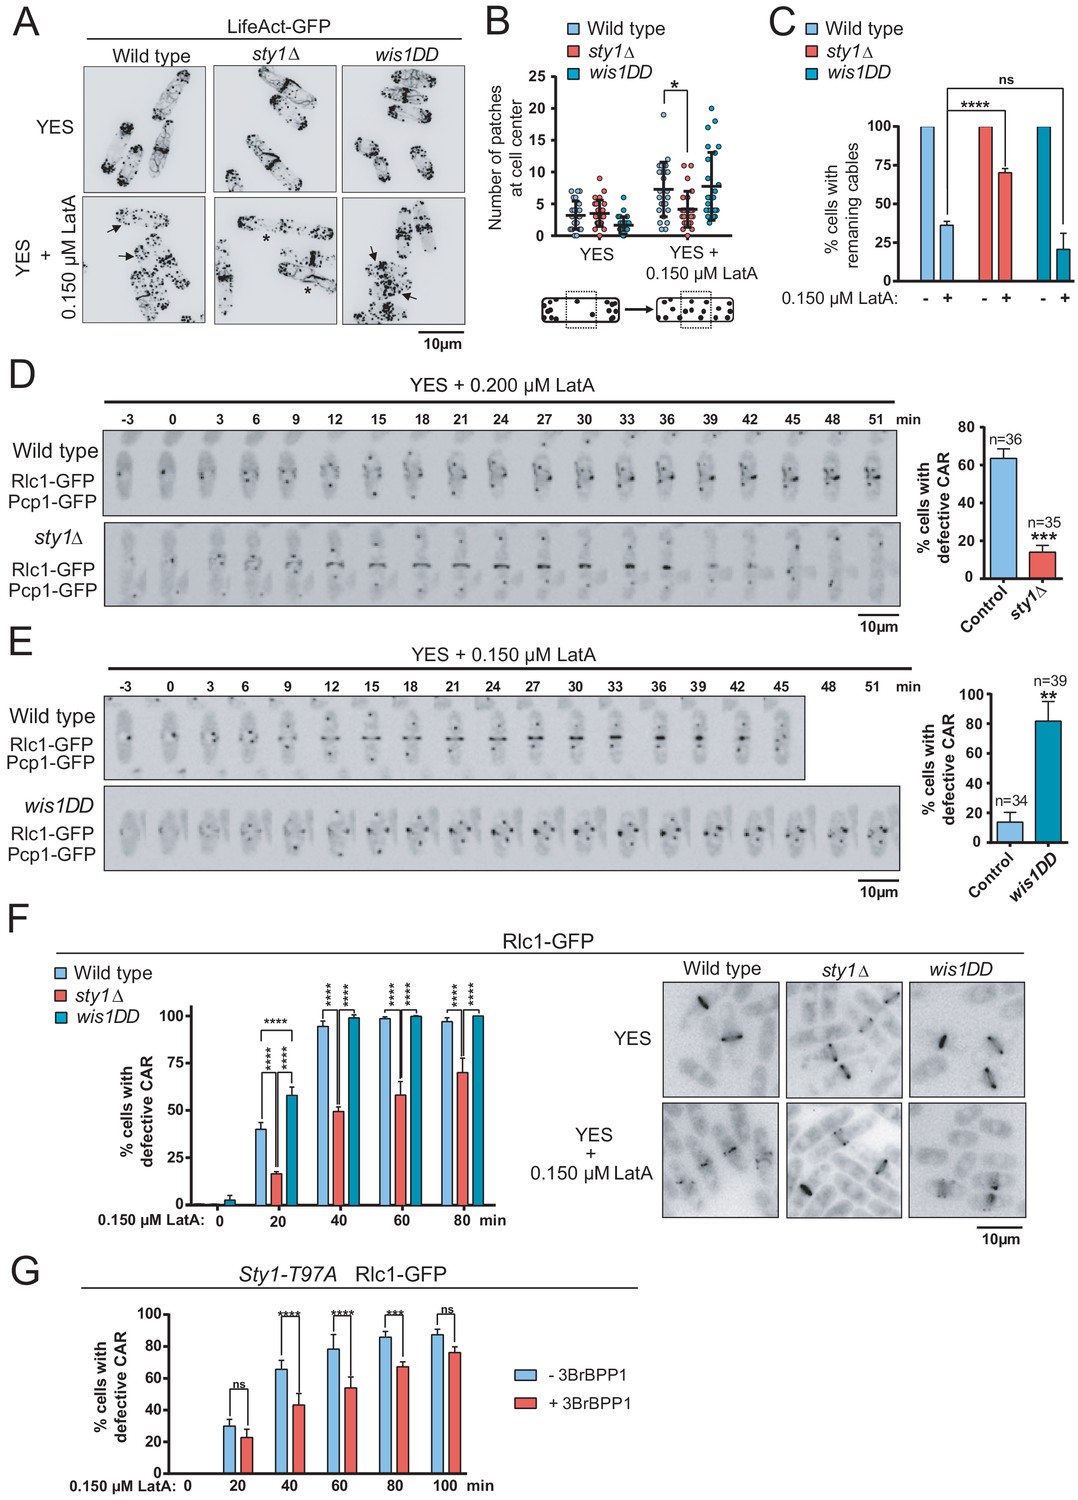
The SAPK pathway negatively regulates CAR assembly in response to cytoskeletal perturbations induced with LatA.
(A) Representative maximum-projection images of S. pombe wild type, sty1∆ and wis1DD cells expressing the F-actin marker LifeAct-GFP growing in YES medium to mid-log phase, and remained untreated (0), or treated with 0.15 µM LatA for 30 min. Arrows indicate cells with depolarized actin patches, whereas asterisks show cells with persistent actin cables. (B) The number of actin patches at the medial region of interphasic G2 cells (n = 25) expressing the F-actin marker LifeAct-GFP was quantified in wild type, sty1∆ and wis1DD cultures described in (A) with or without 0.15 µM LatA treatment (30 min), and is represented as a dot plot with mean ± SD. *, p<0.05, as calculated by unpaired Student's t test. (C) The percentage of cells with actin cables (n > 100) was quantified in wild-type, sty1∆ and wis1DD cultures described in (A) during unperturbed growth (-) and after 0.15 µM LatA treatment for 30 min (+), and is represented as mean ± SD (biological triplicates). ****, p<0.0001; ns, not significant, as calculated by unpaired Student's t test. (D) Representative time-lapse maximum-projection images of Rlc1-GFP dynamics at the equatorial region of S. pombe wild-type and sty1∆ cells growing in YES medium to mid-log phase in the presence of 0.2 µM LatA. Mitotic progression was monitored using Pcp1-GFP-marked SPBs. Time interval is 3 min. Right: the percentage of cells that show damaged/defective CAR was estimated for each strain (n> 35) and is presented as mean ± SD (biological triplicates). ***, p<0.001, as calculated by unpaired Student's t test. (E) Representative time-lapse maximum-projection images of Rlc1-GFP dynamics at the equatorial region of S. pombe wild type and wis1DD cells growing in YES medium to mid-log phase in the presence of 0.15 µM LatA. Mitotic progression was monitored using Pcp1-GFP-marked SPBs. Time interval is 3 min. Right: the percentage of cells that show damaged/defective CAR was estimated for each strain (n> 34) and is presented as mean ± SD (biological triplicates). **, p<0.01, as calculated by unpaired Student's t test. (F) S. pombe wild type, sty1∆ and wis1DD cells expressing a Rlc1-GFP genomic fusion were grown in YES medium to mid-log phase, and remained untreated (0) or treated with 0.15 µM LatA for the indicated times. Left panel: the percentage of cells that show damaged CAR was estimated in each case by fluorescence microscopy (n > 200), and is presented as mean ± SD (biological triplicates). ****, p<0.0001; ns, not significant, as calculated by unpaired Student's t test. Right panel: representative images of cells from the above strains growing in YES medium either untreated or after treatment with 0.15 µM LatA for 40 min. (G) S. pombe Sty1-T97A (analogue sensitive) cells expressing a Rlc1-GFP genomic fusion were grown in YES medium to early log-phase, incubated with 10 µM 3BrBPP1 or with the solvent alone (methanol) for 8 hr, and then treated with 0.15 µM LatA during the indicated times. The percentage of cells that show damaged CAR was estimated in each case by fluorescence microscopy (n > 200), and is presented as mean ± SD (biological triplicates). ****, p<0.0001; ***, p<0.001; ns, not significant, as calculated by unpaired Student's t test.
-
Figure 2—source data 1
Values used for graphical representations and statistical analysis in Figure 2.
- https://cdn.elifesciences.org/articles/57951/elife-57951-fig2-data1-v2.xlsx
Figure 2—figure supplement 1
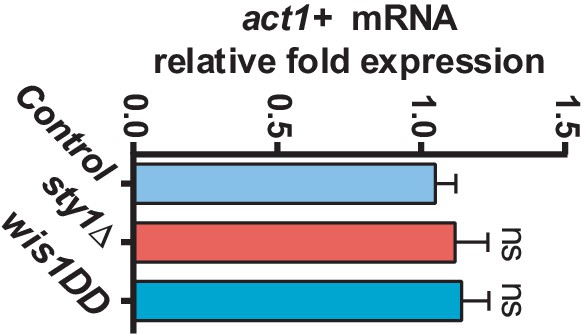
act1+ mRNA levels in SAPK mutants.
mRNA levels of the act1+ gene were measured by qPCR from total RNA extracted from cell samples corresponding to S. pombe wild-type, sty1Δ, and wis1DD strains growing exponentially in YES medium. Results are shown as relative fold expression (mean ± SD) from three biological repeats. ns, not significant, as calculated by unpaired Student's t test.
Figure 2—figure supplement 2
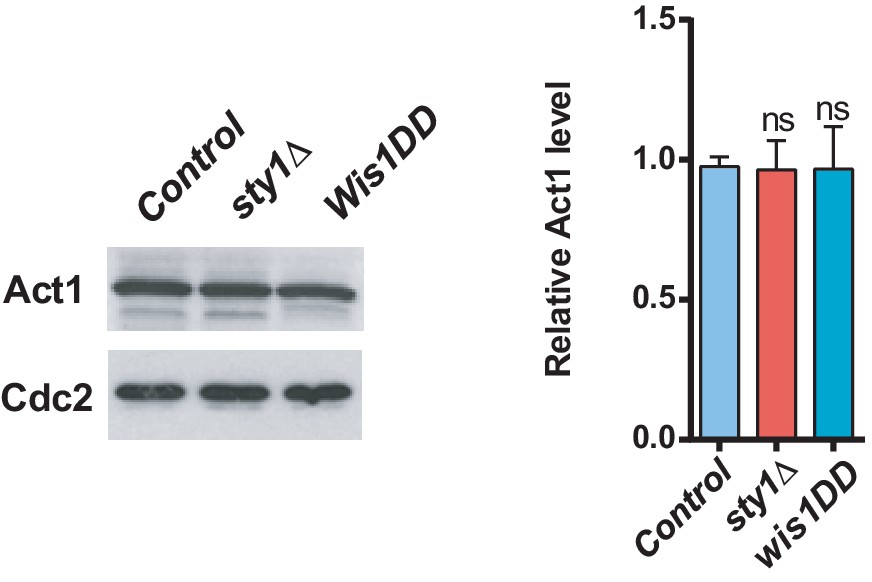
Act1 protein levels in SAPK mutants.
Total extracts from growing cultures of wild-type, sty1Δ, and wis1DD strains were resolved by SDS-PAGE, and total Act1 levels were detected by incubation with anti-actin antibody. Anti-Cdc2 was used as a loading control. Right panel: results are shown as relative fold expression (mean ± SD) from three biological repeats. ns, not significant, as calculated by unpaired Student´s t test.
Figure 2—figure supplement 3
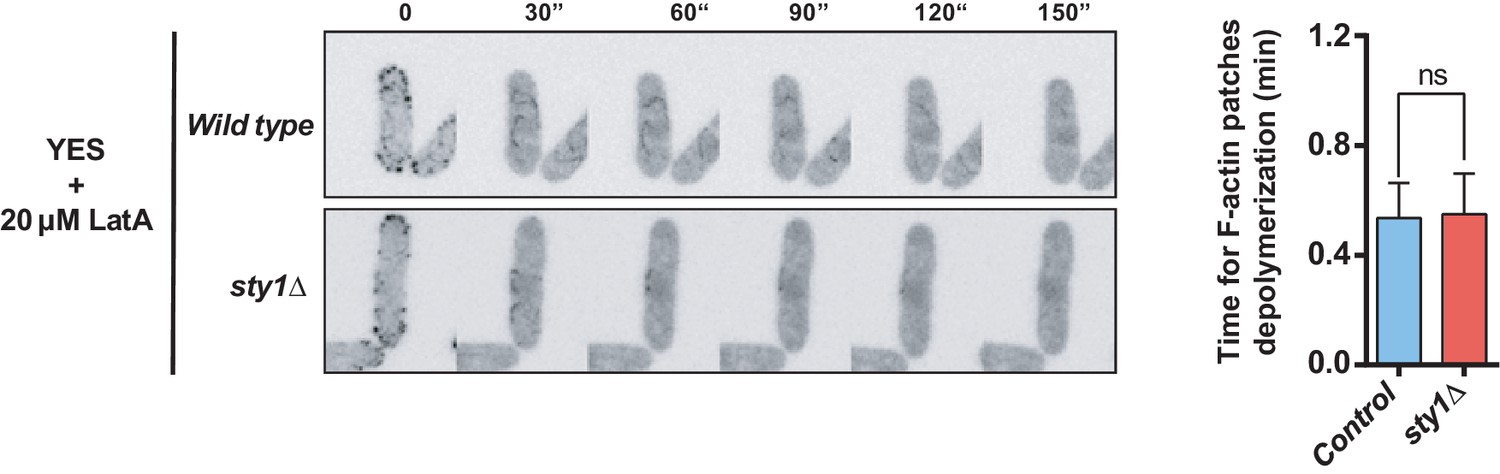
LatA-induced depolymerization of F-actin patches in wild-type versus sty1Δ cells.
Representative time-lapse maximum-projection images showing depolymerization of actin patches in growing S. pombe wild-type and sty1Δ cells expressing the F-actin marker LifeAct-GFP in the presence of 20 µM LatA. The time for complete actin patches depolymerization was determined (n > 70 cells of each strain), and is presented as mean ± SD (biological triplicates). ns, not significant, as calculated by unpaired Student's t test.
Figure 2—figure supplement 4
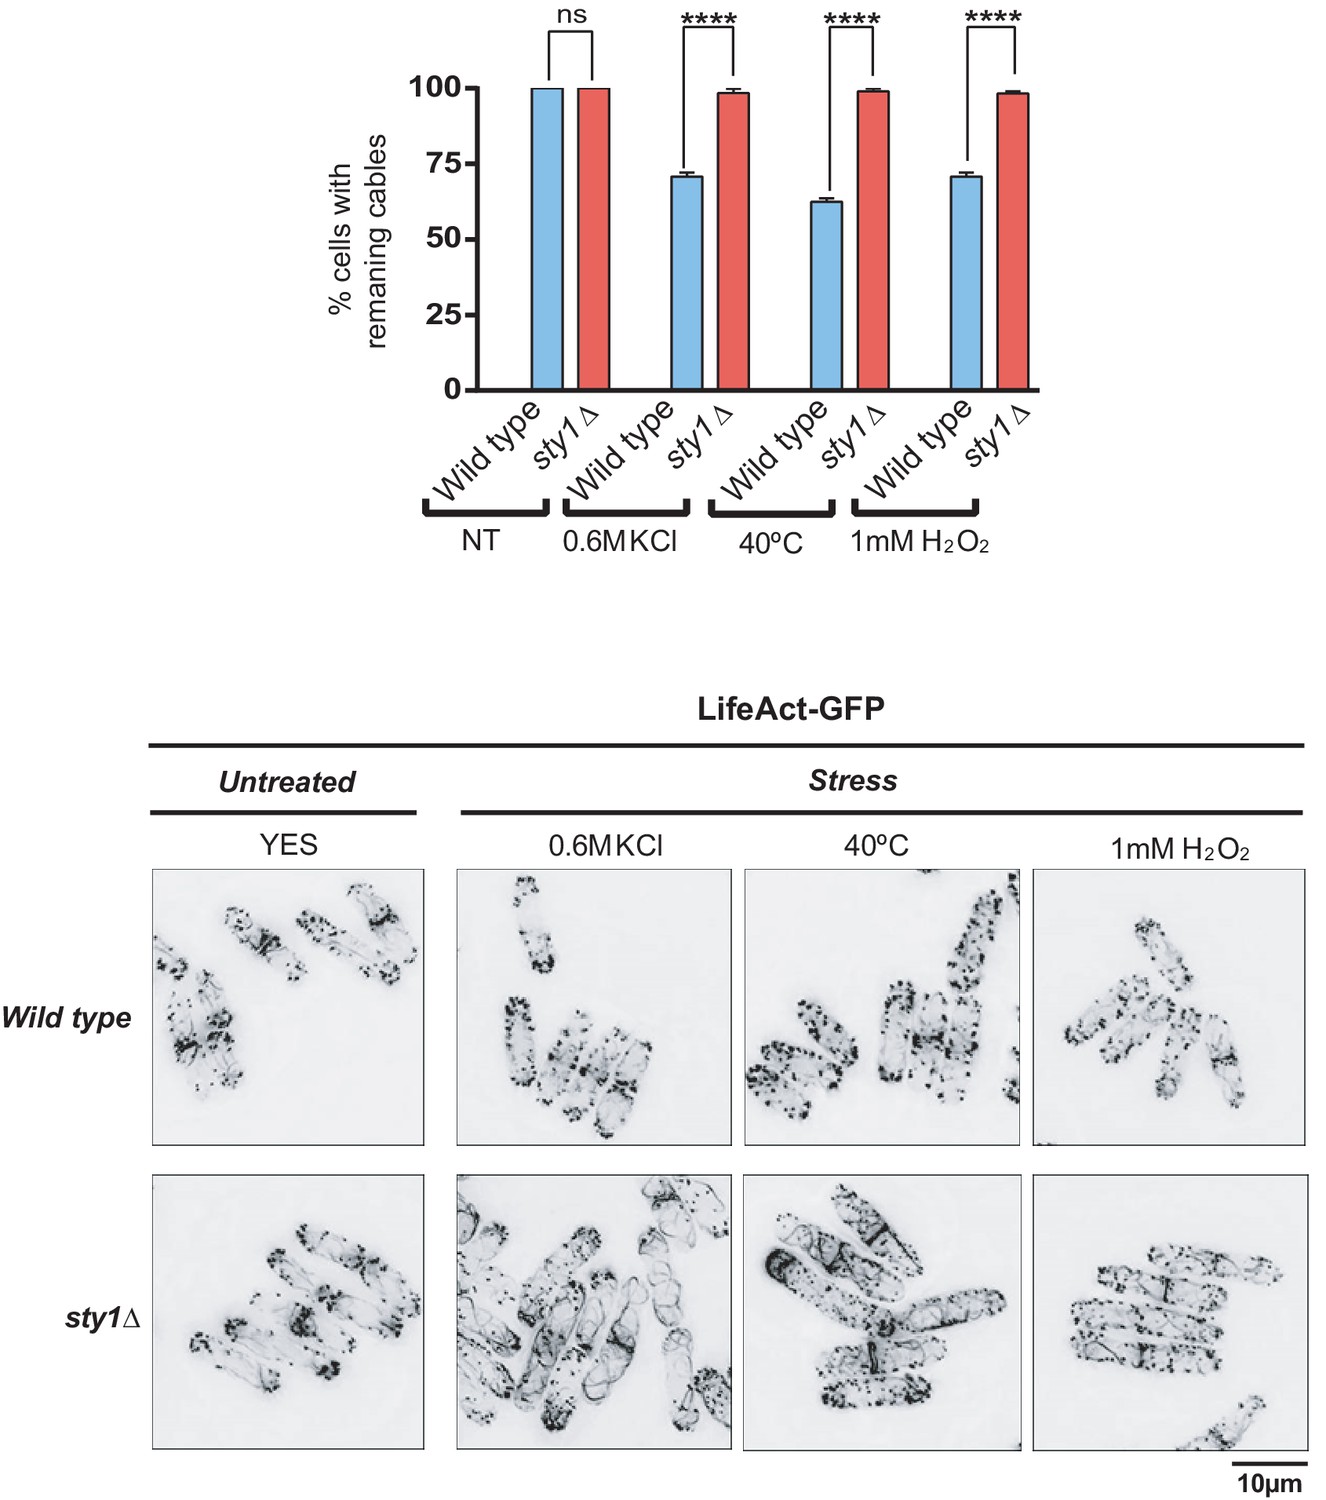
S. pombe wild-type and sty1∆ strains expressing the F-actin marker LifeAct-GFP were grown in YES medium to mid-log phase and either remained untreated, incubated at 40°C, or treated with 0.6 M KCl or 1 mM H2O2 for 30 min.
Upper panel: the percentage of cells with remaining actin cables was estimated in each case by fluorescence microscopy (n > 100), and is presented as mean ± SD (biological triplicates). ****, p<0.0001; ns, not significant, as calculated by unpaired Student's t test. Lower panel: representative maximum-projection images of cells from the above cultures.
Figure 2—figure supplement 5
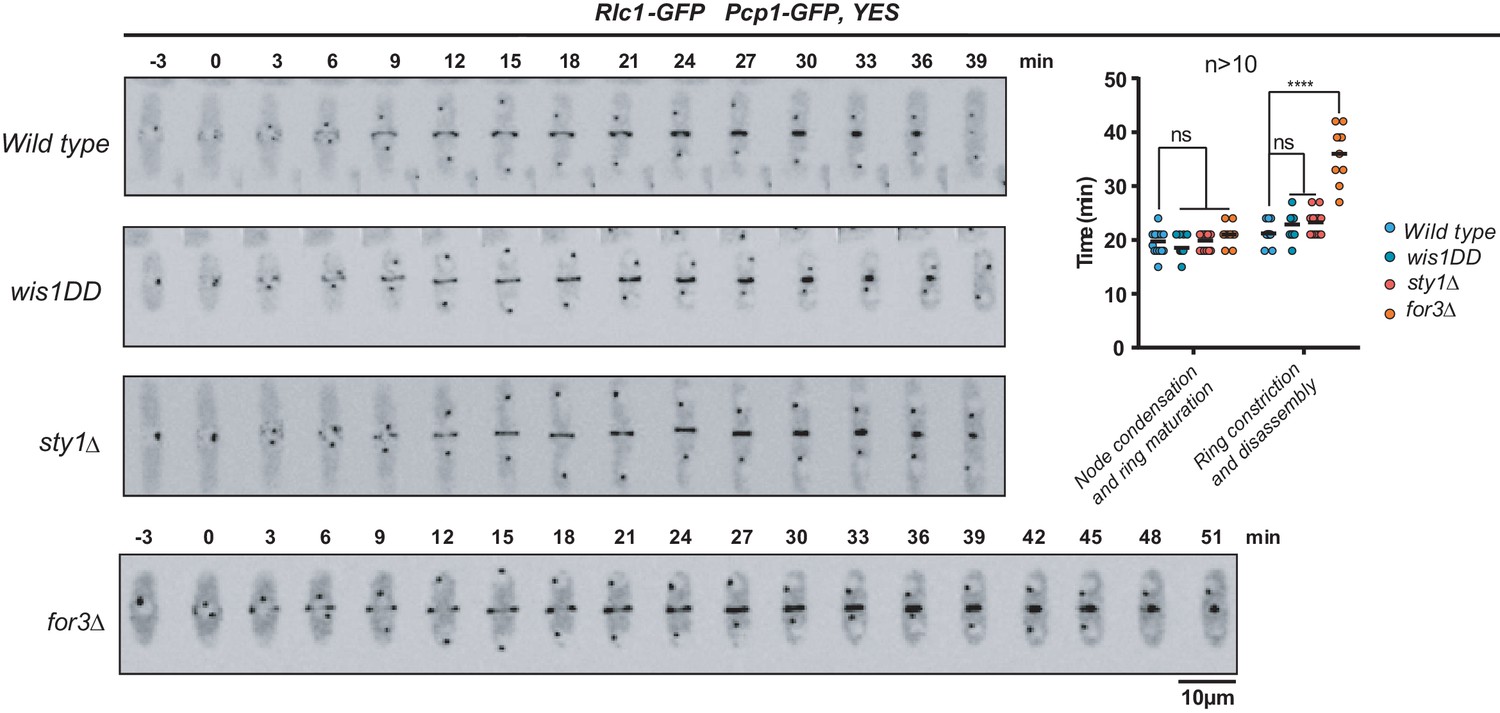
CAR dynamics during unperturbed growth in SAPK and For3 mutants.
Representative time-lapse maximum-projection images of Rlc1-GFP dynamics at the equatorial region of S. pombe wild-type, sty1Δ, wis1DD, and for3Δ cells growing in unperturbed YES medium to mid-log phase. Mitotic progression was monitored using Pcp1-GFP-marked SPBs. Time interval is 3 min. Right: the times for node condensation/ring maturation and ring constriction and disassembly were estimated for each strain (n > 10) and are presented as mean ± SD (biological duplicates). ****, p<0.001; ns, not significant, as calculated by unpaired Student's t test.
Figure 3 with 4 supplements
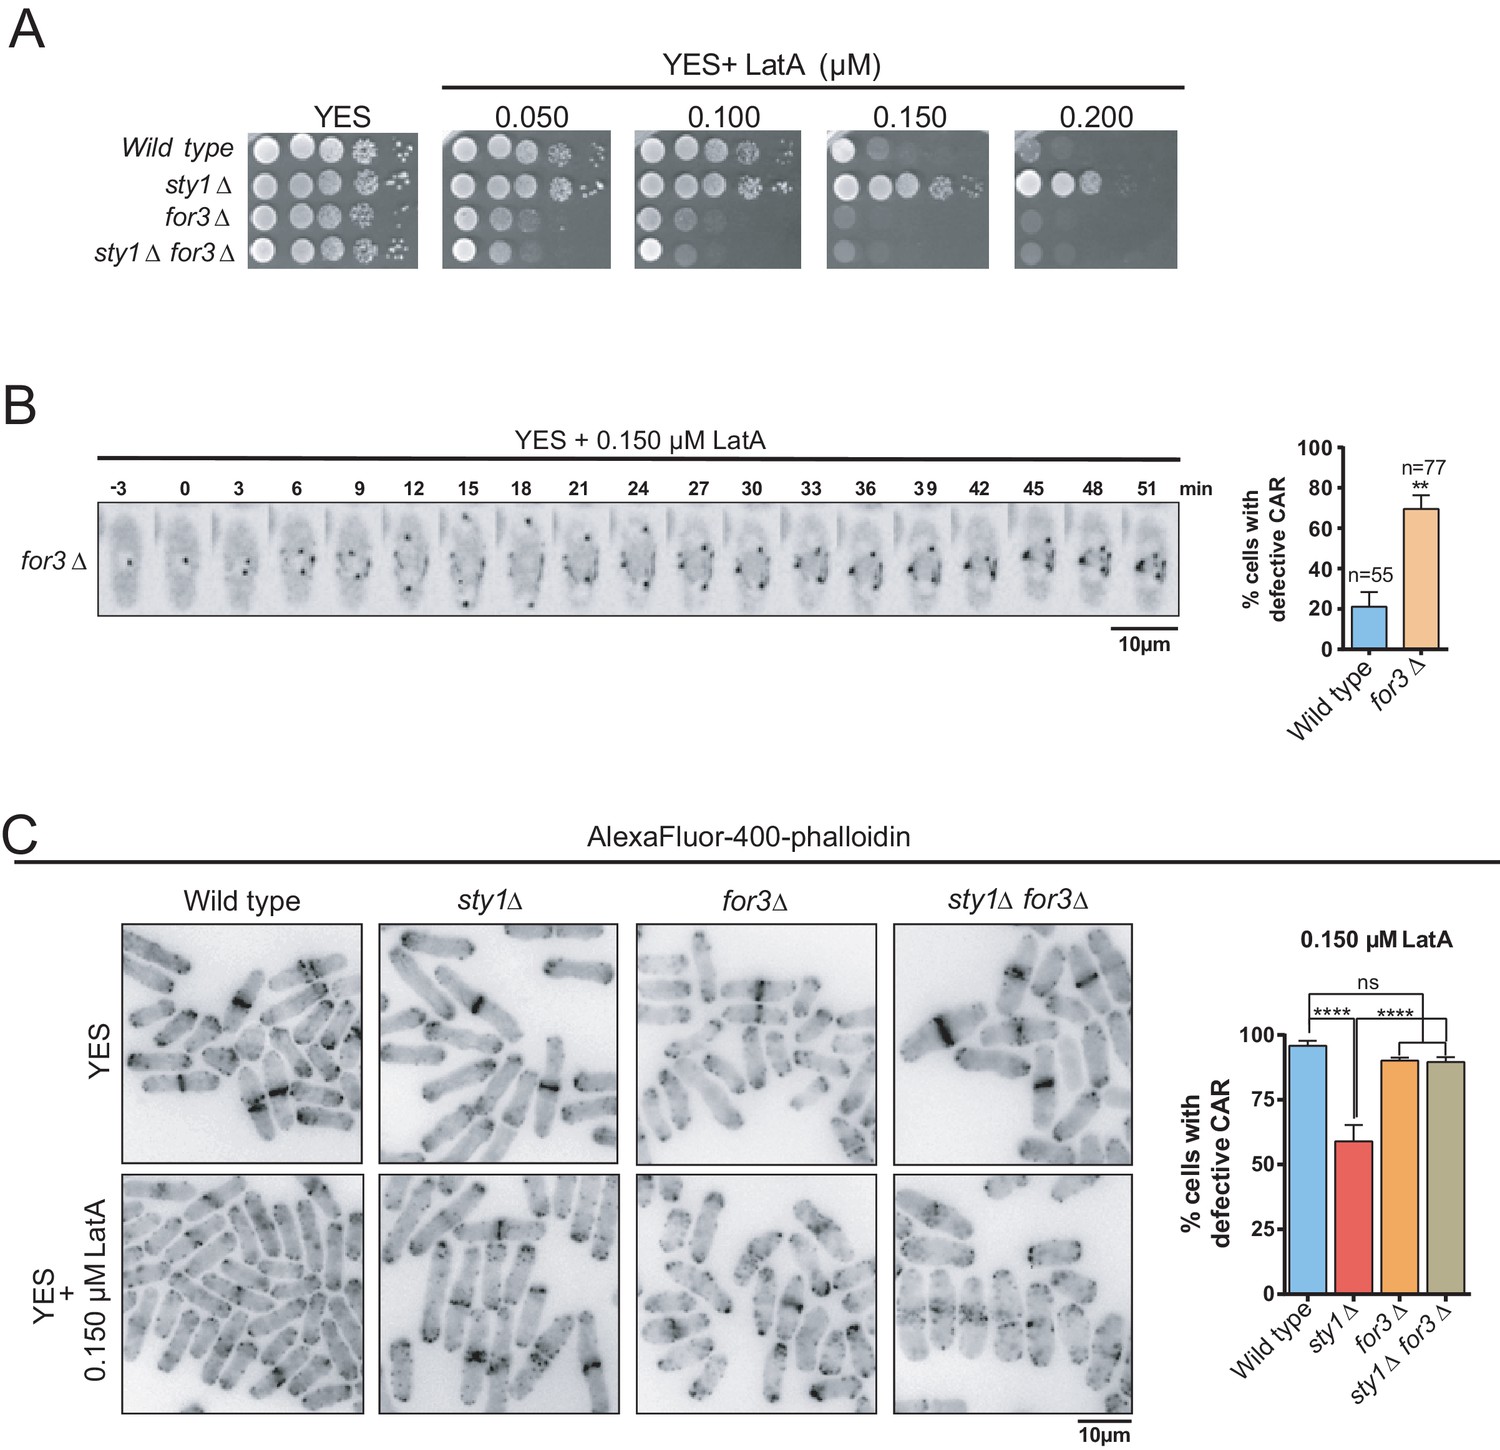
SAPK-mediated negative control of CAR assembly in response to actin cytoskeleton damage relies on formin For3.
(A) Decimal dilutions of strains of the indicated genotypes were spotted on YES and YES solid plates with a range of concentrations of LatA, incubated at 30°C for 3 days, and photographed. A representative experiment is shown. (B) Representative time-lapse maximum-projection images of Rlc1-GFP dynamics at the equatorial region of S. pombe for3∆ cells growing in YES medium to mid-log phase in the presence of 0.15 µM LatA. Mitotic progression was monitored using Pcp1-GFP-marked SPBs. Time interval is 3 min. Right: the percentage of cells that show damaged/defective CAR was estimated both for wild-type and for3∆ cells (n> 55), and is presented as mean ± SD (biological triplicates). **, p<0.01, as calculated by unpaired Student´s t test. (C) Left panel: representative images of Alexa Fluor–phalloidin staining of S. pombe wild-type, sty1∆, for3∆, and sty1∆ for3∆ cells growing in YES medium to mid-log phase, and remained untreated, or treated with 0.15 µM LatA for 40 min. Right panel: the percentage of cells that show damaged/defective CAR was estimated for each strain (n> 200) and is presented as mean ± SD (biological triplicates). ****, p<0.0001; ns, not significant, as calculated by unpaired Student's t test.
-
Figure 3—source data 1
Values used for graphical representations and statistical analysis in Figure 3.
- https://cdn.elifesciences.org/articles/57951/elife-57951-fig3-data1-v2.xlsx
Figure 3—figure supplement 1
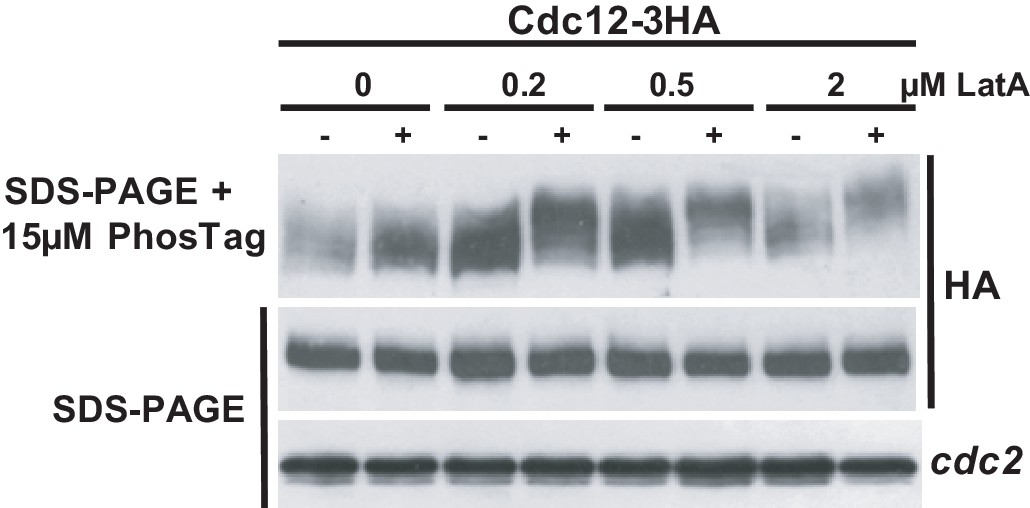
Total levels and mobility of formin Cdc12 in response to a range of concentrations of LatA.
Wild-type cells expressing a Cdc12-3HA genomic fusion were grown in YES medium to mid-log phase, and remained untreated or treated with the indicated concentrations of LatA for 1 hr. Total cell extracts were resolved by SDS-PAGE in the presence of 15 µM PhosTag (upper panel), or conventional SDS-PAGE (middle panel), and Cdc12 levels were detected by incubation with anti-HA HRP-conjugated antibody. Anti-Cdc2 (lower panel) was used as a loading control. Representative experiments are shown.
Figure 3—figure supplement 2

Total levels and mobility of formin Cdc12 in SAPK mutants treated with LatA.
Wild-type, sty1Δ, and wis1DD strains expressing a Cdc12-3HA genomic fusion were grown in YES medium to mid-log phase, and remained untreated (0), or treated with 0.2 µM LatA for 2 hr. Total cell extracts were resolved by SDS-PAGE in the presence of 15 µM PhosTag (upper panel), or conventional SDS-PAGE (middle panel), and Cdc12 levels were detected by incubation with anti-HA HRP-conjugated antibody. Anti-Cdc2 (lower panel) was used as a loading control. Representative experiments are shown.
Figure 3—figure supplement 3
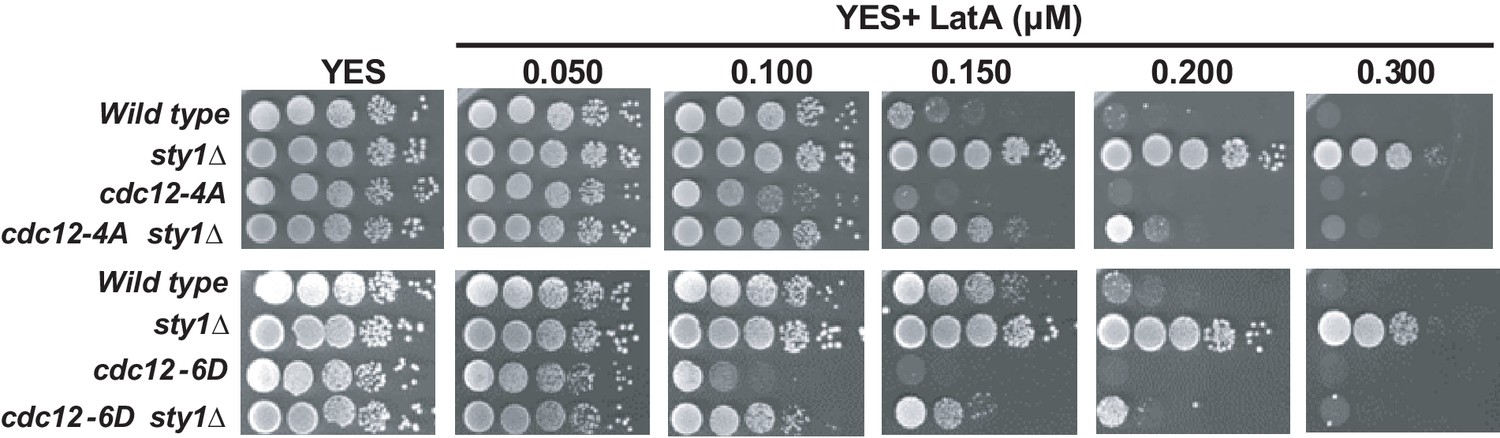
Lack of SAPK activity alleviates LatA-sensitivity of Cdc12 phospho-mutants.
Decimal dilutions of strains of the indicated genotypes were spotted on YES and YES solid plates with a range of concentrations of LatA, incubated at 30°C for 3 days, and photographed.
Figure 3—figure supplement 4
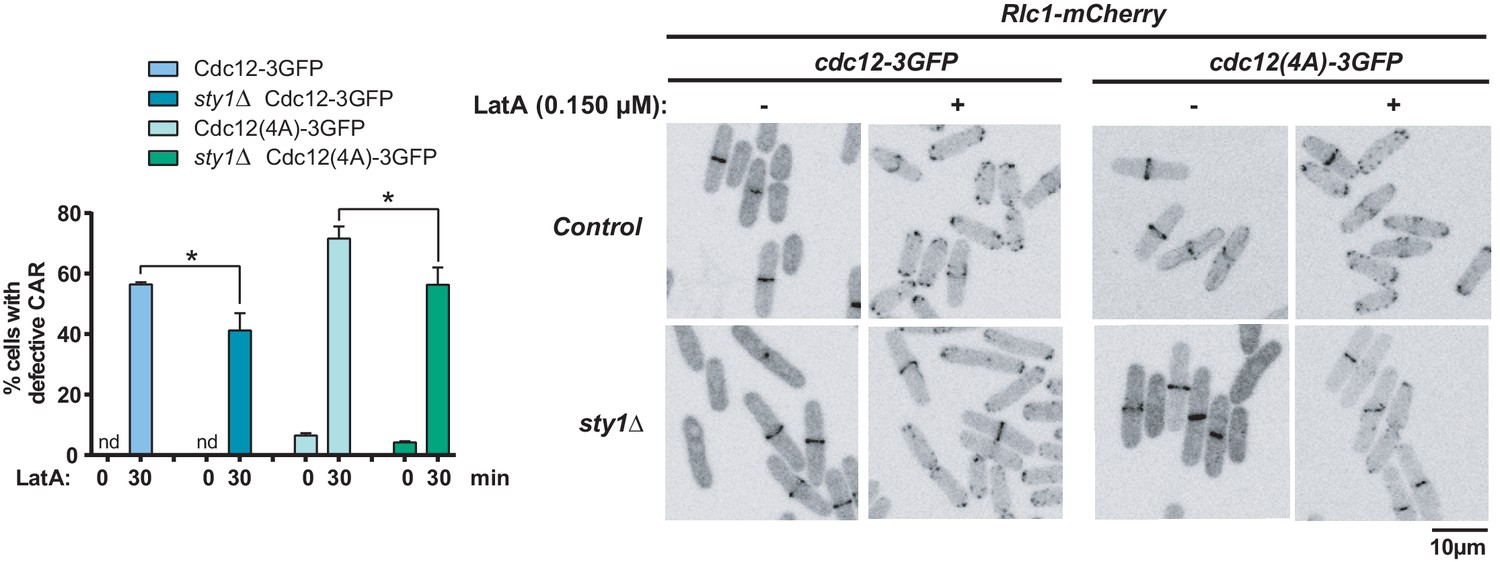
Lack of SAPK activity alleviates the CAR assembly defects of Cdc12 phospho-mutants induced with LatA.
S. pombe Cdc12-3GFP, Cdc12-3GFP sty1∆, Cdc12(4A)−3GFP, and Cdc12(4A)−3GFP sty1∆ strains expressing a Rlc1-GFP genomic fusion were grown in YES medium to mid-log phase, and remained untreated or treated with 0.15 µM LatA for 30 min. Left panel: the percentage of cells that show damaged CAR was estimated in each case by fluorescence microscopy (n > 200), and is presented as mean ± SD (biological triplicates). *, p<0.05, as calculated by unpaired Student's t test. nd, no CAR damage detected. Right panel: representative maximum-projection images of cells from the above cultures.
Figure 4
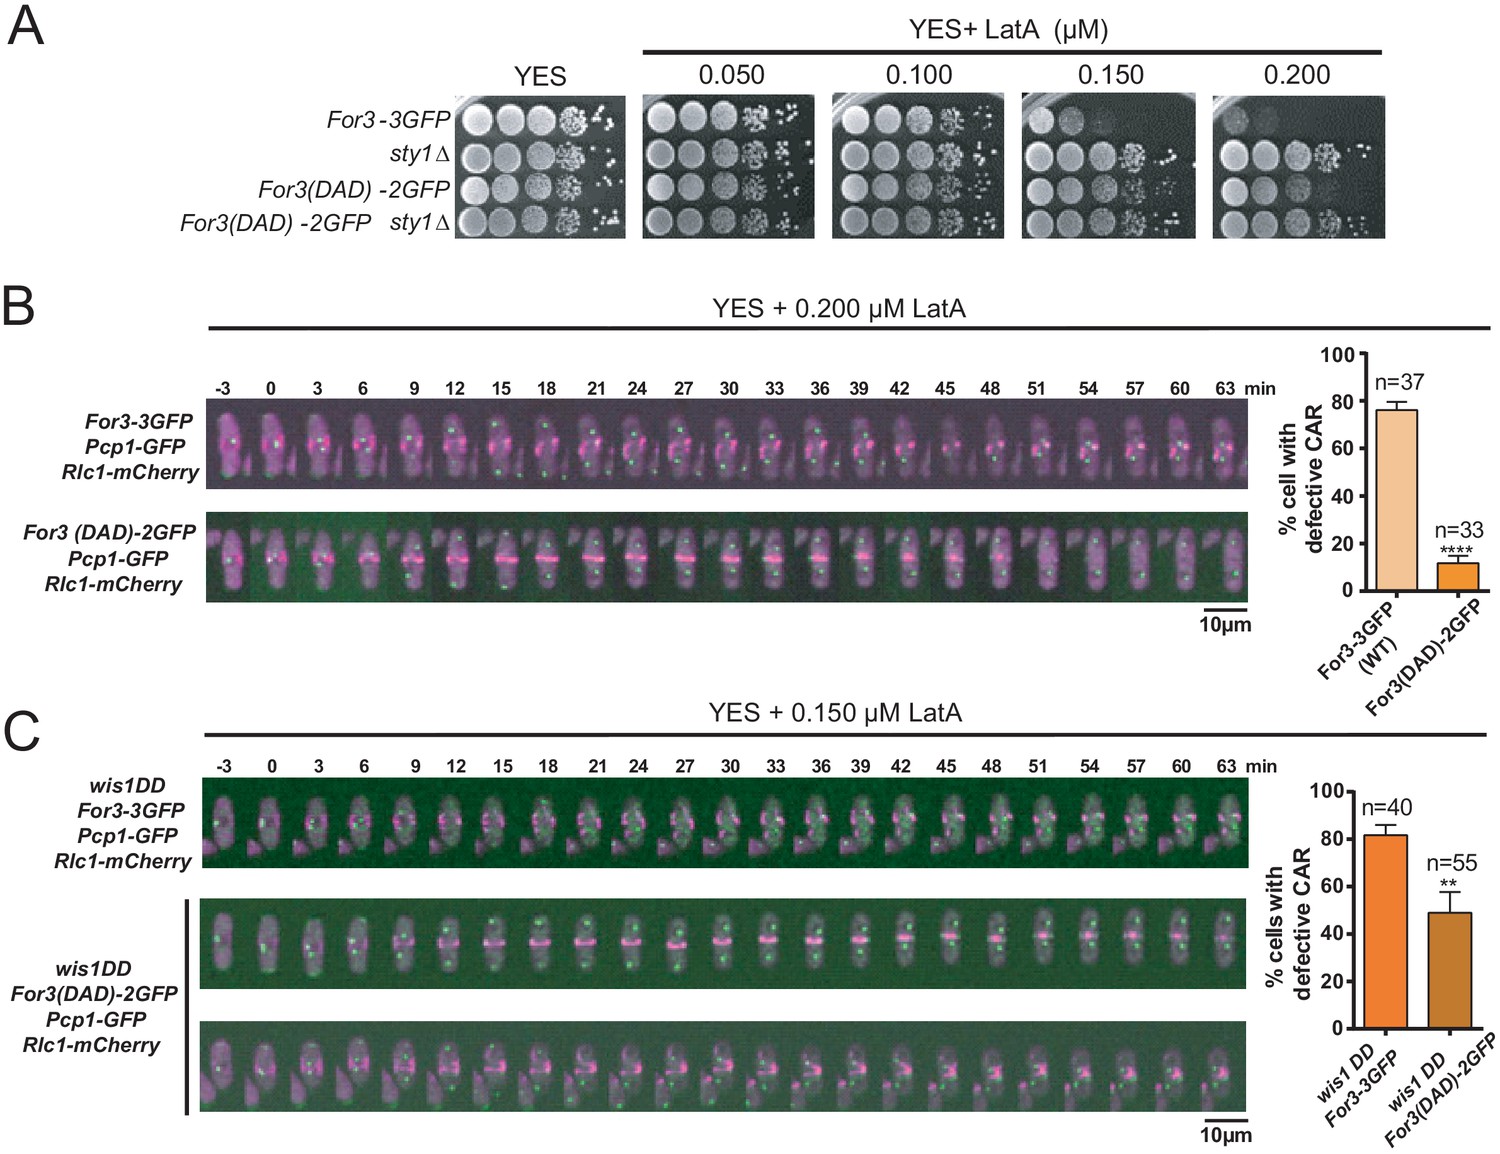
A constitutively open version of For3 favors growth and CAR integrity in the presence of LatA.
(A) Decimal dilutions of strains of the indicated genotypes were spotted on YES and YES solid plates with a range of concentrations of LatA, incubated at 30°C for 3 days, and photographed. A representative experiment is shown. (B) Representative time-lapse maximum-projection images of Rlc1-mCherry dynamics at the equatorial region of S. pombe For3-3GFP and For3(DAD)−2GFP cells growing in YES medium to mid-log phase in the presence of 0.2 µM LatA. Mitotic progression was monitored using Pcp1-GFP-marked SPBs. Time interval is 3 min. Right: the percentage of cells that show damaged/defective CAR was estimated for each strain (n> 33) and is presented as mean ± SD (biological triplicates). ****, p<0.0001, as calculated by unpaired Student's t test. (C) Representative time-lapse maximum-projection images of Rlc1-mCherry dynamics at the equatorial region of S. pombe wis1DD For3-3GFP and wis1DD For3(DAD)−2GFP cells growing in YES medium to mid-log phase in the presence of 0.2 µM LatA. Mitotic progression was monitored using Pcp1-GFP-marked SPBs. Time interval is 3 min. Right: the percentage of cells that show damaged/defective CAR was estimated for each strain (n> 39) and is presented as mean ± SD (biological triplicates). **, p<0.01, as calculated by unpaired Student´s t test.
-
Figure 4—source data 1
Values used for graphical representations and statistical analysis in Figure 4.
- https://cdn.elifesciences.org/articles/57951/elife-57951-fig4-data1-v2.xlsx
Figure 5 with 6 supplements

Sty1 MAPK prompts a decrease in total protein levels of For3 during actin cytoskeleton damage induced with LatA.
(A) Extracts from S. pombe growing cells expressing a genomic For3-3GFP fusion were treated with lambda phosphatase in the presence/absence of specific phosphatase inhibitor. Total and phosphorylated For3 levels (arrows) were determined by immunobloting with anti-GFP antibody. Anti-Cdc2 was used as a loading control. Results from a representative experiment are shown. (B) Total extracts from growing cultures of wild-type, sty1Δ, pyp1Δ, and wis1DD strains expressing a For3-3GFP genomic fusion were resolved by SDS-PAGE, and total For3 levels were detected by incubation with anti-GFP antibody. Anti-Cdc2 was used as a loading control. Lower panel: quantification of western blot experiments. Relative For3 levels are represented as mean ± SD (biological triplicates). *, p<0.05, as calculated by unpaired Student's t test with respect to the wild type. (C) Sty1-T97A (as) cells expressing a For3-3GFP genomic fusion were grown to mid-log phase and remained untreated (MetOH; solvent control), or treated with 10 µM 3BrBPP1 at the indicated times. Total extracts were resolved by SDS-PAGE, and For3 levels were detected by incubation with anti-GFP antibody. Anti-Cdc2 was used as a loading control. Lower panel: quantification of western blot experiments. Relative For3 levels are represented as mean ± SD (biological duplicates). **, p<0.005; ns, not significant, as calculated by unpaired Student's t test. (D) Upper panel: Representative maximum-projection image of mixed wild type (For3-3GFP, Hht1-RFP; representative cells are marked with asterisks) and sty1∆ (For3-3GFP; representative cells are marked with point arrows) cells growing to mid-log phase observed by fluorescence microscopy. Lower panels: intensity plots of For3-3GFP and Pmk1-GFP fusions (shown as arbitrary fluorescence units) were generated from line scans across the equatorial region of both wild-type and sty1∆ cells (n> 28) with early septum. Individual (dotted lines) and average scans (solid lines) are shown in each case. (E) mRNA levels of for3+ gene were measured by qPCR from total RNA extracted from cell samples corresponding to S. pombe wild type cells growing exponentially in YES medium that remained untreated (0), or treated with the indicated concentrations of LatA for 1 hr. Results are shown as relative fold expression (mean ± SD) from three biological repeats. ****, p<0.0001; **, p<0.005; ns, not significant, as calculated by unpaired Student's t test with respect to the wild type. (F) S. pombe wild-type, wis1DD and pyp1Δ cells expressing genomic Sty1-HA6his and For3-3GFP fusions were grown in YES medium to mid-log phase, and remained untreated (0), or treated with the indicated concentrations of LatA for 2 hr. Activated/total Sty1 were detected with anti-phospho-p38 and anti-HA antibodies, respectively. Total For3 levels were detected with anti-GFP antibody. Anti-Cdc2 was used as a loading control. Lower panel: quantification of Western blot experiments. Relative For3 levels are represented as mean ± SD (biological duplicates). ***, p<0.001; **, p<0.005; *, p<0.05, as calculated by unpaired Student's t test. (G) Exponentially growing cdc2-asM17 cells expressing a For3-3GFP fusion were treated with 1 µM 3-MB-PP1 for 3 hr to hold the cycle at G2, released from the arrest for 10 min after ATP-analogue washout, and treated with 0.2 µM LatA for the indicated times. Total For3 levels were detected with anti-GFP antibody. Anti-Cdc2 was used as a loading control. Lower panel: quantification of Western blot experiments. Relative For3 levels are represented as mean ± SD (biological duplicates). *, p<0.05, as calculated by unpaired Student's t test. (H) Wild type and Act1-LQ (LatA-insensitive mutant) cells expressing a For3-3GFP genomic fusion were grown to mid-log phase and remained untreated (0), or treated with 0.15 µM LatA for 2, 4, or 6 hr. Total extracts were resolved by SDS-PAGE, and For3 levels were detected by incubation with anti-GFP antibody. Anti-Cdc2 was used as a loading control. Results from a representative experiment are shown. (I) Wild-type, sty1Δ, pyp1Δ, and wis1DD cells expressing a For3-3GFP genomic fusion were grown to mid-log phase and remained untreated (0), or treated with 0.15 µM LatA for 4 hr. Total extracts were resolved by SDS-PAGE, and For3 levels were detected by incubation with anti-GFP antibody. Anti-Cdc2 was used as a loading control. Results from a representative experiment are shown.
-
Figure 5—source data 1
Values used for graphical representations and statistical analysis in Figure 5.
- https://cdn.elifesciences.org/articles/57951/elife-57951-fig5-data1-v2.xlsx
Figure 5—figure supplement 1

For3-3GFP levels and phosphorylation status do not change during the cell cycle.
cdc10-129 (G1-phase arrest), cdc25-22 (G2-phase arrest), and nda3-km311 (M-phase arrest) cells expressing a genomic For3-3GFP fusion were incubated at either 25°C (asynchronous cultures), 36.5°C for 3.5 hr (cdc10-129 and cdc25-22 backgrounds) and 25 or 18°C for 7 hr (nda3-km311 background). Total For3 levels were determined by immunobloting with anti-GFP antibody. Anti-Cdc2 was used as a loading control. Relative For3 levels are represented as mean ± SD (biological duplicates). ns, not significant, as calculated by unpaired Student's t test.
Figure 5—figure supplement 2
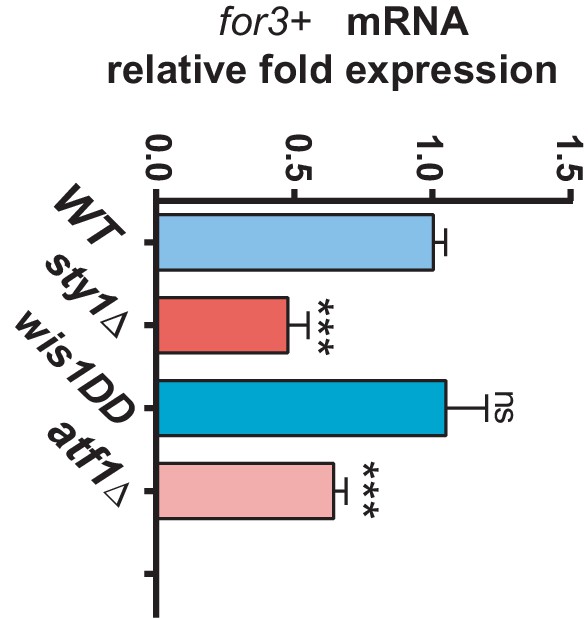
for3+ mRNA levels in SAPK mutants.
mRNA levels of for3+ gene were measured by qPCR from total RNA extracted from cell samples corresponding to S. pombe wild type, sty1Δ, wis1DD and atf1Δ strains growing exponentially in YES medium. Results are shown as relative fold expression (mean ± SD) from three biological repeats. ***, p<0.001; ns, not significant, as calculated by unpaired Student's t test with respect to the wild type.
Figure 5—figure supplement 3
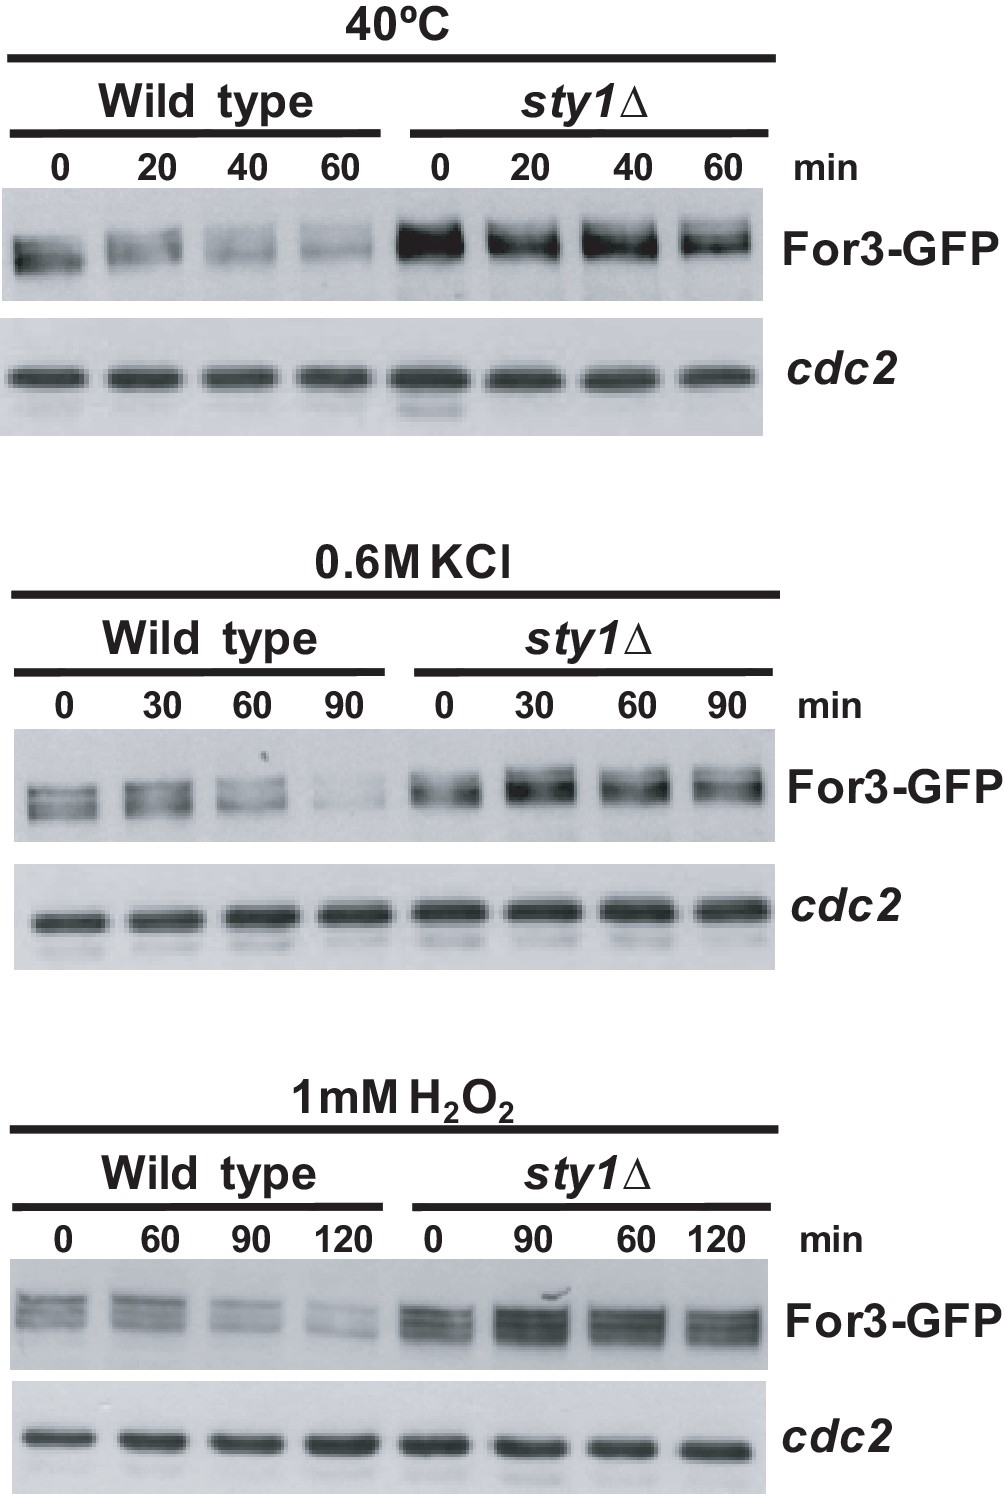
Sty1 activity elicits a decrease in For3 levels in response to environmental stimuli.
S. pombe wild-type and sty1Δ cells expressing a genomic For3-3GFP fusion were grown in YES medium to mid-log phase, and incubated at 40°C, or treated with 0.6 M KCl or 1 mM H2O2 for the indicated times. Total For3 levels were detected with anti-GFP antibody. Anti-Cdc2 was used as a loading control. Results from representative experiments are shown.
Figure 5—figure supplement 4
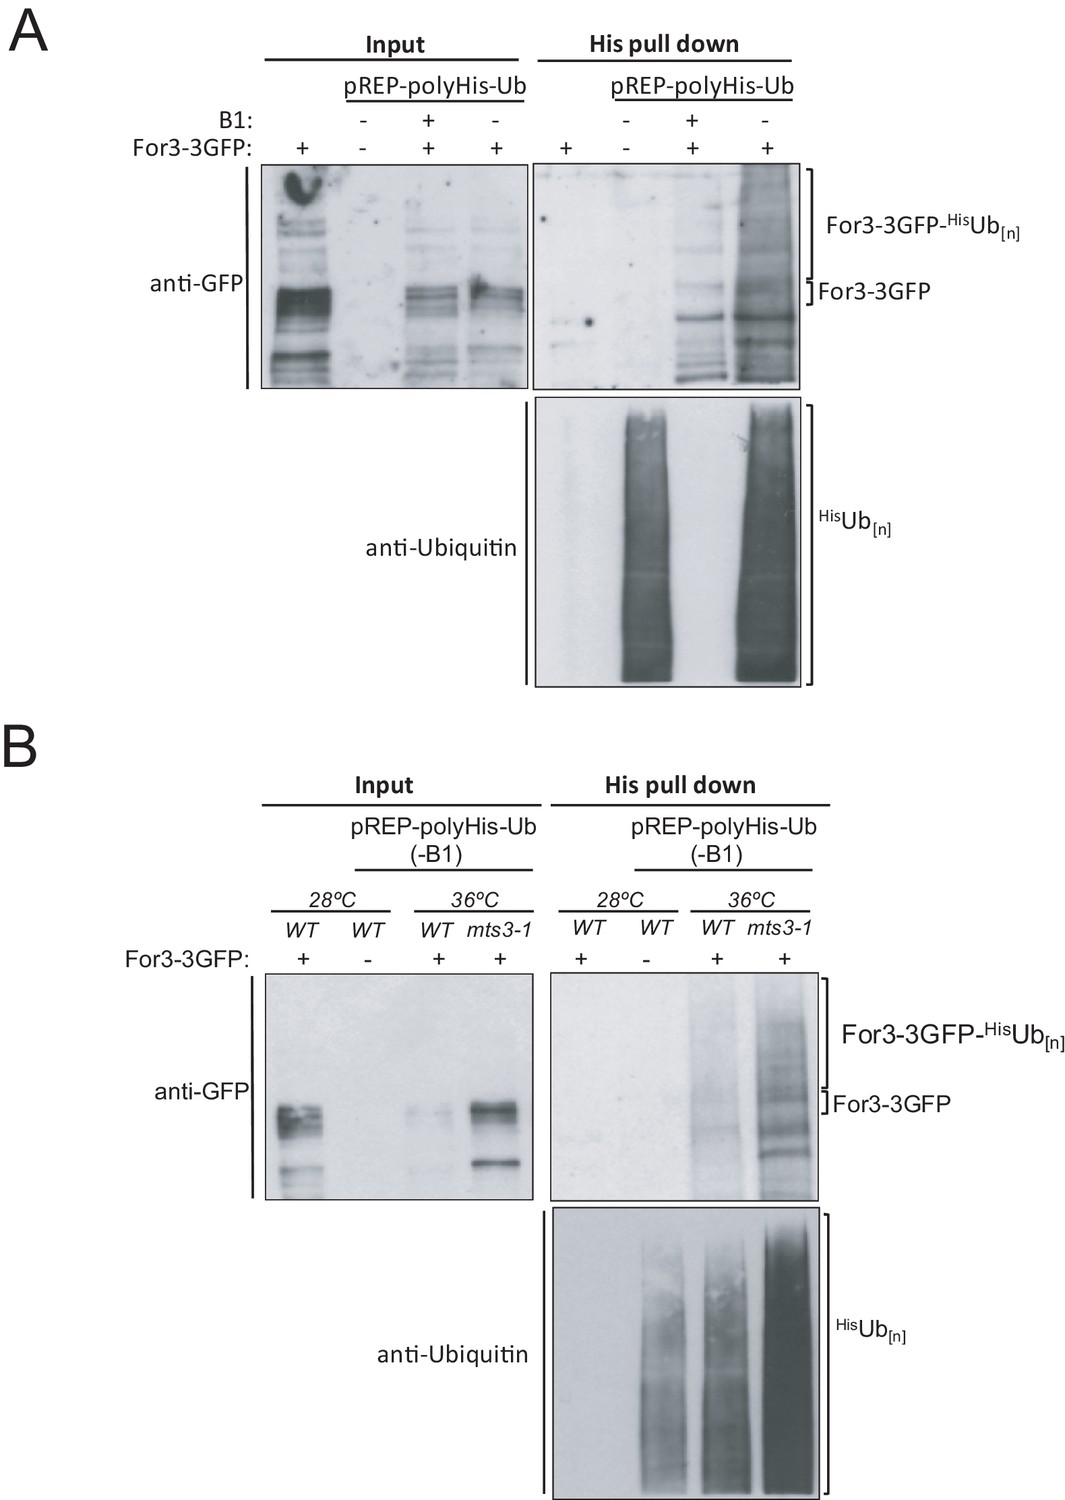
For3 is ubiquitinated in vivo.
(A) In vivo ubiquitination of For3-3GFP wild-type cells expressing 6His-ubiquitin (-B1; 24 hr) during unperturbed growth. Input fraction and precipitated 6His-ubiquitin conjugates were analyzed by anti-GFP (upper panels) and anti-ubiquitin (lower panel) immunoblotting. Negative control: WT cells expressing untagged For3. (B) The same assay as above was performed with wild type and mts3-1 For3-3GFP cells expressing 6His-ubiquitin (-B1; 24 hr), and incubated at either 28 or 36°C for 4 hr before precipitation of 6His-ubiquitin conjugates. Representative experiments are shown.
Figure 5—figure supplement 5
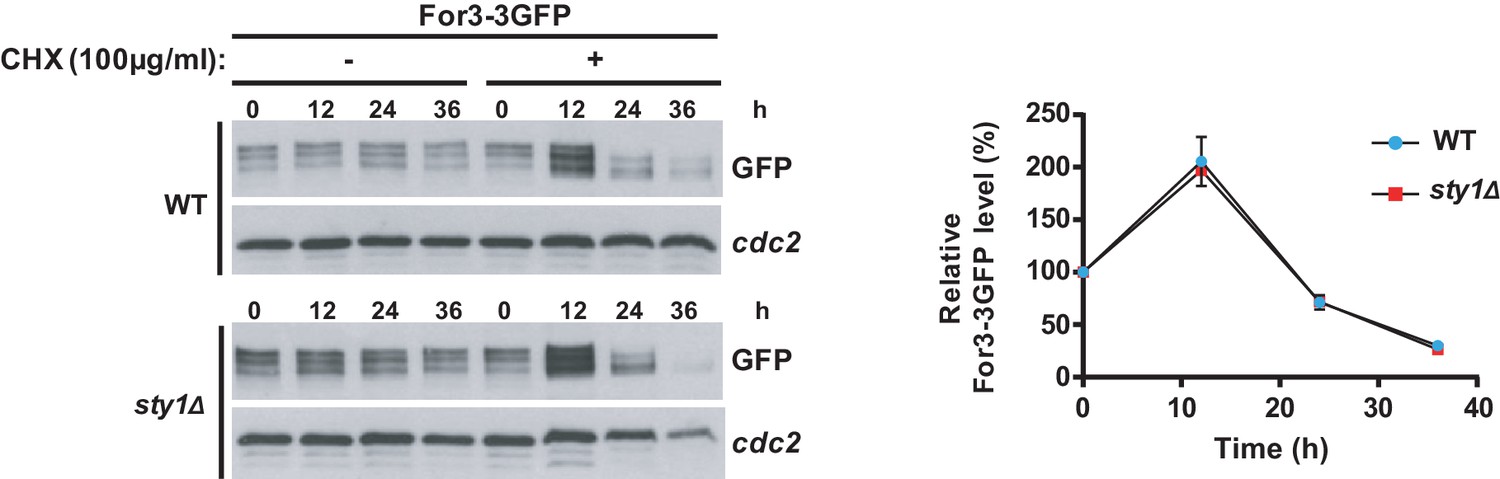
Half-life of For3 in wild type versus sty1Δ cells.
S. pombe wild-type and sty1Δ cells expressing a genomic For3-3GFP fusion were grown in YES medium to mid-log phase, and incubated with 100 µg/ml LatA for the indicated times. Total For3 levels were detected with anti-GFP antibody. Anti-Cdc2 was used as a loading control. Relative For3 levels are represented as mean ± SD (biological duplicates) with respect to the zero time.
Figure 5—figure supplement 6
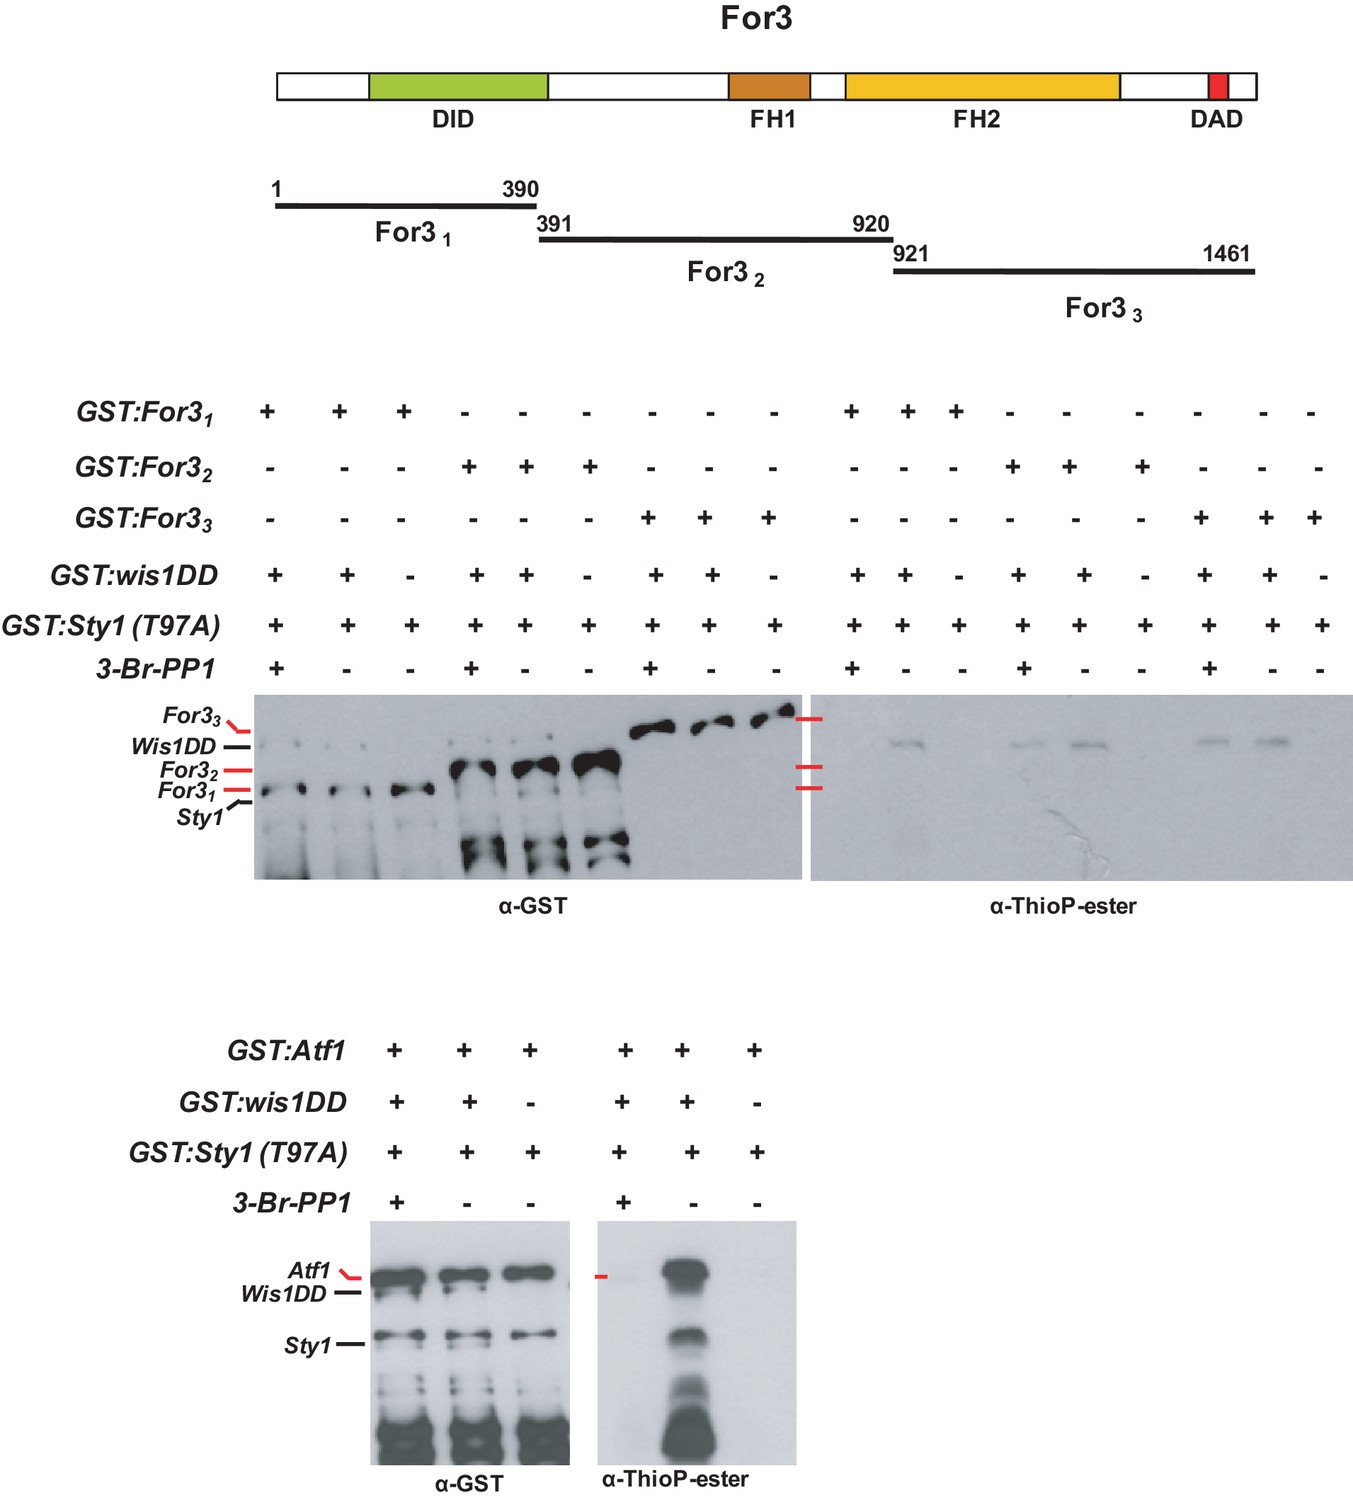
Sty1 does not phosphorylate For3 in vitro.
Bacterially purified GST-For31, GST-For32, and GST-For33 fragments fusions were incubated with ATP-γ-S and GST-wis1DD (constitutively active MAPKK) and GST-Sty1-(T97A) (analogue-sensitive MAP kinase), in the presence or absence of a specific kinase inhibitor (3-Br-PP1). Total Wis1, Sty1, and For3 levels in the reaction mixture were determined after incubation with anti-GST antibody, whereas putative For3 thiophosphorylation was assayed with anti-thioP-ester antibody. An identical assay was also performed in parallel employing as a positive control GST-fused transcription factor Atf1, a well-known phosphorylated substrate by Sty1. Representative experiments are shown.
Figure 6
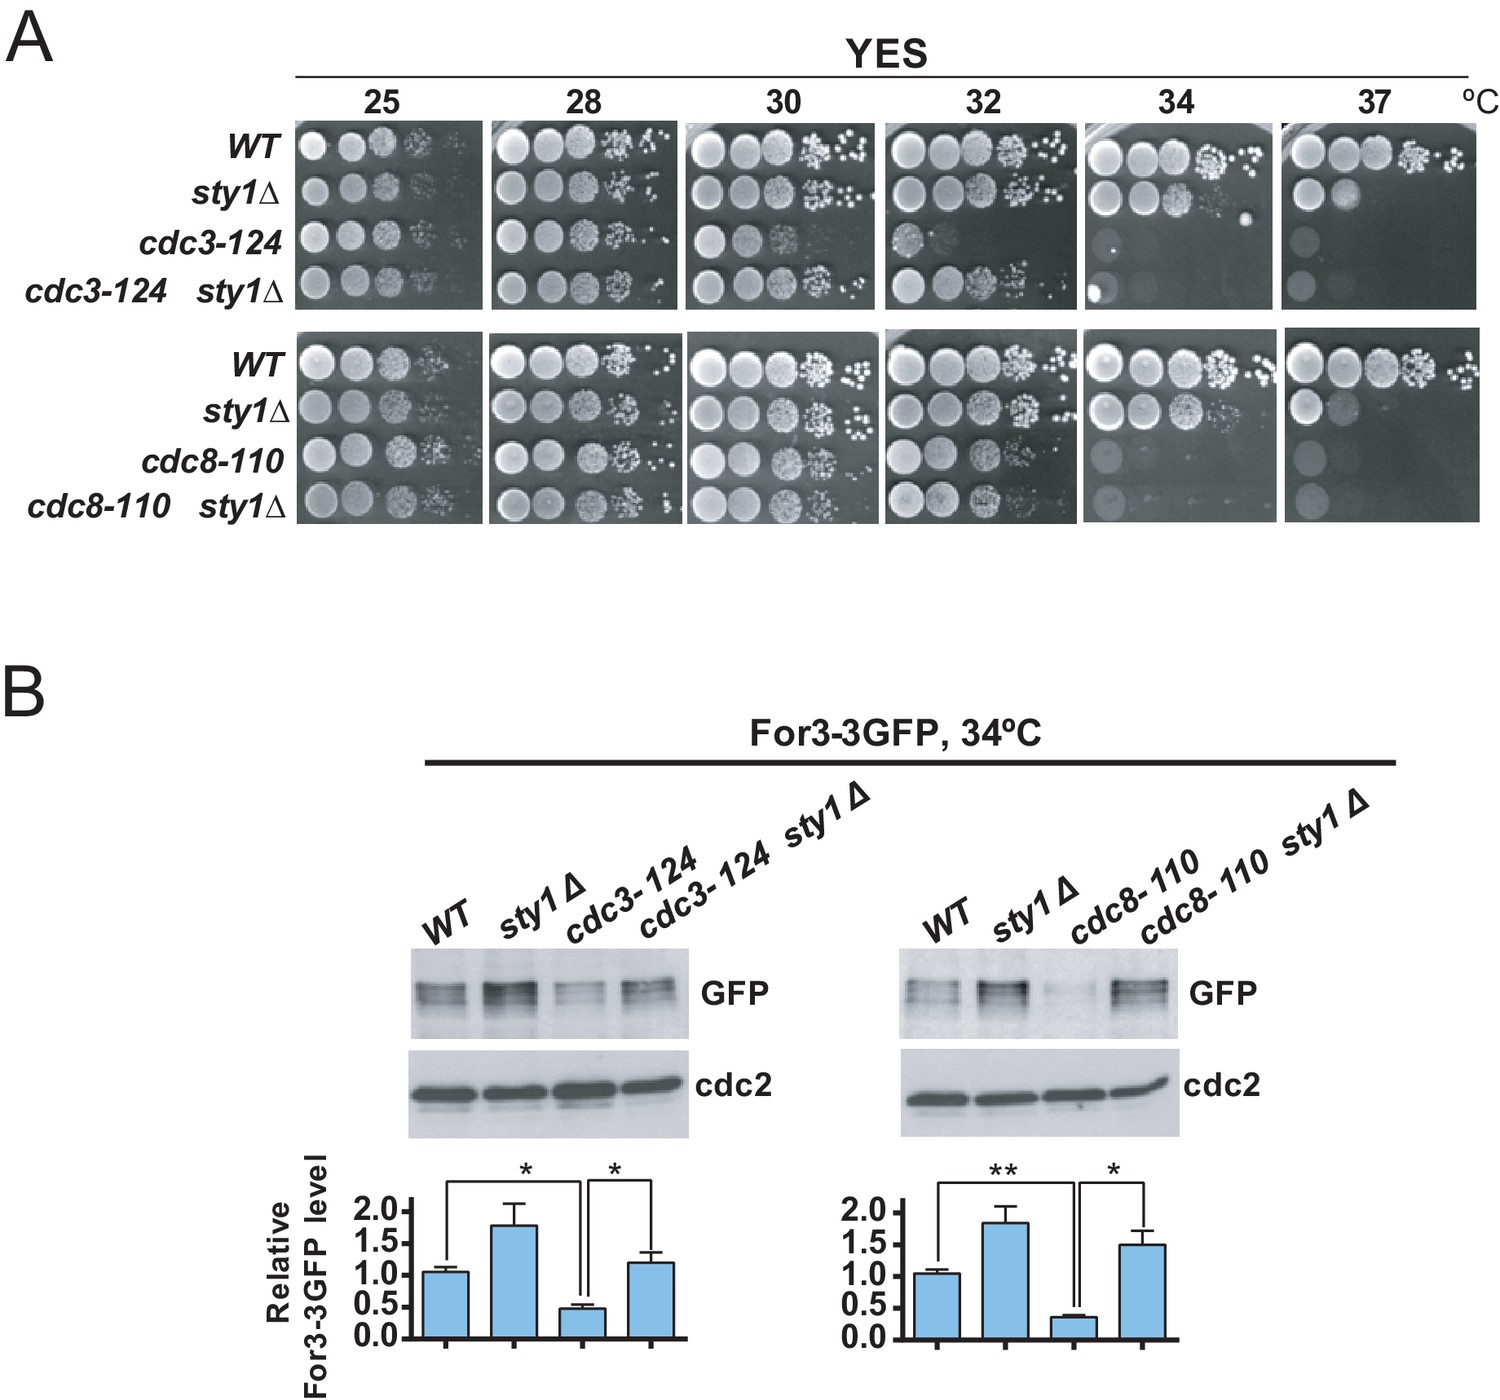
Decreased For3 levels in profilin and tropomyosin conditional mutants are relieved in absence of SAPK function.
(A) Decimal dilutions of strains of the indicated genotypes were spotted on YES solid plates, incubated at 25, 28, 30, 32, 34, and 37°C for 3 days, and photographed. (B) Growing cultures of the indicated strains expressing a For3-3GFP genomic fusion were incubated at 34°C for 4 hr. Total extracts obtained from the respective cell aliquots were resolved by SDS-PAGE, and total For3 levels were detected by incubation with anti-GFP antibody. Anti-Cdc2 was used as a loading control. Lower panel: quantification of western blot experiments. Relative For3 levels are represented as mean ± SD (biological duplicates). **, p<0.005; *, p<0.05, as calculated by unpaired Student's t test.
-
Figure 6—source data 1
Values used for graphical representations and statistical analysis in Figure 6.
- https://cdn.elifesciences.org/articles/57951/elife-57951-fig6-data1-v2.xlsx
Figure 7
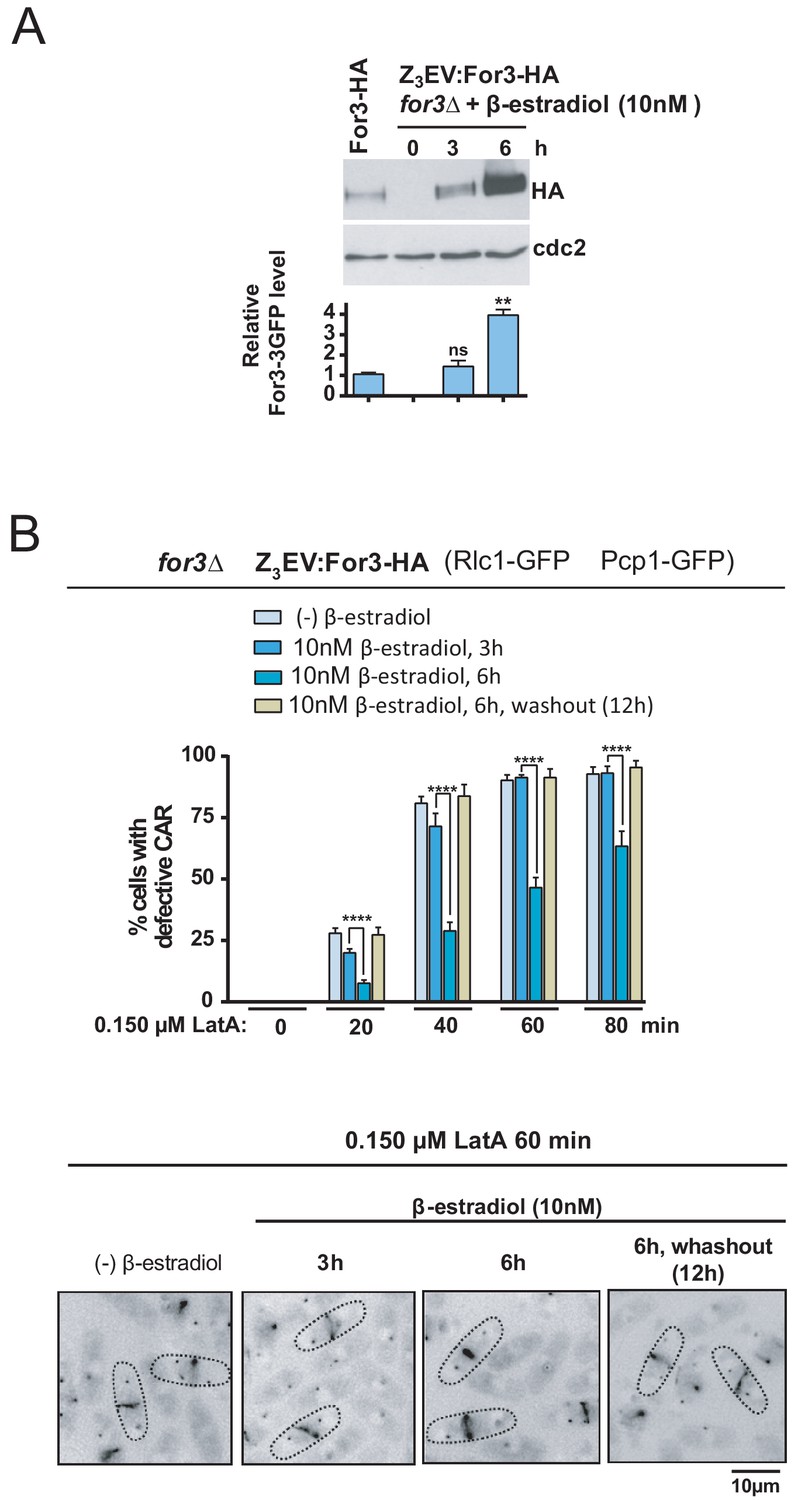
For3 is as a dose-dependent regulator of CAR assembly and integrity in S. pombe.
(A) For3-HA (wild type) and for3Δ Z3EVpr:For3-HA strains were grown to mid-log phase, and the later culture was treated with 10 nM β-estradiol for 0, 3 and 6 hr. Total extracts were resolved by SDS-PAGE, and For3 levels were detected by incubation with anti-HA-HRP antibody. Anti-Cdc2 was used as a loading control. Relative For3 levels are represented as mean ± SD (biological duplicates). **, p<0.005; ns, not significant, as calculated by unpaired Student's t test with respect to the wild type. (B) for3Δ Z3EVpr:For3-HA cells grown to mid-log phase were treated with 0.15 µM LatA for the indicated times after being incubated in absence (-) or presence of 10 nM β-estradiol for 3 and 6 hr, or 6 hr with β-estradiol plus 12 hr after hormone washout. Upper panel: the percentage of cells that show damaged CAR was estimated in each case by fluorescence microscopy (n > 200), and is presented as mean ± SD (biological triplicates). ****, p<0.0001, as calculated by unpaired Student's t test. Lower panel: representative images of cell samples after treatment with 0.15 µM LatA for 60 min are shown.
-
Figure 7—source data 1
Values used for graphical representations and statistical analysis in Figure 7.
- https://cdn.elifesciences.org/articles/57951/elife-57951-fig7-data1-v2.xlsx
Figure 8
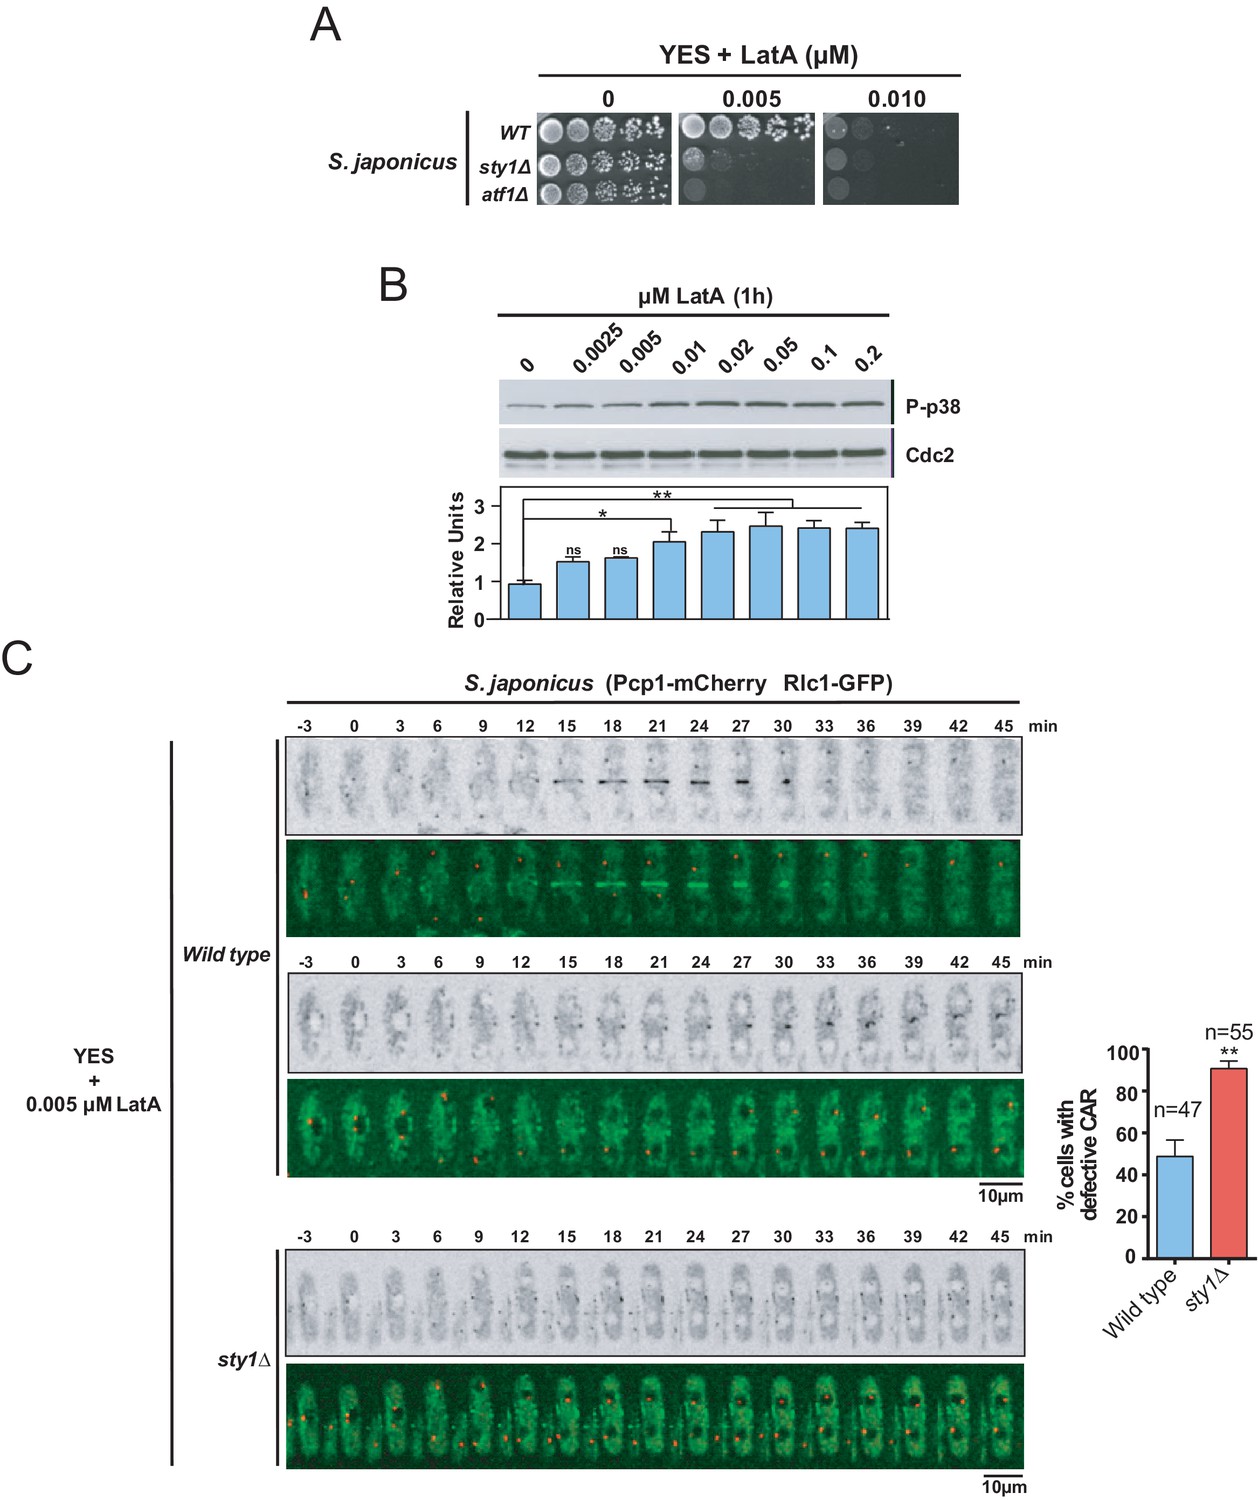
The SAPK pathway positively regulates CAR assembly in S. japonicus during actin stress induced with LatA.
(A) Decimal dilutions of S. japonicus wild type, sty1Δ, and atf1Δ strains were spotted on YES and YES solid plates with the indicated concentrations of LatA, incubated at 30°C for 3 days, and photographed. A representative experiment is shown. (B) Upper panel: S. japonicus wild-type cells were grown in YES medium to mid-log phase, and remained untreated (0), or treated with the indicated concentrations of LatA for 1 hr. Activated Sty1 was detected with anti-phospho-p38 antibody. Anti-Cdc2 was used as a loading control. Lower panel: Relative units as mean ± SD (biological duplicates) for Sty1 phosphorylation (anti-phospho-p38 blot) were determined with respect to the loading control (anti-Cdc2 blot). **, p<0.005; *, p<0.05; ns, not significant, as calculated by unpaired Student's t test. (C) Representative time-lapse maximum-projection images of Rlc1-GFP dynamics at the equatorial region of S. japonicus wild-type and sty1Δ cells growing in YES medium to mid-log phase in the presence of 0.005 µM LatA. Mitotic progression was monitored using Pcp1-mCherry-marked SPBs. Time interval is 3 min. Right: the percentage of cells that show damaged/defective CAR was estimated for each strain (n> 47) and is presented as mean ± SD (biological triplicates). ***, p<0.001, as calculated by unpaired Student's t test.
-
Figure 8—source data 1
Values used for graphical representations and statistical analysis in Figure 8.
- https://cdn.elifesciences.org/articles/57951/elife-57951-fig8-data1-v2.xlsx
Author response image 1

S. pombe wild type cells expressing genomic For3-3GFP fusion were grown in YES medium to mid-log phase, and treated with 1μM LatA for the indicated times.
Total For3 levels were detected with anti-GFP antibody, Anti-Cdc2 was used as a loading control. Lower panel: quantification of Western blot experiments. Relative For3 levels are represented as mean ± SD (biological triplicates). ***, P<0.001; ns, not significant, as calculated by unpaired Student’s t test.
Author response image 2
Tables
Key resources table
| Reagent type (species) or resource | Designation | Source or reference | Identifiers | Additional information |
|---|---|---|---|---|
| Antibody | Anti-Phospho-p38 (rabbit polyclonal) | Cell Signaling | Cat# 9211, RRID:AB_331641 | WB (1:1000) |
| Antibody | Anti-HA (mouse monoclonal) | Roche | Cat# 11 583 816 001, RRID:AB_514505 | WB (1:1000) |
| Antibody | Anti-GFP (mouse monoclonal) | Roche | Cat# 11 814 460 001, RRID:AB_390913 | WB (1:1000) |
| Antibody | HRP-conjugated anti-HA antibody (rat monoclonal) | Roche | Cat# 12 013 819 001, RRID:AB_390917 | WB (1:3000) |
| Antibody | Anti-Cdk1/Cdc2 (PSTAIR)(rabbit polyclonal) | Millipore | Cat#: 06–923; RRID:AB_310302 | WB (1:1000) |
| Antibody | Anti-beta actin (mouse monoclonal) | Abcam | Cat#: ab8224; RRID:AB_449644 | WB (1:4000) |
| Antibody | Anti-Atf1 (ATF1 2A9/8) (mouse monoclonal) | Abcam | Cat#: ab18123; RRID:AB_444264 | WB (1:2000) |
| Antibody | Anti-Mouse IgG- peroxidase (goat polyclonal) | Sigma Aldrich | Cat#: A5278; RRID:AB_258232 | WB (1:2000) |
| Antibody | Anti-Rabbit IgG- peroxidase (goat polyclonal) | Sigma Aldrich | Cat#: A6667; RRID:AB_258307 | WB (1:2000) |
| Antibody | Anti-Thiophosphate ester (rabbit monoclonal) | Abcam | Cat#: ab239919 | WB (1:5000) |
| Antibody | Anti-GST HRP-conjugated (goat polyclonal) | GE Healthcare | Cat#: RPN1236; RRID:AB_771429 | WB (1:5000) |
| Antibody | Anti-ubiquinin HRP-conjugated (mouse monoclonal) | Santa Cruz Biotechnology | Cat#: sc-8017; RRID:AB_628423 | WB (1:2000) |
| Commercial assay, kit | RNeasy mini kit | Quiagen | Cat#: 74104 | |
| Commercial assay, kit | iScript reverse transcription supermix | Bio-Rad | Cat#: 1708841 | |
| Commercial assay, kit | iTaq Universal SYBR Green Supermix | Bio-Rad | Cat#: 1725120 | |
| Commercial assay, kit | ECL Western Blotting Reagents | GE-Healthcare | Cat#: RPN2106 | |
| Chemical compound, drug | β-estradiol | Sigma Aldrich | Cat#: E2758 | 10–500 µM |
| Chemical compound, drug | PhosTag acrylamide | Wako Chemical | Cat#: 300–93523 | 15 µM |
| Chemical compound, drug | BrB-PP1 AKT inhibitor | Abcam | Cat#: ab143756 | 20 μM |
| Chemical compound, drug | PP1 Analog III, 3-MB-PP1 | Sigma Aldrich | Cat#: 529582 | 1 μM |
| Chemical compound, drug | Latrunculin A | Wako Chemical | Cat#: 129–04361 | 0.05–3 µM |
| Chemical compound, drug | Alexa fluor 488-conjugated phalloidin | Thermo Fischer Scientific | Cat#: A12379 | 200 units/ml (~6.6 µM) |
| Chemical compound, drug | Soybean lectin | Sigma Aldrich | Cat#: L2650 | 1 mg/ml |
| Software, algorithm | ImageJ | ImageJ | https://imagej.net/Fiji/Downloads | Quantification of western blots and microscopic analysis |
| Software, algorithm | Graphpad Prism 6.0 | Graphpad | https://www.graphpad.com/scientific-software/prism// | Statistical analysis and graphs representation |
| Other | μ-Slide eight well | Ibidi | Cat#: 80826 |
Additional files
-
Supplementary file 1
S. pombe and S. japonicus strains used in this study.
- https://cdn.elifesciences.org/articles/57951/elife-57951-supp1-v2.docx
-
Supplementary file 2
Oligonucleotides employed in this study.
- https://cdn.elifesciences.org/articles/57951/elife-57951-supp2-v2.docx
-
Transparent reporting form
- https://cdn.elifesciences.org/articles/57951/elife-57951-transrepform-v2.pdf
Download links
A two-part list of links to download the article, or parts of the article, in various formats.
Downloads (link to download the article as PDF)
Open citations (links to open the citations from this article in various online reference manager services)
Cite this article (links to download the citations from this article in formats compatible with various reference manager tools)
Stress-activated MAPK signaling controls fission yeast actomyosin ring integrity by modulating formin For3 levels
eLife 9:e57951.
https://doi.org/10.7554/eLife.57951


