Genome duplication in Leishmania major relies on persistent subtelomeric DNA replication
- The Wellcome Centre for Integrative Parasitology, University of Glasgow, Institute of Infection, Immunity and Inflammation, United Kingdom
- Department of Cell and Molecular Biology, Ribeirão Preto Medical School, University of São Paulo, Brazil
Figures
Figure 1 with 5 supplements

Detection of DNA replication initiation throughout the cell cycle in L. major.
(A) DNA content analysis by FACS of cells in exponential growth or in stationary phase; DNA was stained with Propidium Iodide (PI). 1C and 2C indicate single and double DNA content, respectively; gates used to sort exponentially growing cells into G1, early S (ES), late S (LS) and G2/M enriched populations are indicated. (B) Representative density plots from flow cytometry analysis to detect DNA synthesis in exponentially growing and stationary phase cells; cells were incubated with IdU for 30 min and IdU fluorescence was detected under denaturing conditions; 30,000 cells were analysed; 1C and 2C indicate single and double DNA content, respectively; dashed red lines indicate the threshold used to discriminate negative (black dots) from IdU-positive (blue dots) events; inset numbers indicate total percentage of IdU-positive events relative to the whole population. (C) Cells in exponential growth or in stationary phase were pulsed with 10 µM EdU for 1 hr, subjected to click reaction and then visualised by confocal microscopy and DAPI staining; n and k indicate DNA from the nucleus and kinetoplast, respectively. (D) MFA-seq profile for the indicated chromosomes; from top to bottom: first track shows previously published MFA-seq profile in ES using G2/M cells for normalisation Marques et al., 2015; second track shows MFA-seq profile of exponentially growing cells, not sorted, using stationary (STA) cells for normalisation; the remaining tracks show MFA-seq profile for exponentially growing cells, sorted in the indicated cell cycle stages, using STA cells for normalisation; MFA-seq signal is shown as ratios of reads for all samples (y-axes; enriched populations indicated to the right), plotted in five kbp windows across the length of the chromosomes (x-axes; chromosome sizes are indicated); the bottom track in each panel indicates annotated CDSs (blue: transcribed from left to right; pink: transcribed from right to left).
Figure 1—figure supplement 1
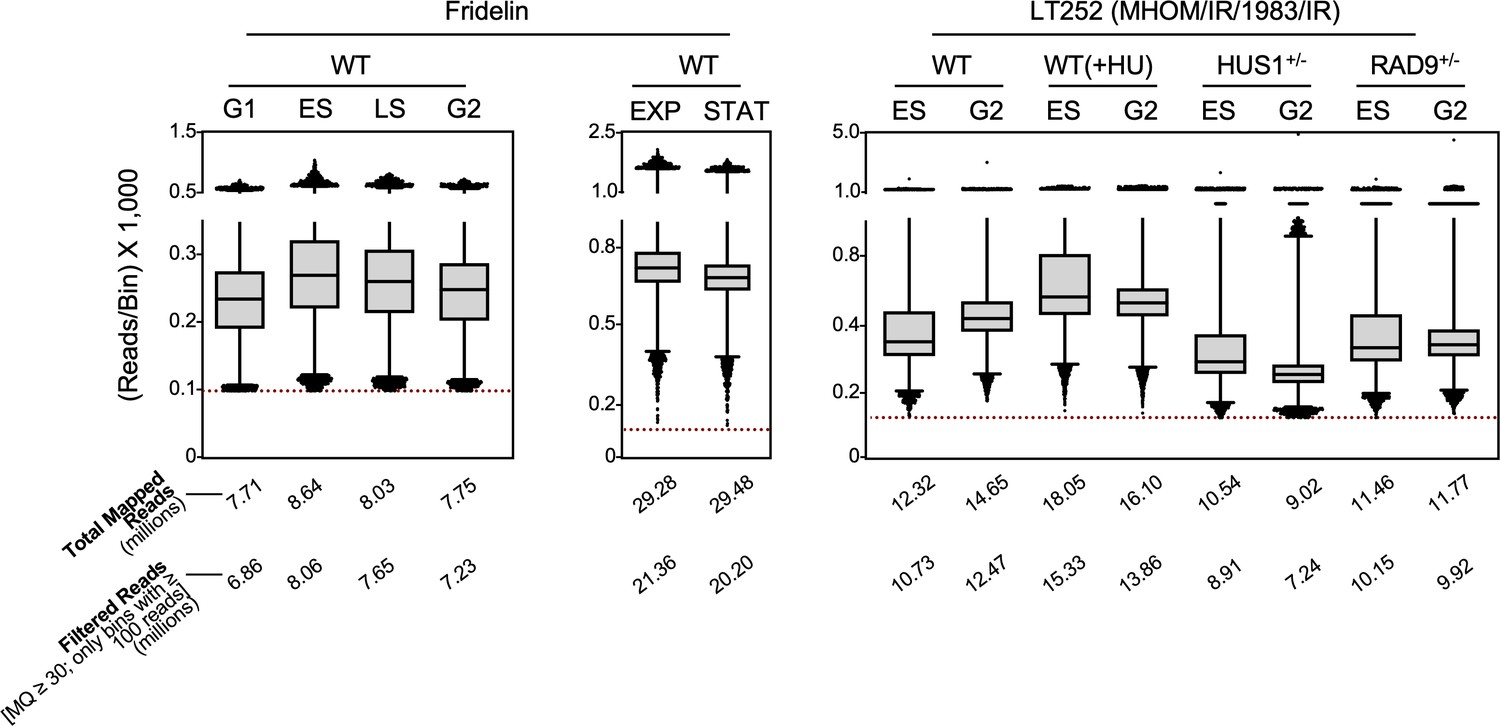
Distribution of reads per bin.
Box plots show read distribution in each 1 Kb bin for all samples used in this study. Only reads with map quality (MQ) ≥30 were considered for analysis. Bins with less than 100 reads (red dotted line) were also discarded.
Figure 1—figure supplement 2
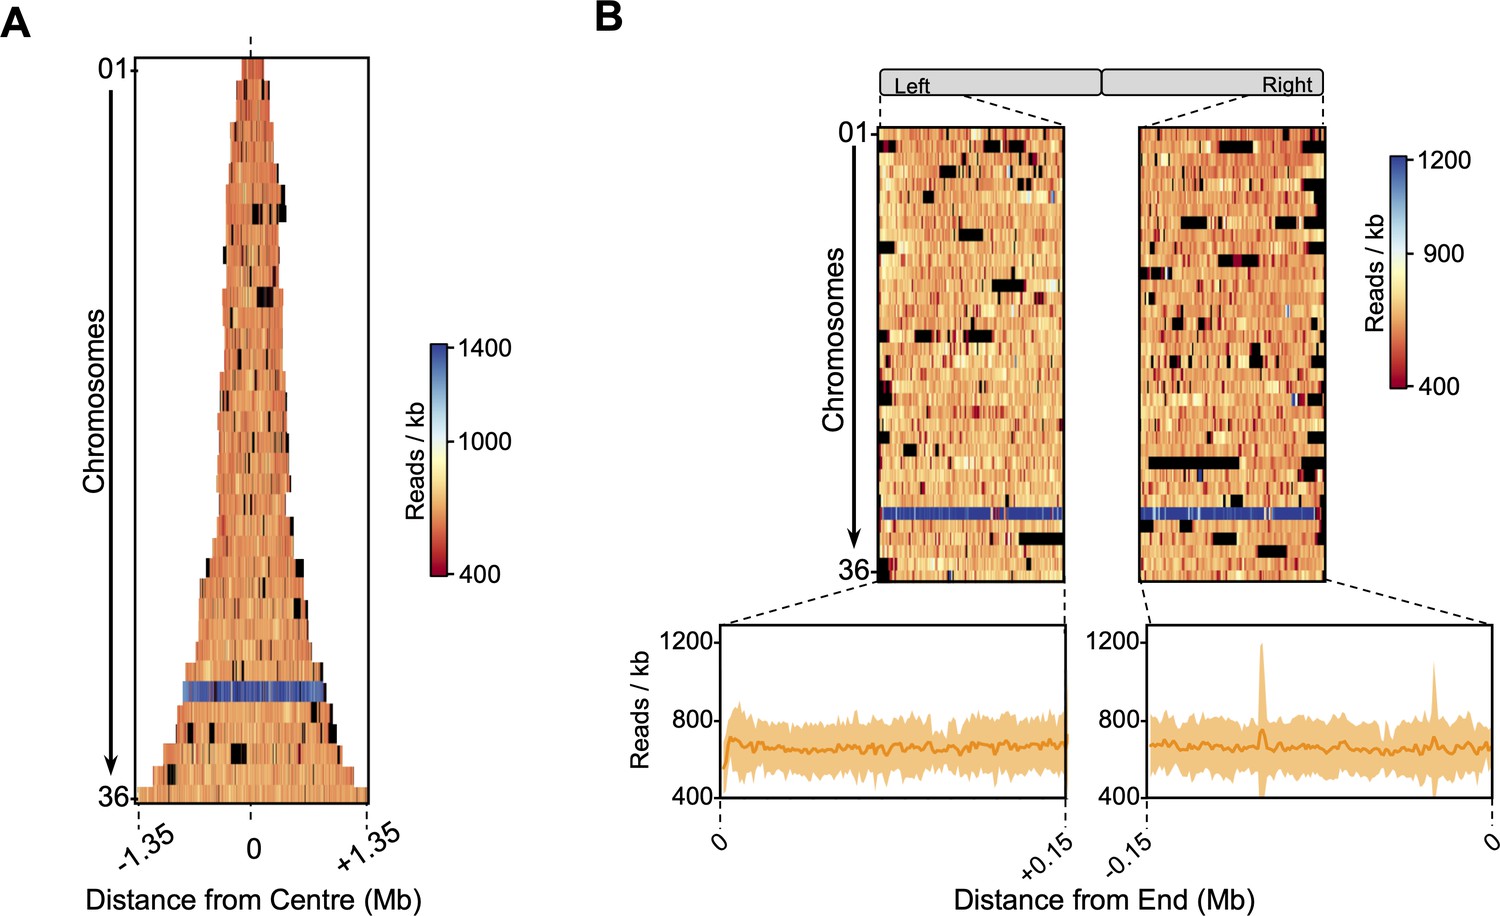
Stationary phase sequencing coverage.
All chromosomes (each row) were centred (A) or aligned to their left or right ends (B) and ordered according to their number, from smallest (top) to largest (bottom). In (A), row widths are proportional to chromosome size. Colour map indicates the sequencing coverage (number of reads per 1 Kb bin). Blue shaded row indicated higher coverage of the supernumerary chromosome 31. Black indicates bins removed from all analysis.
Figure 1—figure supplement 3
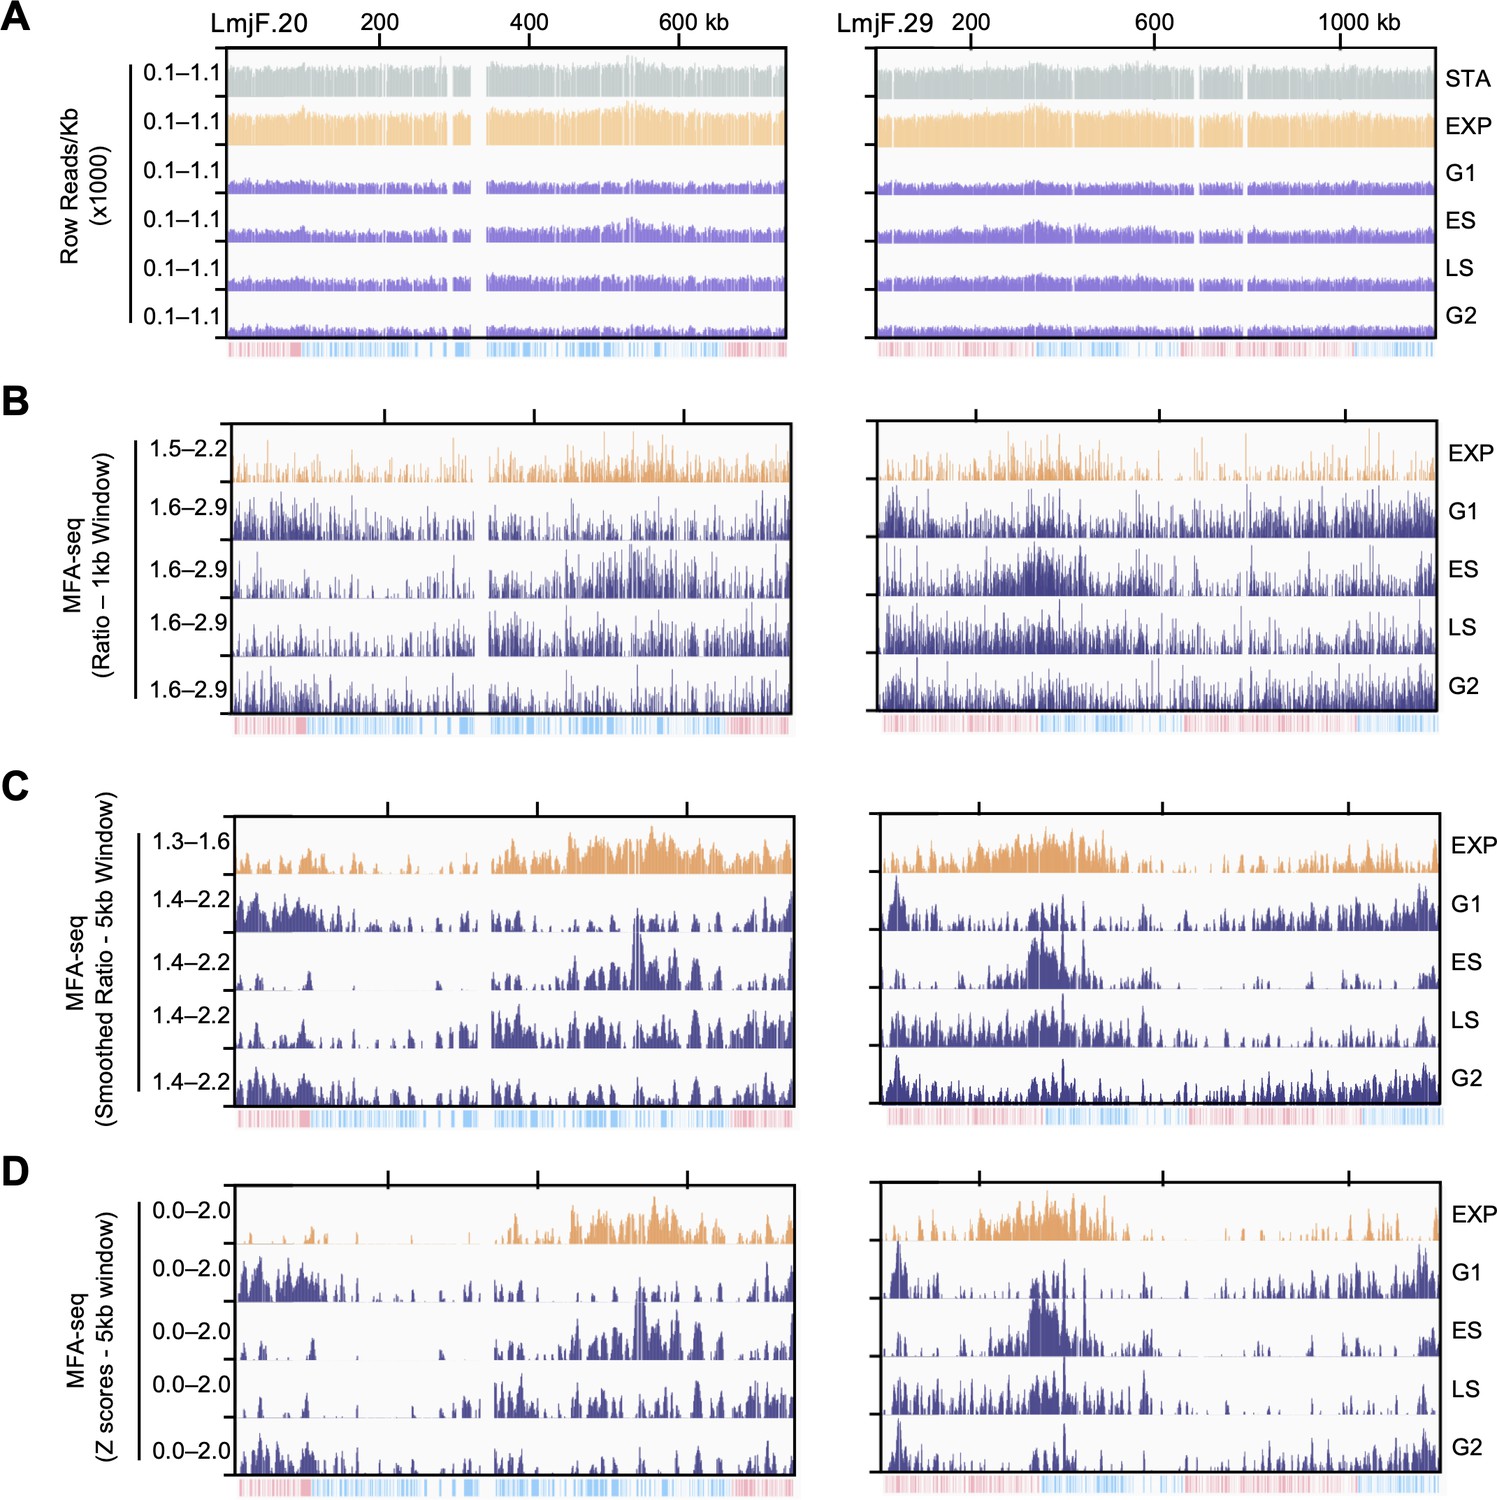
Overview of data analysis.
(A) Raw read distribution in each 1 Kb bin across the indicated chromosomes. (B) Normalised coverage (MFA-seq) is represented as ratios between the indicated cell cycle stages and stationary phase cells. Ratios were calculated in 1 kb windows across the genome. (C) Smoothed (5 kb sliding window) MFA-seq is also represented as ratios between the indicated cell cycle stages and stationary phase cells. All meta-analysis shown in main figures were performed with this dataset. (D) Smoothed MFA-seq (5 kb sliding window) is represented as Z scores. All meta-analysis using Z scores, shown in figure supplements, were performed with this dataset. In each panel, the bottom track indicates transcription direction (blue: left to right; pink: right to left) of annotated CDSs.
Figure 1—figure supplement 4
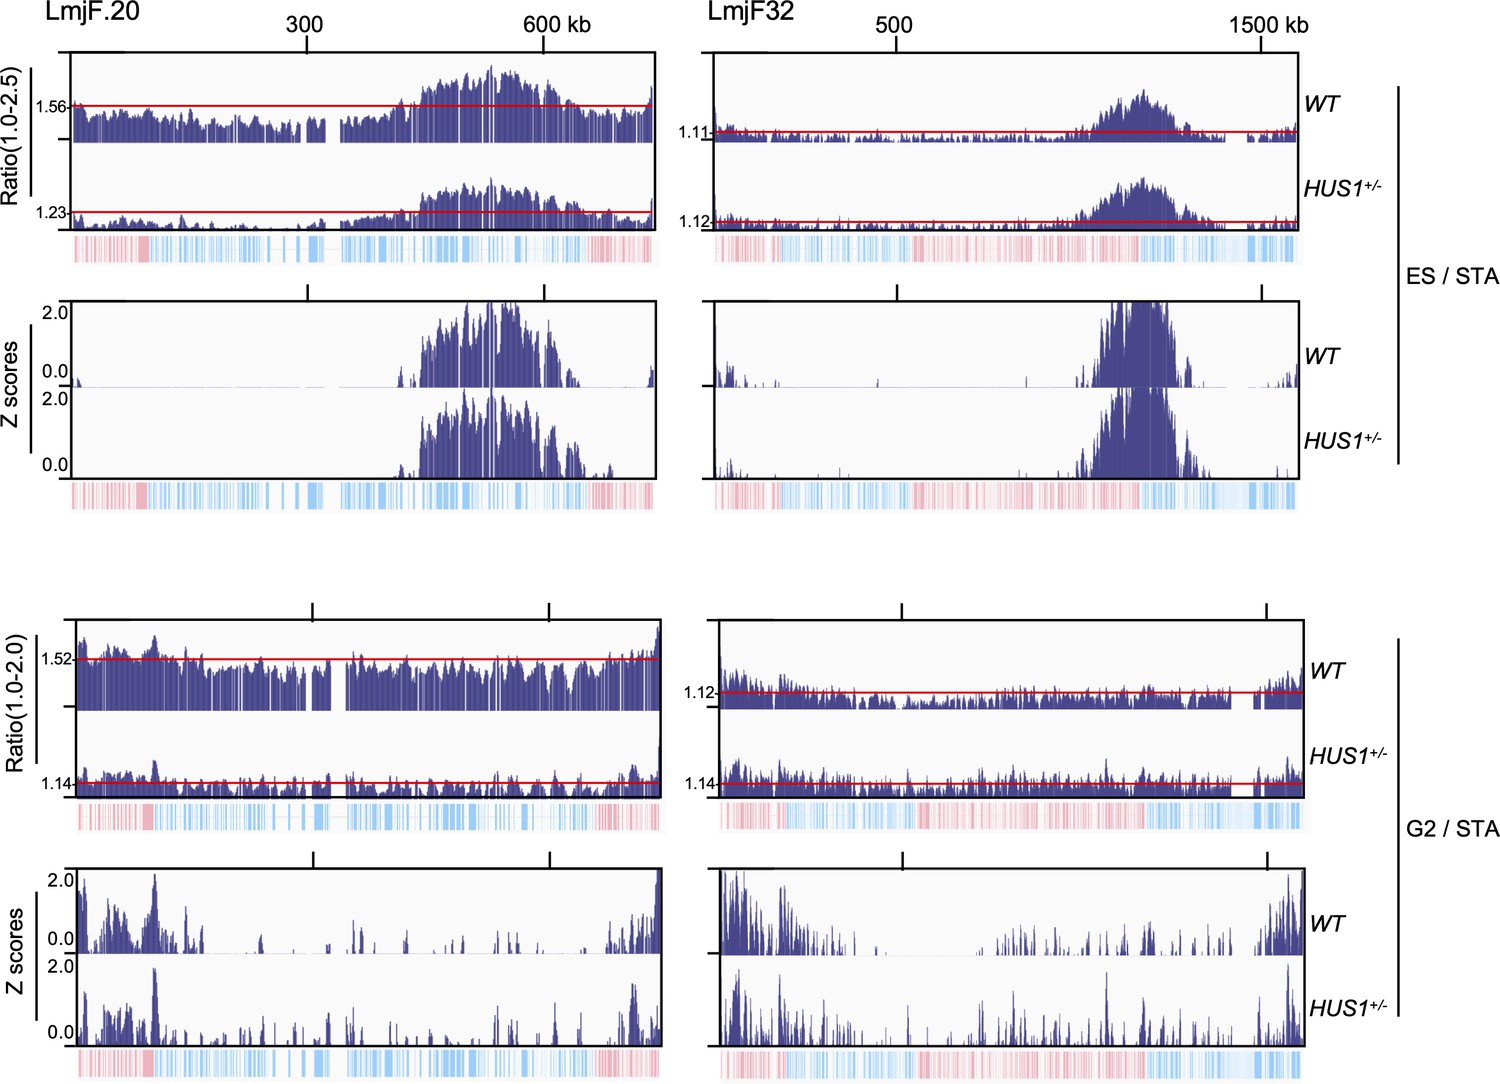
Comparing MFA-seq expressed as ratio and Z scores in the context of aneuploidy.
MFA-seq for ES and G2 cells is shown for chromosomes 20 (~3 copies in wild type (WT) cells) and 32 (~2 copies in both WT and HUS1+/- cells) as ratios in upper panels. Red lines indicate the average ratio, as calculated for each individual chromosome. The equivalent Z scores are shown at the bottom panels, as calculated for each individual chromosome. Note that using Z score for normalisation allows for direct comparison between chromosomes with distinct copy number both intra- and inter-cell line. In each panel, bottom tracks indicate transcription direction (blue: left to right; pink: right to left) of annotated CDSs.
Figure 1—figure supplement 5
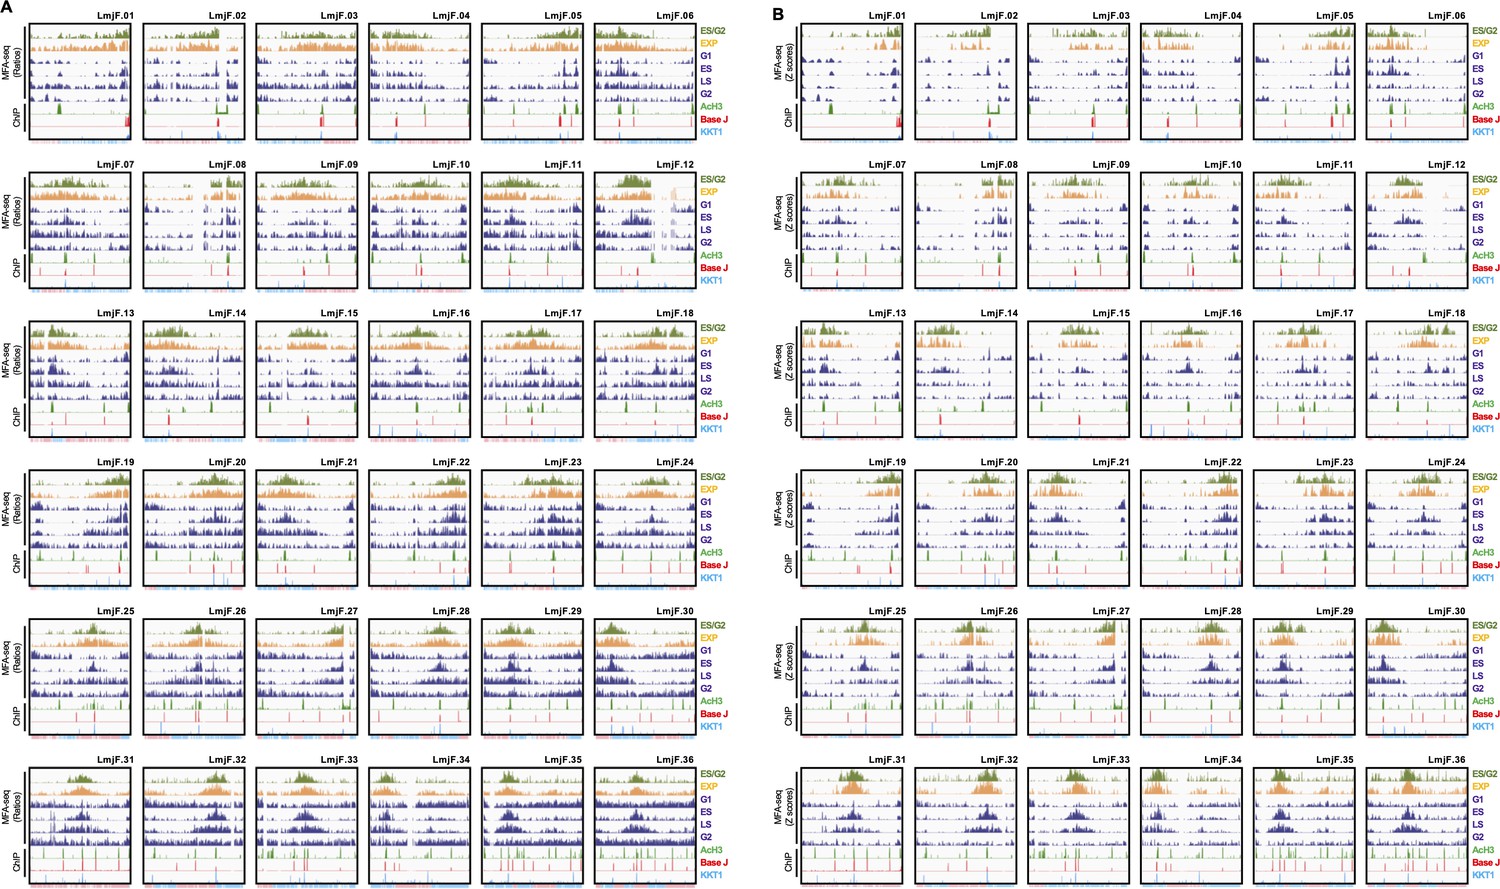
MFA-seq profile for all chromosomes of Leishmania major.
Data are plotted as ratios (ES/G2: 1–1.6; EXP: 1.3–1.6; G1, ES, LS, and G2: 1.4–2.2) and Z scores (G2/ES: 0–3; EXP: 0–1.5; G1, ES, LS ,and G2: 0–2.5) in (A and B), respectively. The profiles for the previous ES/G2 mapping (top track; Marques et al., 2015), unsorted (EXP) and sorted (G1, ES, LS, and G2/M) exponentially growing cells are shown. ChIP data showing enriched sites for AcH3, base J and KKT1 are also plotted (AcH3: 0.5–3; base J: 1000–4000; KKT1: 2–6). Tracks at the bottom of each panel represent annotated CDSs (blue: transcribed from left to right; pink: transcribed from right to left). Chromosomes are not shown to the same scale.
Figure 2

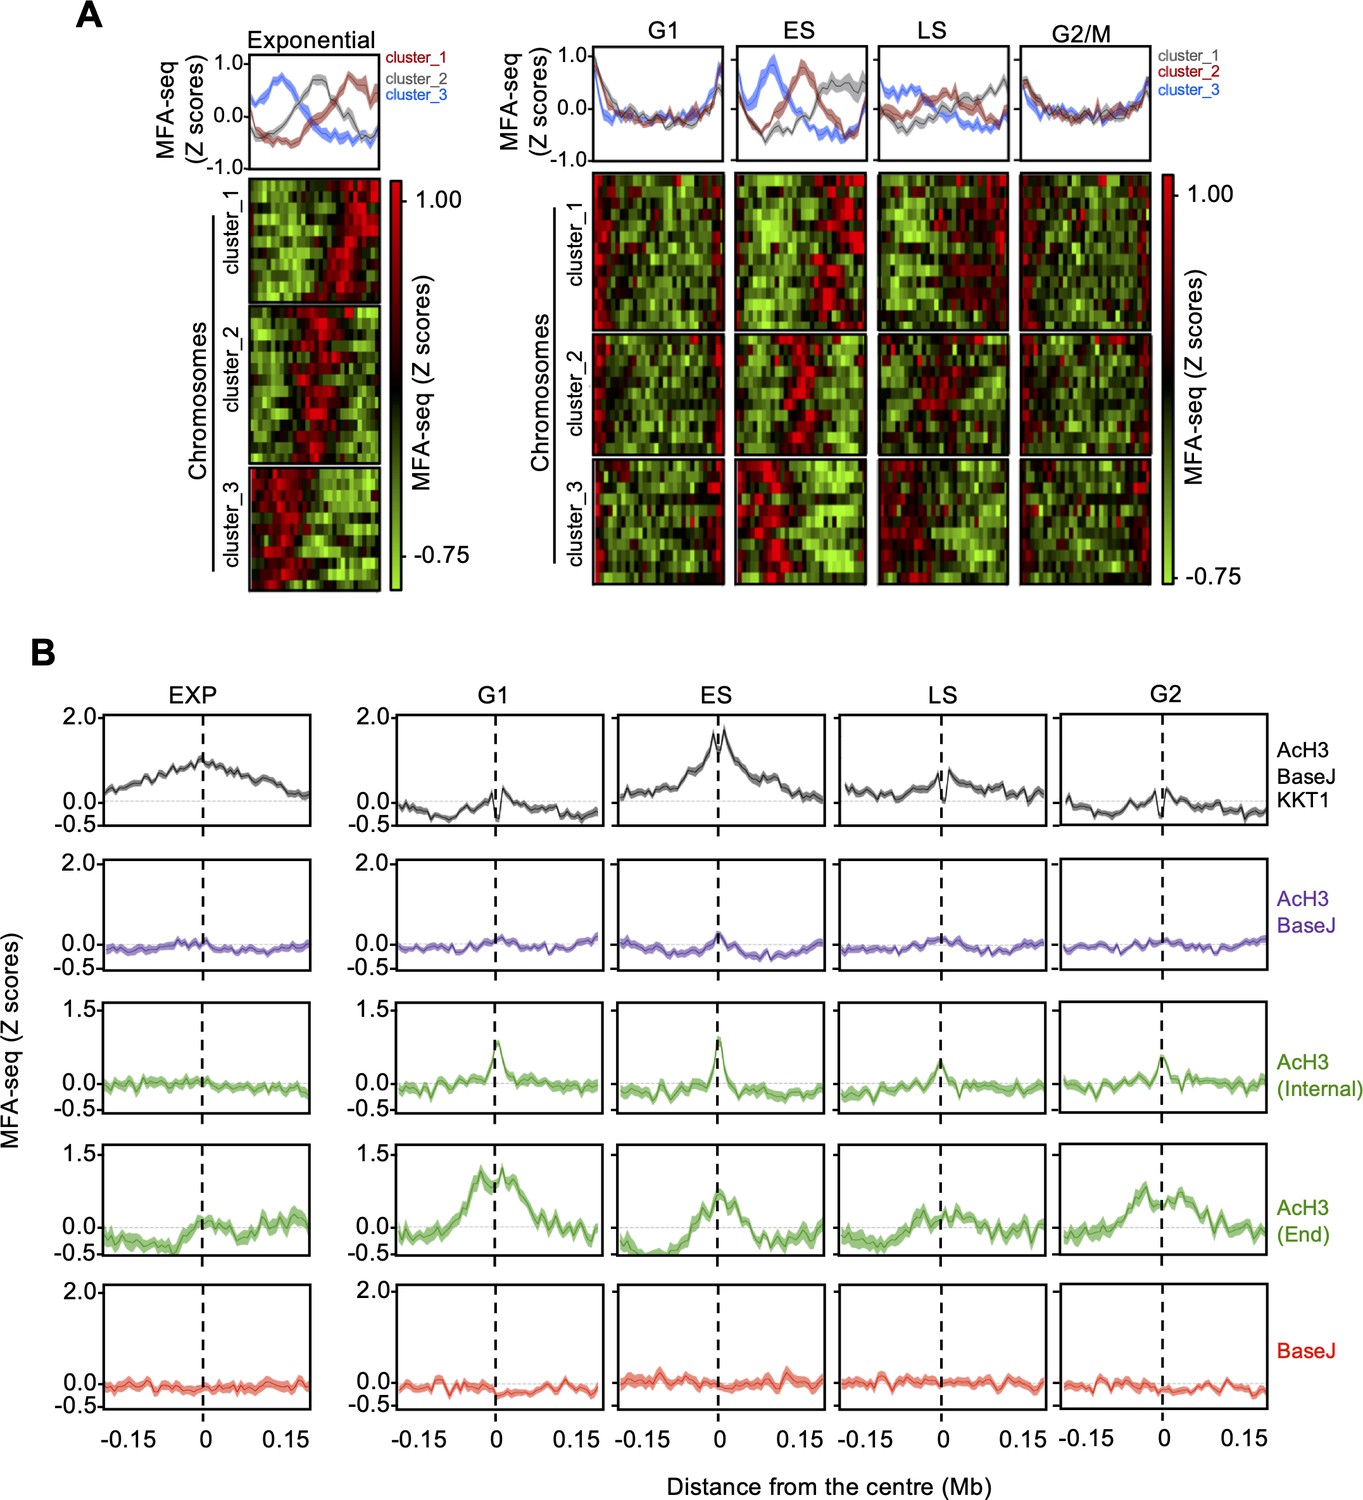
Changes in MFA-seq signal profile throughout the cell cycle.
MFA-seq profile in (A) exponentially growing or (B) sorted cells in the indicated phases of cell cycle, in both cases relative to stationary phase (STA) cells; panels at the top represent global MFA-seq signal for the whole genome; colourmaps indicate MFA-seq profile for individual chromosomes (each row). Chromosomes were grouped by k-means clustering, using deepTools. Chromosomes in each cluster from exponential cells: cluster_1–01, 03, 05, 08, 19, 20, 22, 23, 27, 28, 32; cluster_2–02, 09, 10, 12, 15, 16, 17, 18, 24, 25, 26, 31, 33, 36; cluster_3–04, 06, 07, 11, 13, 14, 21, 29, 30, 34, 35; chromosomes in each cluster from sorted cells: cluster_1–01, 02, 03, 05, 08, 18, 19, 20, 22, 23, 25, 27,28,32; cluster_2–09, 10, 12, 15, 16, 17, 24, 26, 31, 33, 36; cluster_3–04, 06, 07, 11, 13, 14, 29, 21, 30, 34, 35. (C) Replication timing was estimated by calculating the fold change between MFA-seq signal (ratio) from ES cells and MFA-seq signal (ratio) from G2 cells relative to STA; panels at the top represent global MFA-seq signal for the whole genome; colourmaps indicate MFA-seq profile for individual chromosomes (each row). (D) Chromosome size is plotted for each cluster shown in A and B; differences were analysed with a Kruskal-Wallis test; n.s., not significant. (E) Mean replication timing (as calculated in C) from each chromosome is plotted; left, chromosomes were grouped according to their sizes (small, medium and large) and P values, analysed with a Kruskal–Wallis test, are shown for each indicated pair; right, mean values were plotted for each individual chromosome, with R2 and P values for linear regression shown.
Figure 3 with 4 supplements

Changes in MFA-seq signal profile throughout the cell cycle are associated with distinct chromatin features.
(A) A representative region of chromosome 35, showing MFA-seq signals in the indicated phases of cell cycle, as compared to the positioning of AcH3, BaseJ and KKT1 enriched sites; the bottom track indicates annotated CDSs (blue: transcribed from left to right; pink: transcribed from right to left); for improved visualisation, segments of interest are shaded and magnified at the bottom. (B) Schematic illustration of regions of transcription initiation or termination, containing the indicated combination of chromatin markers; gray arrows indicate all possible configurations of surrounding multigene transcription direction; coordinates defining the boundaries of these regions were taken from Lombraña et al., 2016 and manually curated. (C) Metaplots of global MFA-seq signal, in exponential cells or at the indicated phases of the cell cycle, relative to STA cells ± 0.15 Mb from the centre of regions containing the indicated combination of chromatin marks; light-coloured areas around the lines indicate the standard error of the mean (SEM).
Figure 3—figure supplement 1
Changes in MFA-seq signal profile throughout the cell.
(A) MFA-seq profile in the indicated phases of cell cycle; panels at the top represent global MFA-seq signal for the whole genome. Colourmaps were plotted with GraphPad Prism and indicate MFA-seq profile for individual chromosomes (each row). (B) Metaplots of global MFA-seq signal, in the indicated phases of the cell cycle, ±0.15 Mb from the centre of regions containing the indicated combination of chromatin marks. Light-coloured areas around lines indicate the standard error of the mean (SEM). Data are represented as ratio relative to cells in stationary phase.
Figure 3—figure supplement 2
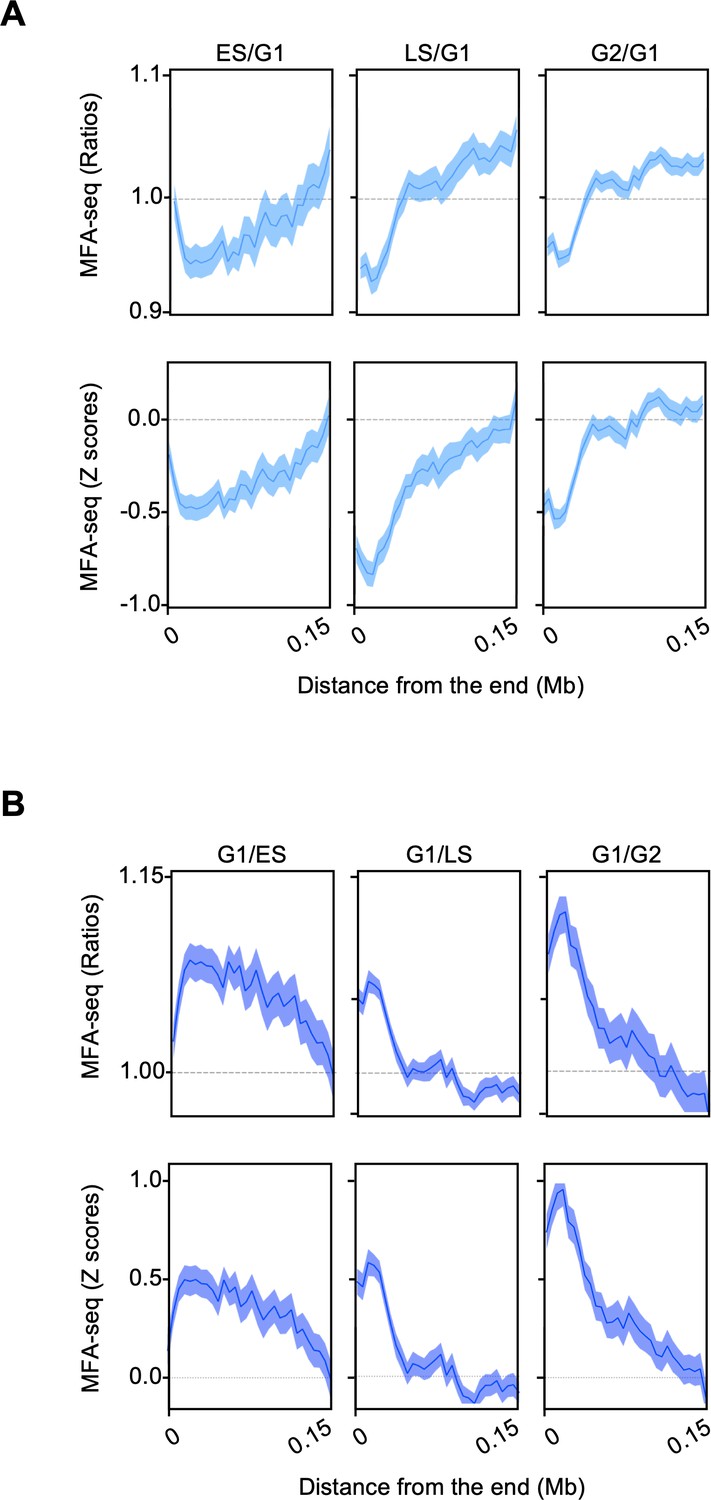
MFA-seq signal near chromosome’s ends.
(A) MFA-seq profile in the indicated phases of cell cycle was calculated relative to G1. (B) MFA-seq profile in G1 was calculated relative to the indicated phases of cell cycle. Signal near chromosome’s ends is plotted. Panels at the top and bottom represent the ratios and Z scores, respectively.
Figure 3—figure supplement 3
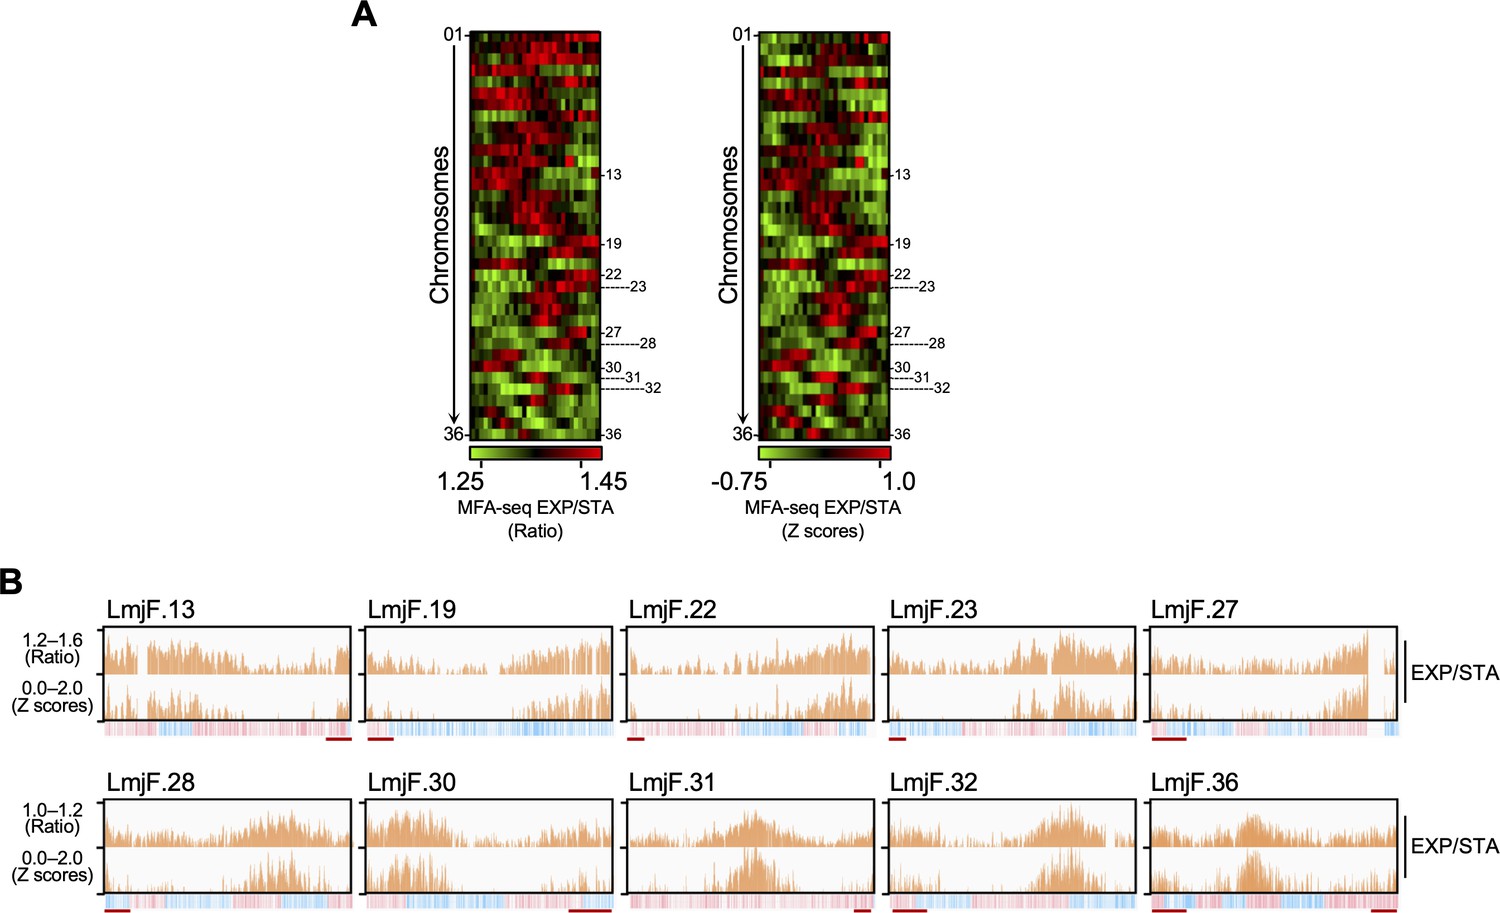
MFA-seq of exponentially growing cells.
(A) Colourmap representing MFA-seq (ratio at the left; Z scores at the right) of all chromosomes from exponentially growing cells relative to stationary cells. Chromosomes where MFA-seq signal was visually detected near chromosome ends are numbered at the side of each colourmap. (B) MFA-seq profile for chromosomes indicated in (A) are shown as histograms. Red lines indicate MFA-seq signal near chromosome’ ends. In each panel, bottom track indicates transcription direction (blue: left to right; pink: right to left) of annotated CDSs.
Figure 3—figure supplement 4
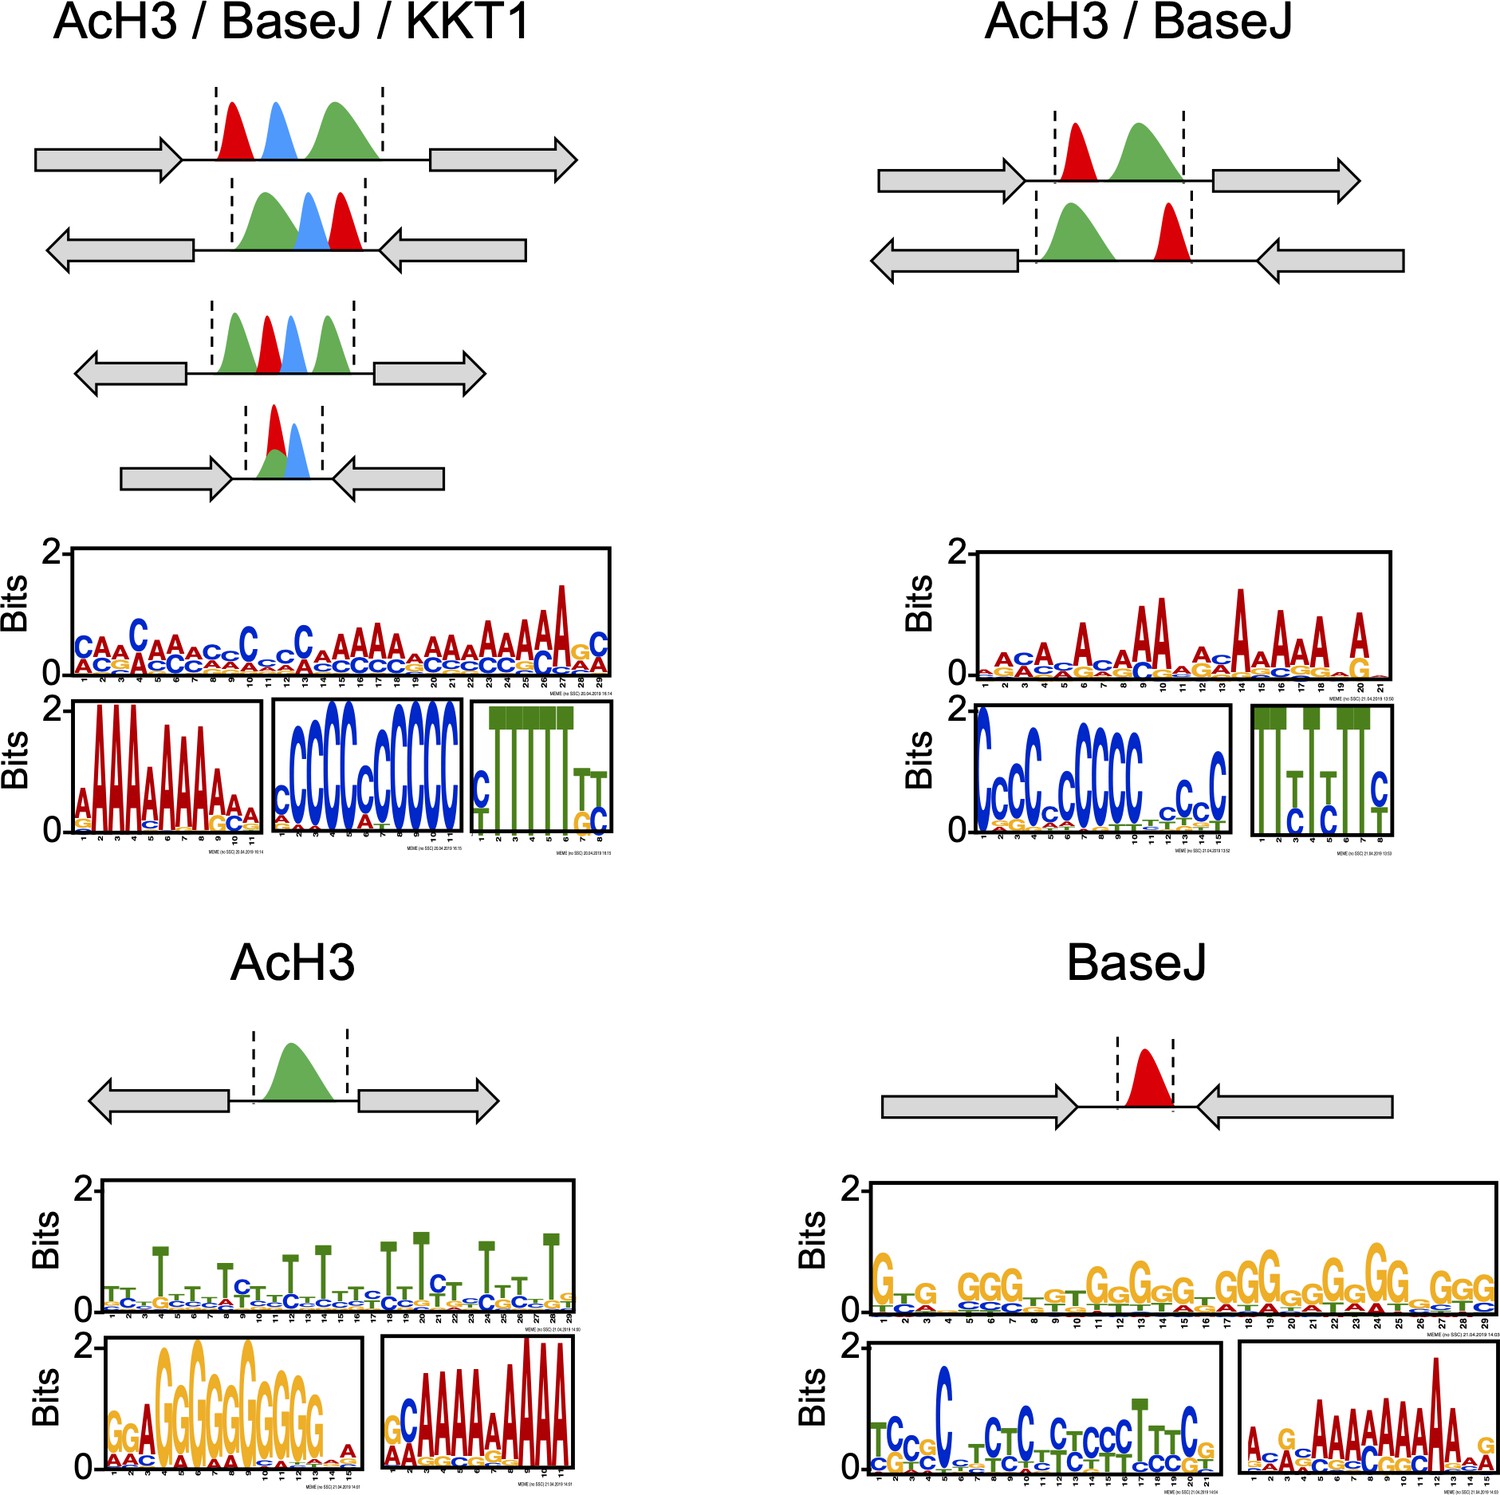
DNA sequence within the regions containing the indicated combination of the chromatin markers was subject to MEME analysis; top three motifs (most abundant and lowest p-value) found within each region are shown.
Figure 4

Predicted DNA replication initiation regions are related to distinct patterns of G skew, T skew and G4 accumulation.
(A) Representative regions of chromosomes 30 and 31, showing MFA-seq signals in ES/STA, compared to the positioning of the indicated chromatin markers; G and T skews are also shown; the bottom track in each panel indicates annotated CDSs (blue: transcribed from left to right; pink: transcribed from right to left). (B) Shaded areas in A are magnified, and now include G4 peaks distribution for both forward (Fw strand) and reverse (Rv strand) DNA strands. (C and D) Metaplots of global G and T skews (C) and G4 distribution (D) ± 10 kb from the centre of regions containing the indicated combination of chromatin markers; light-coloured areas around lines indicates SEM.
Figure 5
Local patterns of G and T skews at early S phase replication initiation are associated with co-directional transcription and DNA replication activity.
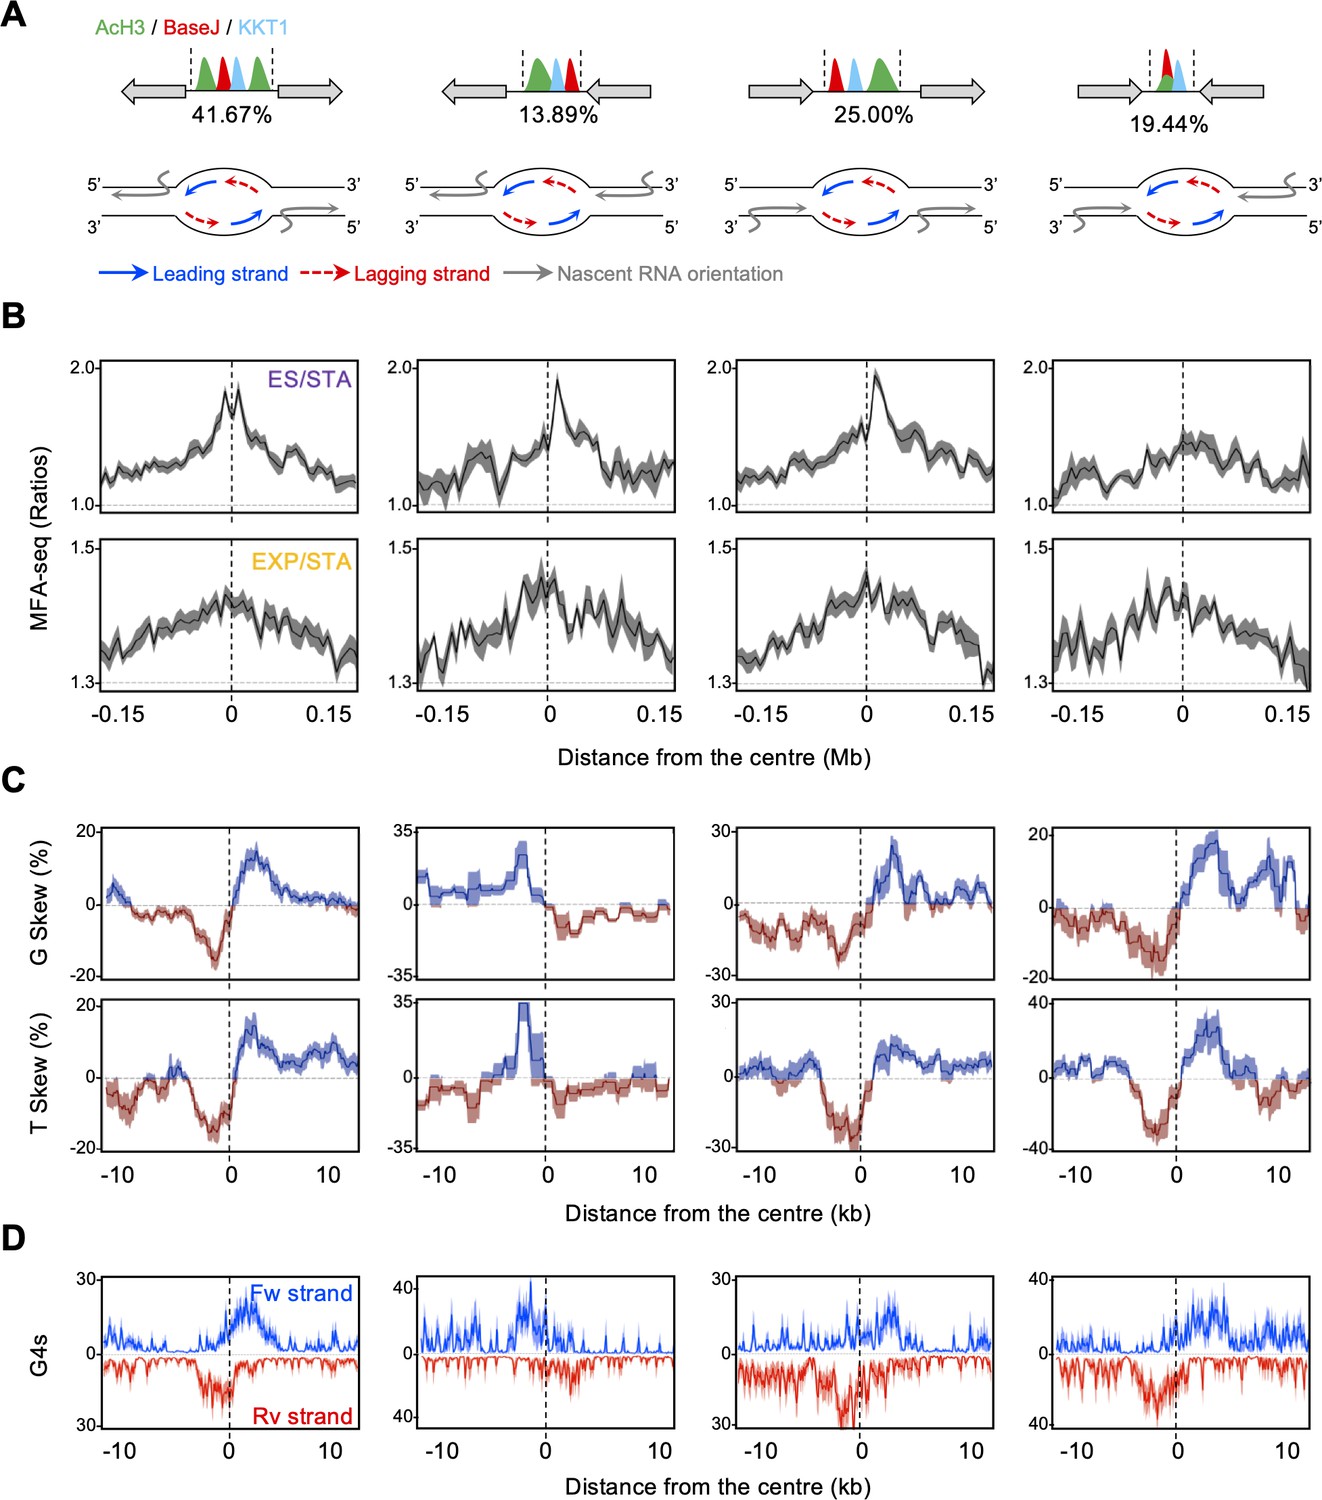
(A) Top: a schematic illustration of sites containing simultaneous deposition of AcH3, BaseJ and KKT1, with gray arrows indicating all possible configurations of surrounding multigenic transcription direction; numbers below each scheme indicates the proportion of each configuration. Bottom: schematic illustration of transcription and replication organisation on the DNA strands at each of these sites. (B), (C and D) MFA-seq profile (ES/STA and EXP/STA), base skews (G and T) and G4 pattern (forward and reverse DNA strands) are shown, respectively, for each of these sites as metaplots.
Figure 6 with 2 supplements
DNA replication close to chromosome ends is more sensitive to replication stress than replication at chromosome-central loci.
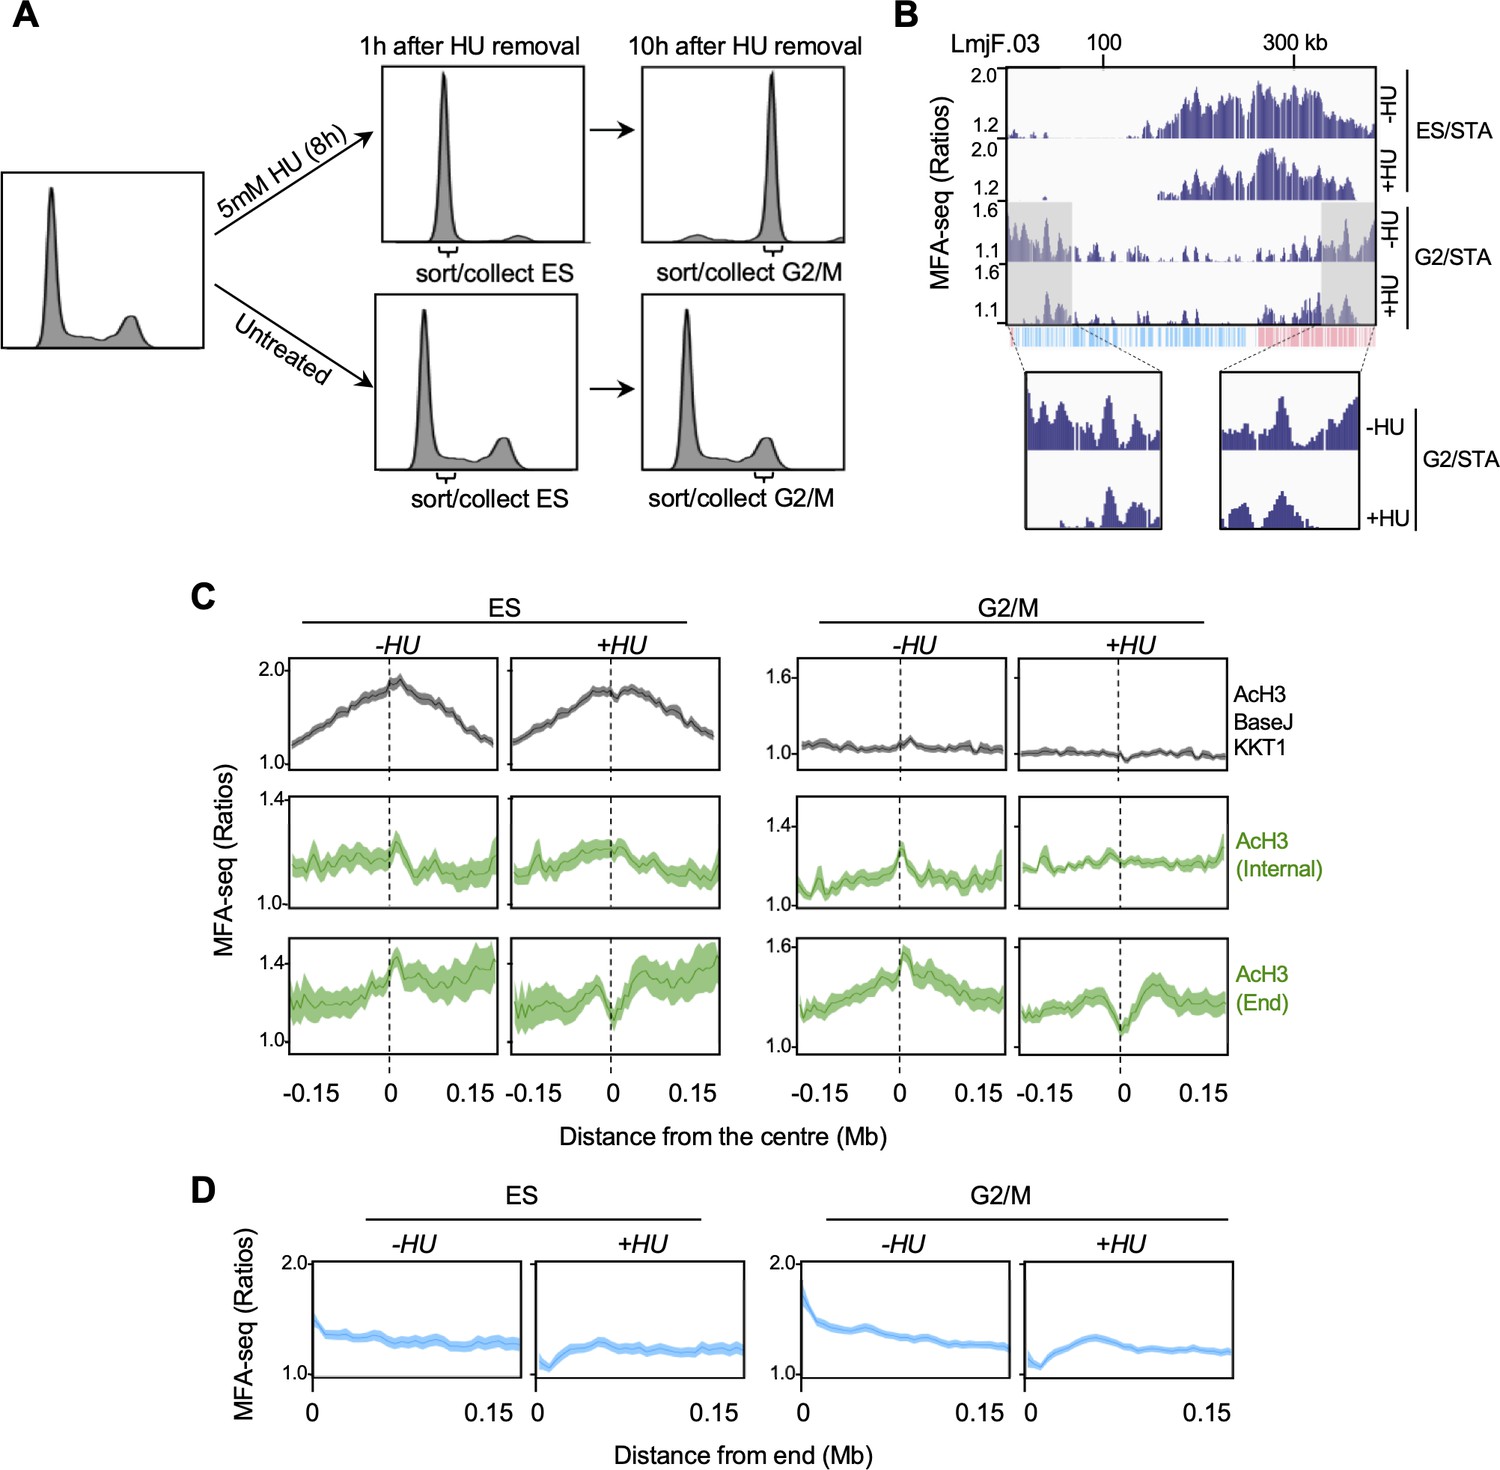
(A) Cells were left untreated or treated with hydroxyurea (HU) and, at the indicated times after HU removal, sorted and the indicated cell cycle stages were collected; plots show FACS profiles of the cell populations after PI staining. (B) MFA-seq profile for the indicated phases of the cell cycle relative to STA, with or without prior HU treatment, in the indicated region of chromosome 3; shaded areas are magnified in the boxes at the bottom to highlight the differences in MFA-seq signal at regions close to chromosome end, upon HU treatment; the bottom track indicates annotated CDSs (blue: transcribed from left to right; pink: transcribed from right to left). (C) Metaplots of global MFA-seq signal, in the indicated phases of the cell cycle,±0.15 Mb from the centre of regions containing the indicated combination of chromatin markers; lines represent mean read ratios and light-coloured areas indicate SEM. (D) Metaplots of global MFA-seq signal for the indicated phases of cell cycle relative to STA, with or without prior HU treatment, across 0.15 Mb of all chromosome ends.
Figure 6—figure supplement 1
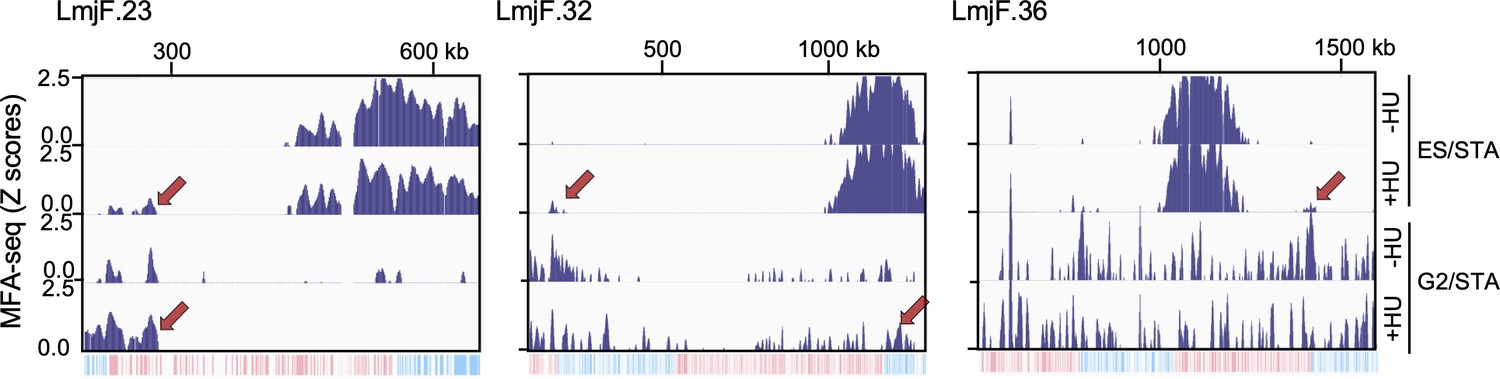
MFA-seq profile of cells at the indicated phases of cell cycle, with or without prior HU treatment; red arrows indicate sites with increased MFA-seq signal in HU treated cells, as compared with not treated cells.
Figure 6—figure supplement 2
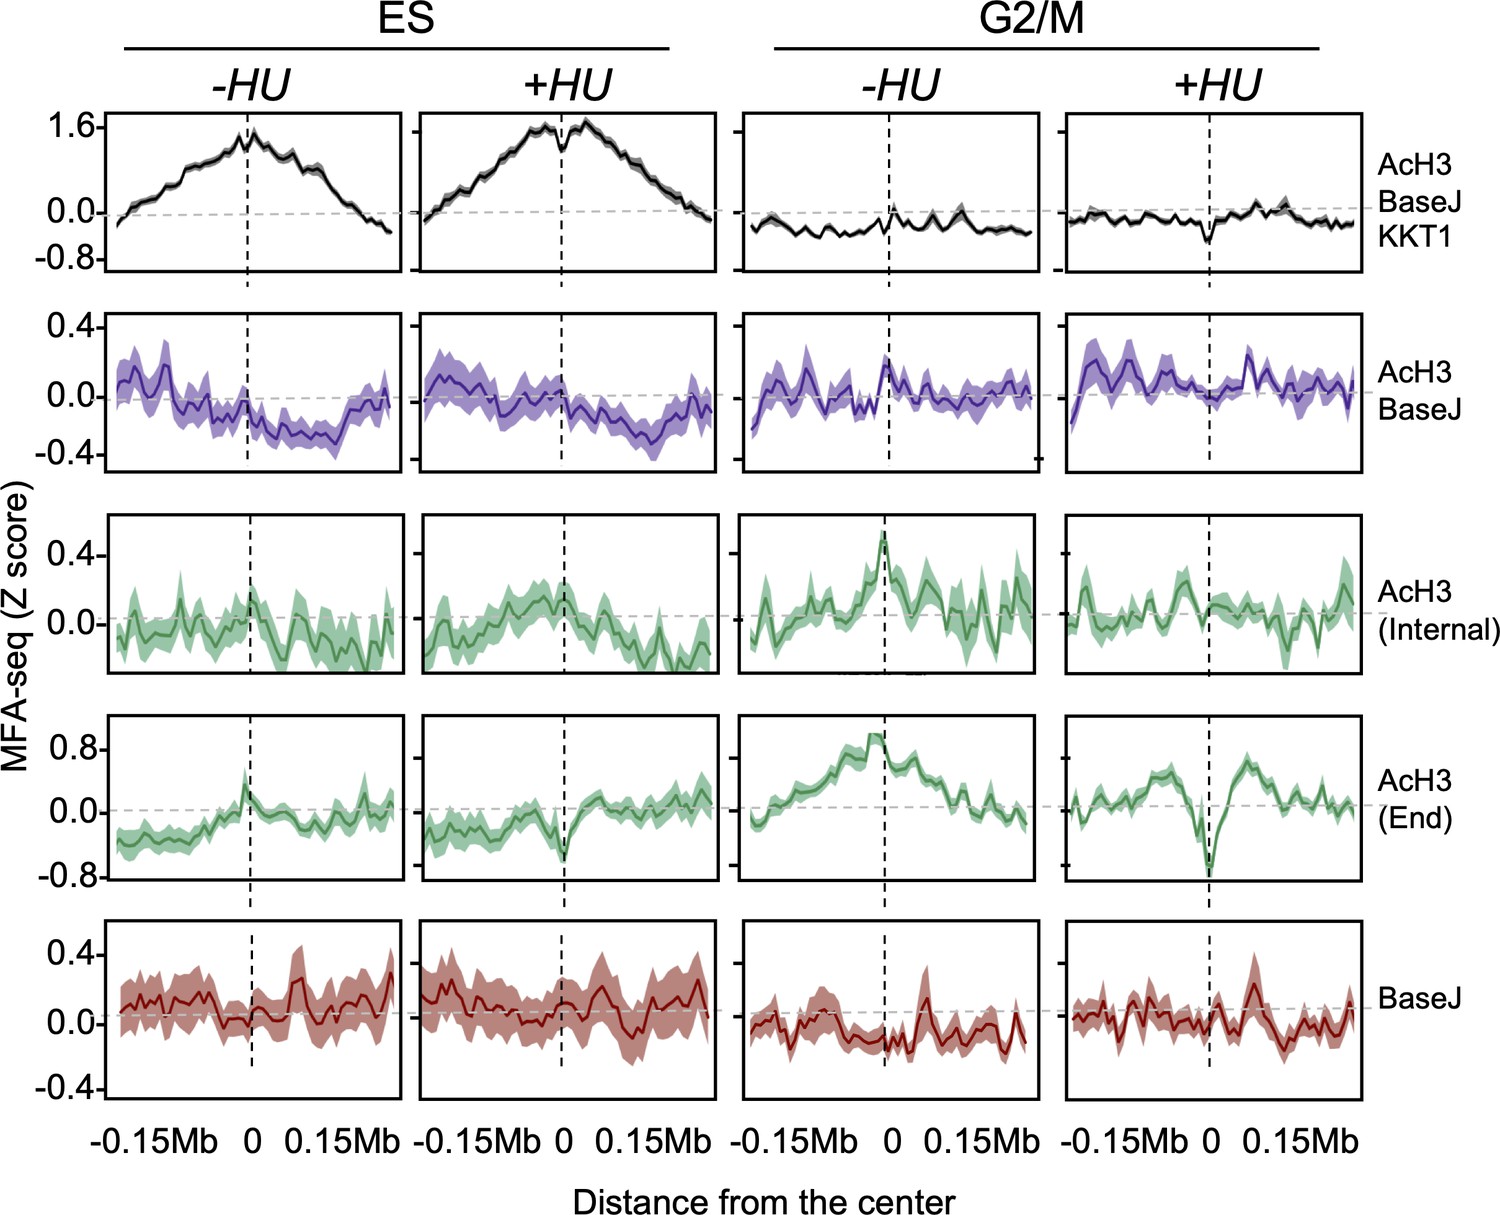
Extended data for Figure 6.
Cells were left untreated or treated with HU and then sorted into the indicated cell cycle stages; the global MFA-seq signal around the sites with the indicated combination of chromatin markers, during the indicated phases of cell cycle, with or without prior HU treatment, is plotted; light-coloured area around lines indicates SEM.
Figure 7 with 2 supplements
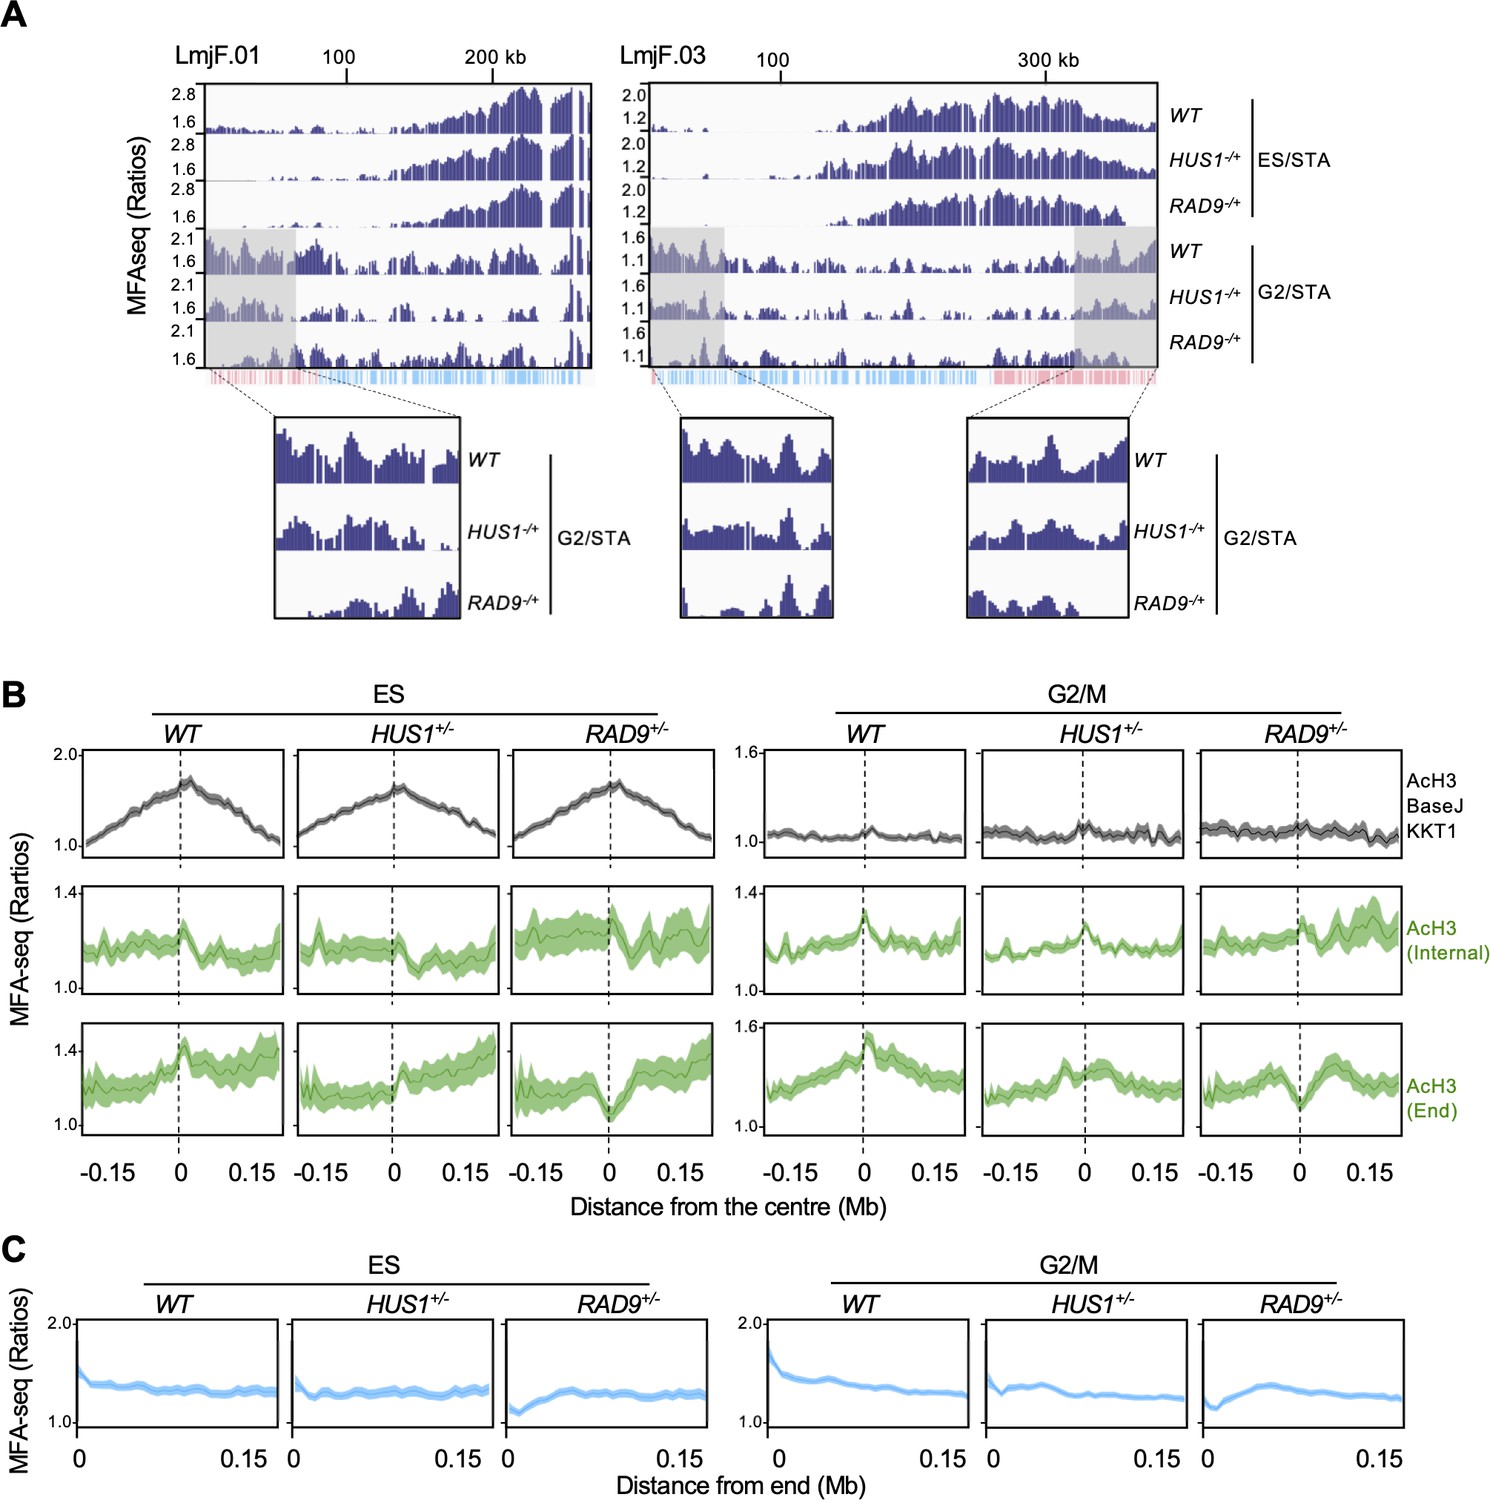
RAD9 and HUS1 are required for DNA replication near chromosome ends.
(A) MFA-seq profile of wild type (WT), RAD9+/- and HUS1+/- cells at the indicated phases of cell cycle across chromosomes 1 and 3; shaded areas are magnified in the boxes at the bottom to highlight the differences in MFA-seq signal at regions close to chromosome ends; the bottom track indicates annotated CDSs (blue: transcribed from left to right; pink: transcribed from right to left). (B) Metaplots of global MFA-seq signal of WT, RAD9+/- and HUS1+/- cells, in the indicated phases of the cell cycle,±0.15 Mb from the centre of regions containing the indicated combination of chromatin markers. (C) Metaplots of global MFA-seq signal of WT, RAD9+/- and HUS1+/- cells, in the indicated phases of cell cycle, at the terminal 0.15 Mb of all chromosomes. In (B and C), lines represent mean read ratios and the lighter shaded areas indicate SEM.
Figure 7—figure supplement 1
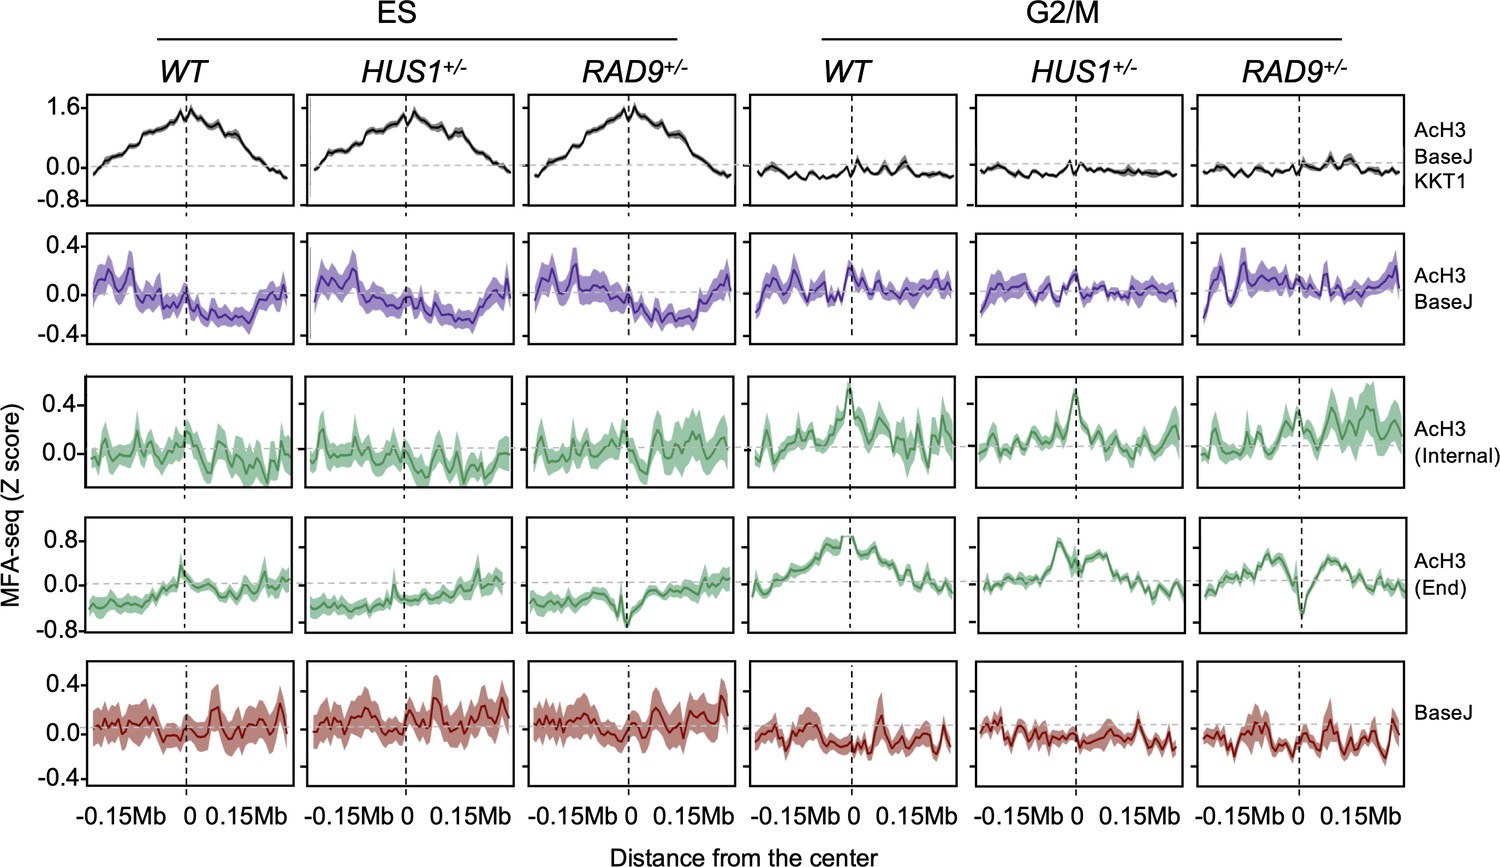
Extended data for Figure 7.
The global MFA-seq signal around the sites with the indicated combination of chromatin markers, during the indicated phases of cell cycle, in WT, HUS1+/- and RAD9+/- cells is plotted; light-coloured area around lines indicates SEM.
Figure 7—figure supplement 2
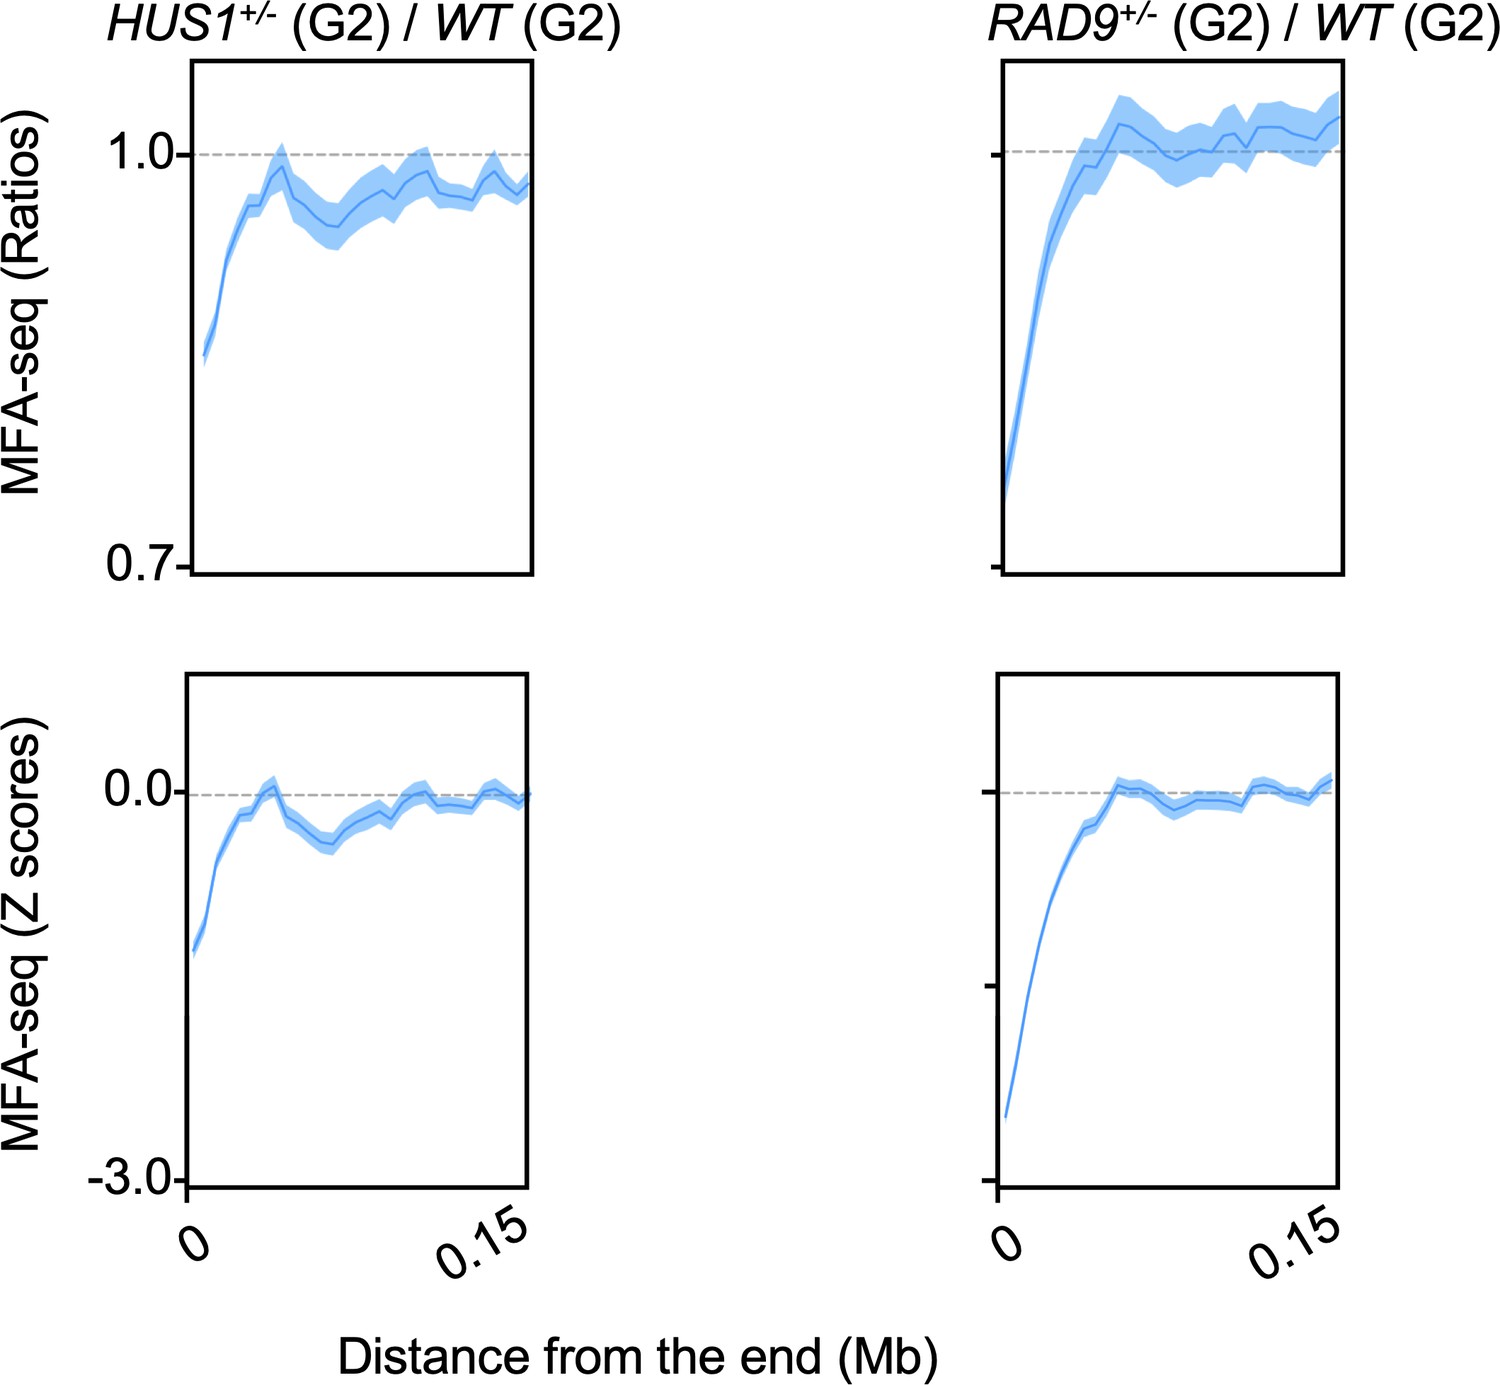
MFA-seq signal near chromosome ends upon deficiency of HUS1 and RAD9.
MFA-seq profile from HUS1+/- and RAD9+/- cells sorted into G2 was calculated relative to WT cells sorted into G2. Signal near chromosome ends is plotted. Panels at the top and bottom represent the ratios and Z scores, respectively.
Additional files
Download links
A two-part list of links to download the article, or parts of the article, in various formats.
Downloads (link to download the article as PDF)
Open citations (links to open the citations from this article in various online reference manager services)
Cite this article (links to download the citations from this article in formats compatible with various reference manager tools)
Genome duplication in Leishmania major relies on persistent subtelomeric DNA replication
eLife 9:e58030.
https://doi.org/10.7554/eLife.58030


