Long-term potentiation is independent of the C-tail of the GluA1 AMPA receptor subunit
- Department of Cellular and Molecular Pharmacology, University of California, San Francisco, United States
- Nancy Pritzker Laboratory, Department of Psychiatry and Behavioral Sciences, Stanford University School of Medicine, United States
- Gladstone Institute of Neurological Disease, United States
- Department of Neurology, University of California, San Francisco, United States
Figures
Figure 1 with 3 supplements
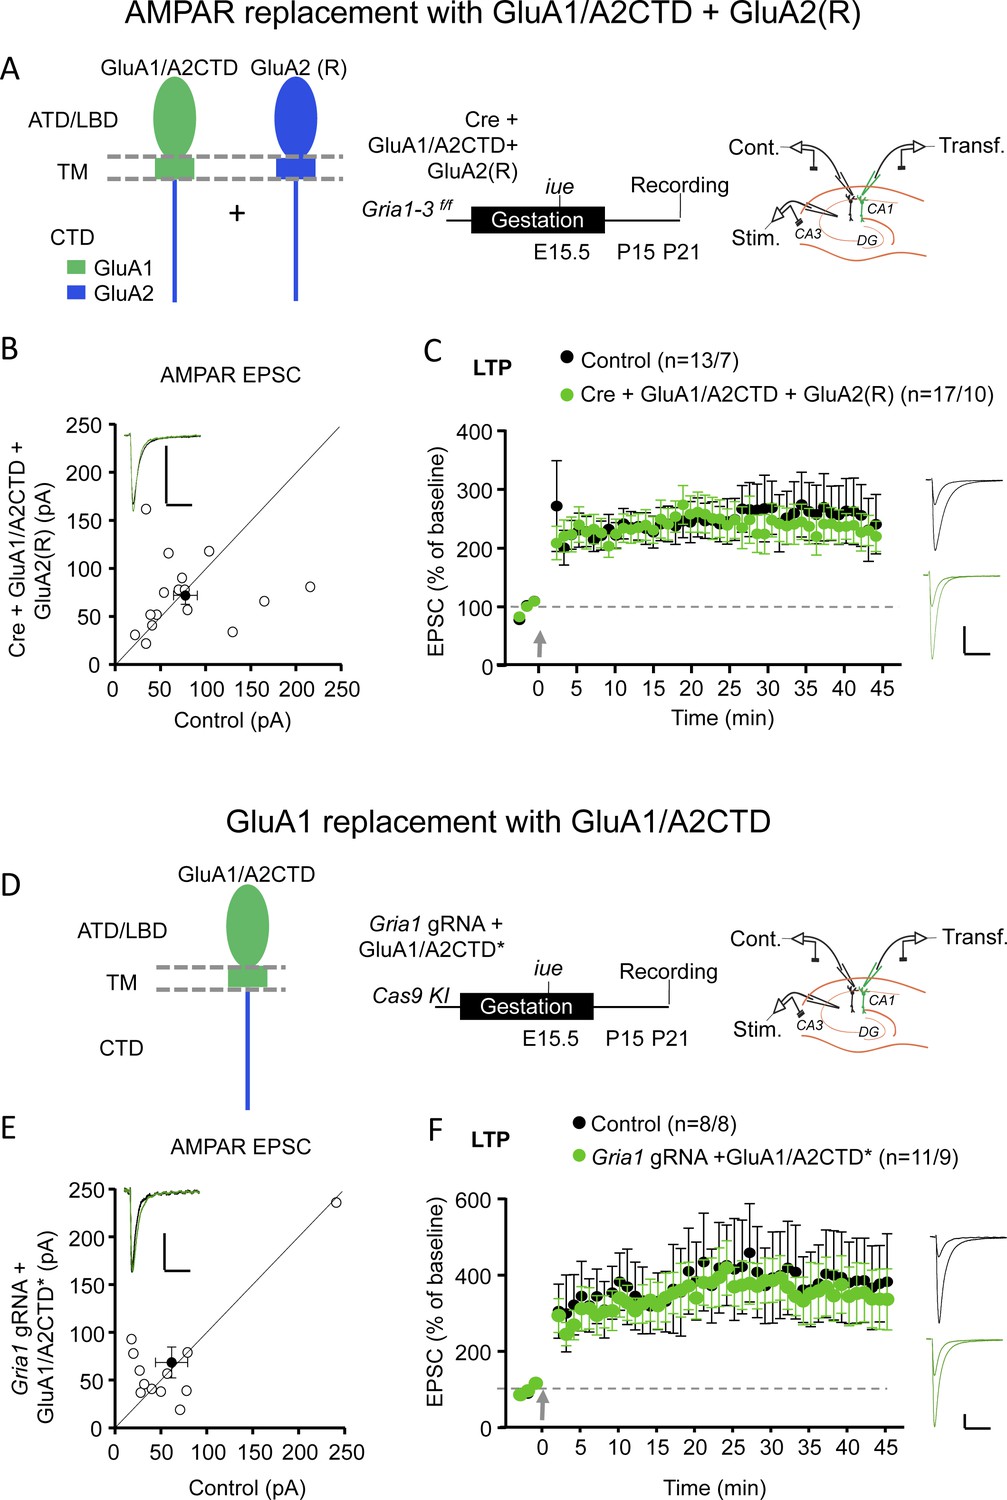
GluA1/A2CTD supports LTP.
(A) Left panel, schematic illustration of the recombinant AMPAR subunits employed to replace endogenous AMPAR: GluA1/A2CTD and (edited) GluA2 (R) in hippocampal CA1 pyramidal neurons from Gria1-3 f/f mice. Note that these two subunits form heteromeric, non-rectifying AMPAR (see Figure 1—figure supplement 2). ATD, amino-terminal domain; LBD, ligand-binding domain; TM, transmembrane domain; CTD, carboxy-terminal domain. Middle panel, summary and timeline of the experiment. Right panel, schematic illustration of the experimental setup with simultaneous whole-cell recordings from control and transfected CA1 pyramidal neurons. (B) Scatterplot measuring the baseline EPSC size at −70 mV in control (X axis) and Cre + GluA1/A2CTD + GluA2 (R) expressing (Y axis) neurons. Open circles represent individual pairs of control and transfected neurons, filled circle represents mean ± SEM. Inset shows sample traces from a control (black trace) and a transfected (green trace) cell. n = 16 pairs. p=0.804, two-tailed Wilcoxon signed-rank test. (C) Plot representing the mean ± SEM EPSC at −70 before and after LTP induction (arrow) normalized by the average baseline EPSC size (dashed gray line) in control (filled circles) and Cre + GluA1/A2CTD + GluA2 (R) expressing (green circles) CA1 pyramidal neurons. Sample traces before and 45’ after LTP induction in control (black traces) and transfected (green traces) CA1 pyramidal neurons are shown to the right of the plot. n initial/final = 13/7 control, 17/10 transfected neurons. p=0.775 (min. 45), unpaired t-test. (D) Left panel, schematic illustration of the recombinant AMPAR subunit employed to replace endogenous GluA1: GluA1/A2CTD in hippocampal CA1 pyramidal neurons from Cas9 KI mice. Middle panel, summary and timeline of the experiment. Right panel, schematic illustration of the experimental setup with simultaneous whole-cell recordings from control and transfected CA1 pyramidal neurons. (E) Scatterplot measuring the baseline EPSC size at −70 mV in control (X axis) and Gria1 gRNA + GluA1/A2CTD expressing (Y axis) neurons. Open circles represent individual pairs of control and transfected neurons, filled circle represents mean ± SEM. Inset shows sample traces from a control (black trace) and a transfected (green trace) cell. n = 12 pairs. p=0.557, two-tailed Wilcoxon signed-rank test. (F) Plot representing the mean ± SEM EPSC at −70 mV before and after LTP induction (arrow) normalized by the average baseline EPSC size (dashed gray line) in control (filled circles) and Gria1 gRNA + GluA1/A2CTD expressing (green circles) CA1 pyramidal neurons. Sample traces before and 45’ after LTP induction in control (black traces) and transfected (green traces) CA1 pyramidal neurons are shown to the right of the plot. Scale bars: 50 pA, 50 ms. n initial/final = 8/8 control, 11/9 transfected neurons. p=0.683 (min 45), unpaired t-test.
-
Figure 1—source data 1
Contains source data for Figure 1.
GluA1/A2CTD supports LTP.
- https://cdn.elifesciences.org/articles/58042/elife-58042-fig1-data1-v2.xlsx
Figure 1—figure supplement 1
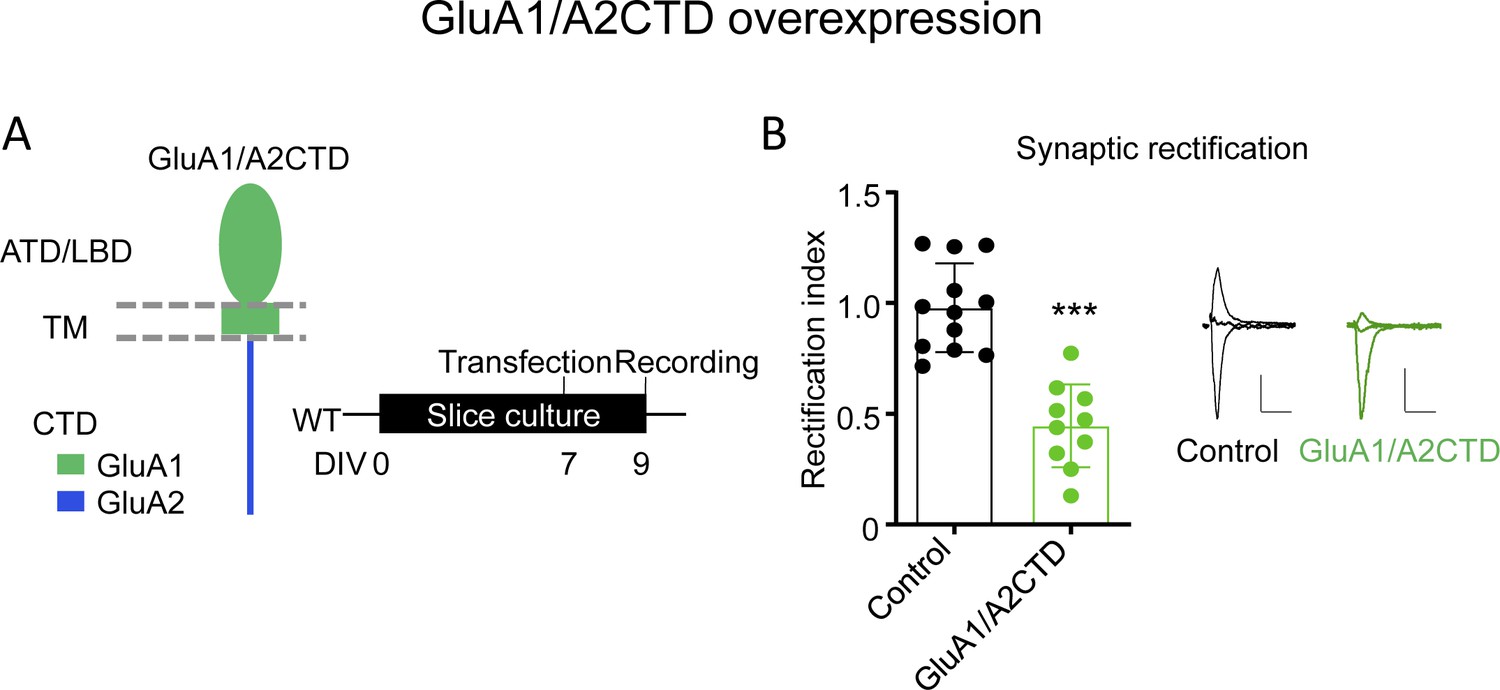
Chimeric GluA1/A2CTD traffics constitutively to the synapse.
(A) Left, schematic illustration of the chimeric GluA1/A2CTD employed in this experiment. ATD, amino-terminal domain; LBD, ligand-binding domain; TM, transmembrane domain; CTD, carboxy-terminal domain. Right, summary and timeline of the experiment. (B) Synaptic rectification of AMPAR EPSCs measured in control and GluA1/A2CTD overexpressing CA1 pyramidal neurons 2–3 days after transfection in the presence of 0.1 mM AP5. Individual data values and mean ± SEM are indicated. Control (black) and transfected neuron (green) sample traces are shown to the right. n = 12 control, 10 transfected neurons. p<0.001, unpaired t-test. Scale bars: 50 pA, 50 ms.
-
Figure 1—figure supplement 1—source data 1
Contains source data for Figure 1—figure supplement 1.
Chimeric GluA1/A2CTD traffics constitutively to the synapse.
- https://cdn.elifesciences.org/articles/58042/elife-58042-fig1-figsupp1-data1-v2.xlsx
Figure 1—figure supplement 2
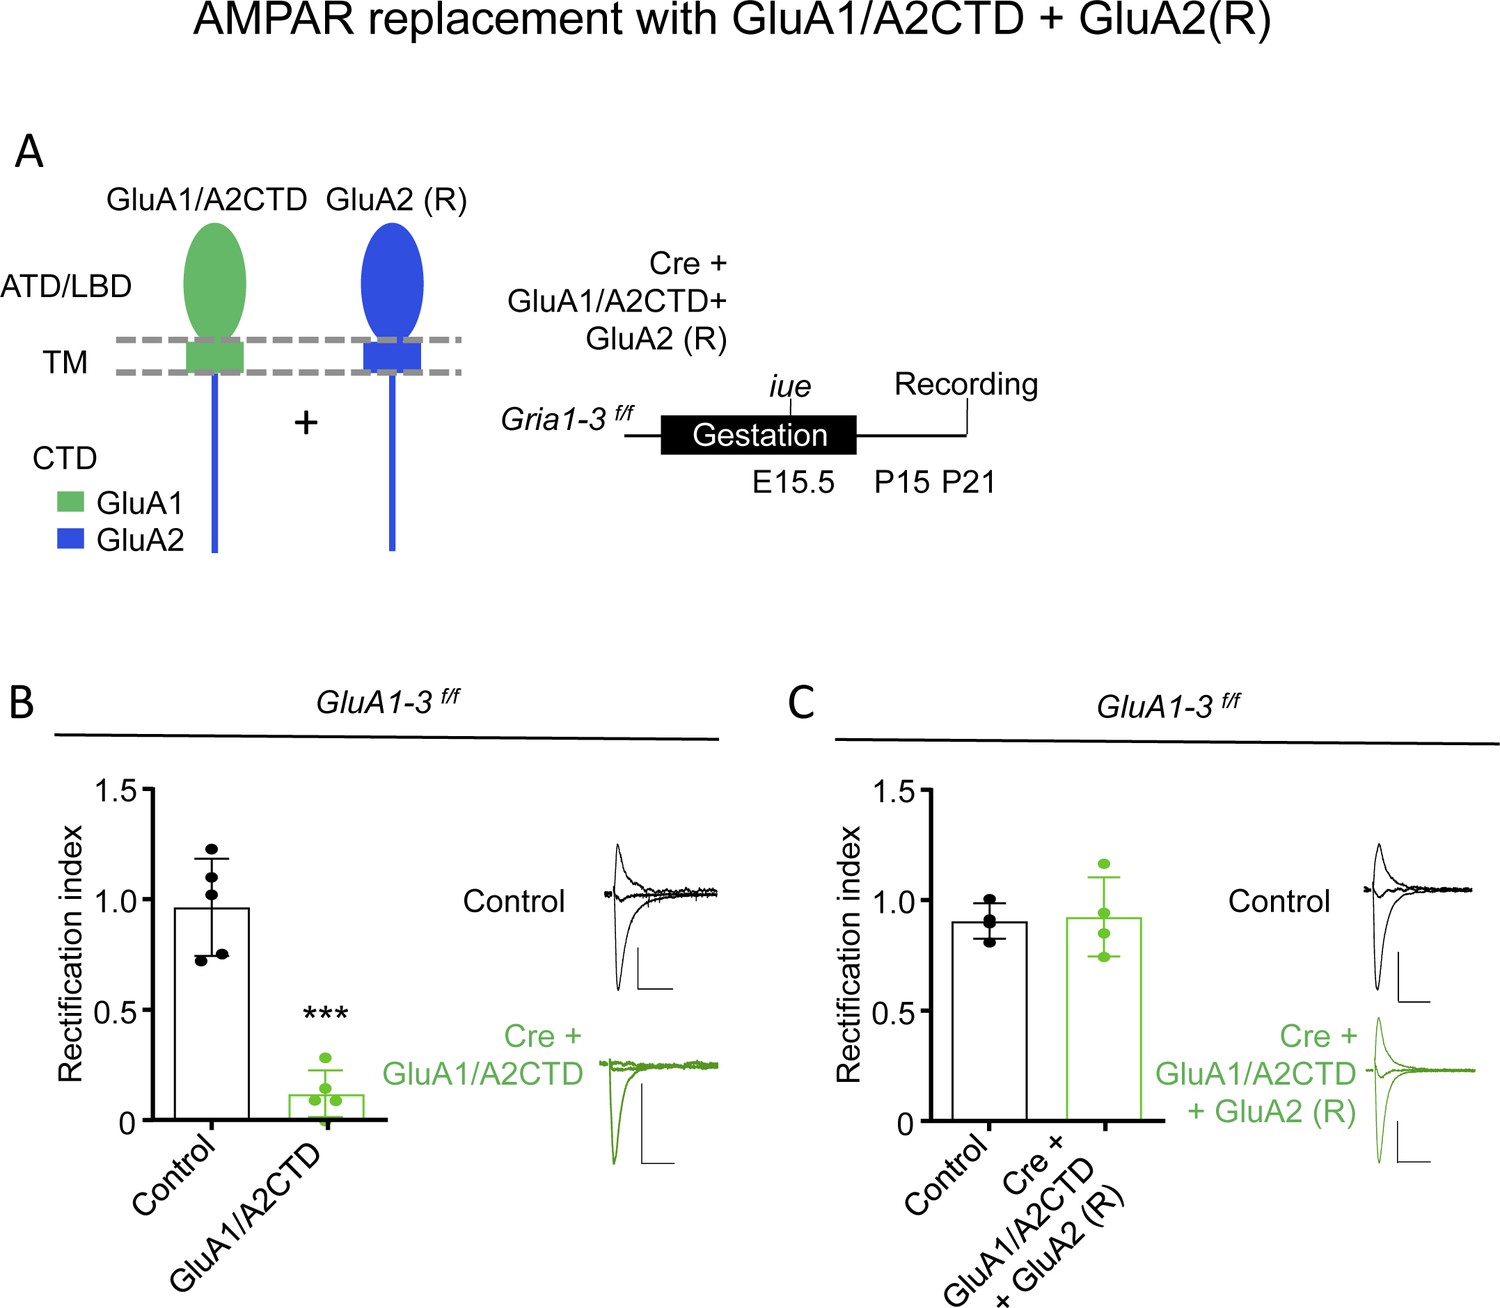
GluA1/A2CTD and GluA2(R) form non-rectifying heteromeric AMPAR.
(A) Left, schematic illustration of the chimeric GluA1/A2CTD (left) and GluA2 (R) AMPAR subunits employed to replace endogenous AMPAR in Gria1-3 f/f mice in this experiment. ATD, amino-terminal domain; LBD, ligand-binding domain; TM, transmembrane domain; CTD, carboxy-terminal domain. Middle, summary and timeline of the experiment. Right, schematic illustration of the simultaneous whole cell recording of control and neighboring transfected CA1 neurons and stimulation of the Schaffer collaterals. (B) Synaptic rectification of AMPAR EPSCs measured in control and transfected cells, in which endogenous AMPAR subunits were replaced by GluA1/A2CTD, in the presence of 0.1 mM AP5. Representative traces of control (black, top) and transfected neurons (green, bottom) are shown. n = 5 control, five transfected cells. p<0.001, unpaired t-test. Scale bars: 50 pA, 50 ms. (C) Synaptic rectification of AMPAR EPSCs measured in control and transfected cells, in which endogenous AMPAR subunits were replaced by GluA1/A2CTD together with GluA2, in the presence of 0.1 mM AP5. Representative traces of control (black, top) and transfected neurons (green, bottom) are shown. n = 4 control, four transfected cells. p=0.800, unpaired t-test. Scale bars: 50 pA, 50 ms.
-
Figure 1—figure supplement 2—source data 1
Contains source data for Figure 1—figure supplement 2.
GluA1/A2CTD and GluA2(R) form non-rectifying heteromeric AMPAR.
- https://cdn.elifesciences.org/articles/58042/elife-58042-fig1-figsupp2-data1-v2.xlsx
Figure 1—figure supplement 3
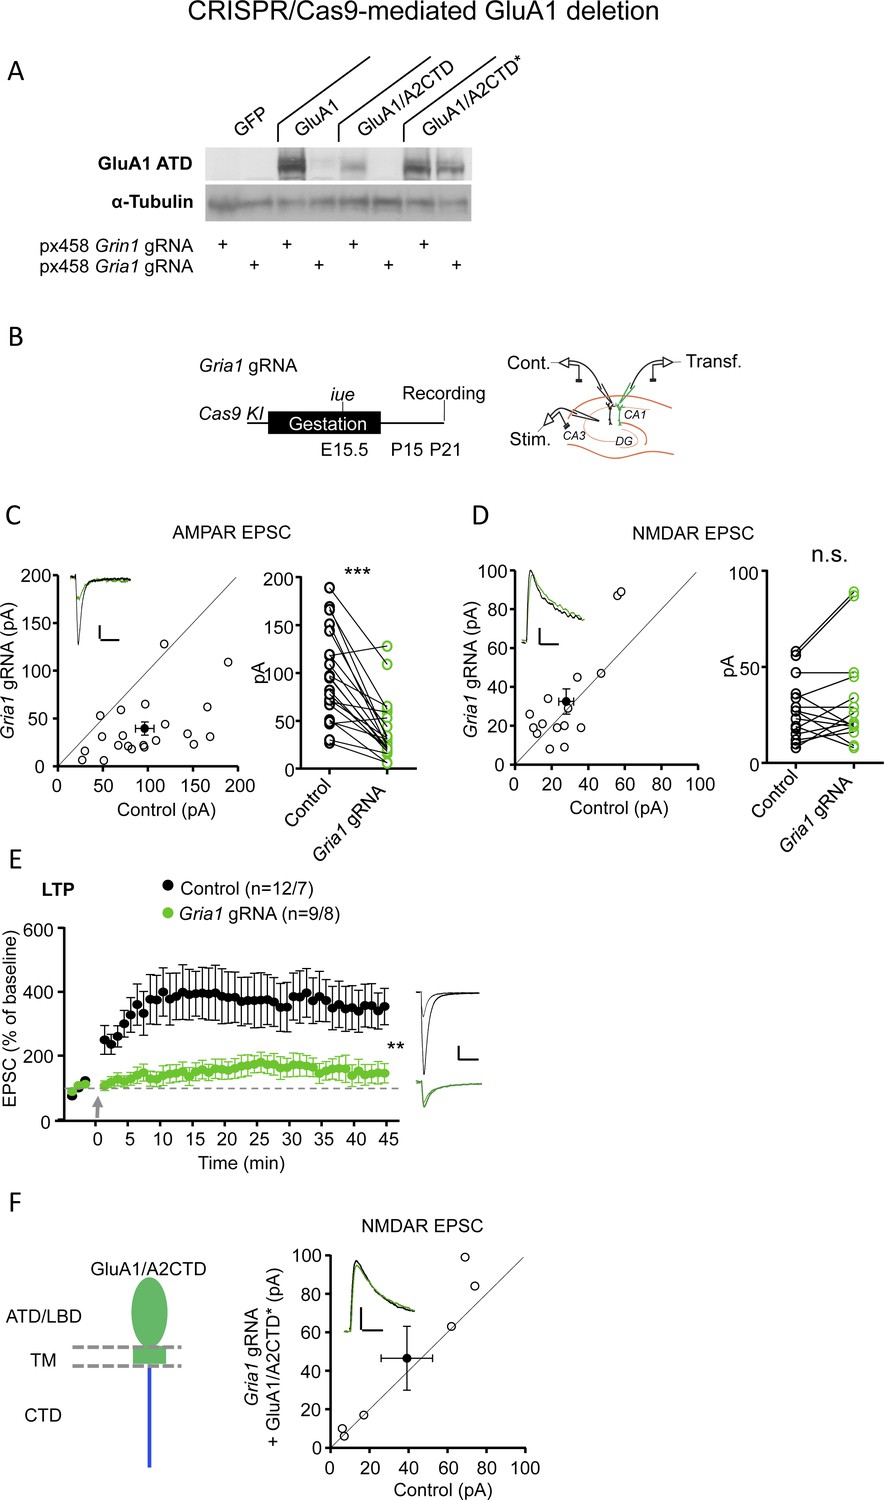
Validation of the CRISPR-mediated GluA1 deletion.
(A) Validation of the ability of the CRISPR/Cas9-mediated GluA1 deletion. 293 T cells overexpressing GluA1, GluA1/A2CTD and (CRISPR-resistant) GluA1/A2CTD* were co-transfected with a plasmid encoding Cas9 together with either Gria1 gRNA or a Grin1 gRNA as a control. Tested in two biological replicates and several technical replicates. (B) Left, timeline and strategy to delete GluA1 sparsely in the CA1 region of the hippocampus in Cas9 KI mice by in utero electroporation of a specific gRNA targeting mouse Gria1. Right, schematic illustration of the experimental setup with simultaneous whole-cell recordings from control and transfected CA1 pyramidal neurons. (C) Scatterplot measuring the baseline EPSC size at −70 mV in control (X axis) and Gria1 gRNA expressing (Y axis) neurons. Empty circles represent individual pairs of control and transfected neurons, filled circle represents mean ± SEM. Inset shows sample traces from a control (black trace) and a transfected (green trace) cell. The scatterplot combines data obtained using slice culture biolistically transfected and acute slices from in utero electroporated mice. n = 21 pairs. p<0.001, two-tailed Wilcoxon signed-rank test. (D) Scatterplot measuring the baseline EPSC size at +40 mV (measured 150 ms after the stimulation artifact to avoid contamination from AMPAR EPSC) in control (X axis) and Gria1 gRNA expressing (Y axis) neurons. Empty circles represent individual pairs of control and transfected neurons, filled circle represents mean ± SEM. Inset shows sample traces from a control (black trace) and a transfected (green trace) cell. The scatterplot combines data obtained using slice culture biolistically transfected and acute slices from in utero electroporated mice. n = 15 pairs. p=0.348, two-tailed Wilcoxon signed-rank test. (E) Plot representing the mean ± SEM EPSC at −70 mV before and after LTP induction (arrow) normalized by the average baseline EPSC size (dashed gray line) in control (filled circles) and Gria1 gRNA expressing (green circles) CA1 pyramidal neurons. Sample traces before and 45’ after LTP induction in control (black traces) and transfected (green traces) CA1 pyramidal neurons are shown to the right of the plot. n initial/final = 12/7 control, 9/8 Gria1 gRNA cells. p<0.01, unpaired t-test. (F) Left, schematic illustration of the chimeric GluA1/A2CTD. Right, scatterplot measuring the baseline EPSC size at +40 mV (at 150 ms) in control (X axis) and Gria1 gRNA expressing (Y axis) neurons. Open circles represent individual pairs of control and transfected neurons, filled circle represents mean ± SEM. Inset shows sample traces from a control (black trace) and a transfected (green trace) cell. n = 6 pairs. p=0.188, two-tailed Wilcoxon signed-rank test. Scale bars: C, E, 50 pA, 50 ms; D, F, 25 pA, 50 ms. AMPAR EPSCs. **, p<0.01; ***, p<0.001.
-
Figure 1—figure supplement 3—source data 1
Contains source data for Figure 1—figure supplement 3.
Validation of the CRISPR-mediated GluA1 deletion.
- https://cdn.elifesciences.org/articles/58042/elife-58042-fig1-figsupp3-data1-v2.xlsx
Figure 2 with 1 supplement

GluA1 CTD is not required for AMPAR trafficking and LTP.
(A) Schematic illustration of WT GluA1 (left) and transgenic HA-ΔCTD GluA1 (right). The latter has the entire cytoplasmic tail truncated after the fourth amino acid after the last TM helix. ATD, amino-terminal domain; LBD, ligand-binding domain; TM, transmembrane domain; CTD, carboxy-terminal domain. (B) Western blots showing specific and allelic dose-dependent presence of haemmaglutinin (HA) tag only in heterozygous and homozygous HA-ΔCTD GluA1 mice brains, partial and total absence of signal from anti-GluA1 CTD antibody in heterozygous and homozygous HA-ΔCTD GluA1 mice brains, respectively and decreased size of the GluA1 protein as a result of the truncation of the cytoplasmic tail in HA-ΔCTD GluA1 mice brains. GluA2 CTD and NR1 signals did not differ substantially among genotypes. Two biological replicates (mice) are shown. Three more mice per genotype were tested and several technical replicates were performed. (C) Assessment of the GluA1 CTD signal in the hippocampus of WT (top image) and HA-ΔCTD GluA1 (bottom image) mice by immunofluorescence. (D) Surface AMPAR-mediated currents elicited by fast glutamate (1 mM) application in WT (open circles) and HA-ΔCTD GluA1 (filled circles) hippocampal CA1 pyramidal neurons measured in somatic outside-out patches. Individual data values and mean ± SEM are indicated. Sample traces from WT (left) and KI (right) patches are shown to the top of the plot. Scale bars: 25 pA, 2 s. n = 6 WT and 7 HA-ΔCTD GluA1 KI patches. p=0.820, unpaired t-test. (E) AMPAR/NMDAR EPSC ratios measured at −70 mV and +40 mV (at 150 ms), respectively, in WT (open circles) and HA-ΔCTD GluA1 (filled circles) hippocampal CA1 pyramidal neurons. Individual data values and mean ± SEM are indicated. Sample traces from WT (left) and KI (right) neurons are shown to the top of the plot. Scale bars: 50 pA, 50 ms. n = 15 WT, 20 KI cells. p=0.377, unpaired t-test. (F) Plot representing the mean ± SEM EPSC at −70 mV before and after LTP induction (arrow) normalized by the average baseline EPSC size (dashed gray line) in WT (open circles) and HA-ΔCTD GluA1 KI (filled circles) CA1 pyramidal neurons. Sample traces before and 45’ after LTP induction in WT (top) and KI (bottom) CA1 pyramidal neurons are shown to the right of the plot. Scale bars: 50 pA, 50 ms. n initial/final = 16/8 WT, 13/9 KI neurons. p=0.368 (min. 45). Unpaired t-test. (G) Plot representing the mean ± SEM EPSC at −70 mV before and after LTP induction (arrow) with an alternative protocol (2 bursts of 1 s duration at 100 Hz while holding the membrane potential at 0 mV) performed in an independent laboratory normalized by the average baseline EPSC size (dashed black line) in WT (n, cells/mice = 13/7, open circles) and HA-ΔCTD GluA1 KI (n, cells/mice = 15/9, filled circles) CA1 pyramidal neurons. Sample traces before LTP induction and at min. 50 in WT (left) and KI (right) CA1 pyramidal neurons are shown at the top of the plot at the indicated time points. p=0.606 (min 45 post pairing). Unpaired t-test.
-
Figure 2—source data 1
Contains source data for Figure 2.
GluA1 CTD is not required for AMPAR trafficking and LTP.
- https://cdn.elifesciences.org/articles/58042/elife-58042-fig2-data1-v2.xlsx
Figure 2—figure supplement 1

Generation of the HA-ΔCTD GluA1 KI mouse line.
(A) 2 crRNAs where tested to generate the KI mice. Both of them were able to disrupt the expression of overexpressed GluA1 in 293 T cells, so half of the oocytes were injected with each of them. Tested in two biological replicates and several technical replicates. (B) Overview of the strategy to generate the HA-ΔCTD GluA1 allele. The sequence recognized by the Gria1 gRNA 1 (CAUCGCUCAGCUUCGCCUAC) is indicated. Also indicated is the sequence of the ssDNA co-injected to serve as a template for HDR 3’ of the 4 initial amino acids (EFCY) after the last TM helix in the Gria1 gene, which encodes the influenza haemagglutinin (HA) tag sequence followed by four Stop codons to ensure truncation of the remainder CTD of the protein, flanked by 60 nt-long 5’ and 3’ homology arms. (C) Sequencing of Gria1 in homozygous WT (top chromatogram) and HA-ΔCTD GluA1 (bottom chromatogram). The HA-tandem stop codon insertion site is indicated with an arrow.
Figure 3 with 1 supplement

GluA1 CTD is not essential for spatial learning and memory.
(A) Learning curves showing the distance covered to find a hidden platform in the Morris water maze per training day (average of 4 trials/day) in WT (open circles) and HA-ΔCTD GluA1 KI (filled circles) mice. Mixed effects analysis revealed that the distance necessary to find the platform decreased during training in both groups (day effect, p<0.0001). Although there was only a trend toward a genotype effect (p=0.0539), there was a significant interaction between day and genotype (p<0.05). Distance covered to find a cued platform across 2 days (C1 and C2) is shown in the right side of the plot and showed a significant effect of day (p<0.01) but not genotype (p=0.259), and there was no significant day x genotype interaction (p=0.511). n = 12 WT, 15 KI. (B) Probe trial results showing the number of crossings over the location under which the platform was hidden in the target quadrant during training (circles, empty bars) and over equivalent positions in non-target quadrants (squares, patterned bars) in a 60-s trial performed the day after the last training session. WT mice are represented by empty shapes and HA-ΔCTD GluA1 KI by filled shapes. n = 12 WT, 14 KI. Both genotypes showed a clear preference for the target location vs non-target locations (WT, p=0.0010, KI, p=0.0012,). WT and KI mice did not differ significantly in how many times they crossed the target location (p=0.582 by Mann-Whitney U test). **p<0.01; ***p<0.001 by Wilcoxon paired t-test. Individual mouse values and mean ± SEM are indicated.
-
Figure 3—source data 1
Contains source data for Figure 3.
GluA1 CTD is not essential for spatial learning and memory.
- https://cdn.elifesciences.org/articles/58042/elife-58042-fig3-data1-v2.xlsx
Figure 3—figure supplement 1
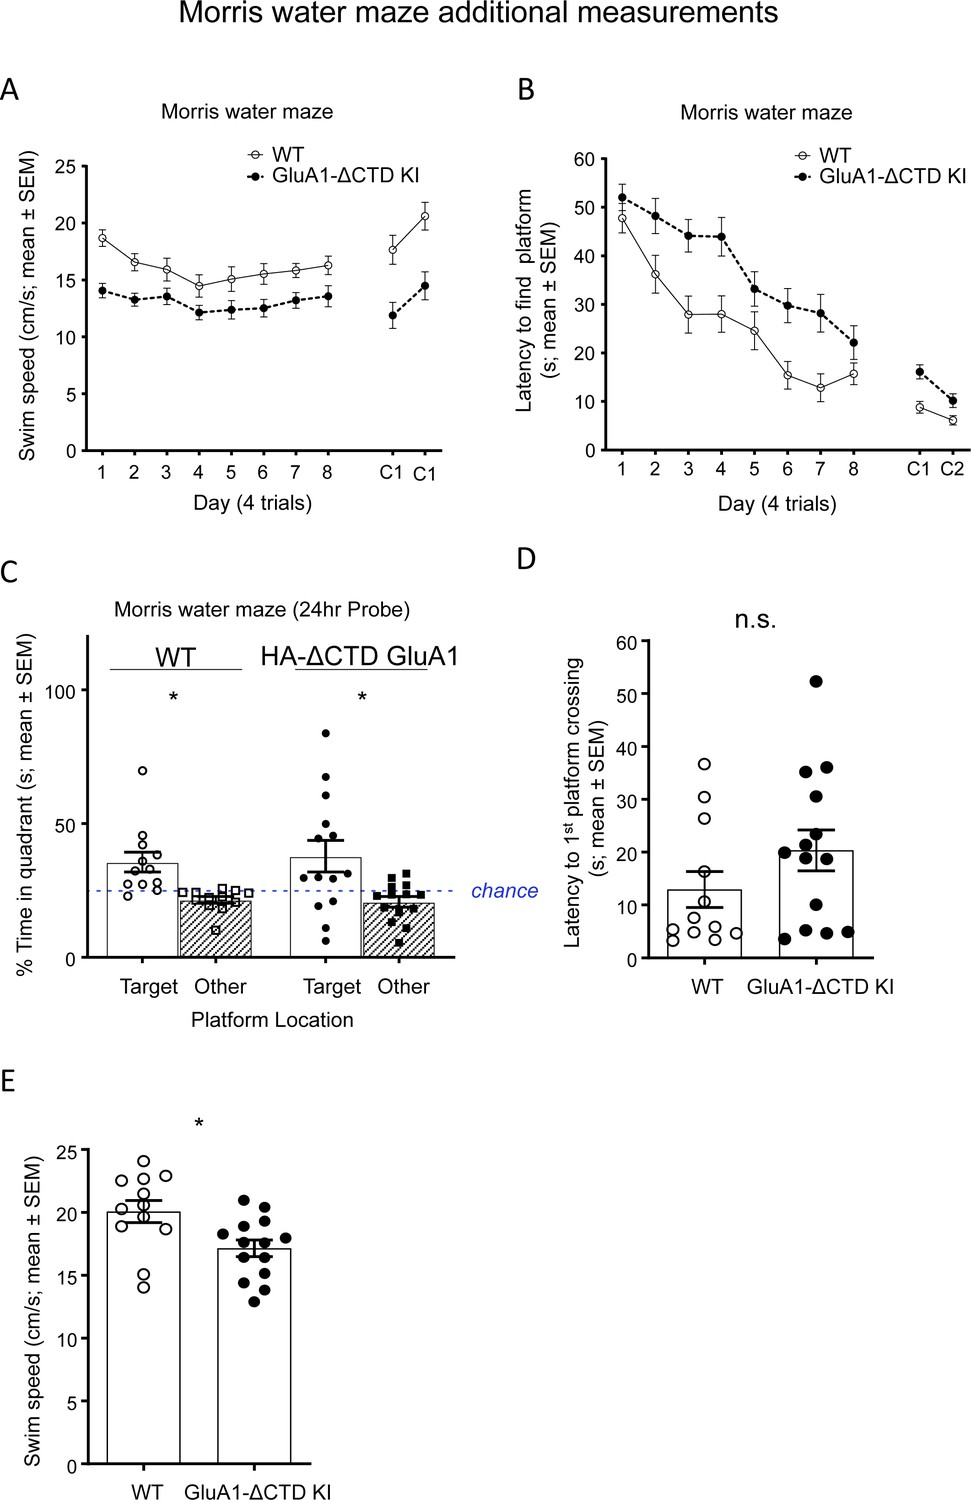
Additional Morris water maze measurements.
(A) Average swim speed (cm/s) in the Morris water maze (average of 4 trials/day) in WT (empty dots) and HA-ΔCTD GluA1 KI (filled dots) mice. Mixed effects analysis revealed a significant effect of genotype (p<0.01) and day (p<0.0001) during both the hidden and cued training but no significant genotype x day interaction for either training phase (p=0.455, hidden platform, p=0.722 cued platform). (B) Latency (s) to find a hidden platform in the Morris water maze (average of 4 trials/day) in WT (empty circles) and HA-ΔCTD GluA1 KI (filled circles) mice. Mixed effects analysis showed that the time it took mice to find the platform decreased by day (p<0.0001), with a clear effect of genotype (p<0.01) but no significant day x genotype interaction (p=0.205). Latency to find a cued platform across two training days (C1 and C2) is shown in the right side of the plot. Mixed effects analysis revealed a significant effect of day (p<0.0001) and genotype (p<0.01), but only a trend toward a day x genotype interaction (p=0.063). (C) Percent time spent in the target quadrant, where the platform used to be during the training phase (circles and empty bars), and in the other quadrants (squares and patterned bars) during the probe trial performed 24 hr after the last training session. Blue dotted line indicates the expected time spent in each quadrant if there were no preference for any particular quadrant (25%). WT mice are represented by empty shapes and HA-ΔCTD GluA1 KI by filled shapes. n = 12 WT, 14 KI. Mice of either genotype showed a preference for the target quadrant vs the other quadrants. (D) Latency to the first platform crossing (s) in the probe trial in WT (empty circles) and HA-ΔCTD GluA1 KI (filled circles) mice. (E) Swim speed (cm/s) in the probe trial in WT (empty circles) and HA-ΔCTD GluA1 KI (filled circles) mice. *, p<0.05 by paired t-test (C) or unpaired t-test with Welch correction (E). n.s., not significant by Mann-Whitney U test. Bars show mean ± SEM and scatterplots indicate individual mice.
-
Figure 3—figure supplement 1—source data 1
Contains source data for Figure 3—figure supplement 1.
Additional Morris water maze measurements.
- https://cdn.elifesciences.org/articles/58042/elife-58042-fig3-figsupp1-data1-v2.xlsx
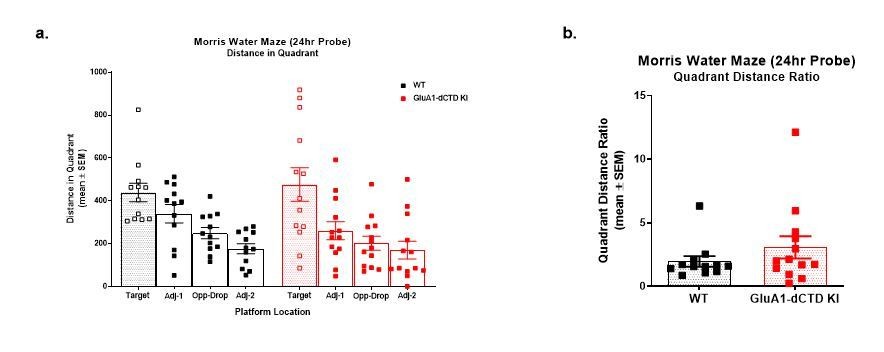
Author response image 1
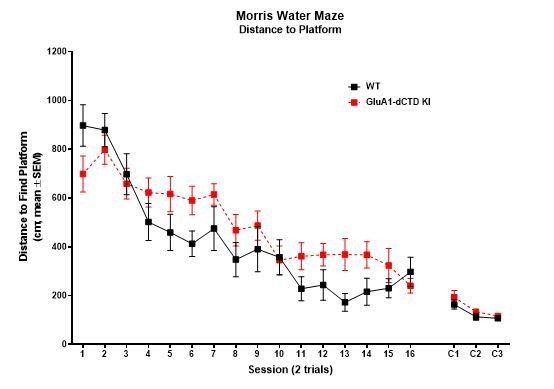
Author response image 2
Tables
Key resources table
| Reagent type (species) or resource | Designation | Source or reference | Identifiers | Additional information |
|---|---|---|---|---|
| Gene (Mus musculus) | Gria1 | GenBank | #14799 | |
| Strain, strain background (Mus musculus, strain C57BL6) | HA-ΔCTD GluA1 | This paper | N/A | |
| Strain, strain background (Mus musculus, strain FVB) | Rosa26-Cas9 KI | The Jackson Laboratory | #026558; RRID:IMSR_JAX:026558 | |
| Strain, strain background (Mus musculus, strain C57BL6) | Gria1-3f/f | Lu et al., 2009 | N/A | |
| Strain, strain background (Rattus norvegicus, strain CD Sprague Dawley IGS) | WT | Charles River | #001 | |
| Cell line (Homo sapiens) | 293T | ATCC | #CRL-3216; RRID:CVCL_0063 | |
| Recombinant DNA reagent (plasmid) | pCAGGS-GluA1/A2 CTD-IRES-GFP | This paper | N/A | Expression of chimeric GluA1/A2 CTD and GFP (under IRES). |
| Recombinant DNA reagent (plasmid) | pCAGGS-GluA1/A2 CTD-IRES-mCherry* | This paper | N/A | Gria1 CRISPR-resistant expression of chimeric GluA1/A2 CTD and mCherry (under IRES) |
| Recombinant DNA reagent (plasmid) | pCAGGS- IRES-mCherry | Incontro et al., 2014 | N/A | Expression of mCherry (under IRES) |
| Recombinant DNA reagent (plasmid) | pFUGW-Cre:GFP | Díaz-Alonso et al., 2017 | N/A | Expression of Cre:GFP fusion protein |
| Recombinant DNA reagent (plasmid) | px458- Gria1-CRISPR | This paper | N/A | Expression of Gria1 gRNA, Cas9 and GFP. Derived from px458 vector (Addgene #48138 RRID:Addgene_48138) |
| Recombinant DNA reagent (plasmid) | px458- Grin1-CRISPR | Incontro et al., 2014 | N/A | Expression of Grin1 gRNA, Cas9 and GFP. Derived from px458 vector (Addgene #48138); RRID:Addgene_48138 |
| Recombinant DNA reagent | ssDNA encoding HA tag and stop codons flanked by 60 bp long homology arms for HDR | This paper | N/A | Obtained from IDT. Injected in fertilized zigotes for HA-ΔCTD GluA1 KI mouse generation (see Materials and methods for sequence) |
| Other (Recombinant RNA reagent) | Gria1 1 gRNA | This paper | N/A | Obtained from IDT. Injected in fertilized zigotes for HA-ΔCTD GluA1 KI mouse generation (see Materials and methods for sequence) |
| Other (Recombinant RNA reagent) | Gria1 2 gRNA | This paper | N/A | Obtained from IDT. Injected in fertilized zigotes for HA-ΔCTD GluA1 KI mouse generation (see Materials and methods for sequence) |
| Antibody | Rabbit polyclonal anti-GluA1 C-tail | Synaptic Systems | #182–003; RRID:AB_2113441 | IF (1:500) WB (1:1000) |
| Antibody | Rabbit polyclonal anti-GluA2 C-tail | Synaptic Systems | #182–103; RRID:AB_2113732 | WB (1:1000) |
| Antibody | Mouse monoclonal anti-GluA1 ATD | Millipore | #MAB 2263; RRID:AB_11212678 | WB (1:1000) |
| Antibody | Mouse, monoclonal anti-NR1 | Millipore | #05–432; RRID:AB_390129 | WB (1:1000) |
| Antibody | Rabbit polyclonal anti-HA | Thermo Fisher Scientific | #71–5500; RRID:AB_2533988 | WB (1:1000) |
| Antibody | Rabbit polyclonal anti-alpha tubulin | Cell Signaling | #2144; RRID:AB_2210548 | WB (1:1000) |
| Antibody | HRP conjugated anti-mouse secondary antibody | GE Healthcare | #NA931; RRID:AB_772210 | WB (1:5000) |
| Antibody | HRP conjugated anti-rabbit secondary antibody | GE Healthcare | #NA934; RRID:AB_772206 | WB (1:5000) |
| Antibody | Alexa-488 conjugated anti-rabbit secondary antibody | Thermo Fisher Scientific | #A11034; RRID:AB_2576217 | IF (1:500) |
| Chemical compound, drug | D(-)−2-amino-5-phosphonovaleric acid (AP5) | Hello Bio | #HB0225 | 0.1 mM |
| Chemical compound, drug | Picrotoxin | TCI | #C0375 | 0.1 mM |
| Chemical compound, drug | Bicuculline | Sigma-Aldrich | #14340 | 0.02 mM |
| Chemical compound, drug | 2-Chloroadenosine | Sigma-Aldrich | #C5134 | 2 mM |
| Commercial assay, kit | Helios Gene Gun Kit | Bio-Rad | #1652411 | Used for biolistic transfection of hioppocampal slice cultures |
| Commercial assay, kit | In fusion HD cloning kit | Takara Bio | #639647 | Used for clonning of GluA1/A2 CTD in pCAGGS vectors |
| Commercial assay, kit | NheI | New England Biolabs | #R0131 | Restriction enzyme. Used for clonning of GluA1/A2 CTD in pCAGGS vectors |
| Commercial assay, kit | XhoI | New England Biolabs | #R0146 | Restriction enzyme. Used for clonning of GluA1/A2 CTD in pCAGGS vectors |
| Commercial assay, kit | BbsI | New England Biolabs | #R3539 | Restriction enzyme. Used for clonning of gRNA in px458 vectors |
| Commercial assay, kit | T4 DNA ligase | New England Biolabs | #M0202L | Ligase. Used for clonning of gRNA in px458 vectors |
| Commercial assay, kit | MycoAlert PLUS Mycoplasma Detection Kit | Lonza | #LT07-701 | Mycoplasma contamination assay |
| Commercial assay, kit | Lipofectamine 2000 | Thermo Fisher Scientific | #11668027 | Transfection reagent for 293 T cells |
| Software, algorithm | Prism | Graph Pad | https://www.graphpad.com/scientific-software/ prism/; RRID:SCR_002798 | |
| Software, algorithm | Igor Pro | Wavemetrics | https://www.wavemetrics.com/products/igorpro; RRID:SCR_000325 | |
| Software, algorithm | ImageJ | NIH | https://imagej.nih.gov/ij/; RRID:SCR_003070 |
Additional files
Download links
A two-part list of links to download the article, or parts of the article, in various formats.
Downloads (link to download the article as PDF)
Open citations (links to open the citations from this article in various online reference manager services)
Cite this article (links to download the citations from this article in formats compatible with various reference manager tools)
Long-term potentiation is independent of the C-tail of the GluA1 AMPA receptor subunit
eLife 9:e58042.
https://doi.org/10.7554/eLife.58042


