Formin-like 1 mediates effector T cell trafficking to inflammatory sites to enable T cell-mediated autoimmunity
- Department of Biomedical Research, National Jewish Health, United States
- Department of Immunology and Microbiology, University of Colorado School of Medicine, United States
- Barbara Davis Center, University of Colorado School of Medicine, United States
Figures
Figure 1 with 3 supplements
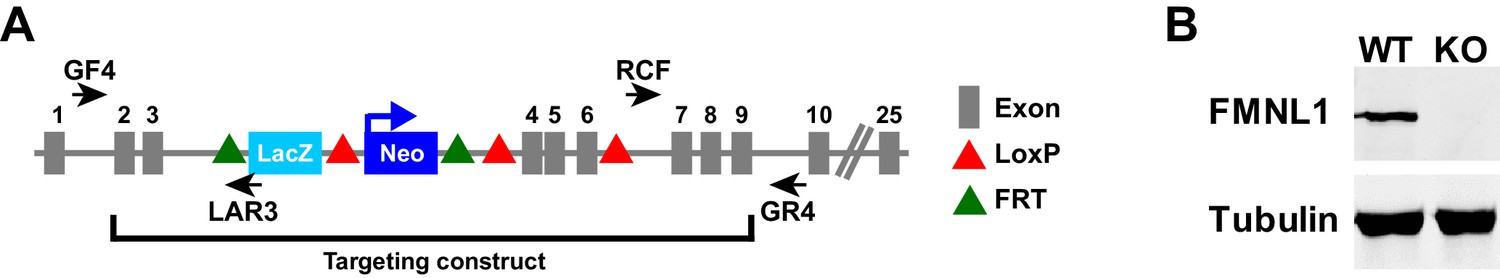
Fmnl1 targeting strategy and knock-out confirmation.
(A) Schematic of the targeted Fmnl1 allele after homologous recombination with the targeting construct. (B) Representative western blot showing complete loss of FMNL1 protein expression in T cells from mice homozygous for the Fmnl1 KO allele. Tubulin staining is shown as a loading control.
Figure 1—figure supplement 1
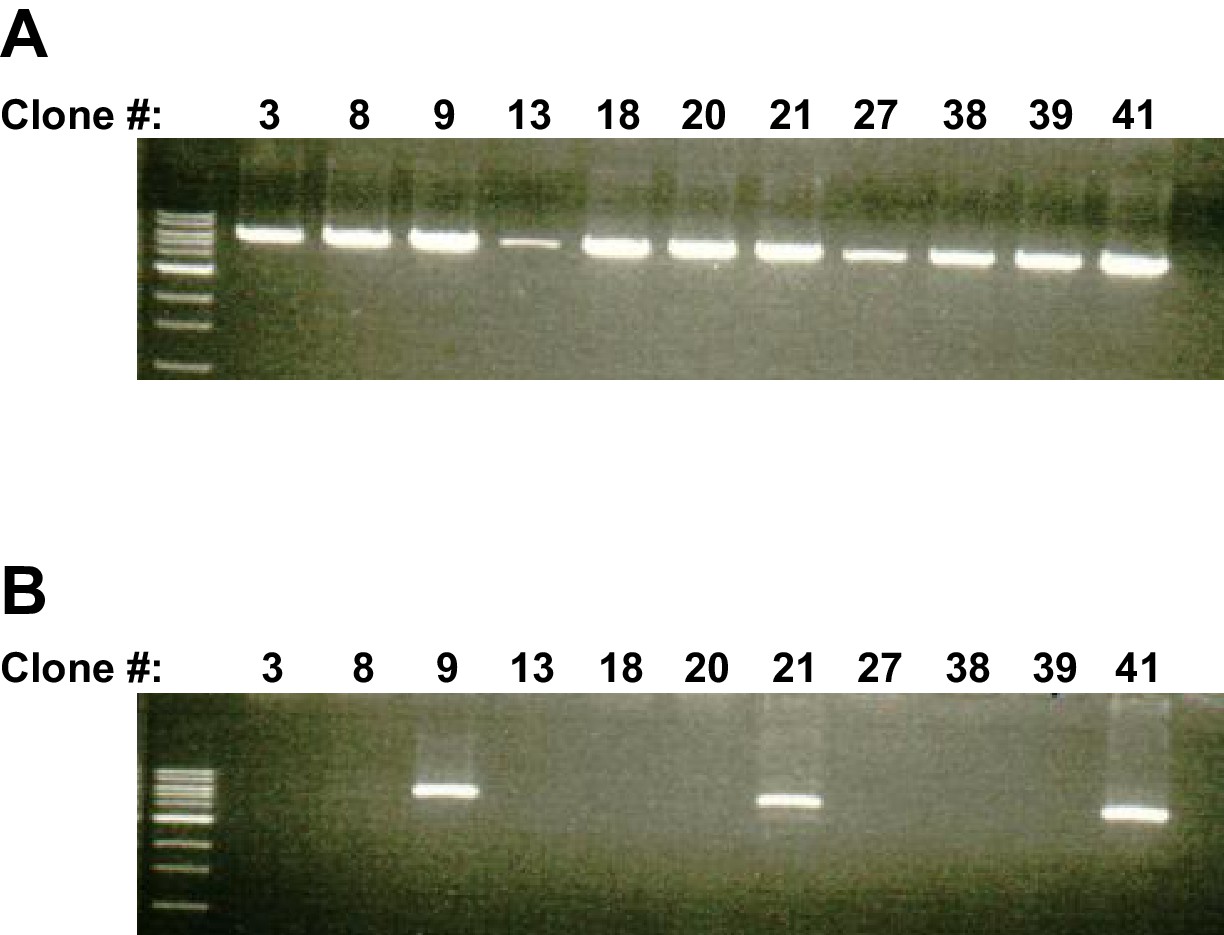
PCR confirmation of targeting vector insertion.
(A) PCR reaction (with GF4 and LAR3 primers, see Figure 1A) showing ES cell clones positive for the insertion at the 5’ end of the targeting construct. (B) PCR reaction (with RCF and GR4 primers, see Figure 1A) showing ES cell clones positive for the insertion at the 3’ end of the targeting construct confirming that the complete targeting construct was recombined into the Fmnl1 locus. Clone 9 was ultimately selected to establish the FMNL1 KO line.
Figure 1—figure supplement 2
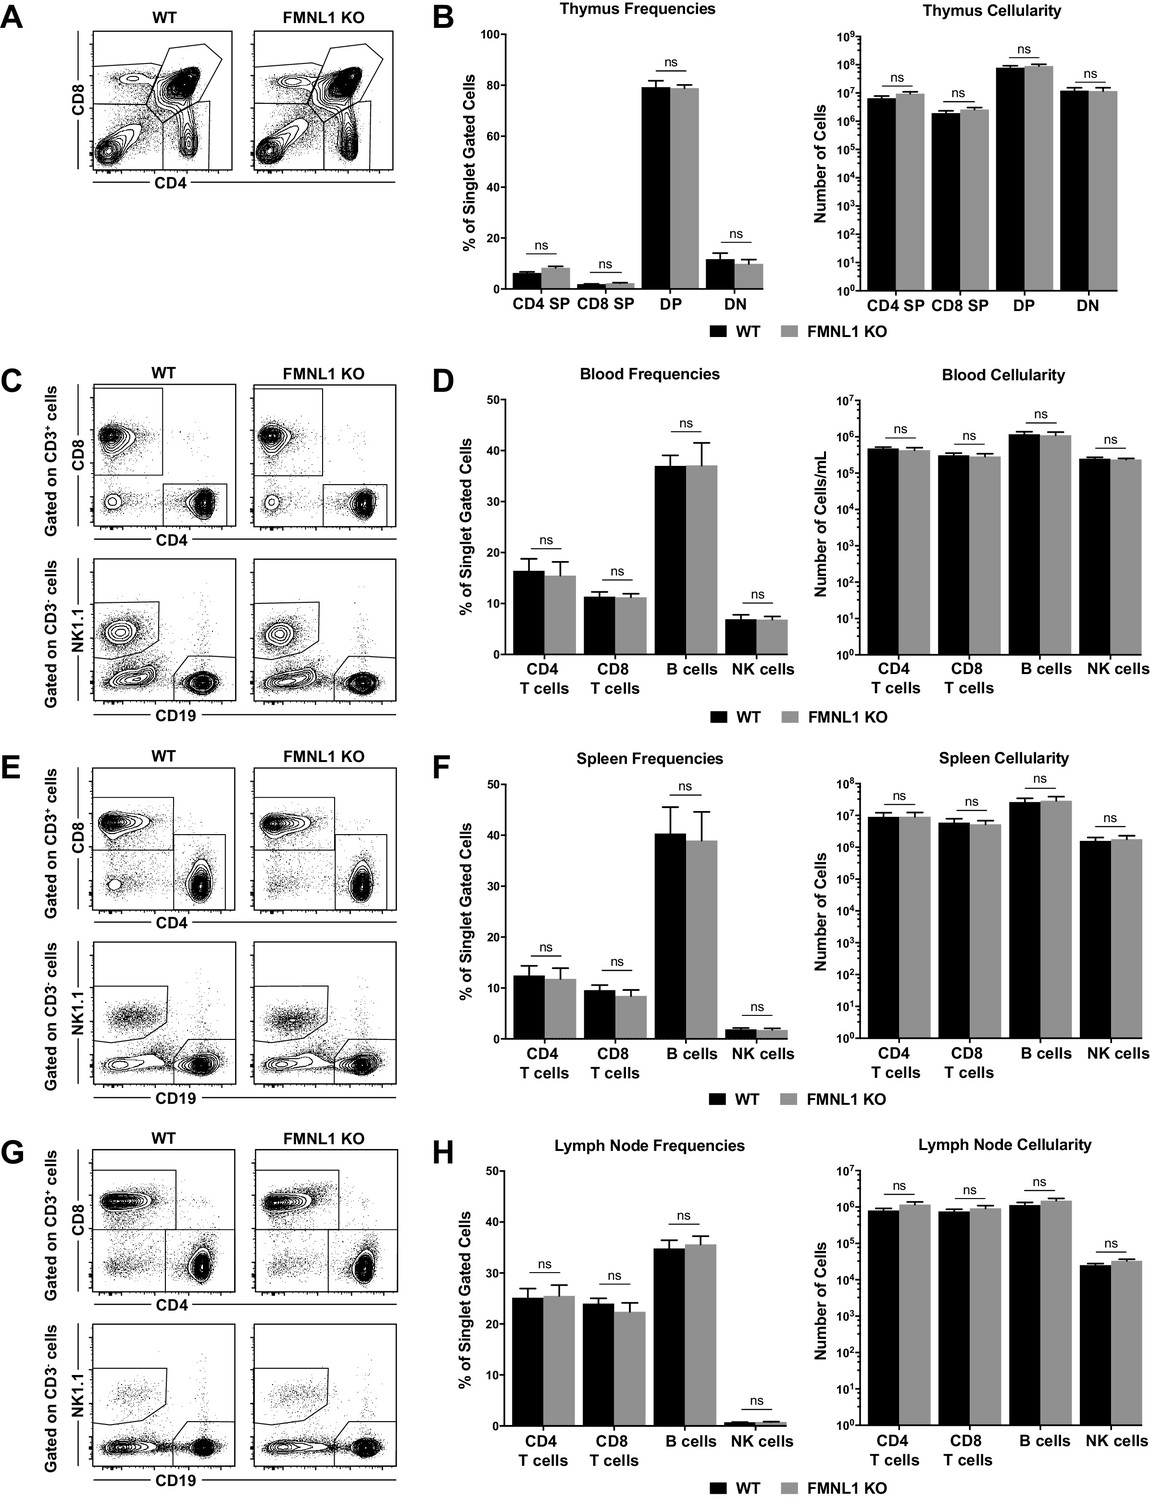
T cell development and lymphocyte populations in peripheral lymphoid organs are not altered in FMNL1 KO Mice.
(A) Thymic populations and T cell development are not altered in FMNL1 KO mice. Representative CD4 by CD8 flow cytometry plots of single cell gated populations from the thymus of WT or FMNL1 KO mice. (B) Quantification of the populations in A. Frequencies of singlet gated cells (left) and total numbers per thymus (right). (C) Blood lymphocyte populations are not altered in FMNL1 KO mice. Representative CD4 by CD8 flow cytometry plots of CD3+ gated cells from the blood of WT or FMNL1 KO mice (top). Representative CD19 by NK1.1 flow cytometry plots of CD3- gated cells from the blood of WT or FMNL1 KO mice (bottom). (D) Quantification of the populations in C. Frequencies of singlet gated cells (left) and total numbers per ml of blood (right). (E) Splenic lymphocyte populations are not altered in FMNL1 KO mice. Representative CD4 by CD8 flow cytometry plots of CD3+ gated cells from the spleen of WT or FMNL1 KO mice (top). Representative CD19 by NK1.1 flow cytometry plots and of CD3- gated cells from the spleen of WT or FMNL1 KO mice (bottom). (F) Quantification of the populations in E. Frequencies of singlet gated cells (left) and total numbers per spleen (right). (G) Lymph node lymphocyte populations are not altered in FMNL1 KO mice. Representative CD4 by CD8 flow cytometry plots of CD3+ gated cells from the inguinal lymph nodes of WT or FMNL1 KO mice (top). Representative CD19 by NK1.1 flow cytometry plots and of CD3- gated cells from the inguinal lymph nodes of WT or FMNL1 KO mice (bottom). (H) Quantification of the populations in G. Frequencies of singlet gated cells (left) and total numbers per lymph node (right). Data in B, D, F and H are the mean ± the SEM from 8 independent mice for each group. Statistics were calculated using two-way ANOVA with Sidak’s multiple comparisons test. n.s. = not significant.
Figure 1—figure supplement 3
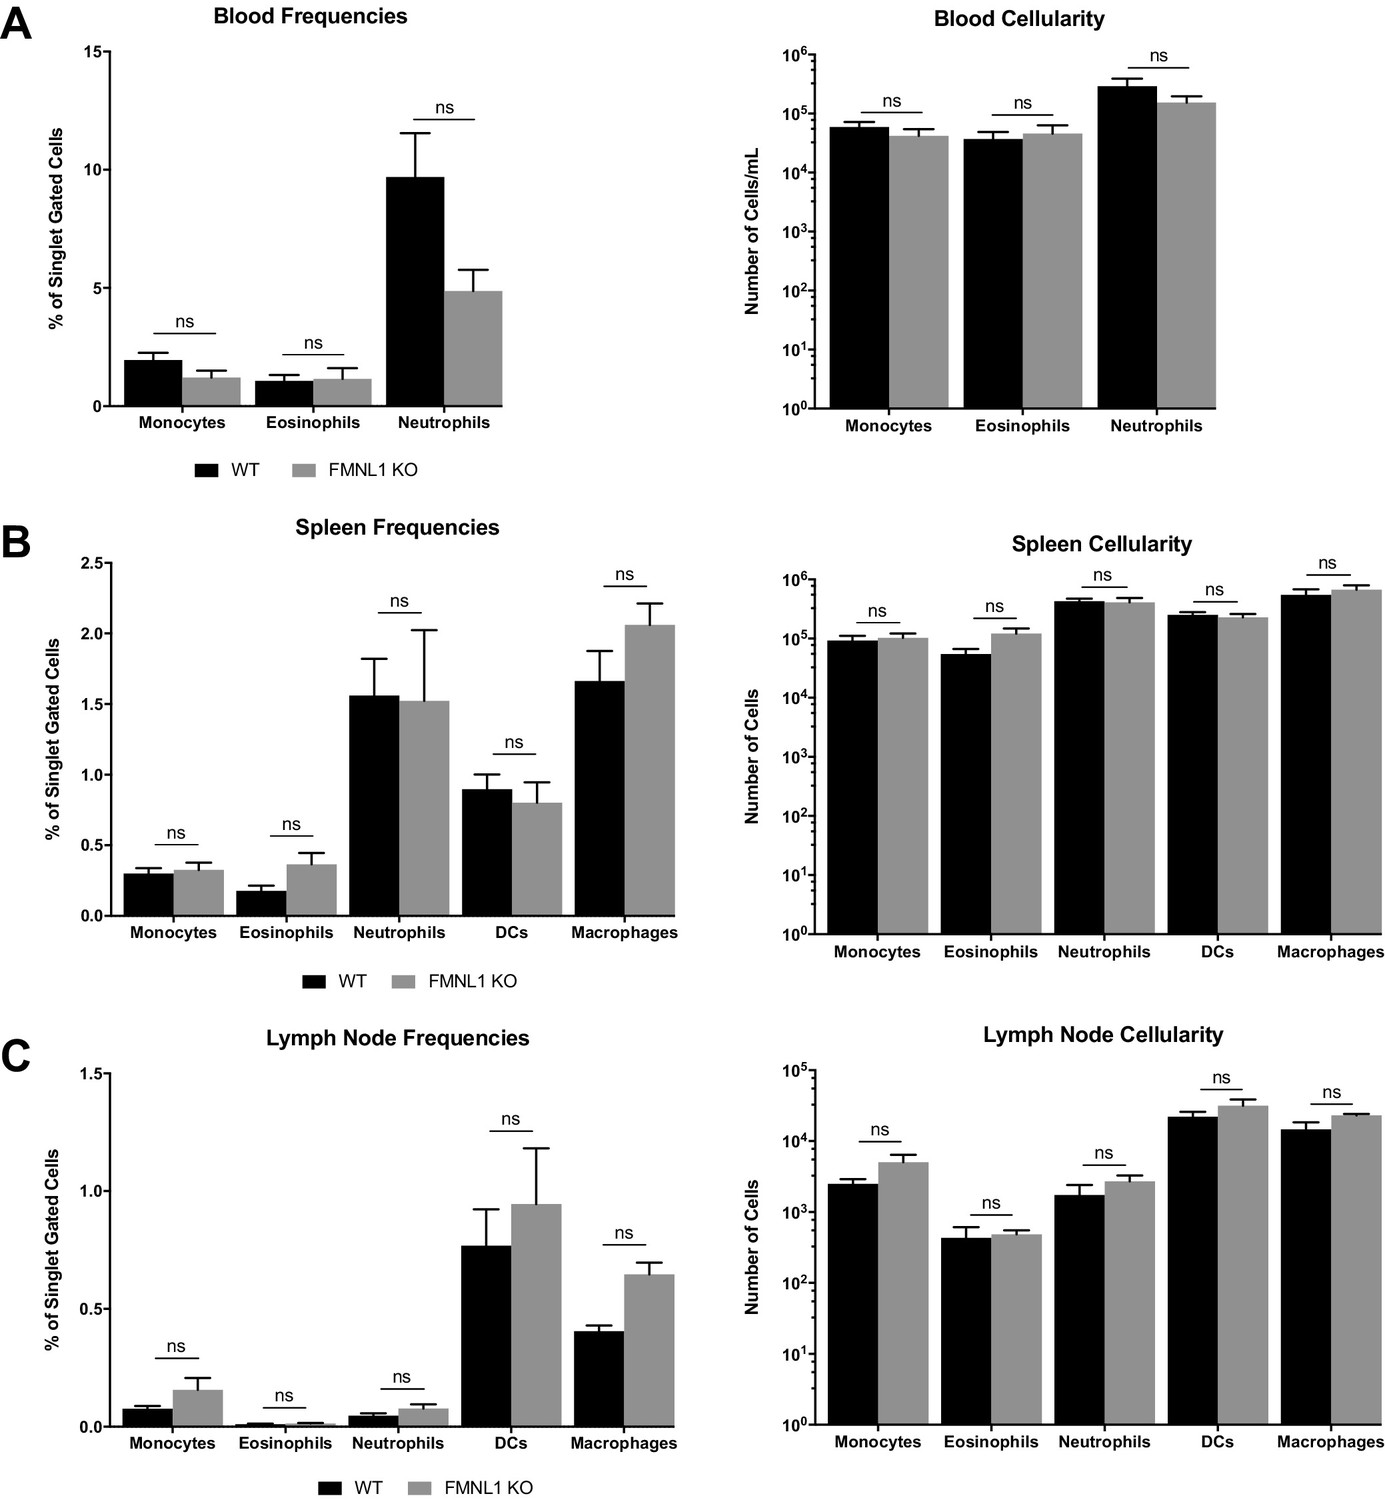
Myeloid populations in peripheral lymphoid organs are not altered in FMNL1 KO mice.
(A) Blood myeloid populations are not altered in FMNL1 KO mice. Frequencies of singlet gated cells (left) and total numbers of the indicated populations per ml of blood (right). (B) Splenic myeloid populations are not altered in FMNL1 KO mice. Frequencies of singlet gated cells (left) and total numbers of the indicated populations per spleen (right). (C) Lymph node myeloid populations are not altered in FMNL1 KO mice. Frequencies of singlet gated cells (left) and total numbers of the indicated populations per lymph node (right). Data in A-C are the mean ±the SEM from 6 independent mice for each group. Statistics were calculated using two-way ANOVA with Sidak’s multiple comparisons test. n.s. = not significant.
Figure 2 with 1 supplement
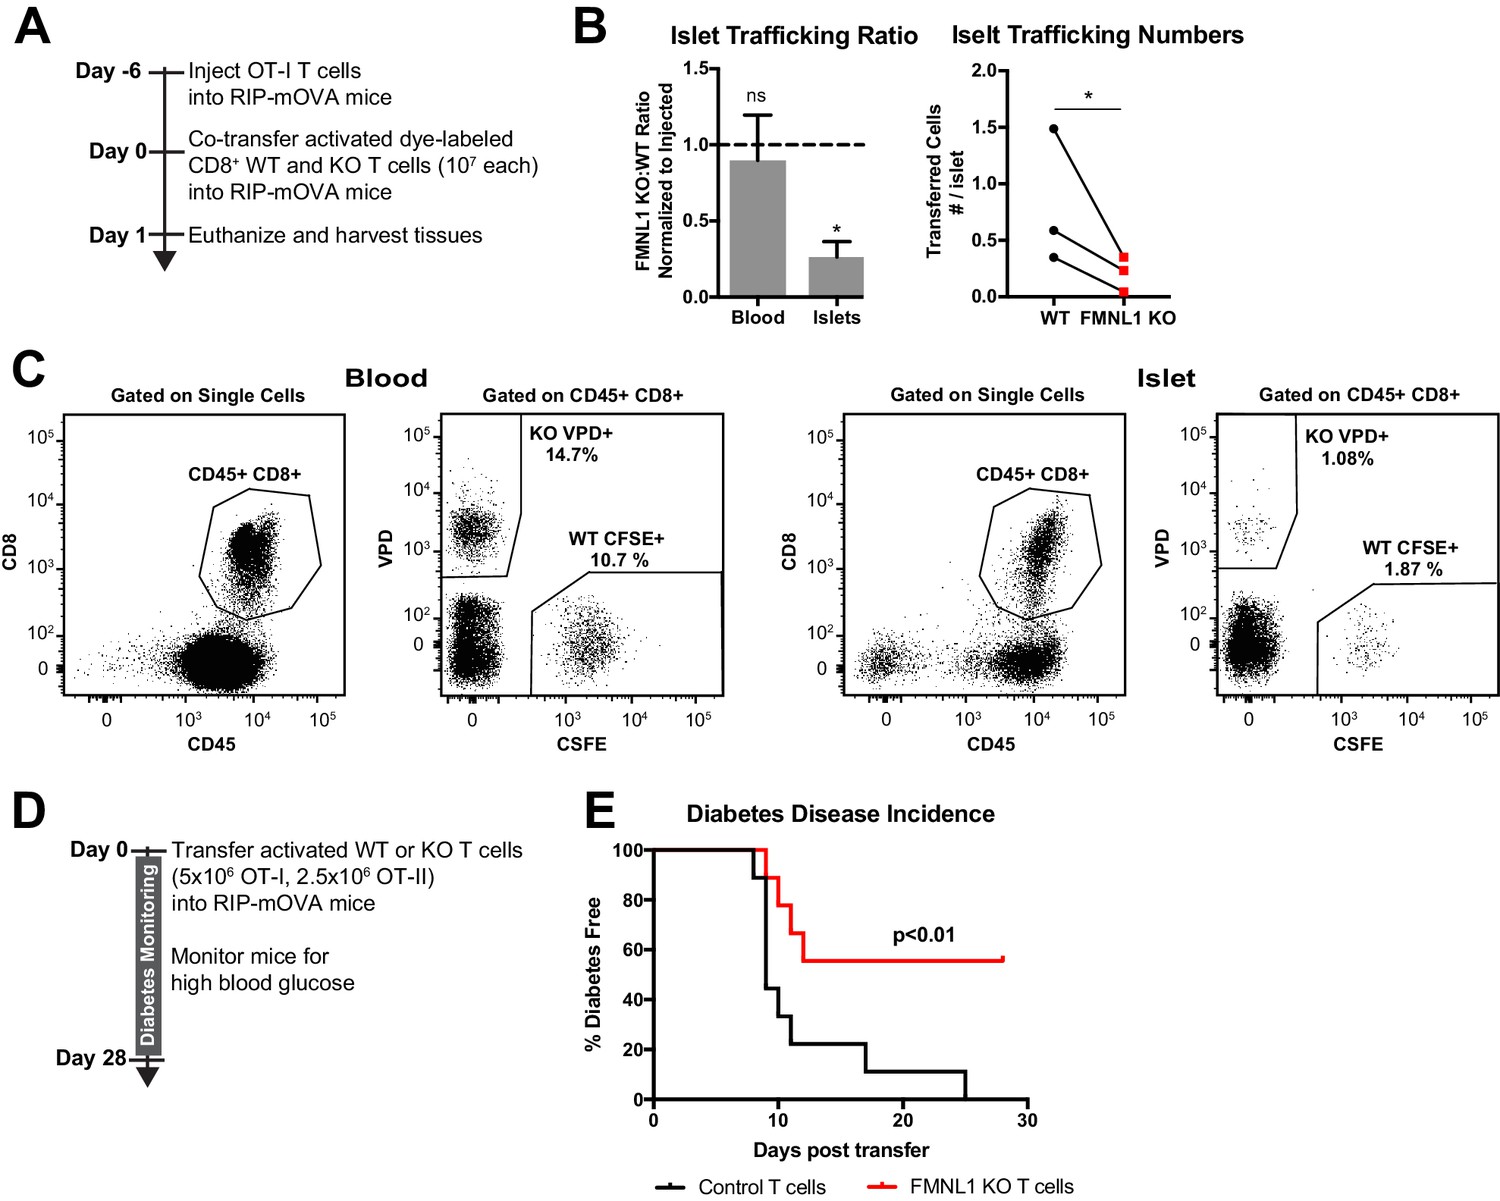
FMNL1-deficient T cells are impaired in trafficking to the pancreatic islets and inducing type 1 diabetes.
(A) Experimental set-up to quantify activated T cell trafficking to the inflamed pancreatic islets. To induce inflammation of the pancreatic islets, 7 days prior to harvest, WT OT-I transgenic T cells were transferred intravenously into RIP-mOVA mice. Ex vivo activated, differentially dye-labeled, polyclonal CD8+ WT and FMNL1 KO T cells were then co-transferred intravenously at a 1:1 ratio into these RIP-mOVA mice and T cell trafficking to the indicated tissues was quantified by flow cytometry 24 hr post-transfer. (B) FMNL1-deficient T cells are impaired in trafficking to the inflamed pancreatic islets. Ratio of co-transferred FMNL1 KO to WT T cells in the indicated tissues (left). Values were normalized to the FMNL1 KO:WT ratio in the injected sample. A ratio below 1.0 (dashed line) indicates impaired trafficking to the tissue. Number of transferred WT or FMNL1 KO T cells recovered from the islets (right). (C) Representative blood and pancreatic islet flow plots and gating strategy for identifying co-transferred dye-labeled T cells. VPD = Violet Proliferation Dye, CFSE = Carboxyfluorescein succinimidyl ester. (D) Experimental set up for induction of type 1 diabetes in RIP-mOVA mice. Control or FMNL1 KO OT-I and OT-II T cells were activated ex vivo and then transferred into RIP-mOVA recipients. Recipient mice were then monitored for 28 days for glycemia. (E) FMNL1 deficiency in self-reactive T cells delays and partially protects from diabetes. Diabetes incidence of mice receiving control or FMNL1 KO OT-I and OT-II T cells. Data in B are the mean ± SEM (left) or individual means (right) from 3 independent experiments with at least 3 recipient mice per experiment; data in E are pooled from 3 independent experiments with cohorts of 3 mice/group each. Statistics in B were calculated using a one-sample two-tailed t-test against a theoretical FMNL1 KO:WT ratio of 1.0 (left) or a two-tailed paired t test (right); statistics in E were calculated by Log-rank test. n.s. = not significant, *=p < 0.05.
Figure 2—figure supplement 1
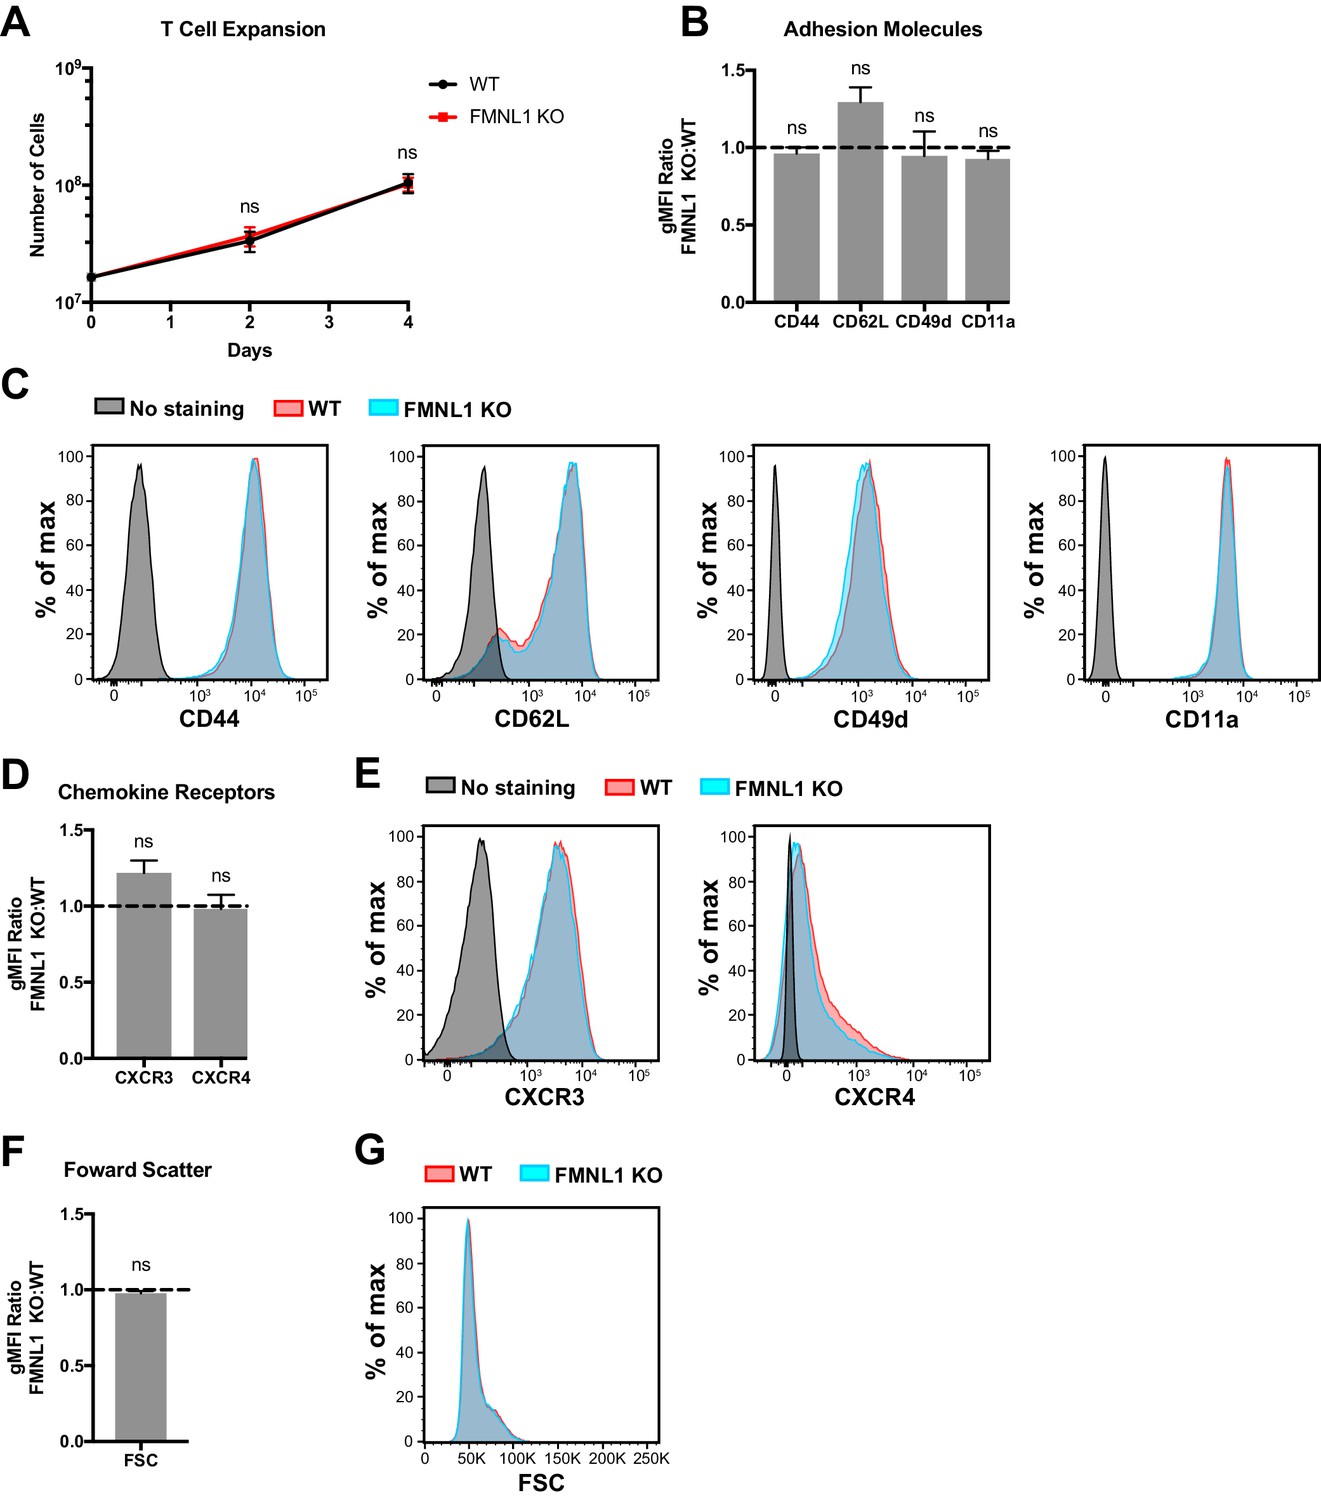
FMNL1 deficiency does not impair ex vivo T cell activation.
T cells from WT or FMNL1 KO mice were isolated and then activated ex-vivo with anti-CD3 and CD28 antibodies in the presence of WT irradiated, congenically marked, CD45.1+ splenocytes. After 2 days, T cells were removed from CD3 stimulus and cultured with IL-2. (A) WT and FMNL1 KO T cells proliferate equivalently in response to CD3 stimulus. Total number of WT or KO T cells on days 0, 2 and 4 post-stimulation. (B) CD3 activated WT and FMNL1 KO T cells express equivalent levels of adhesion molecules and activation markers. Ratio of geometric mean fluorescent intensity (gMFI) of antibody staining of indicated surface molecules of FMNL1 KO T cells compared to WT T cells 5 days after activation. A ratio above or below 1.0 (dashed line) indicates a respective increase or decrease in expression of the indicated marker on FMNL1 KO T cells relative to WT. (C) Representative overlay histograms of antibody staining for the indicated surface molecules quantified in B. (D) Activated WT and FMNL1 KO T cells express equivalent levels of chemokine receptors. Ratio of gMFI of antibody staining of indicated chemokine receptors of FMNL1 KO T cells compared to WT T cells 5 days after activation. (E) Representative overlay histograms of antibody staining for the indicated surface molecules quantified in D. (F) Activated WT and FMNL1 KO T cells are the same size. Ratio of gMFI for forward scatter (FSC) of FMNL1 KO T cells compared to WT T cells 5 days after activation. (G) Representative overlay histogram for forward scatter intensities quantified in F. Data in A, B, D and F are the mean ± SEM from 4 independent experiments. Statistics in A were calculated using repeated measures two-way ANOVA with Sidak’s multiple comparisons test; statistics in B, D and F were calculated using a one-sample two-tailed t-test against a theoretical FMNL1 KO:WT gMFI ratio of 1.0. n.s. = not significant.
Figure 3 with 2 supplements
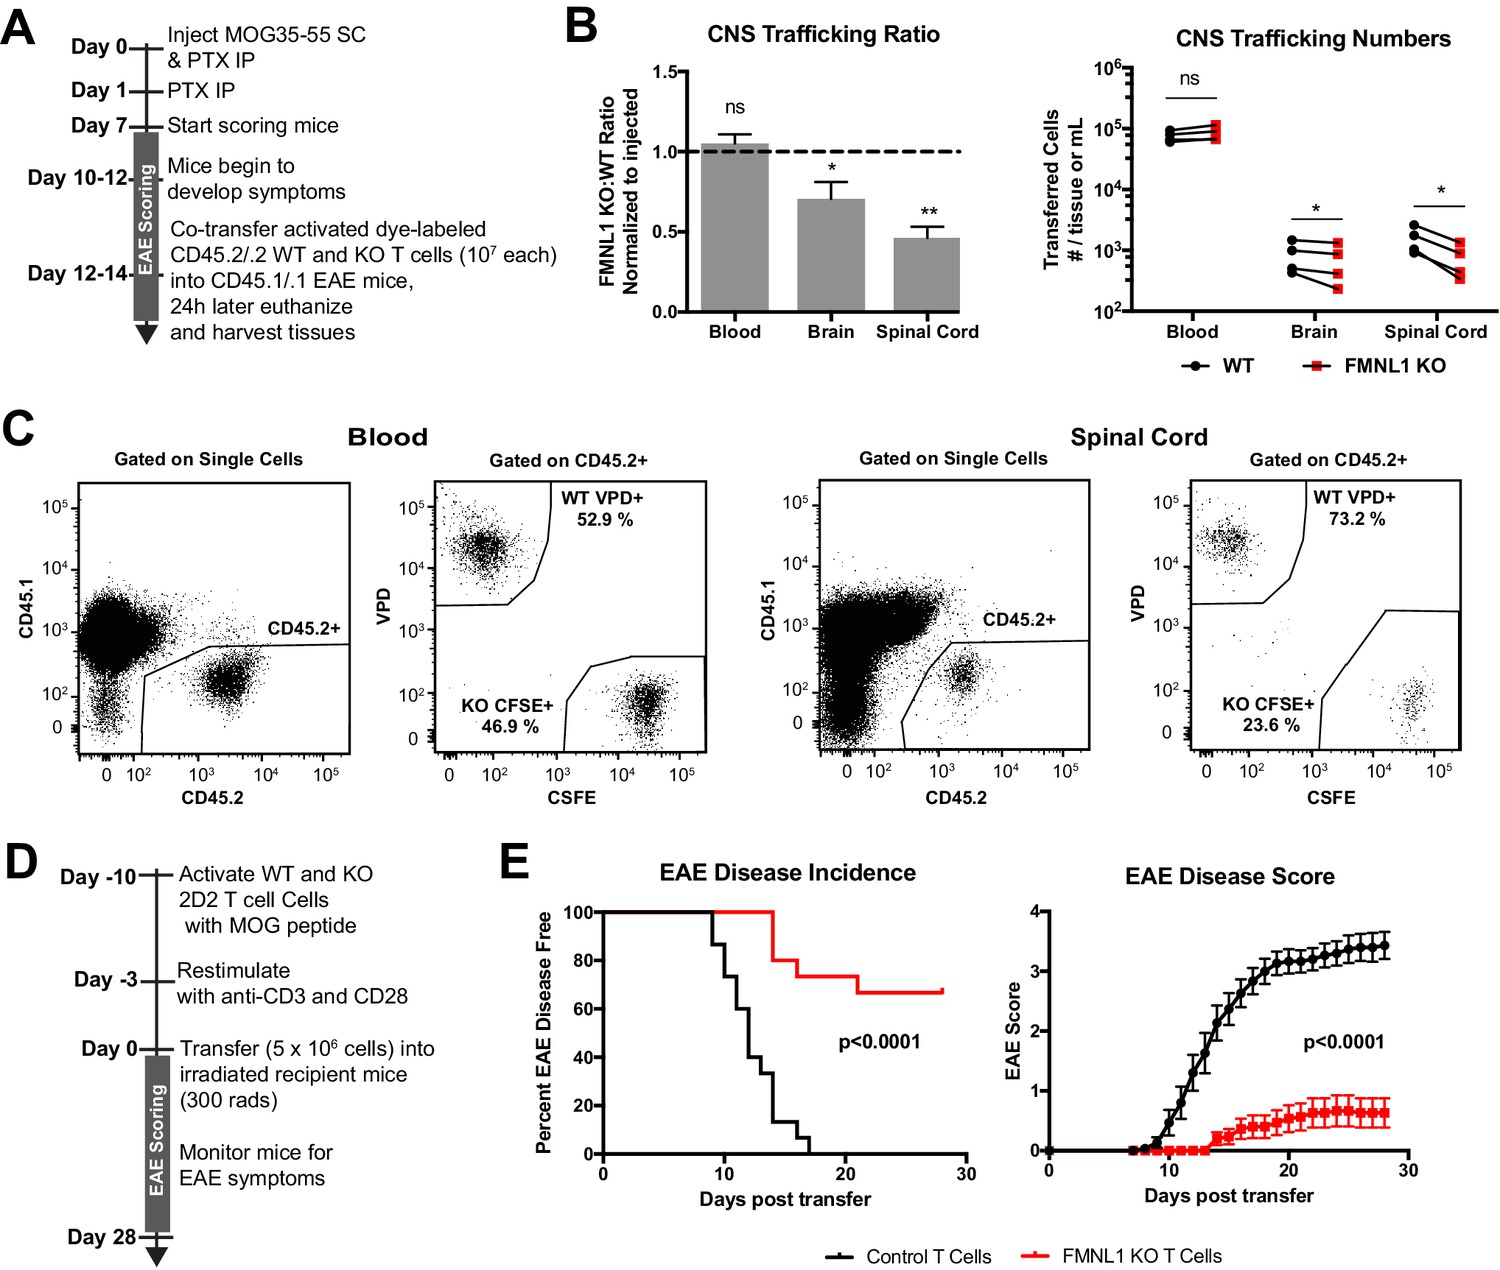
FMNL1-deficient T cells are impaired in trafficking to the CNS and inducing EAE.
(A) Experimental set-up to quantify activated T cell trafficking to the inflamed CNS. Activated, differentially dye-labeled, polyclonal CD45.2/.2 WT and FMNL1 KO T cells were co-transferred intravenously at a 1:1 ratio into CD45.1/.1 mice with ongoing EAE (score ≥2.0) and T cell trafficking to the indicated tissues was quantified by flow cytometry 24 hr post-transfer. (B) FMNL1-deficient T cells are impaired in trafficking to the inflamed CNS. Ratio of co-transferred FMNL1 KO to WT T cells in the indicated tissues (left). Values were normalized to the FMNL1 KO:WT ratio in the injected sample. A ratio below 1.0 (dashed line) indicates impaired trafficking to the tissue. Number of transferred WT or FMNL1 KO T cells recovered from the indicated tissues (right). (C) Representative spinal cord and blood flow plots and gating strategy for identifying co-transferred dye-labeled T cells quantified in B. (D) Experimental set up for induction of EAE via T cell transfer. Control or FMNL1 KO MOG-specific 2D2 T cells were activated ex vivo and then transferred into WT recipient mice. EAE disease severity was scored daily for 28 days. (E) FMNL1 deficiency in T cells delays EAE onset and partially protects from disease. EAE incidence (score ≥1.0) in mice receiving control or FMNLL1 KO 2D2 T cells (left). Mean EAE score ± SEM over time in mice receiving control or FMNL1 T cells 2D2 T cells (right). Data in B are the mean ± SEM (left) or individual means (right) from 4 independent experiments with 2 recipient mice per group; data in E are pooled from 3 independent experiments with cohorts of 5 mice/group each. Statistics in B were calculated using a one-sample two-tailed t-test against a theoretical FMNL1 KO:WT ratio of 1.0 (left) or repeated measures one-way ANOVA with Sidak’s multiple comparisons test (right); statistics in E (left) were calculated by Log-rank test; statistical interaction of genotype with disease severity over time in E (right) was calculated by repeated measures two-way ANOVA. n.s. = not significant, *=p < 0.05, **=p < 0.01.
Figure 3—figure supplement 1

FMNL1 deficiency does not impair ex vivo T cell cognate peptide stimulation.
CD4+ T cells from WT or FMNL1 KO 2D2 TCR transgenic mice were isolated and then activated ex-vivo with MOG peptide in the presence of WT irradiated, congenically marked, CD45.1+ splenocytes. After 2 days, T cells were cultured with IL-2 for 4 days. (A) WT and FMNL1 KO T cells proliferate equivalently in response to cognate peptide stimulus. Total number of WT or KO T cells on days 0, 2, 4 and 6 days post stimulus. (B) Cognate peptide activated WT and FMNL1 KO T cells express equivalent levels of adhesion molecules and activation markers. Ratio of geometric mean fluorescent intensity (gMFI) of antibody staining of indicated surface molecules of FMNL1 KO T cells compared to WT T cells 7 days after activation. A ratio above or below 1.0 (dashed line) indicates a respective increase or decrease in expression of the indicated marker on FMNL1 KO T cells relative to WT. Data in A and B are the mean ± SEM from 3 independent experiments. Statistics in A were calculated using repeated measures two-way ANOVA with Sidak’s multiple comparisons test; statistics in B were calculated using a one-sample two-tailed t-test against a theoretical FMNL1 KO:WT gMFI ratio of 1.0. n.s. = not significant.
Figure 3—figure supplement 2
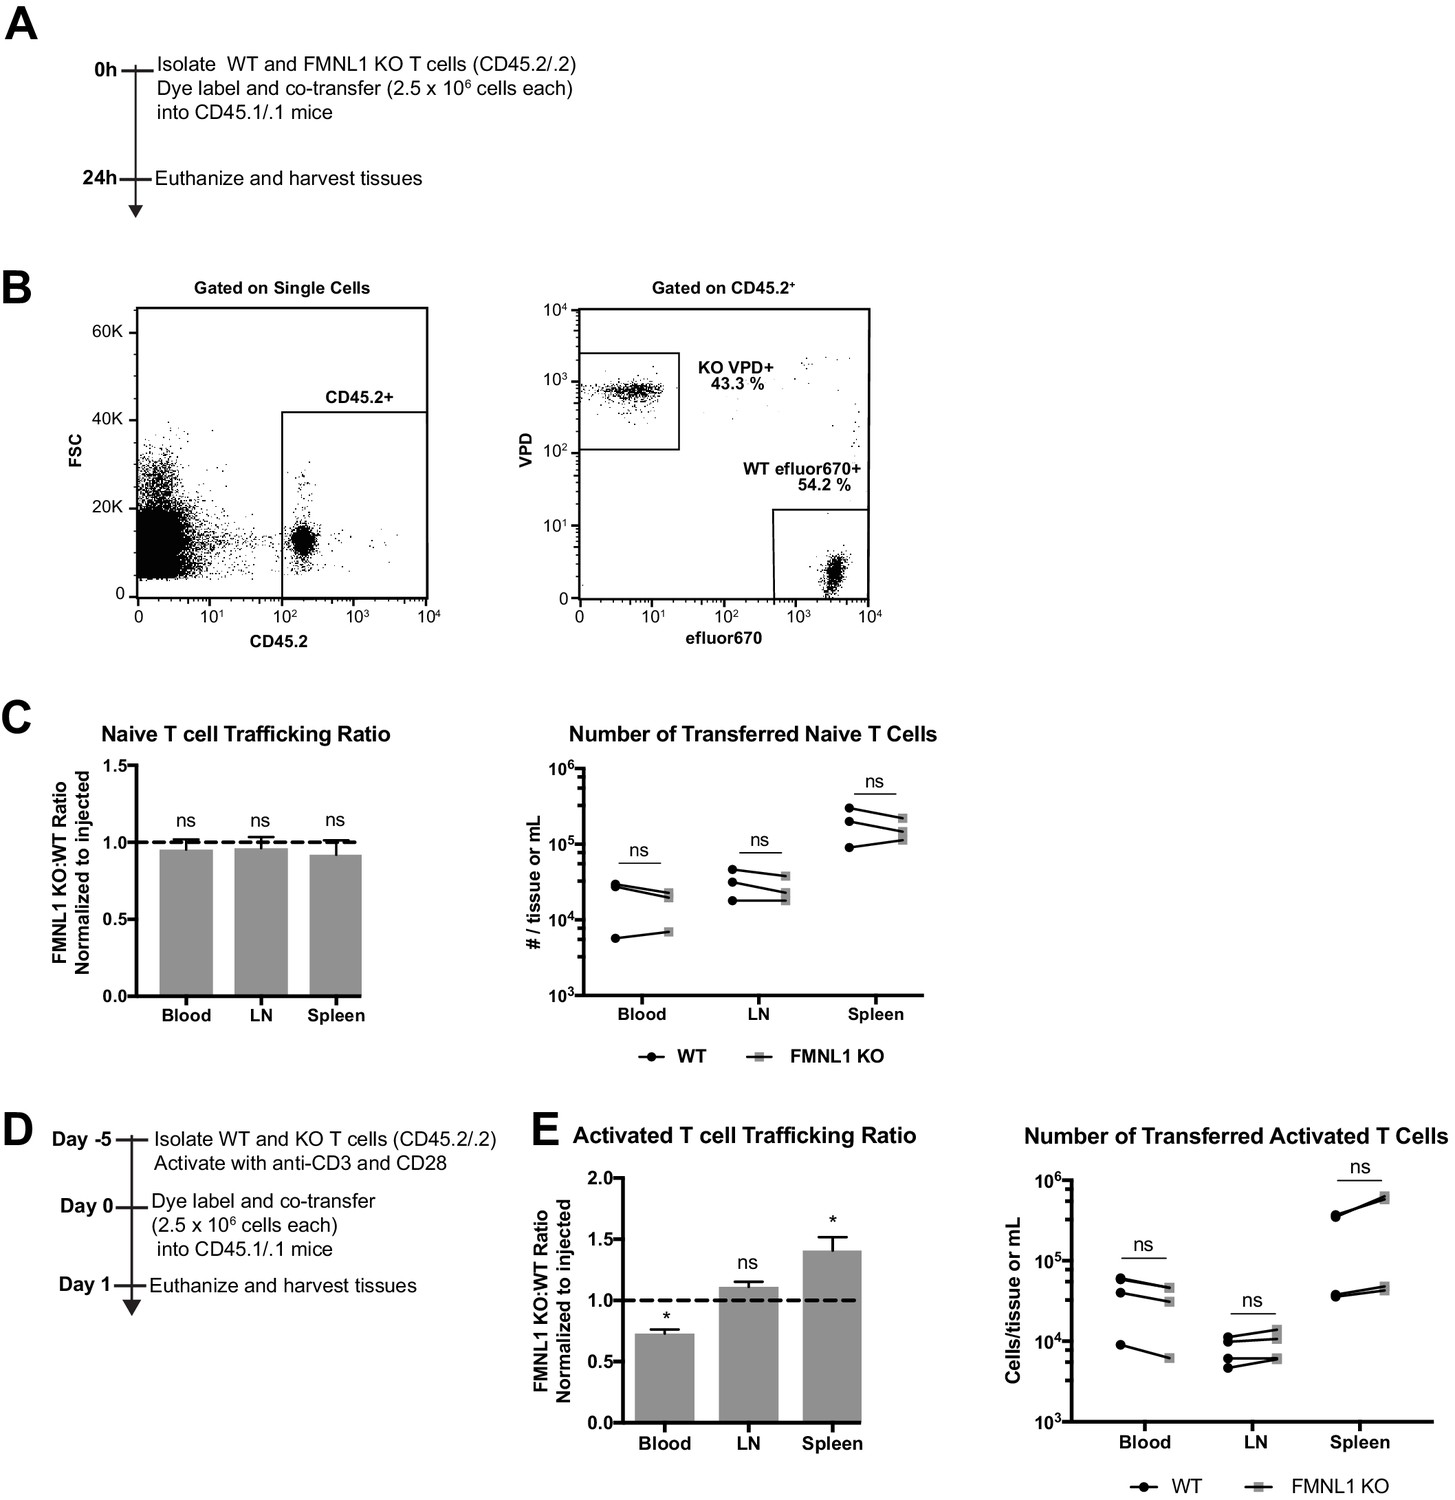
FMNL1 deficiency does not impair T cell trafficking to lymphoid tissues.
(A) Experimental set-up to quantify naive T cell trafficking to lymphoid organs. Differentially fluorescent dye-labeled naive WT and FMNL1 KO T cells were co-transferred intravenously at a 1:1 ratio into CD45.1/.1 recipient mice and T cell trafficking to lymphoid tissues was quantified by flow cytometry 24 hr post-transfer. (B) Representative lymph node flow plots and gating strategy for identifying co-transferred dye-labeled T cells. (C) Ratio of co-transferred FMNL1 KO to WT T cells in the indicated tissues (left). Values were normalized to the FMNL1 KO:WT ratio in the injected sample. A ratio below 1.0 (dashed line) indicates impaired trafficking to the tissue. Number of transferred WT or FMNL1 KO T cells recovered from the indicated tissues (right). (D) Experimental set-up to quantify activated T cell trafficking to lymphoid organs. Differentially dye-labeled activated WT and FMNL1 KO T cells were co-transferred intravenously at a 1:1 ratio into CD45.1/.1 recipient mice and T cell trafficking to lymphoid tissues was quantified by flow cytometry 24 hr post transfer. (E) Ratio of co-transferred FMNL1 KO to WT T cells in the indicated tissues (left). Values were normalized to the FMNL1 KO:WT ratio in the injected sample. A ratio below 1.0 (dashed line) indicates impaired trafficking to the tissue. Number of transferred WT or FMNL1 KO T cells recovered from the indicated tissues (right). Data in C are the mean ± SEM (left) or individual means (right) from 3 independent experiments with 2 recipient mice each per experiment. Data in E are the mean ± SEM (left) or individual means (right) from 4 independent experiments with 2 recipient mice each per experiment. Statistics in E and C were calculated using a one-sample two-tailed t-test against a theoretical FMNL1 KO:WT ratio of 1.0 (left) or by repeated measures one-way ANOVA with correction with Sidak’s multiple comparisons test (right). n.s. = not significant, *=p < 0.05.
Figure 4
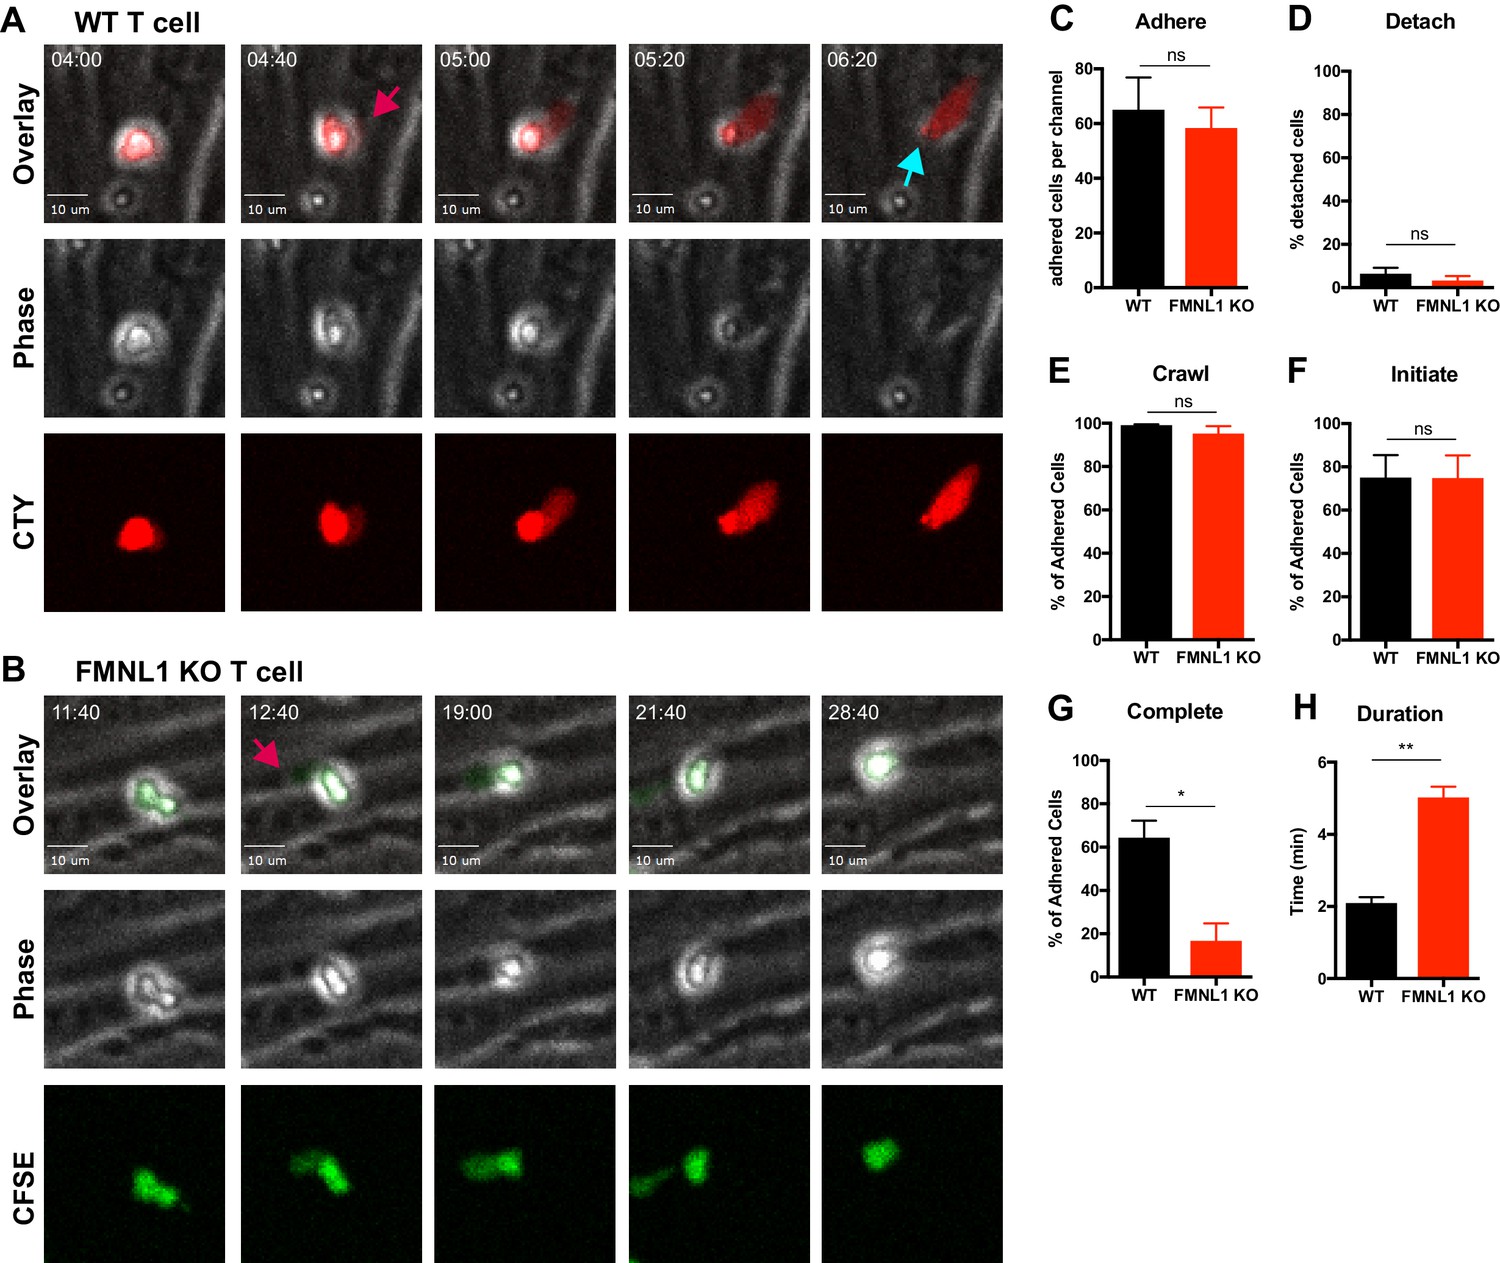
FMNL1 deficiency impairs T cell TEM at the diapedesis step.
Ex vivo activated CFSE or CellTrace Yellow (CTY) dye-labeled T cells were perfused into flow chambers containing bEnd.3 brain endothelial cell monolayers and kept under shear flow (2 dyne/cm2) for up to 30 min. During this time, phase contrast and fluorescence images were acquired every 20 s using a spinning-disk confocal microscope. (A) Selected time-points of a representative WT T cell during transmigration (Video 1). This transmigrating T cell undergoes trans-endothelial migration (TEM) evidenced by a stepwise darkening in the Phase contrast channel during the time-lapse. The red arrow points to the formation of membrane protrusions under the endothelial monolayer; the blue arrow points to the completion of TEM as shown by the disappearance of the phase halo. Time in min:s. (B) Selected time-points of a representative FMNL1 KO T cell attempting transmigration (Video 2). The red arrow points to the formation of membrane protrusions under the endothelial monolayer. However, this FMNL1 KO T cell never completes TEM as evidenced by the preservation of the phase halo. Time in min:s. (C) FMNL1 deficiency does not alter the ability of T cells to adhere to the endothelial monolayer. Number of T cells adhered to the endothelial monolayer. (D) FMNL1 deficiency does not affect T cell detachment from the endothelial monolayer. Percentage of adhered T cells that detached from the endothelial monolayer. (E) WT and FMNL1 KO T cells have similar crawling behavior. Percentage of adhered T cells that crawled on the endothelial monolayer. (F) FMNL1 deficiency does not impair the ability of T cells to attempt TEM. Percentage of adhered cells that attempted TEM as evidenced by extension of membrane protrusions underneath the endothelial monolayer. (G) FMNL1 deficiency strongly impairs the ability of T cells to complete TEM. Percentage of adhered cells that completed TEM as evidenced by complete loss of the phase halo. (H) FMNL1 deficiency prolongs TEM duration. For cells able to complete TEM, the time in minutes from first attempt to completion was quantified. Statistics in C-H calculated using two-tailed paired t-tests. Data in C-H are the mean ± SEM from 3 independent experiments with >100 cells analyzed per experiment. n.s. = not significant, *=p < 0.05, **=p < 0.01.
Figure 5 with 1 supplement
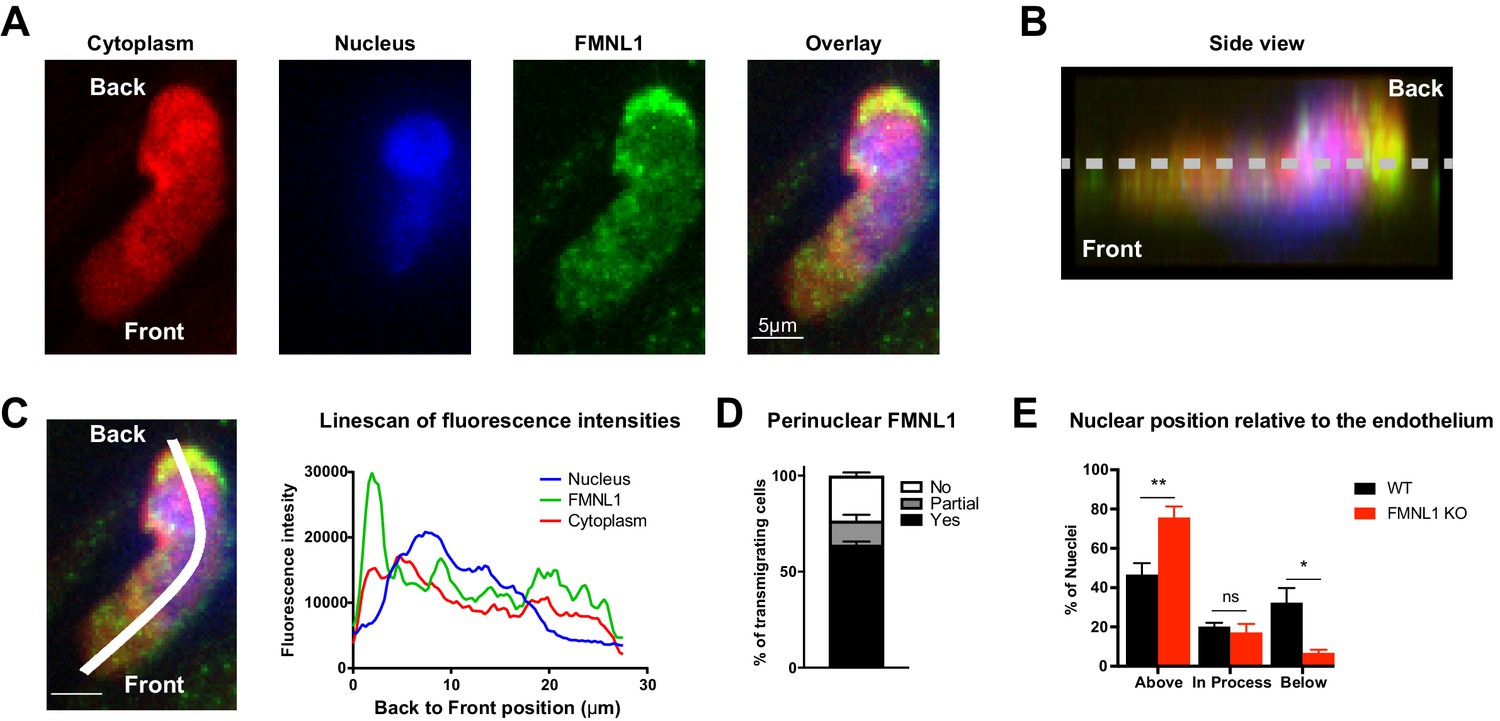
FMNL1 promotes nucleus transmigration in T cells undergoing TEM.
TEM of dye-labeled WT T cells was set up as in Figure 4. After 5 min of TEM under flow cells were fixed, permeabilized, and stained with DAPI and an anti-FMNL1 antibody (A) Representative maximum Z projections of a transmigrating T cell, defined as a cell with a portion of the cytoplasm underneath the endothelial monolayer. (B) Representative 3D side view reconstruction of the transmigrating T cell in A. Dashed line indicates position of the endothelial monolayer. (C) Representative linescan quantification of fluorescence intensities in a transmigrating T cell. Graph of the fluorescence intensities along the depicted line in each channel relative to the position within the cell. (D) FMNL1 is enriched behind the nucleus in transmigrating T cells. Percentage of transmigrating T cells with perinuclear enrichment behind the nucleus, partial enrichment of FMNL1 behind the nucleus, or no enrichment (see Methods for analysis). (E) FMNL1 deficiency impairs transmigration of the T cell nucleus across endothelial barriers. Position of T cell nuclei in fixed WT or FMNL1 KO T cells after 5 min of TEM under flow. Using spinning-disk confocal microscopy and DAPI staining, the nuclei were scored as being above the plane of the endothelium, in the process of transmigrating, or below. Data in D are the mean ± SEM from 3 independent experiments with >15 cells analyzed per experiment; data in E are the mean ± SEM from 4 independent experiments with >50 cells analyzed per experiment. Statistics in E were calculated using repeated-measures ANOVA with Sidak’s multiple comparisons test. n.s. = not significant, *=p < 0.05, **=p < 0.01.
Figure 5—figure supplement 1
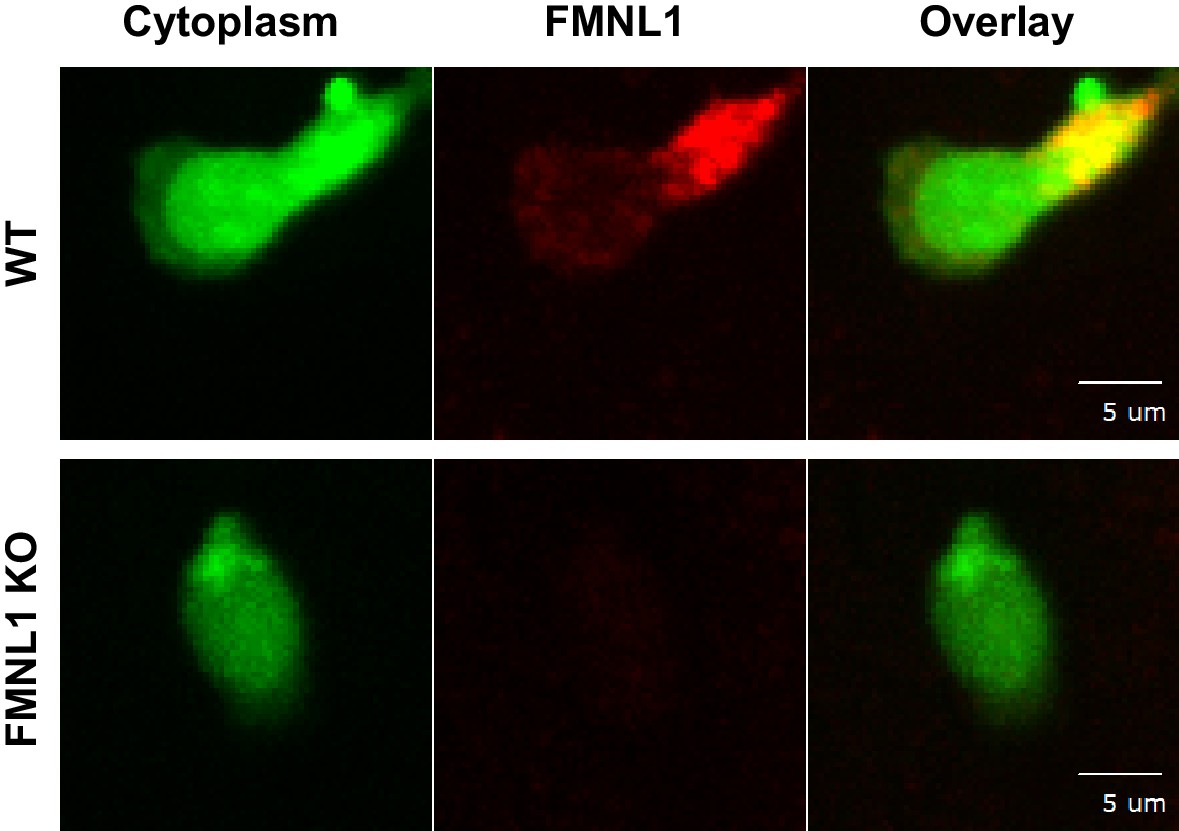
Immunofluorescent FMNL1 antibody staining is specific for FMNL1.
TEM under flow of differentially dye-labeled WT and FMNL1 KO T cells was set up as in Figure 4. After 5 min of TEM under flow cells were fixed, permeabilized, and stained with a mouse monoclonal anti-FMNL1 antibody followed by secondary staining with a Dylight-649 conjugated Donkey anti-mouse secondary antibody. Representative images of a WT (top) or FMNL1 KO T cell (bottom). Images are maximum Z projections of the indicated channel and a composite overlay image.
Figure 6 with 2 supplements
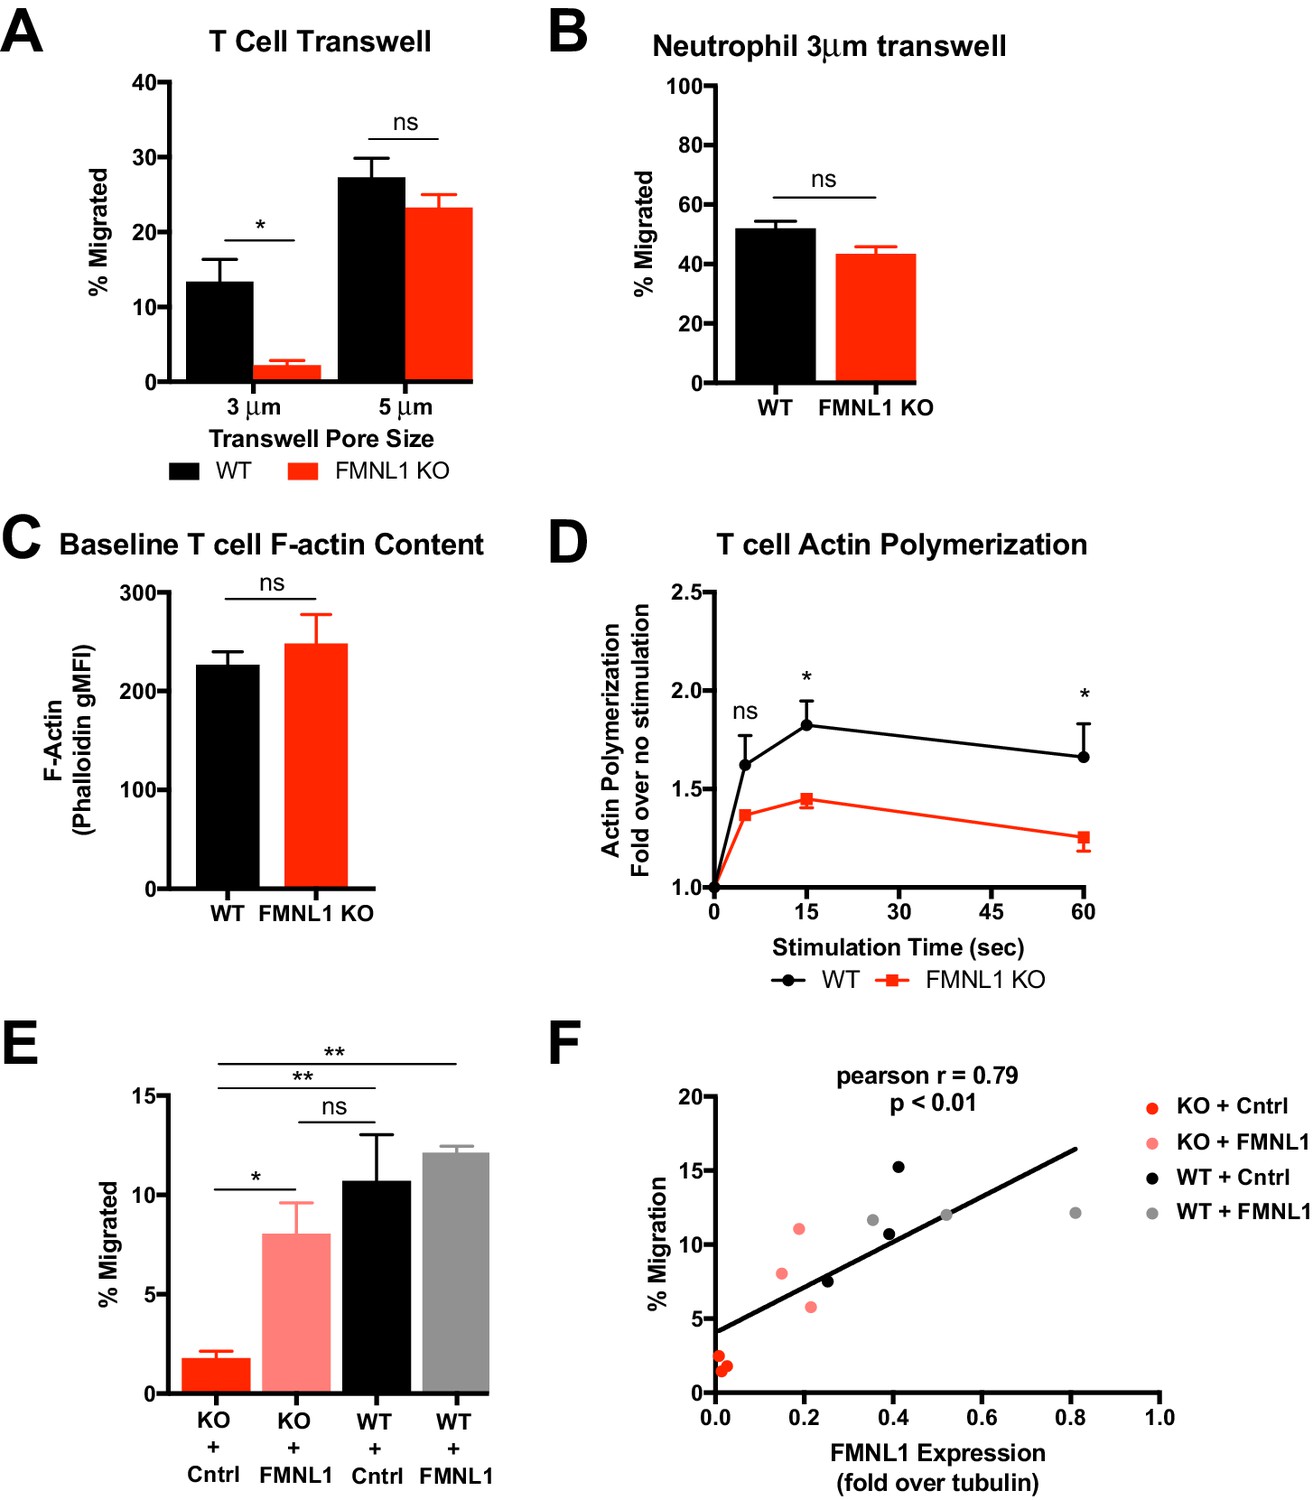
T cell migration through narrow pores is FMNL1 dependent.
(A) FMNL1-deficient T cells are impaired in chemotaxis through narrow pores. Percentage of activated cells migrating through transwell membranes of the indicated pore size in response to CXCL12. (B) Neutrophil chemotaxis through narrow pores is not impaired by FMNL1 deficiency. Percentage of neutrophils migrating through 3 μm transwell membrane pores in response to CXCL1. (C) FMNL1-deficient T cells express similar baseline levels of F-actin compared to WT T cells. Quantification of F-actin (gMFI of fluorescent phalloidin staining by flow cytometry) in activated T cells. (D) FMNL1-deficient T cells are impaired in actin polymerization in response to chemokine. Time course of fold increase in F-actin (determined as above) of activated T cells in response to CXCL12 stimulation. (E) Re-expression of FMNL1 in FMNL1 KO T cells restores migration through narrow pores. Activated WT or FMNL1 KO T cells were transduced using either a FMNL1-expressing or control retroviral construct. Percentage of indicated T cells migrating through 3 μm transwell membrane pores in response to CXCL12. (F) Transwell migration correlates with FMNL1 expression. Percentage of T cells migrating through 3 μm transwell membrane pores in response to CXCL12 vs level of FMNL1 expression as determined by densitometry of western blot staining (intensity of FMNL1 staining over intensity of tubulin staining). The line indicates simple linear regression of the data. Data in A-E are the mean ± SEM from 3 independent experiments; data in F are the individual values from 3 independent experiments. Statistics in A and E were calculated by repeated measures one-way ANOVA with Sidak’s multiple comparisons test; statistics in B and C were calculated using a two-tailed paired t-test; statistics in D were calculated by repeated-measures two-way ANOVA with Sidak’s multiple comparisons test; statistics in F were calculated using Pearson’s correlation. n.s. = not significant, *=p < 0.05, **=p < 0.01.
Figure 6—figure supplement 1
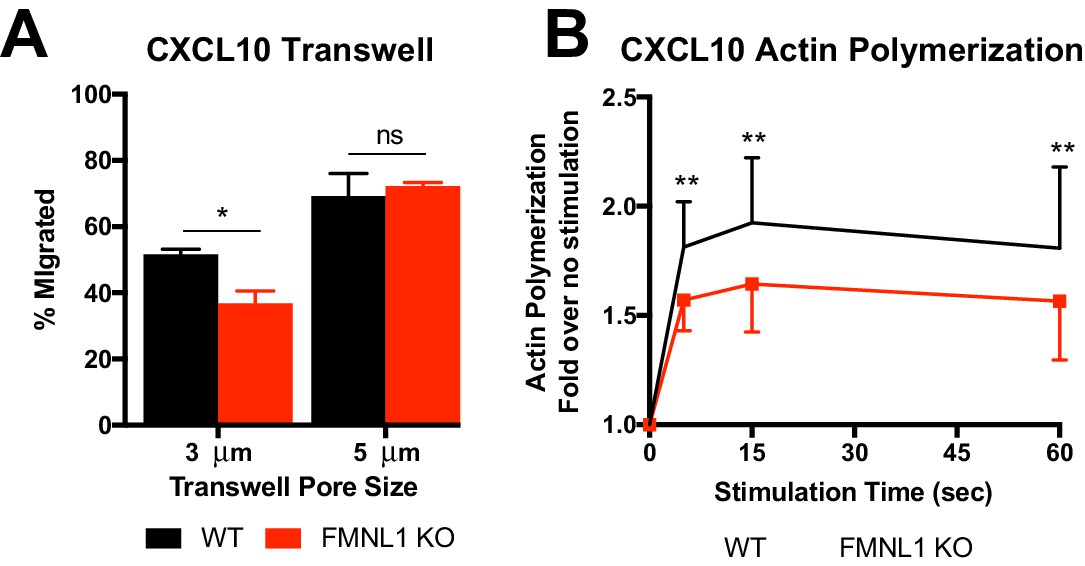
Transwell migration and actin polymerization responses to CXCL10.
(A) FMNL1-deficient T cells are impaired in chemotaxis through narrow pores. Percentage of activated cells migrating through transwell membranes of the indicated pore size in response to CXCL10. (B) FMNL1-deficient T cells are impaired in actin polymerization in response to chemokine. Time course of fold increase in filamentous actin (as determined by flow cytometry of fluorescent phalloidin staining) of activated T cells in response to CXCL10 stimulation. Data in A are the mean ± SEM from 3 independent experiments; data in B are the mean ± SEM from 4 independent experiments. Statistics in A were calculated by repeated measures one-way ANOVA with Sidak’s multiple comparisons test; statistics in B were calculated by repeated-measures two-way ANOVA with Sidak’s multiple comparisons test. n.s. = not significant, *=p < 0.05, **=p < 0.01.
Figure 6—figure supplement 2
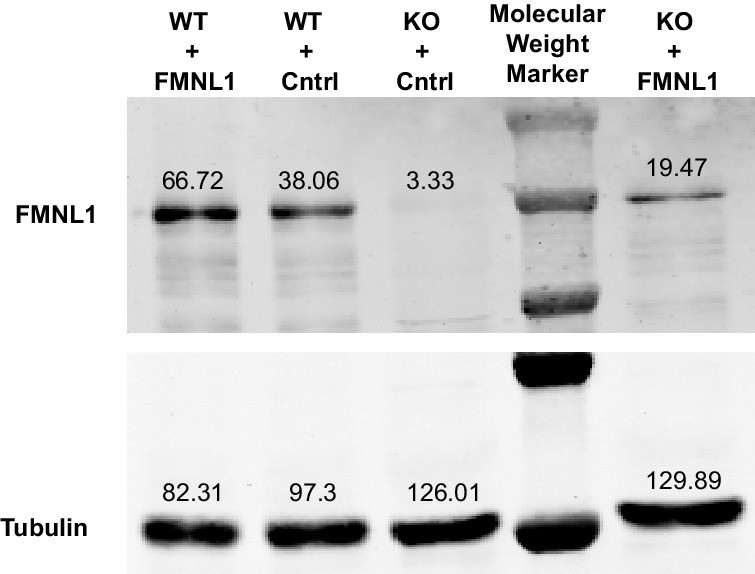
Re-expression of FMNL1 in KO cells.
Representative western blot for Figure 6F showing expression levels of FMNL1 in FMNL1 KO or WT T cells transduced with FMNL1-expressing or control retroviral constructs. Tubulin staining is shown as a loading control. Numbers next to bands indicate densitometry quantification. The blot depicted is representative of 3 independent experiments.
Figure 7

FMNL1 mediates posterior perinuclear actin polymerization to promote T cell migration through environmental constrictions.
Ex vivo activated control LifeAct-GFP and FMNL1 KO LifeAct-GFP T cells were stained with Hoechst, added to PDMS microchannels and imaged by spinning-disk confocal time-lapse microscopy. (A) Schematic of the PDMS microchannels with constrictions used in the experiments. (B) FMNL1 deficiency impairs the ability of T cells to migrate through 3 µm constrictions. Quantification of the percentage of T cell passage through 3 µm constrictions within microchannel devices. (C) Example images of WT LifeAct-GFP (Left panels and Video 3) and FMNL1 KO/LifeAct-GFP (Right panels and Video 4) T cells engaging microchannel constrictions. Top images, LifeAct-GFP (green) and Hoechst (DNA, blue) overlaid on the brightfield channel (gray). Bottom images, pseudocolor rendition of the LifeAct-GFP channel. White dashed arrows indicate cell direction, red arrows point to areas of F-actin accumulation at the back of the cell, black arrows indicate F-actin accumulation at the front of the cell. Time is min:sec, white scale bar = 10 µm. (D) FMNL1 promotes actin polymerization at the back of the nucleus during migration under confinement. Top, example of the image masking process to quantify F-actin distribution relative to the front and back of the nucleus. Bottom, quantification of the back-to-front ratio of F-actin distribution during unconfined and confined migration. (E) Paired analysis of individual T cells undergoing unconfined and confined migration. Data for cells that increase their F-actin back-to-front ratio under confinement are shown in black, data for cells that decrease the back-to-front ratio are in red. Data in B are the mean ± SEM from 3 independent experiments with a total of 83 control and 68 KO cells analyzed. Data in D are the mean ± SEM and data in E are pooled from 3 independent experiments with a total of 47 control and 35 KO cells analyzed. Statistics in B and E calculated using a two-tailed paired t-test; statistics in D calculated using One-way ANOVA with Sidak’s multiple comparisons. n.s. = not significant.
-
Figure 7—source data 1
Data points for the graphs in Figure 7D are provided as an Excel spreadsheet.
- https://cdn.elifesciences.org/articles/58046/elife-58046-fig7-data1-v2.xlsx
Videos
Video 1
Example of a WT control T cell undergoing transendothelial migration imaged by time-lapse confocal microscopy.
Control and FMNL1 KO T cells were activated ex-vivo and differentially dye-labeled with CFSE or CellTrace Yellow (CTY). These T cells were mixed at a 1:1 ratio and perfused into flow chambers containing bEnd.3 brain endothelial cell monolayers and kept under shear flow (2 dyne/cm2) for up to 30 min. During this time, phase contrast and fluorescence images were acquired every 20 s using a spinning-disk confocal microscope. Phase contrast (left), CTY fluorescence (middle), and overlay (right) images are shown. This representative control T cell completes transendothelial migration as shown by the progressive disappearance of the white phase contrast ring around the T cell. Time is displayed as min:s.
Video 2
Example of a FMNL1 KO T cell unable to complete transendothelial migration.
Control and FMNL1 KO T cells were activated ex-vivo and differentially dye-labeled with CFSE or CellTrace Yellow (CTY). These T cells were mixed at a 1:1 ratio and perfused into flow chambers containing bEnd.3 brain endothelial cell monolayers and kept under shear flow (2 dyne/cm2) for up to 30 min. During this time, phase contrast and fluorescence images were acquired every 20 s using a spinning-disk confocal microscope. Phase contrast (left), CFSE fluorescence (middle), and overlay (right) images are shown. This representative FMNL1 T cell fails to complete transendothelial migration as shown by the persistence of the white phase contrast ring around the T cell. Time is displayed as min:s.
Video 3
Example of a control LifeAct-GFP T cell displaying posterior perinuclear actin polymerization while migrating through a microchannel constriction.
Control LifeAct-GFP T cells were activated ex-vivo, labeled with Hoechst to visualize their nuclei, and added to microchannel devices. T cells crawling in the microchannels were imaged at 37°C for 2–6 hr. Brightfield and fluorescent images were acquired every 30 s. Top images, LifeAct-GFP (green) and Hoechst (DNA, blue) overlaid on the brightfield channel (gray). Bottom images, pseudocolor rendition of the LifeAct-GFP channel. This representative control LifeAct-GFP T cell shows posterior perinuclear actin polymerization while migrating through a microchannel constriction. Time is displayed as min:s.
Video 4
Example of a FMNL1 KO/LifeAct-GFP T cell failing polymerize actin at the back of the cell and unable to migrate through a microchannel constriction.
FMNL1 KO/LifeAct-GFP T cells were activated ex-vivo, labeled with Hoechst to visualize their nuclei, and added to microchannel devices. T cells crawling in the microchannels were imaged at 37°C for 2–6 hr. Brightfield and fluorescent images were acquired every 30 s. Top images, LifeAct-GFP (green) and Hoechst (DNA, blue) overlaid on the brightfield channel (gray). Bottom images, pseudocolor rendition of the LifeAct-GFP channel. This representative FMNL1 KO/LifeAct-GFP T cell lacks posterior perinuclear actin polymerization as its nucleus engages the microchannel constriction and is unable to migrate through the constriction. Time is displayed as min:s.
Tables
Key resources table
| Reagent type (species) or resource | Designation | Source or reference | Identifiers | Additional information |
|---|---|---|---|---|
| Genetic Reagent (M. musculus) | FMNL1 KO | This Paper | FMNL1 deficient mouse on C57BL/6 genetic background | |
| Genetic Reagent (M. musculus) | LifeAct-GFP | Riedl et al., 2008 | RRID:IMSR_EM:12427 | Mice expressing LifeAct-GFP construct on C57BL/6 genetic background |
| Antibody | anti-FMNL1 (mouse monoclonal) | Santa Cruz Biotechnology | Cat#: sc-390466 RRID:AB_2847962 Clone A-4 | IF (1:100) |
| Recombinant DNA Reagent | FMNL1-IRES-GFP MMLV (plasmid) | VectorBuilder | pMMLV vector that expresses FMNL1 and GFP (under an IRES) | |
| Recombinant DNA Reagent | Control GFP MMLV and Control RFP MMLV (plasmids) | VectorBuilder | Control pMMLV vectors that express GFP or RFP | |
| Other | Microchannel fluidic devices | 4DCell | Cat#s: MC011 and MC019 | Microchannel devices with variable channel widths and constrictions |
| Cell line (M. musculus) | bEnd.3 | ATCC (Montesano et al., 1990) | Cat#: CRL-2299 RRID:CVCL_0170 | Mouse endothelial cell line used in the TEM assays |
Additional files
Download links
A two-part list of links to download the article, or parts of the article, in various formats.
Downloads (link to download the article as PDF)
Open citations (links to open the citations from this article in various online reference manager services)
Cite this article (links to download the citations from this article in formats compatible with various reference manager tools)
Formin-like 1 mediates effector T cell trafficking to inflammatory sites to enable T cell-mediated autoimmunity
eLife 9:e58046.
https://doi.org/10.7554/eLife.58046


