Methotrexate attenuates vascular inflammation through an adenosine-microRNA-dependent pathway
- Department of Medicine, Cardiovascular Division, Brigham and Women’s Hospital, Harvard Medical School, United States
- Department of Cardiovascular Surgery, The Second Xiangya Hospital, Central South University, China
- Department of Pathology and Laboratory Medicine, Institute for Immunology, Perelman School of Medicine, University of Pennsylvania, United States
- Division of Protective Immunity, Department of Pathology and Laboratory Medicine, Children’s Hospital of Philadelphia, United States
- Department of Cardiology, Xiangya Hospital, Central South University, China
- Lillehammer Hospital for Rheumatic diseases, Norway
- Norwegian University of Science and Technology, Norway
Figures
Figure 1 with 1 supplement
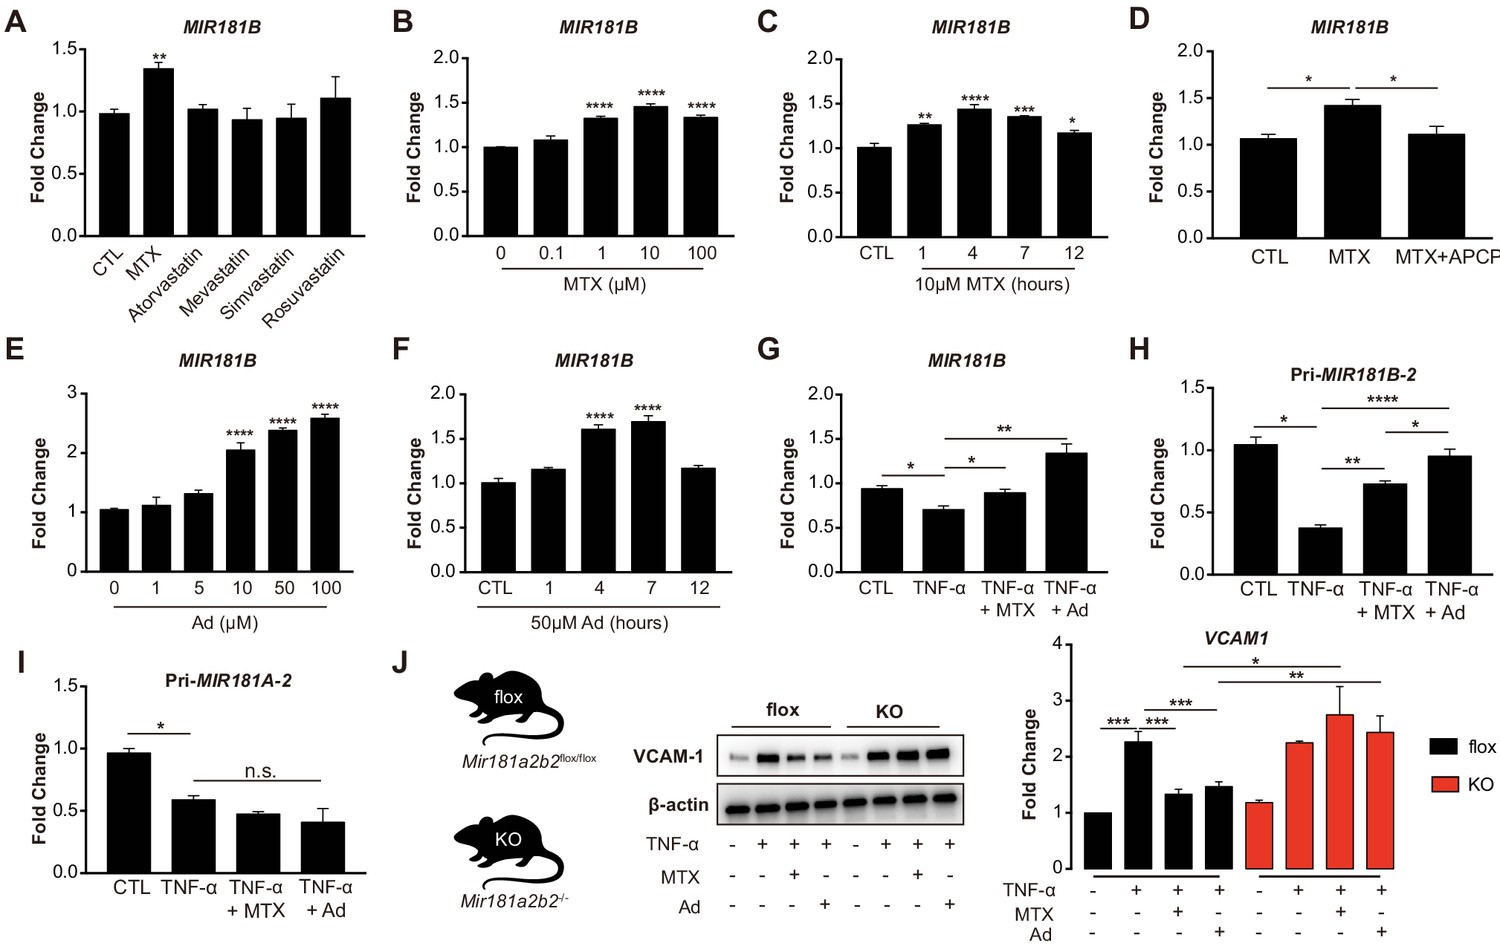
Methotrexate (MTX) represses TNF-α-induced pro-inflammatory gene expression via upregulation of MIR181B-2 expression in ECs.
(A) Real-time qPCR analysis of mature MIR181B in HUVECs in the presence or absence of MTX (10 µM), Atorvastatin (1 µM), Mevastatin (1 µM), Simvastatin (1 µM), and Rosuvastatin (1 µM) for 4 hr. three biological replicates. Unpaired two-tailed Student t test. (B) Titration of MTX (0 to 100 µM) for 4 hr (three biological replicates, Unpaired two-tailed Student t test) and (C) time course of MTX (10 µM) in HUVECs to assess MIR181B expression, three biological replicates. One-way ANOVA. (D) Real-time qPCR analysis of MIR181B in HUVECs incubated with MTX (10 µM) or in combination with APCP (50 µM) for 4 hr. Three biological replicates. Unpaired two-tailed Student t test. (E) Dose-response of adenosine (Ad) (0 to 100 µM) for 4 hr and (F) time course of Ad (50 µM) over 0–12 hr on MIR181B expression in HUVECs. Three biological replicates. One-way ANOVA. (G) HUVECs were treated with TNF-α (10 ng/ml) alone or in combination with either MTX (10 µM) or Ad (50 µM) for 4 hr. Three biological replicates. Unpaired two-tailed Student t test. Analysis of primary transcript of (H) MIR181B-2 (Pri-MIR181B-2) or (I) MIR181A-2 (Pri-MIR181A-2) in response to TNF-α (10 ng/ml) with or without MTX (10 µM) or Ad (50 µM) for 4 hr in HUVECs. Three biological replicates. Unpaired two-tailed Student t test. (J) Isolated primary lung endothelial cells (ECs) from Mirr181a2b2flox/flox (flox) mice and Mir181a2b2-/- (KO) mice were treated with TNF-α (10 ng/ml) with or without MTX (10 µM) or Ad (50 µM) for 8 hr to analyze VCAM-1 protein expression. Please see Figure 1—source data 1. Three biological replicates. Unpaired two-tailed Student t test. *p<0.05; **p<0.01; ***p<0.001; ****p<0.0001. n.s. indicated non significance. All values represent mean ± SEM.
Figure 1—figure supplement 1
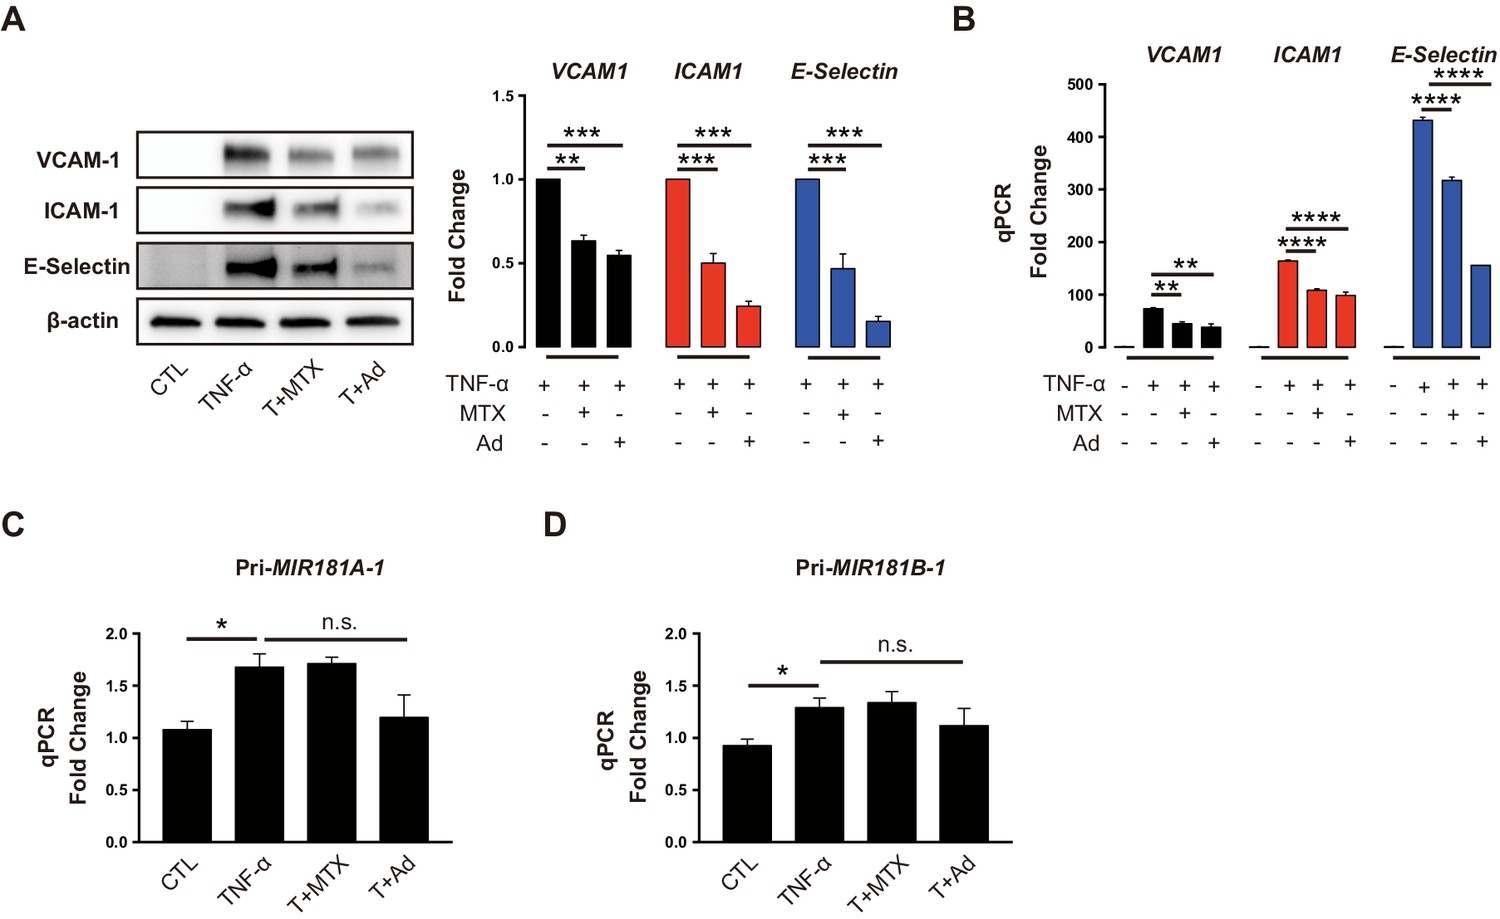
Methotrexate (MTX) and Ad repress TNF-α-induced pro-inflammatory genes without affecting primary MIR181A-1 and MIR181B-1 expression.
(A) Western blot analysis of VCAM-1, ICAM-1, and E-Selectin in HUVECs treated with or without MTX (10 µM) or Ad (50 µM), after stimulation of TNF-α (10 ng/ml) for 8 hr. Quantification of n = 3 independent experiments. (B) Real-time qPCR analysis of VCAM-1, ICAM-1, and E-Selectin in HUVECs treated with or without MTX (10 µM) or Ad (50 µM), after treatment with TNF-α (10 ng/ml) for 4 hr. Real-time qPCR analysis of (C) primary transcript of MIR181A1 or (D) primary transcript of MIR181B-1 in HUVECs treated with or without MTX (10 µM) or Ad (50 µM), after treatment with TNF-α (10 ng/ml) for 4 hr. (A–D), n = 3–6. *p<0.05; **p<0.01; ***p<0.001; ***p<0.0001. All values represent mean ± SEM.
Figure 2 with 1 supplement
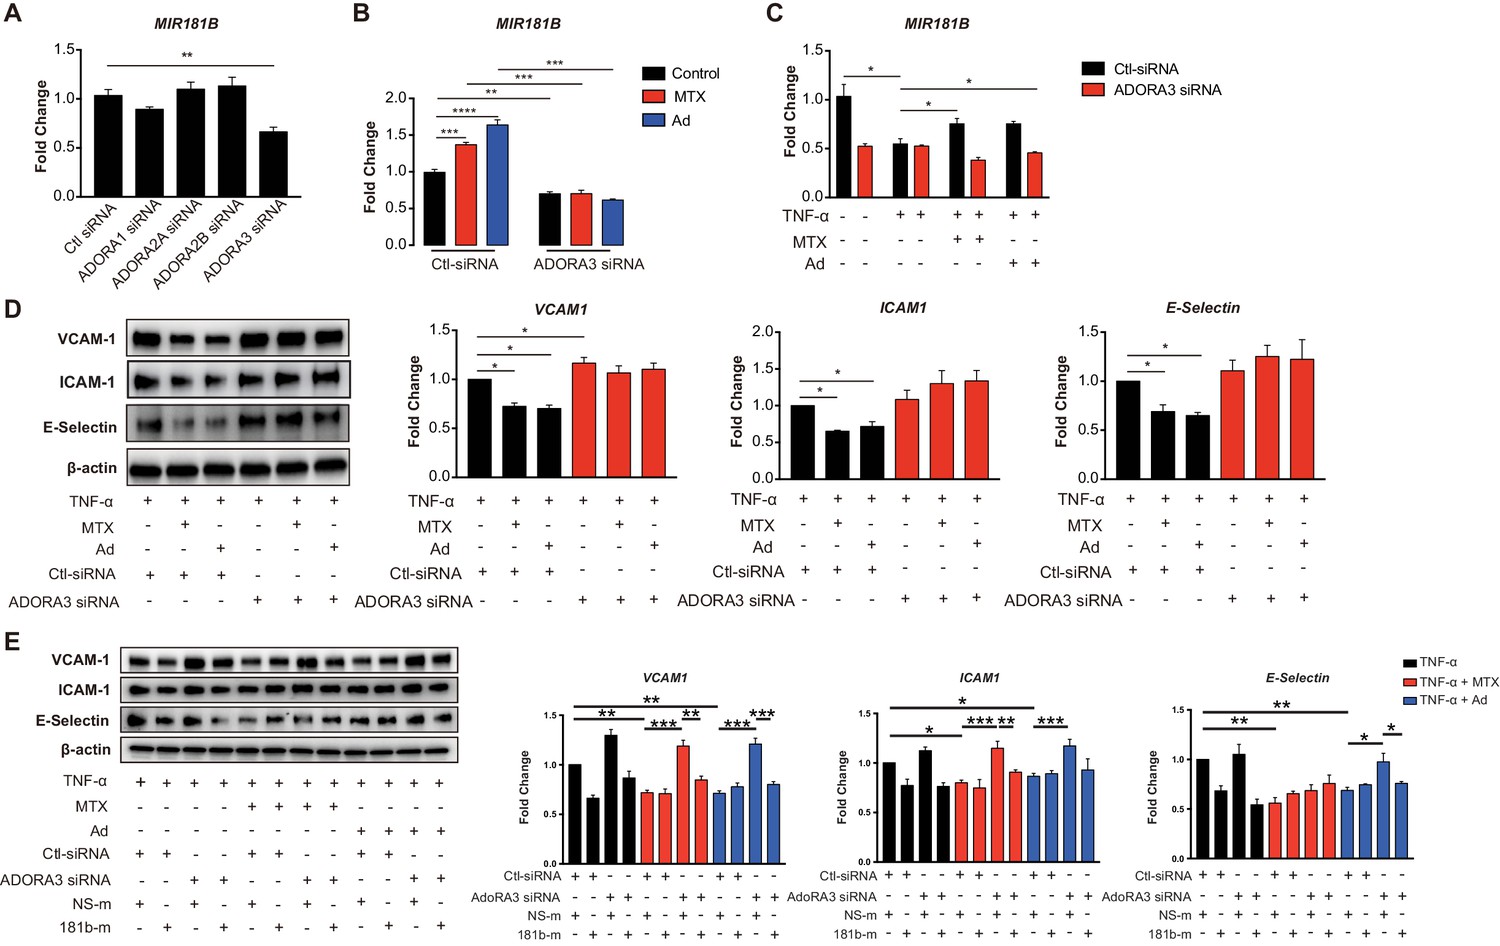
Induction of MIR181B expression by methotrexate (MTX) or adenosine is adenosine receptor A3 (ADORA3) dependent.
(A) Knockdown for adenosine receptors A1, A2A, A2B, and A3 in HUVECs was performed to analyze MIR181B expression. three biological replicates. One-way ANOVA. (B) MIR181B expression in HUVECs transfected with Ctl-siRNA or ADORA3 siRNA after treatment with MTX (10 µM) or Ad (50 µM) or (C) treatment with TNF-α (10 ng/ml) alone or in combination MTX (10 µM) or Ad (50 µM). Three biological replicates. One-way ANOVA and Unpaired two-tailed Student t test. (D) Western blot analyses of VCAM-1, ICAM-1, and E-Selectin expression in HUVECs transfected with Ctl-siRNA or ADORA3 siRNA in the presence of TNF-α (10 ng/ml) in combination with either MTX (10 µM) or Ad (50 µM). Three biological replicates. Unpaired two-tailed Student t test. (E) in the presence of miRNA negative control (NS-m) or MIR181B mimics (181b-m) stimulated with TNF-α (10 ng/ml) or in combination with MTX (10 µM) or Ad (50 µM). Please see Figure 2—source data 1. Three biological replicates. Unpaired two-tailed Student t test. *p<0.05; **p<0.01; ***p<0.001; ****p<0.0001. n.s. indicated non significance. All values represent mean ± SEM.
Figure 2—figure supplement 1
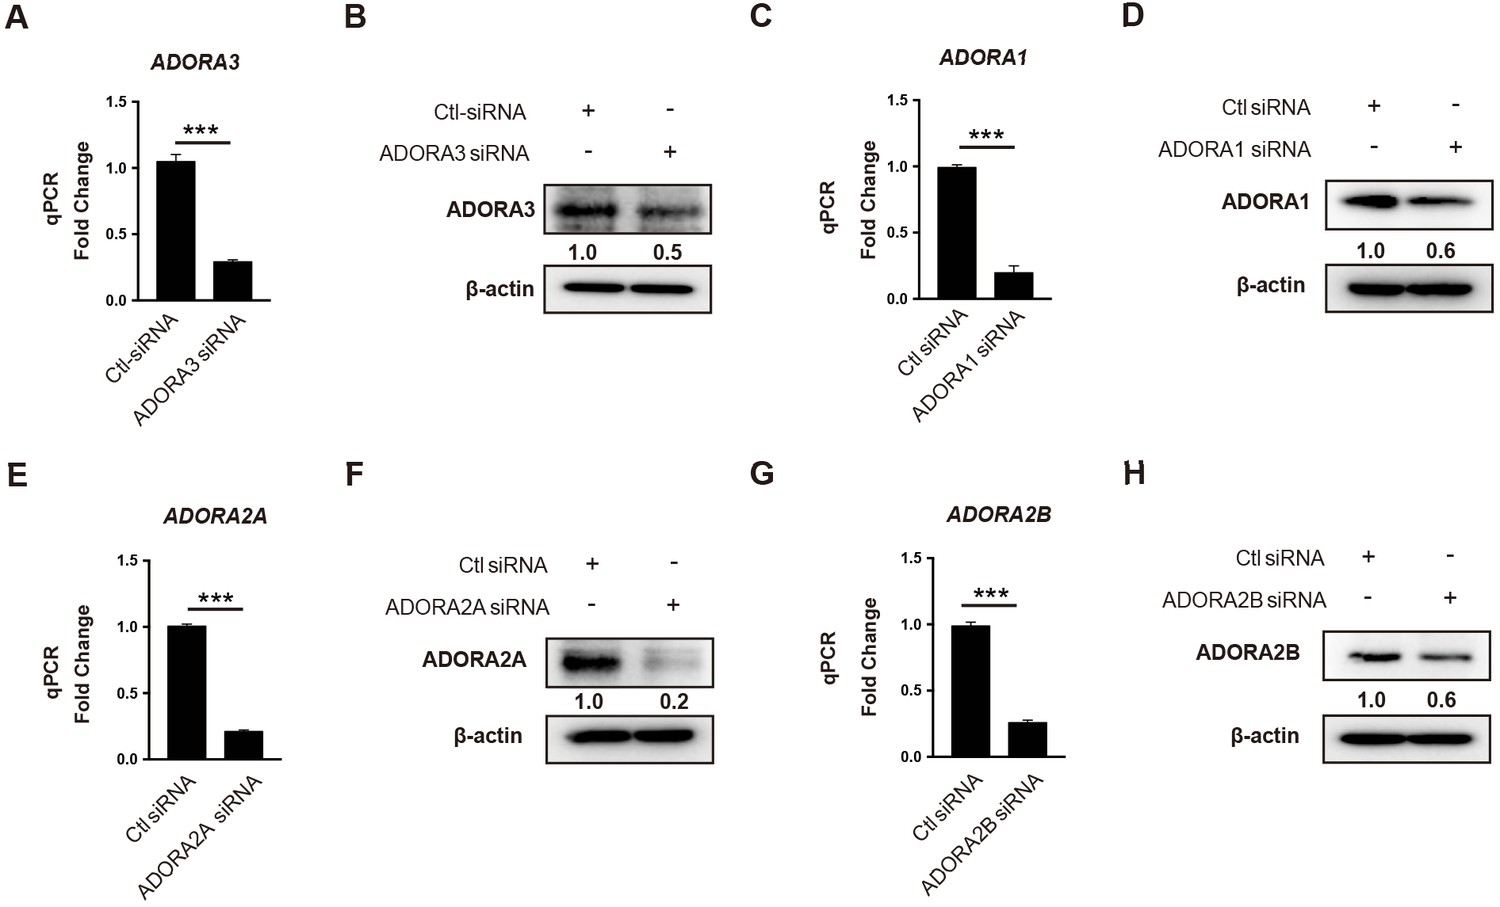
Knockdown efficiency for adenosine receptor siRNAs.
mRNA, and protein expression analysis for (A, B) ADORA3 siRNA, (C, D) ADORA1 siRNA, (E, F) ADORA2A siRNA and (G, H) ADORA2B siRNA compared to control siRNA in HUVECs transfected for 36 hr. (A–H), n = 3. ***p<0.001. All values represent mean ± SEM.
Figure 3 with 3 supplements

MIR181A2B2 promoter analysis in response to methotrexate (MTX) or Ad in endothelial cells (ECs).
(A) Luciferase reporter constructs containing the indicated (0.606–5.1 kb 5’upstream) MIR181A2B2 promoter sequences were transfected in HEK 293 T cells and luciferase activity was measured 12 hr after treatment with MTX (10 µM) or Ad (50 µM), respectively. eight biological replicates. One-way ANOVA. (B) Luciferase reporter constructs containing the indicated (0.606 kb 5’upstream) MIR181A2B2 promoter sequences were transfected in HEK 293 T cells and luciferase activity was measured 12 hr after treatment with MTX (10 µM) or Ad (50 µM), respectively. Seven to eight biological replicates. One-way ANOVA. (C) Effect of siRNA-mediated knockdown for SMAD2, SMAD3, or SMAD4 in response to MTX or Ad on the 0.606 kb luciferase reporter. Three biological replicates. Unpaired two-tailed Student t test. (D–E) Real-time qPCR analysis of MIR181B expression in HUVECs transfected with siRNAs to negative control, SMAD2, SMAD3, or SMAD4 in the (D) absence or (E) presence of MTX (10 µM) or Ad (50 µM) for 4 hr. three biological replicates. Unpaired two-tailed Student t test. (F–G) Luciferase reporters containing the 0.606 kb miR-181a2b2 promoter were transfected in combination with siRNA to negative control or ADORA3 (F) or ADORA1, ADORA2A, or ADORA2B (G) and stimulated with MTX (10 µM) or Ad (50 µM). Please see Figure 3—source data 1. four biological replicates. Unpaired two-tailed Student t test. *p<0.05; **p<0.01; ***p<0.001; ****p<0.0001. All values represent mean ± SEM.
Figure 3—figure supplement 1
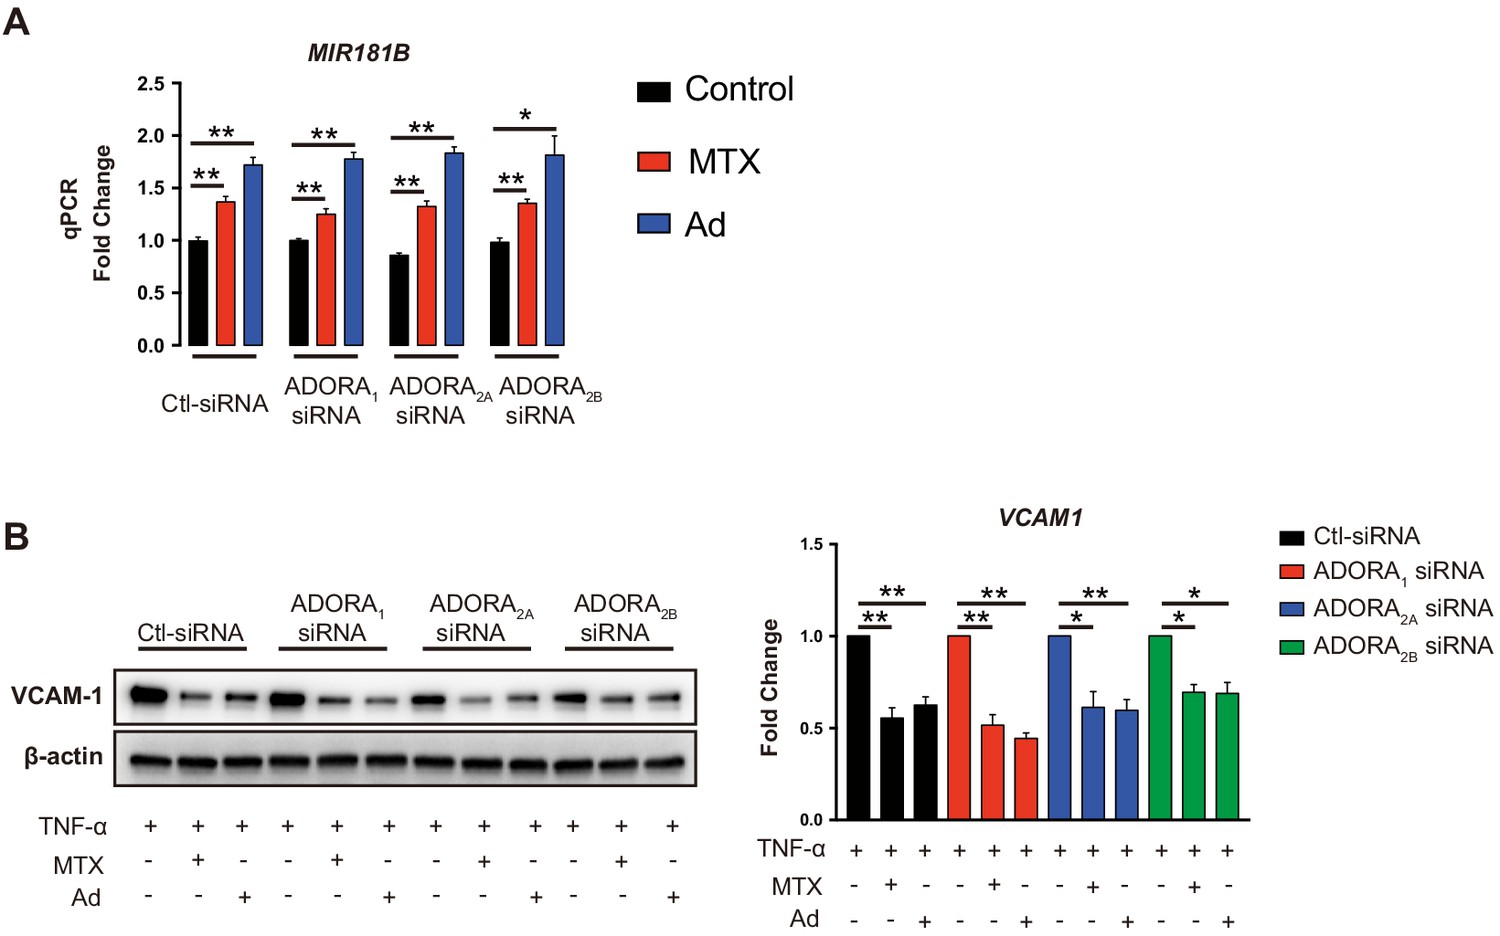
Silencing of adenosine receptor A1, A2A, or A2B did not affect methotrexate (MTX) or adenosine-induced MIR181B expression.
(A) Expression analysis of MIR181B in HUVECs transfected with siRNA to scrambled control, ADORA1, ADORA2A, or ADORA2B in the presence or absence of MTX (10 µM) or Ad (50 µM) for 4 hr. (B) VCAM-1 protein quantification by western blot as described above, but in the presence of TNF-α (10 ng/ml) for 8 hr. A and B, n = 3. *p<0.05; **p<0.01. All values represent mean ± SEM.
Figure 3—figure supplement 2
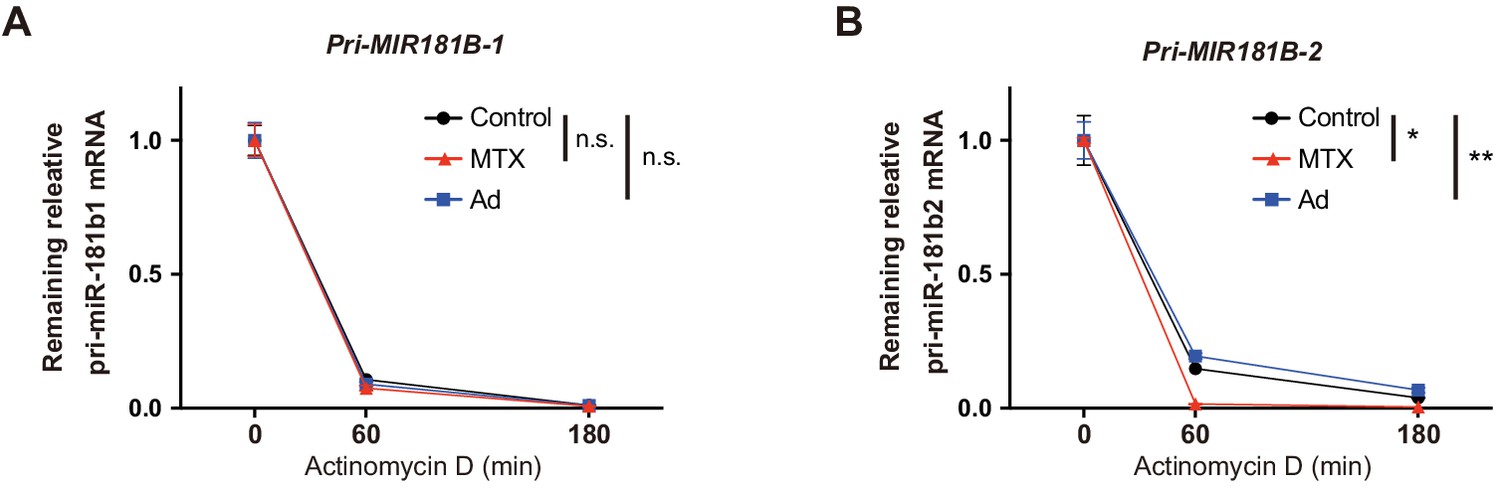
The effect of methotrexate (MTX) and Ad on pri-MIR181B-1 and pri-MIR181B-2 transcript stability.
HUVECs were incubated with 10 µg/ml Actinomycin D to inhibit transcription and treated with 10 µM MTX or 50 µM Ad. (A) Real-time qPCR analysis of pri- MIR181B-1 transcript expression at indicated time points. (B) Real-time qPCR analysis of pri- MIR181B-2 transcript expression at indicated time points. (A) and B), n = 3. *p<0.05, **p<0.01. All values represent mean ± SEM.
Figure 3—figure supplement 3
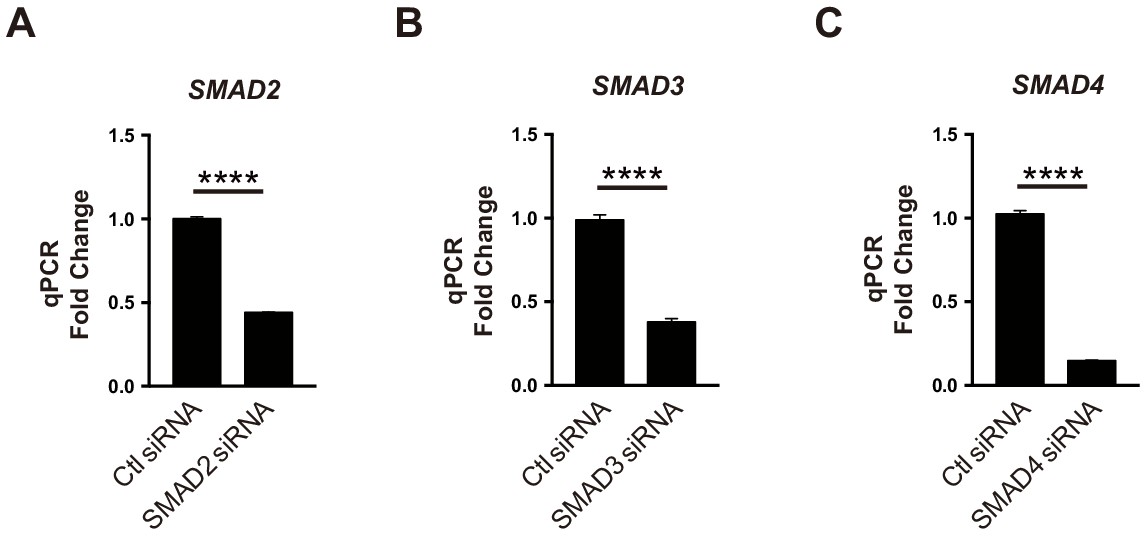
The knockdown efficiency for SMAD siRNA.
(A) Knockdown efficiency for (A) SMAD2 siRNA, (B) SMAD3 siRNA, and (C) SMAD4 siRNA compared to siRNA control transfected HUVECs as quantified by real-time qPCR. (A–C), n = 3. ****p<0.0001. All values represent mean ± SEM.
Figure 4 with 2 supplements
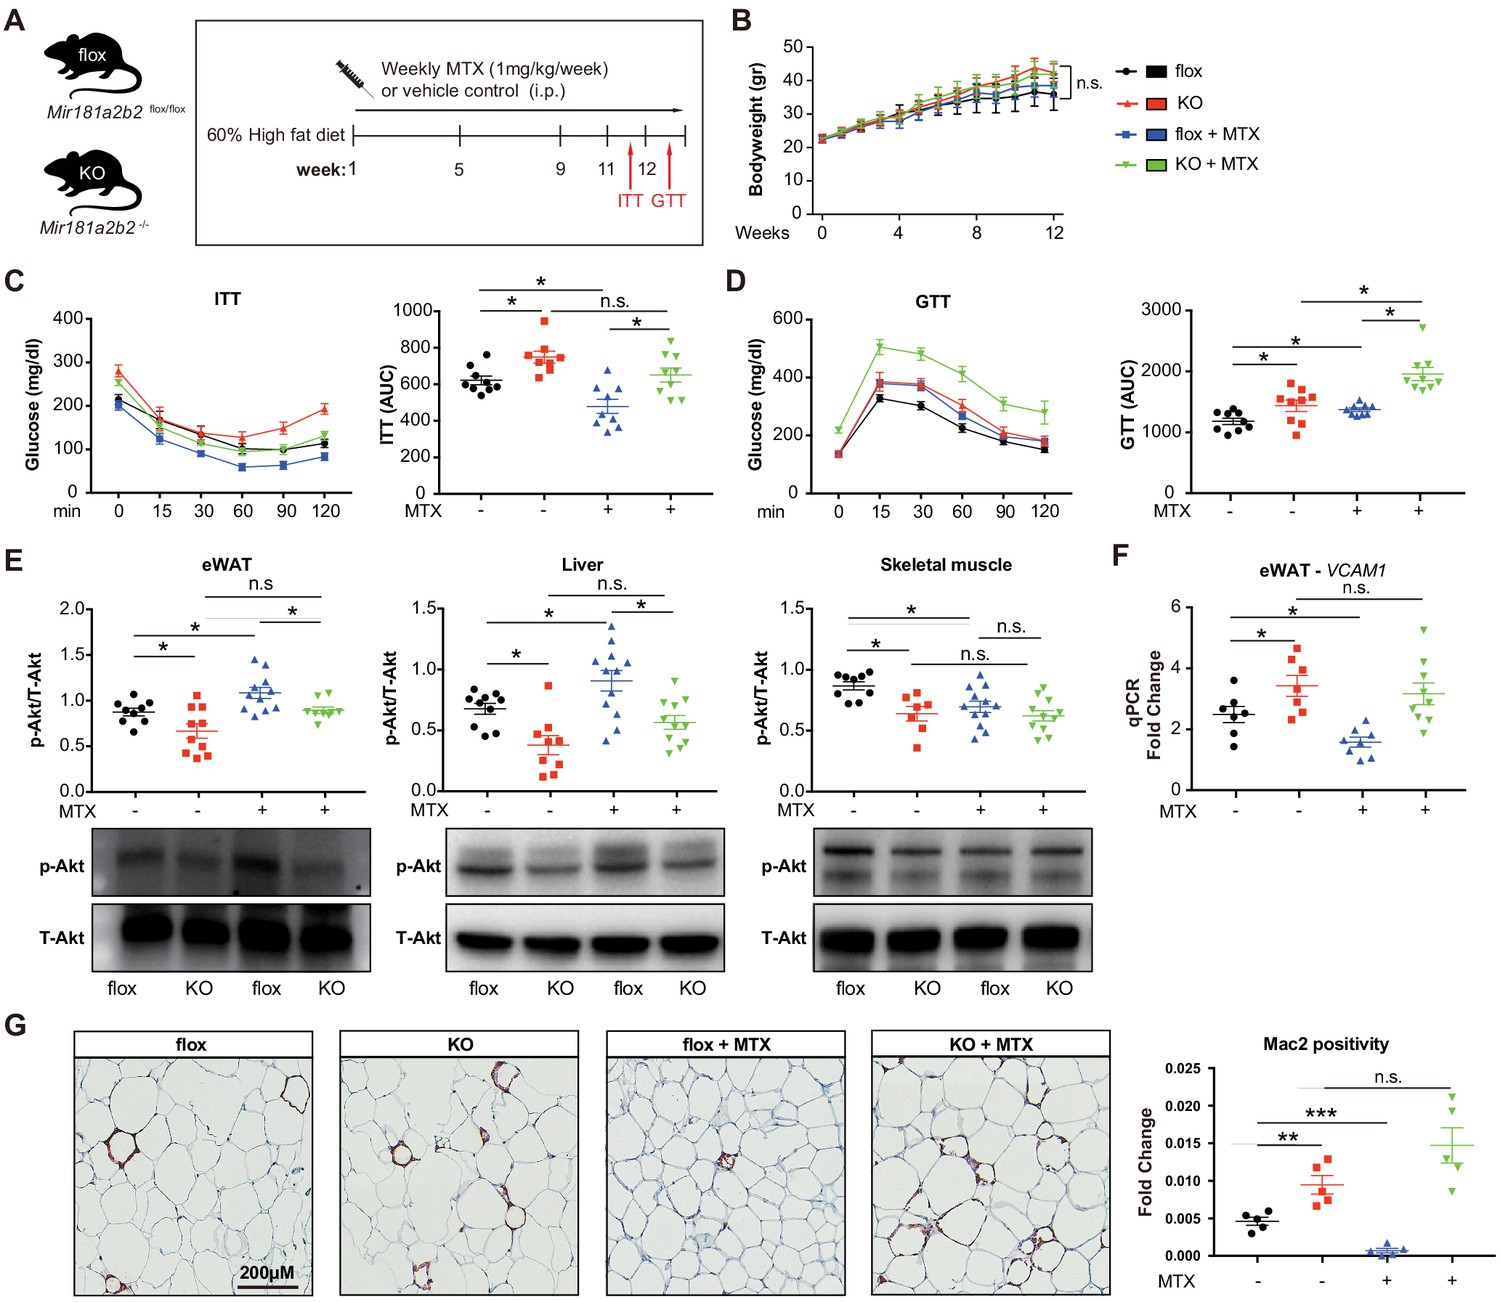
Systemic Mir181a2b2 KO blocks methotrexate (MTX)-mediated insulin sensitivity and visceral fat inflammation in diet-induced obesity.
(A) Schema of experimental procedure for Mir181a2b2 flox/flox (flox) and Mir181a2b2—/— (KO) mice that were placed on a 60% high-fat diet (HFD) for 12 weeks. Each group of mice was weekly i.p. injected with vehicle control or MTX (1 mg/kg). (B) Body weights were measured weekly. Blood glucose levels were measured at week 11 for (C) insulin tolerance testing (ITT) and on week 12 for (D) glucose tolerance testing (GTT) with calculated area under the curves (AUC), respectively. (E) Western blot analysis of Akt and pSer473-Akt in epididymal white adipose tissue (eWAT), liver, and skeletal muscle with quantification across n = 3 independent experiments. (F) Real-time qPCR analysis of VCAM-1 expression in eWAT. (B–F), n = 9–10 mice per group, one-way ANOVA. (G) Paraffin sections of eWAT were stained with Mac2 and the positive areas were quantified, n = 5 mice per group, one-way ANOVA. *p<0.05; **p<0.01; ***p<0.001. All values represent mean ± SEM.
Figure 4—figure supplement 1
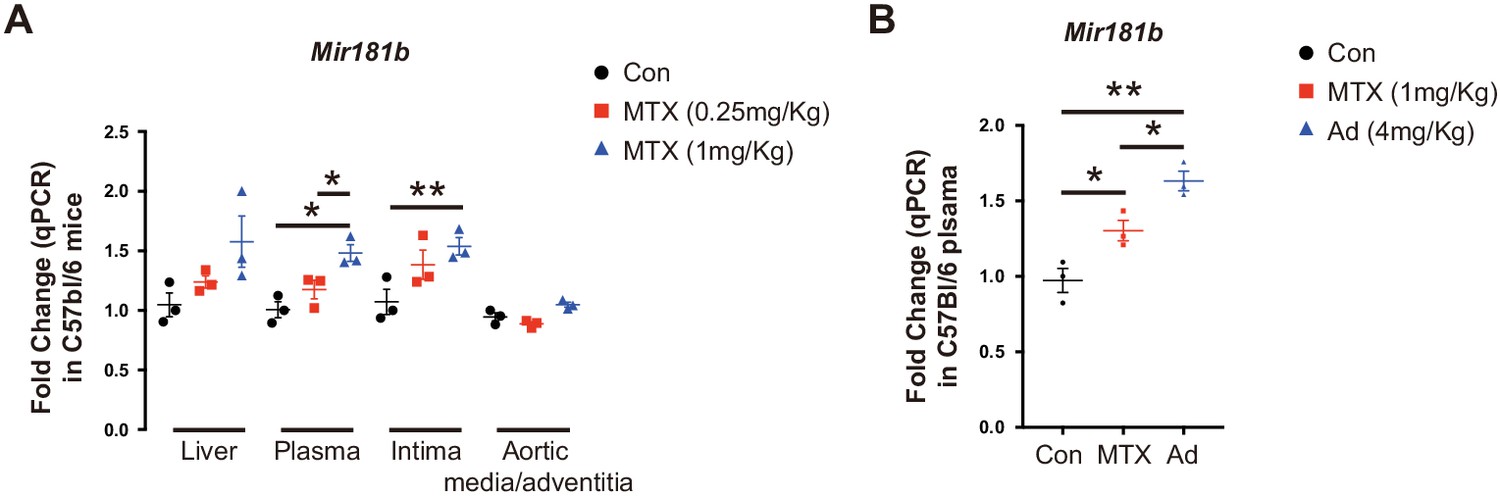
MTX and Ad increase Mir181b expression in the circulation and tissues.
(A) Real-time qPCR analysis of Mir181b expression in plasma, liver, intimal ECs, and aortic media from C57BL/6J mice that were tail vein injected with vehicle or MTX (0.25 mg/kg or 1 mg/kg) or (B) MTX or Ad for 3 hr. (A–B), n = 3 mice per group. *p<0.05, **p<0.01. All values represent mean ± SEM.
Figure 4—figure supplement 2
Gene set enrichment analyses of eWAT from MiR181a2b2 flex and KO mice.
Figure 5 with 3 supplements

Endothelial cell (EC)-specific Mir181a2b2 KO blocks methotrexate (MTX)-mediated insulin sensitivity and visceral fat inflammation in diet-induced obesity.
(A) Schema of experimental procedure for control Mir181a2b2flox/flox; VECad-Cre (flox-Cre) or tamoxifen injected EC-specific Mir181a2b2 KO (iEC-KO) mice that were placed on a 60% high-fat diet (HFD) for 15 weeks. Each group of mice was weekly i.p. injected with vehicle control or MTX (1 mg/kg). (B) Body weights over time of mice treated with vehicle or MTX, respectively. (C–D) ITT (C) and GTT (D) were measured and AUCs were quantified for each group. (E) Western blot analysis of Akt and pSer473-Akt in eWAT, liver, and skeletal muscle tissues. (F) Real-time qPCR analysis of VCAM-1 expression in eWAT. (G) Paraffin sections of eWAT were stained with Mac2 and the positive areas were quantified, n = 5 mice per group, one-way ANOVA. (B–G), n = 6 to 10 mice per group, one-way ANOVA. *p<0.05; **p<0.01; ***p<0.001. All values represent mean ± SEM.
Figure 5—figure supplement 1
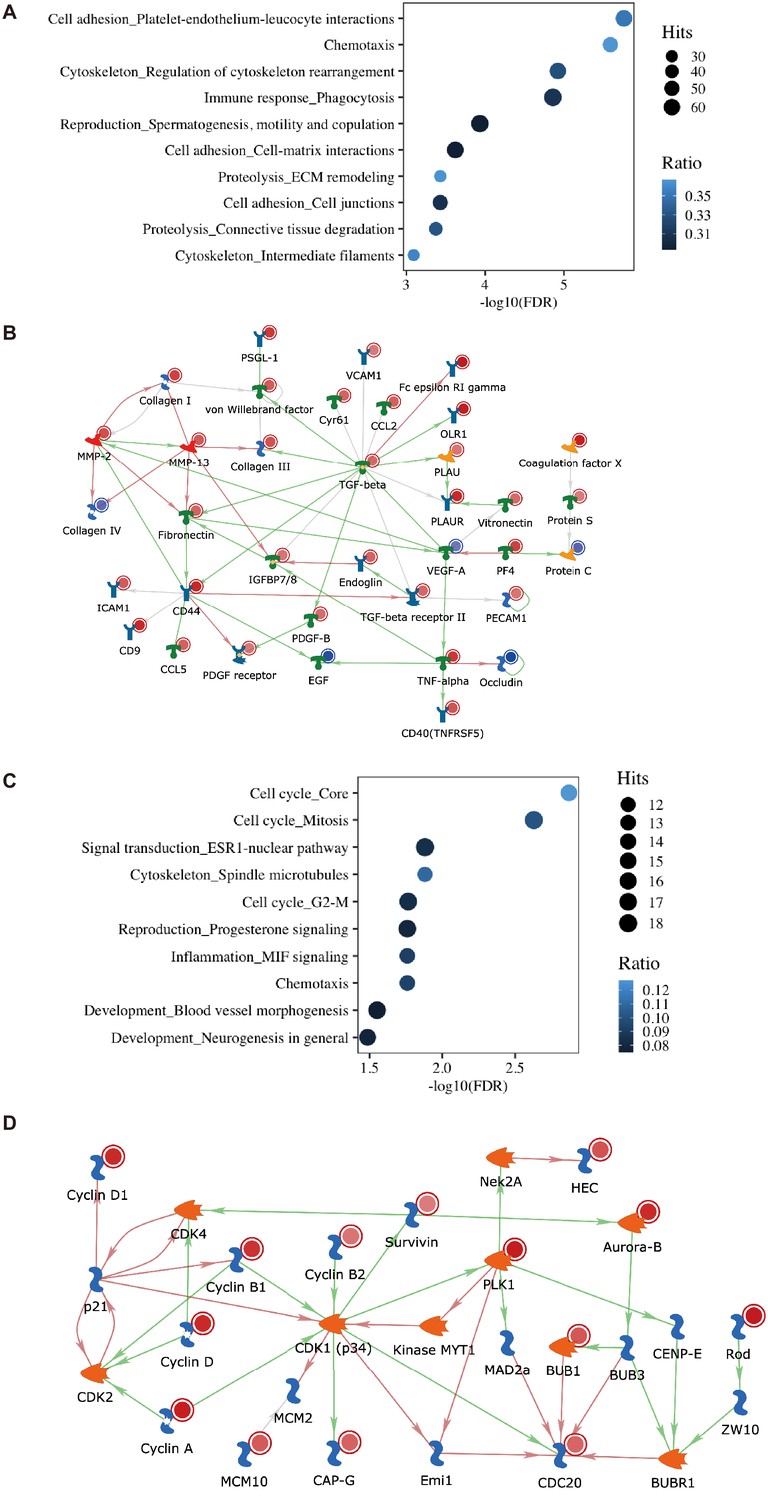
Transcriptomic changes in eWAT of systemic Mir181a2b2 KO mice in response to high-fat diet (HFD) and methotrexate (MTX).
(A) Gene set enrichment analysis after RNA-seq from eWAT of Mir181a2b2—/— (KO) compared to Mir181a2b2flox/flox (flox) mice placed on HFD diet for 12 weeks. (B) Gene network visualization of the top pathway for ‘Cell adhesion_Platelet-endothelium-leukocyte interactions’. (C) Gene set enrichment analysis after RNA-seq from eWAT of Mir181a2b2—/— (KO) compared to Mir181a2b2flox/flox (flox) mice placed on HFD and treatment with MTX for 12 weeks. (D) Gene network visualization of the top pathways for ‘Cell cycle’.
Figure 5—figure supplement 2

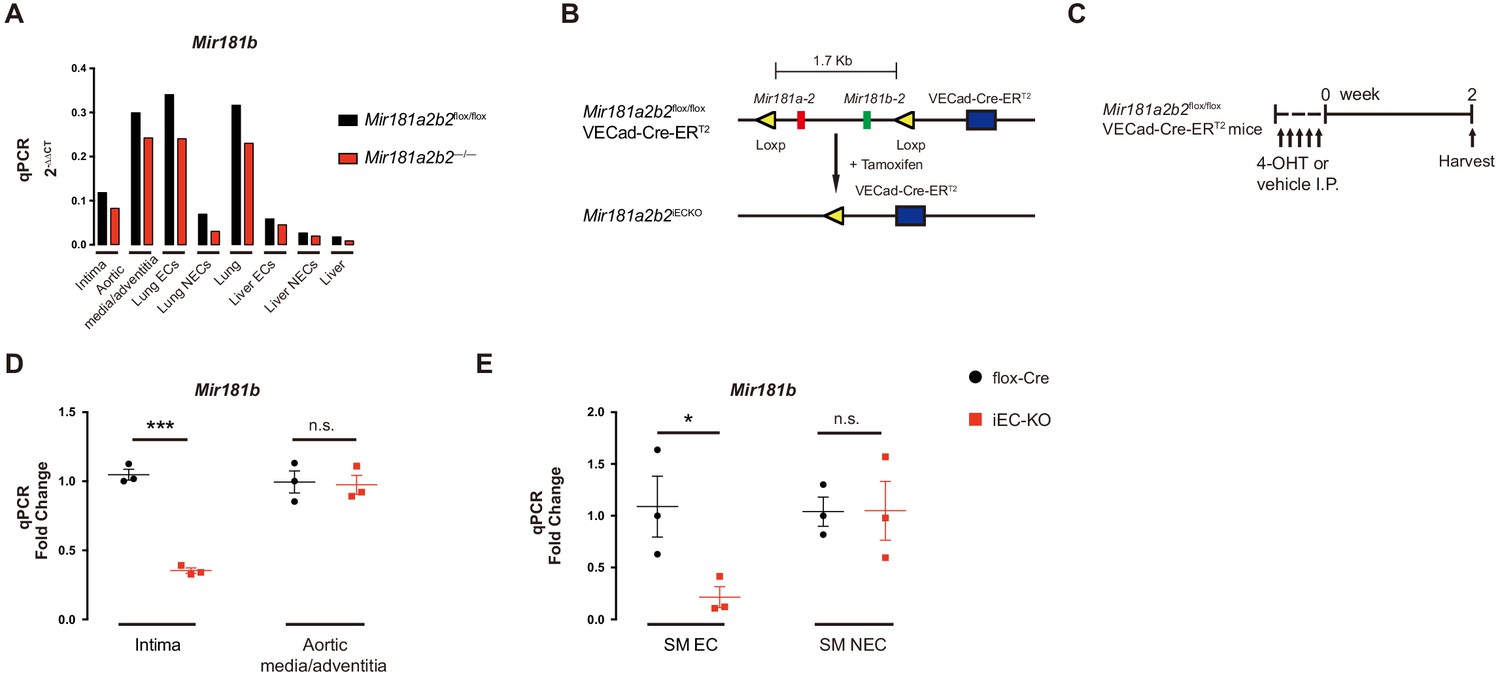
Breeding schema for creating endothelial-specific Mir181a2b2 KO mouse strain.
(A) Real-time qPCR analysis of Mir181b expression in different tissues from Mir181a2b2flox/flox and Mir181a2b2—/— mice. (B) Schema showing strategy to generate endothelial Mir181a2b2 knockout mice using tamoxifen (4-hydroxytamoxifen (4-OHT)). (C) Four-week-old male Mir181a2b2flox/flox; VECad-Cre-ERT2 mice were injected i.p. with corn oil vehicle control or 4-hydroxytamoxifen (4-OHT, 10 mg/kg) for 5 consecutive days before tissue expression of Mir181b was assessed at day 14. (D–E) Mir181b expression in intima and aortic media/adventitia (D) or in skeletal muscle (SM) ECs and non-ECs (NECs) isolated by CD31 beads (E). (A), n = 1. D and E, n = 3. *p<0.05, ***p<0.001. All values represent mean ± SEM.
Figure 5—figure supplement 3

Western blot analysis of SMADs expression in eWAT from high-fat diet (HFD)-fed flox-Cre and iEC-KO mice treated with or without methotrexate (MTX) for 12 weeks.
(A) Western blot analysis of Smad2, Smad3, and Smad4 expression in eWAT tissues from HFD-fed control flox-Cre and iEC-KO mice for 12 weeks. (B) Western blot analysis of Smad2, Smad3, and Smad4 expression in eWAT tissues from HFD-fed control flox-Cre and iEC-KO mice treated with MTX for 12 weeks. (A and B), n = 4 mice per group. **p<0.01. All values represent mean ± SEM.
Additional files
-
Supplementary file 1
MiR181a2b2 promoter sequences.
- https://cdn.elifesciences.org/articles/58064/elife-58064-supp1-v2.pdf
-
Supplementary file 2
Primer list.
- https://cdn.elifesciences.org/articles/58064/elife-58064-supp2-v2.pdf
-
Transparent reporting form
- https://cdn.elifesciences.org/articles/58064/elife-58064-transrepform-v2.pdf
Download links
A two-part list of links to download the article, or parts of the article, in various formats.
Downloads (link to download the article as PDF)
Open citations (links to open the citations from this article in various online reference manager services)
Cite this article (links to download the citations from this article in formats compatible with various reference manager tools)
Methotrexate attenuates vascular inflammation through an adenosine-microRNA-dependent pathway
eLife 10:e58064.
https://doi.org/10.7554/eLife.58064


