The role of Rif1 in telomere length regulation is separable from its role in origin firing
- Department of Molecular Biology and Genetics, Johns Hopkins University School of Medicine, United States
- Biochemistry, Cellular and Molecular Biology Graduate Program, Johns Hopkins University School of Medicine, United States
Figures
Figure 1 with 2 supplements
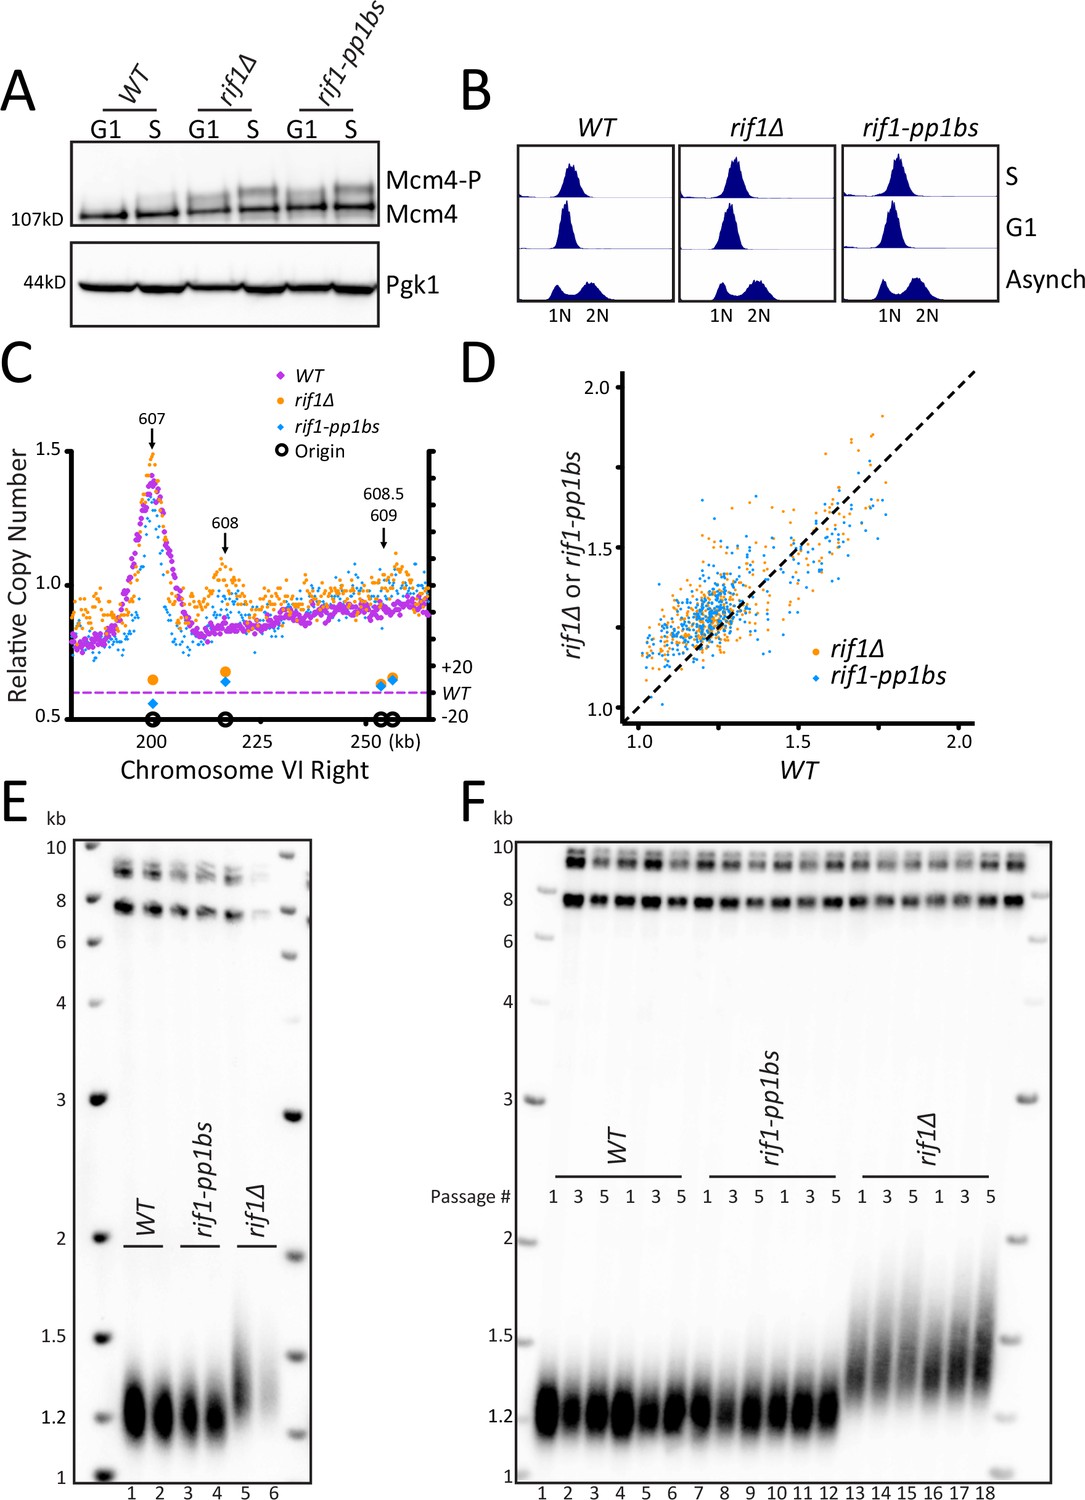
Disruption of Rif1 binding to PP1 activates origin firing but does not increase telomere length.
(A) WT, rif1∆, or rif1-pp1bs cells were arrested in G1 with alpha factor (G1) and then released into HU (S), and the level of Mcm4 phosphorylation was detected by western blot. Pgk1 is used as a loading control. (B) Cell cycle analysis of asynchronous, G1, and S phase arrested cells was measured using flow cytometry to follow DNA content. (C) The relative copy number of DNA sequences in S phase compared to G1 was plotted for the right arm of Chromosome VI. The X axis shows position across the chromosome, and normalized sequence read number is plotted on the left Y axis. The relative fraction of origins fired in rif1∆ or rif1-pp1bs is plotted on the right Y axis. WT is in purple, rif1∆ is in orange and rif1-pp1bs is in blue. Confirmed origins (from OriDB) are denoted on the X axis as open black circles. (D) The relative copy number for each of the confirmed OriDB origins in WT cells is plotted on the X axis and the relative copy number in rif1∆ (orange) or rif1-pp1bs (blue) is plotted on the Y axis. The relative copy number for each origin is scaled by 1.25 to account for expected copy number change during early S phase. (E) Southern blot showing telomere length of indicated strains. (F) Southern blot of indicated strains passaged in liquid culture for five passages.
Figure 1—figure supplement 1
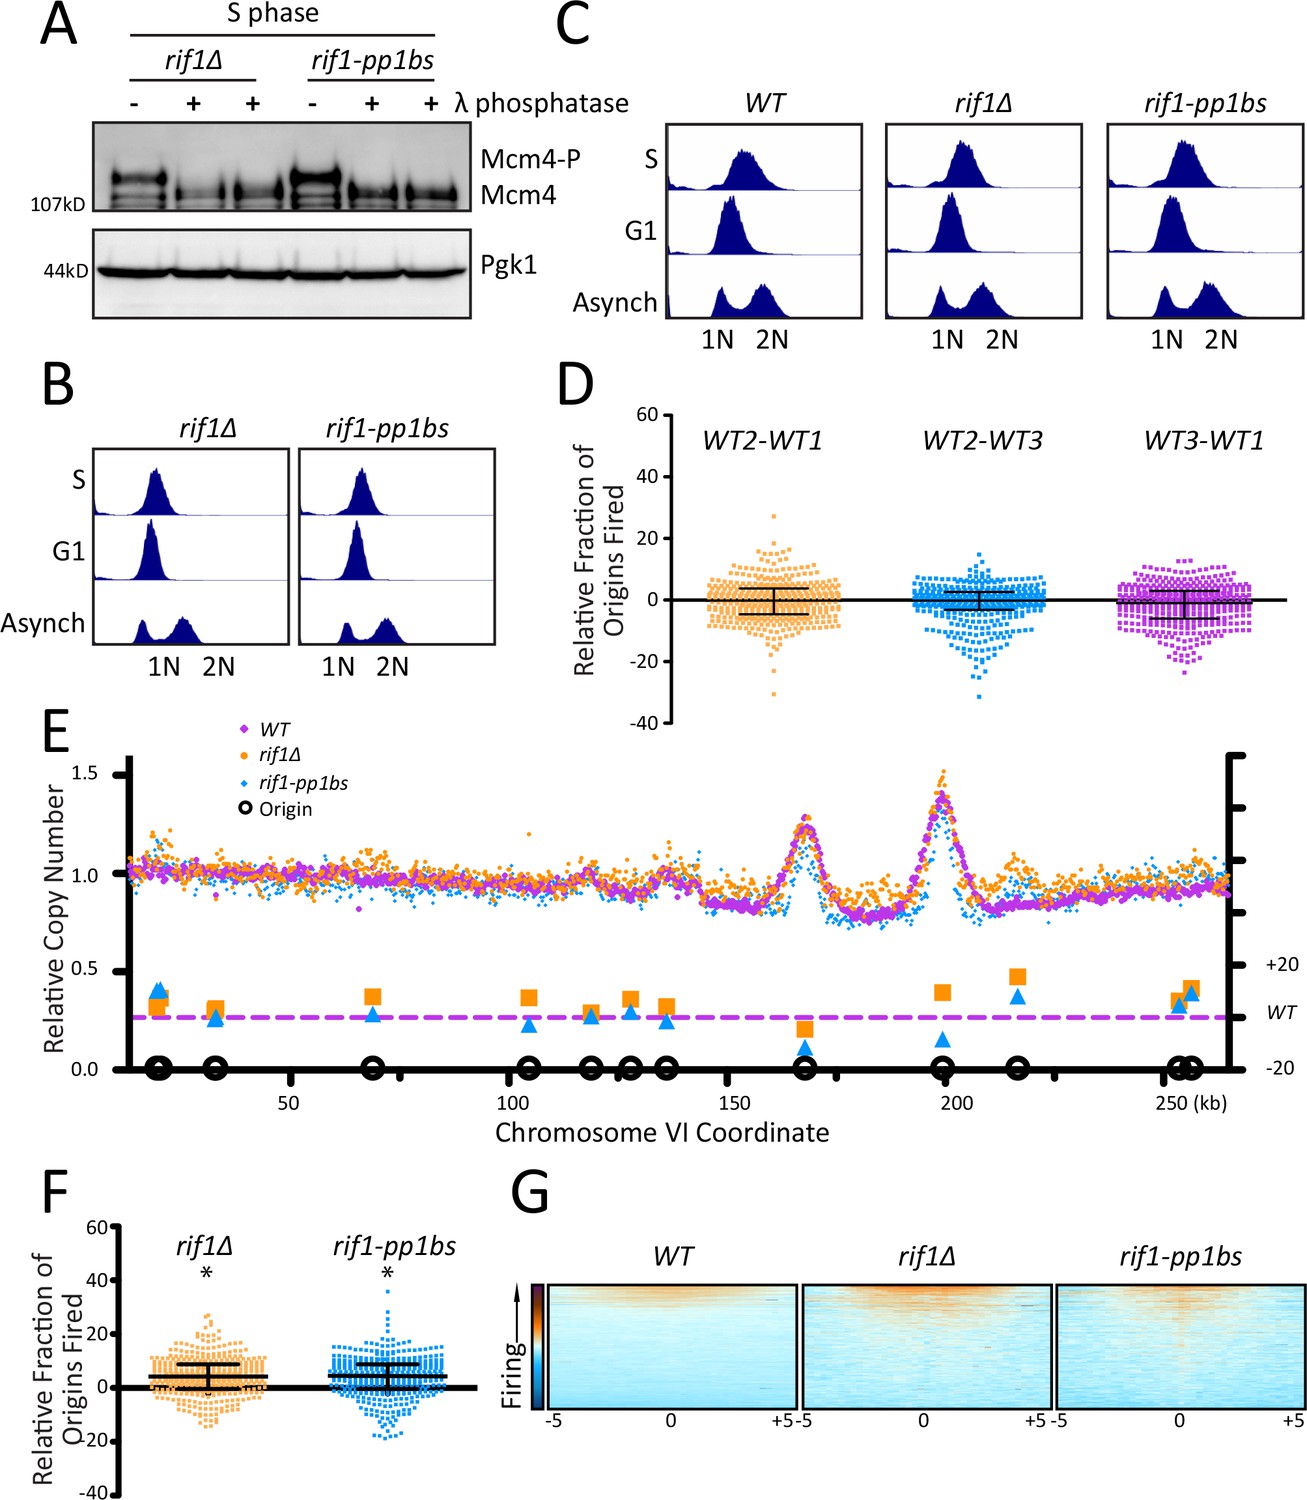
Disruption of Rif1 binding to PP1 activates origin firing across the genome.
(A) Phosphatase treatment of Mcm4. rif1∆ or rif1-pp1bs cells were arrested with alpha factor (G1) and then released into HU (S). Protein lysate from S phase samples was subjected to lambda phosphatase treatment, and the level of the Mcm4 shifted band was detected by western. (B) Cell cycle analysis of asynchronous, G1, and S phase arrested cells for phosphatase experiment shown in A. (C) Cell cycle analysis of asynchronous, G1, and S phase from Figure 1A was measured using flow cytometry. (D) The relative copy number for 1 kb around the midpoint of each origin was calculated for three WT strains: WT1, WT2 and WT3. For each peak, the WT value from one sequencing run was subtracted from the WT value of an independent run and multiplied by 100. Median and interquartile range are plotted over the distribution, and one-sided Wilcoxon signed rank test used to test significance: WT2-WT1 (p=0.8887), WT2-WT3 (p=1) and WT1-WT3 (p=0.9765), indicating the origin firing in the WT strains are comparable between experiments. (E) Relative copy number for the entire Chromosome VI is shown. WT is in purple, rif1∆ is in orange, and rif1-pp1bs is in blue, relating to Figure 1C. (F) The relative copy number for 1 kb around the midpoint of each origin was calculated for rif1∆ or rif1-pp1bs. For each peak, the WT value was subtracted from mutant value and multiplied by 100. A positive value indicates more origins fired in the population in the mutant compared to WT. Median and interquartile range are plotted over the distribution, and * indicates a significant difference by one-sided Wilcoxon signed rank test: rif1∆ (p<0.0001) and rif1-pp1bs (p<0.0001). (G) Heatmap of relative copy number for 10 kb region centered at each OriDB origin. Orange indicates high copy number and blue indicates low copy number. Origins sorted based on highest copy number to lowest copy number.
Figure 1—figure supplement 2
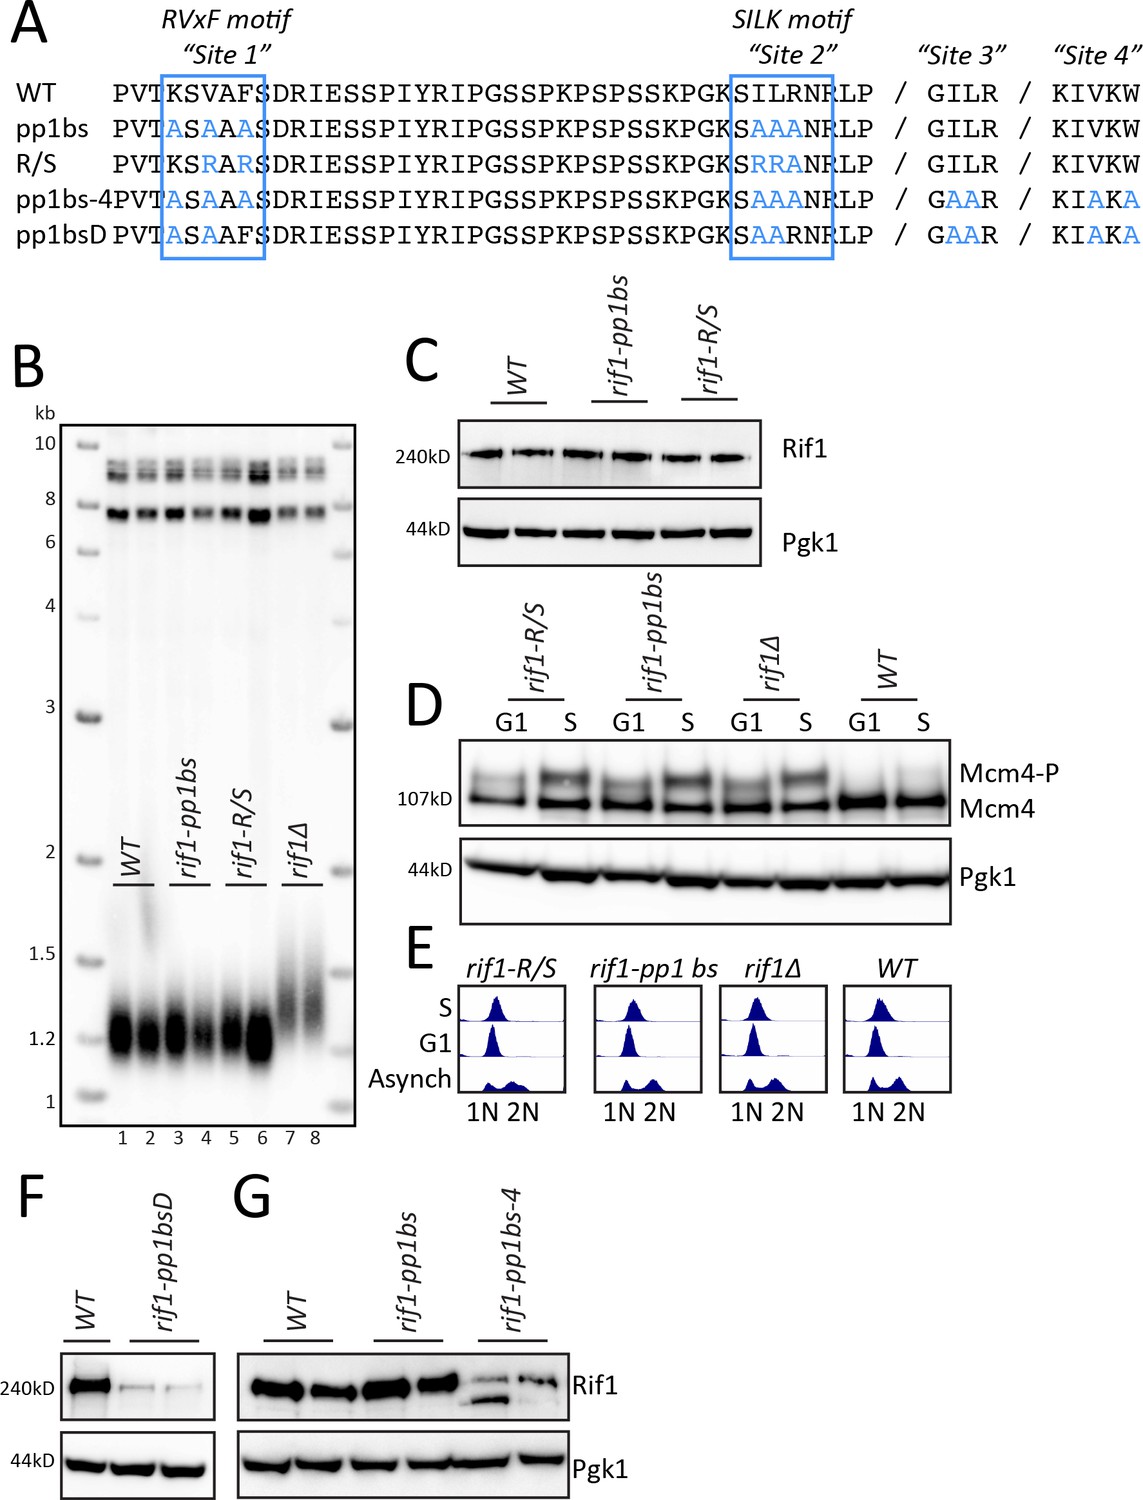
rif1-pp1bs gives similar results to the mutation rif1-R/S (Mattarocci et al., 2014).
(A) Sequence comparison of our rif1-pp1bs mutant to the Shore lab rif1-R/S mutant and Donaldson lab rif1-pp1bsD mutant. (B) Southern blot analysis of telomere length of strains indicated. (C) Western blot with WT, rif1-pp1bs and rif1-R/S mutants generated in our lab. (D) Mcm4 phosphorylation levels of rif1-R/S, rif1-pp1bs, rif1∆, or WT. Cells were arrested in G1 with alpha factor (G1) and then released into HU (S); the level of phosphorylation of Mcm4 was detected by western. (E) The DNA content of the arrested cells for D was measured using flow cytometry. (F) Western blot to measure rif1-pp1bsD protein levels in ASy26 (WT), SMKy30 (rif1-pp1bsD), and SMKy31 (rif1-pp1bsD) strains sent from Donaldson lab. (G) Rif1 protein levels were measured by western blot for Rif1 and rif1-pp1bs compared to a rif1-pp1bs-4 site that we generated.
Figure 2 with 1 supplement
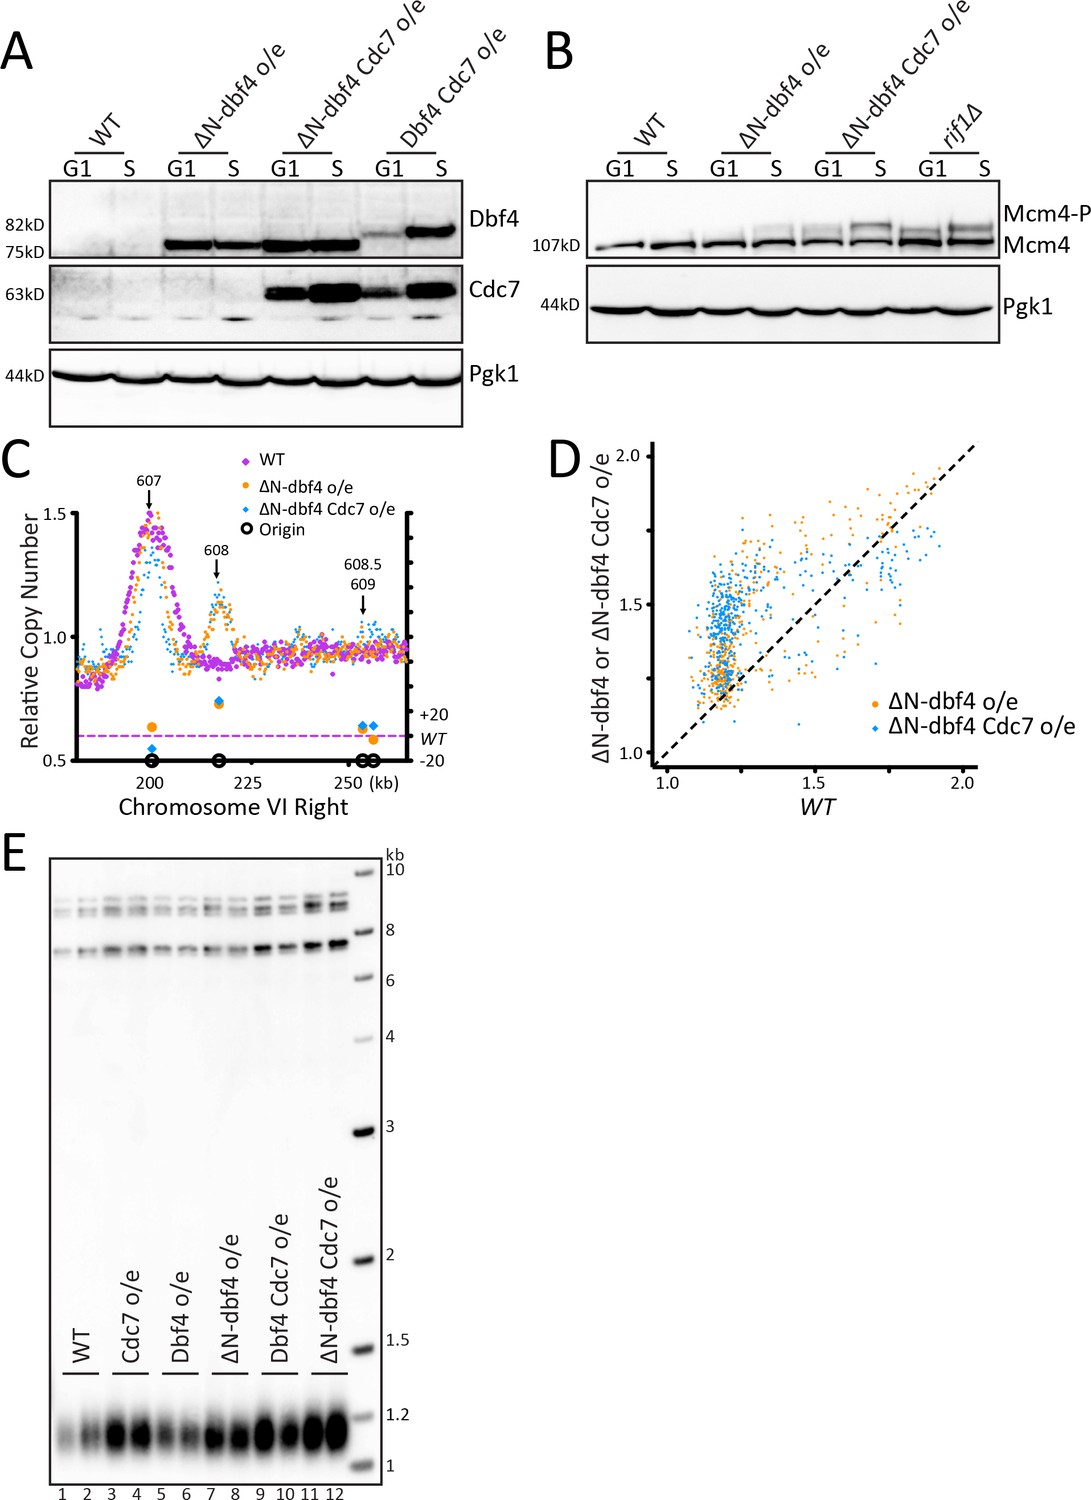
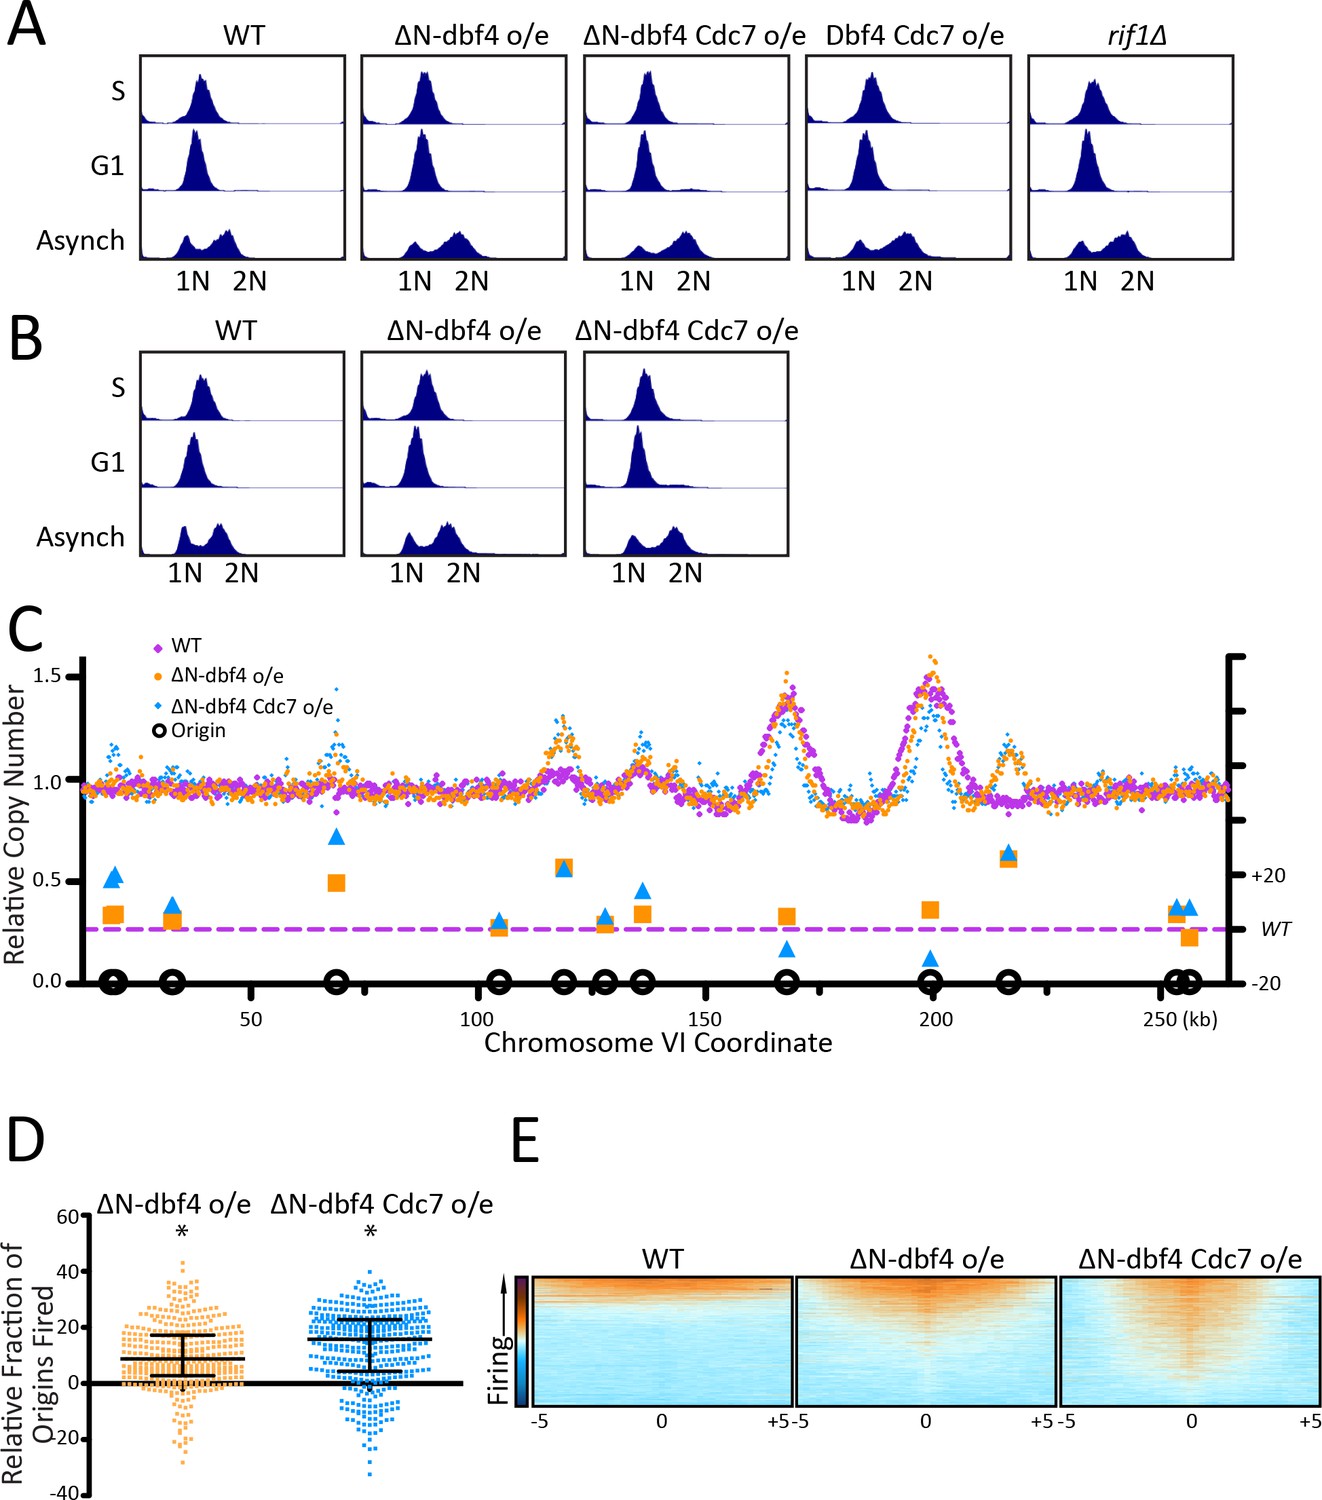
Increasing origin activation by DDK overexpression does not increase telomere length.
(A) Western blot detecting the level of Dbf4 and Cdc7 in WT cells and cells overexpressing ∆N-dbf4, both ∆N-dbf4 and Cdc7, or both Dbf4 and Cdc7 (DDK) arrested in G1 or S. (B) The samples shown in A were probed on a western blot to detect Mcm4 phosphorylation levels. (C) The relative copy number of DNA sequences in S phase compared to G1 was plotted for the right arm of Chromosome VI, as in Figure 1C. WT is in purple, ∆N-dbf4 o/e is in orange and ∆N-dbf4 Cdc7 o/e is in blue. (D) For each of the confirmed OriDB origins, relative copy number for that given origin in WT cells is plotted on the X axis and the relative copy number in ∆N-dbf4 o/e (orange) or ∆N-dbf4 Cdc7 o/e (blue) is plotted on the Y axis, as in Figure 1D. (E) Southern blot analysis of telomere length of strains indicated.
Figure 2—figure supplement 1
DDK overexpression increases origin activation across the genome.
(A) The DNA content of the arrested cells in Figure 2A and B was measured using flow cytometry. (B) The DNA content of the arrested cells in Figure 2C was measured using flow cytometry. (C) Relative copy number for the entire Chromosome VI is shown. WT is in purple, ∆N-dbf4 o/e is in orange, and ∆N-dbf4 Cdc7 o/e is in blue, relating to Figure 2C. (D) The relative copy number for 1 kb around the midpoint of each origin was calculated for each strain. WT is in purple, ∆N-dbf4 o/e is in orange, and ∆N-dbf4 Cdc7 o/e is in blue. For each peak, the WT value was subtracted from the value of the over-expression strain and multiplied by 100. Median and interquartile range are plotted over the distribution, and * indicates a significant difference by one-sided Wilcoxon signed rank test: N-dbf4 o/e (p<0.0001) and ∆N-dbf4 Cdc7 o/e (p<0.0001). (E) Heatmap of relative copy number for 10 kb region centered at each OriDB origin. Orange indicates high copy number and blue indicates low copy number. Origins sorted based on highest copy number to lowest copy number.
Figure 3 with 1 supplement
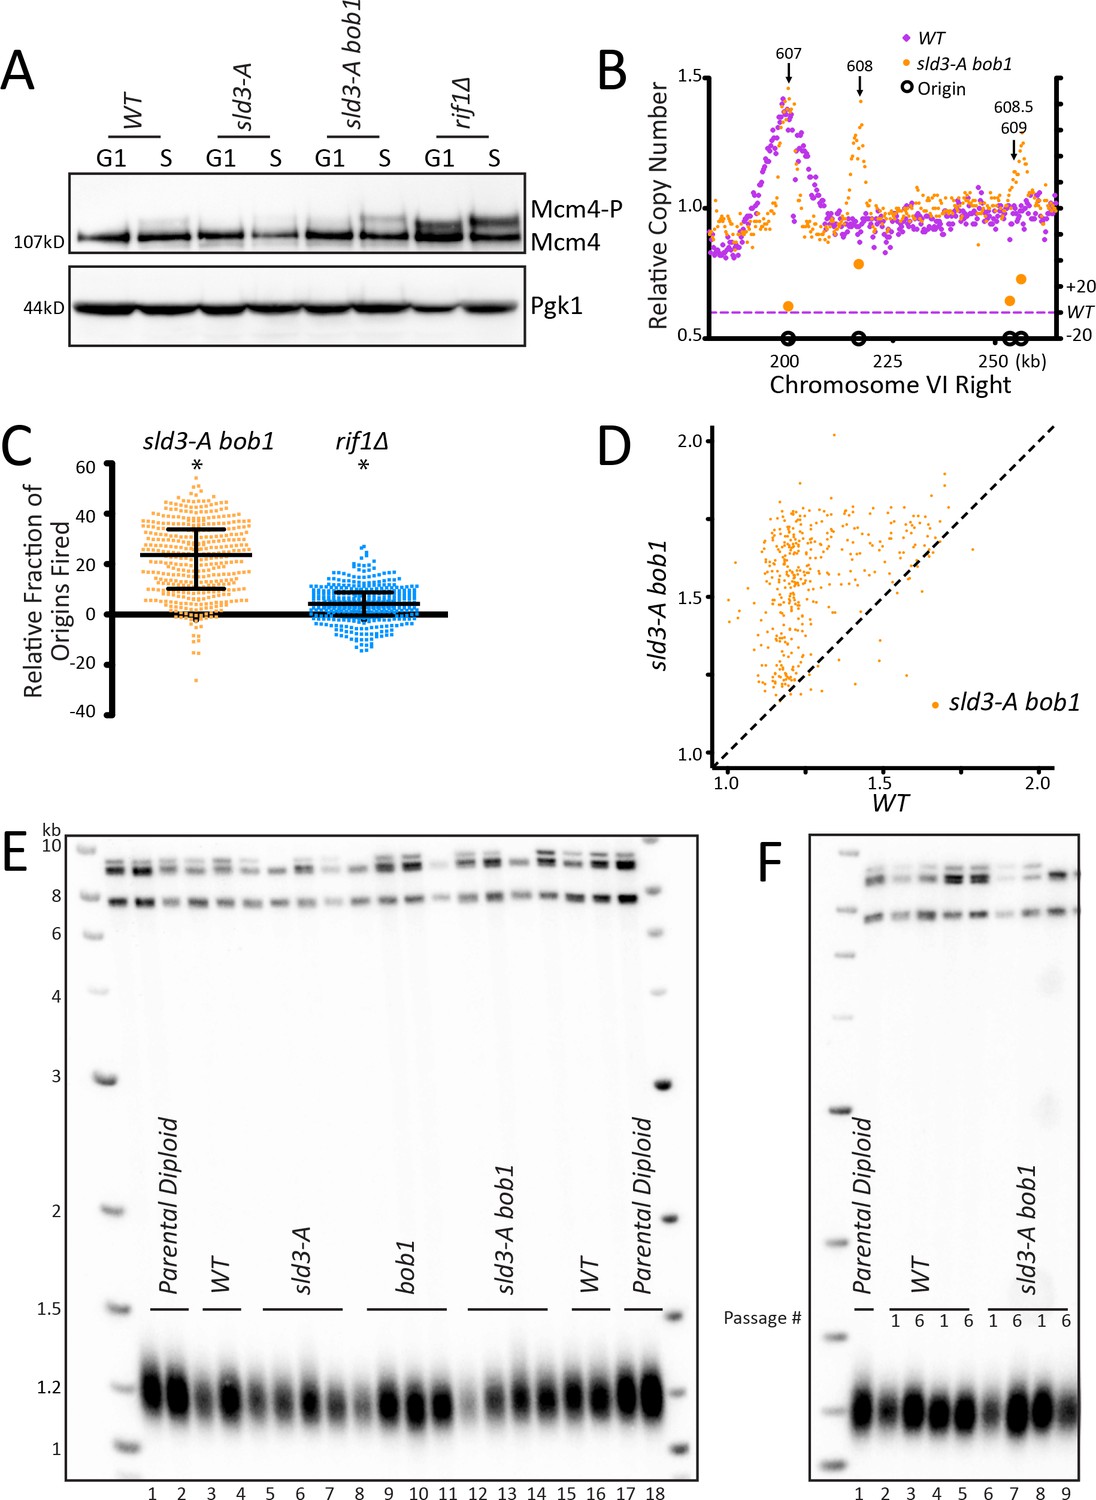
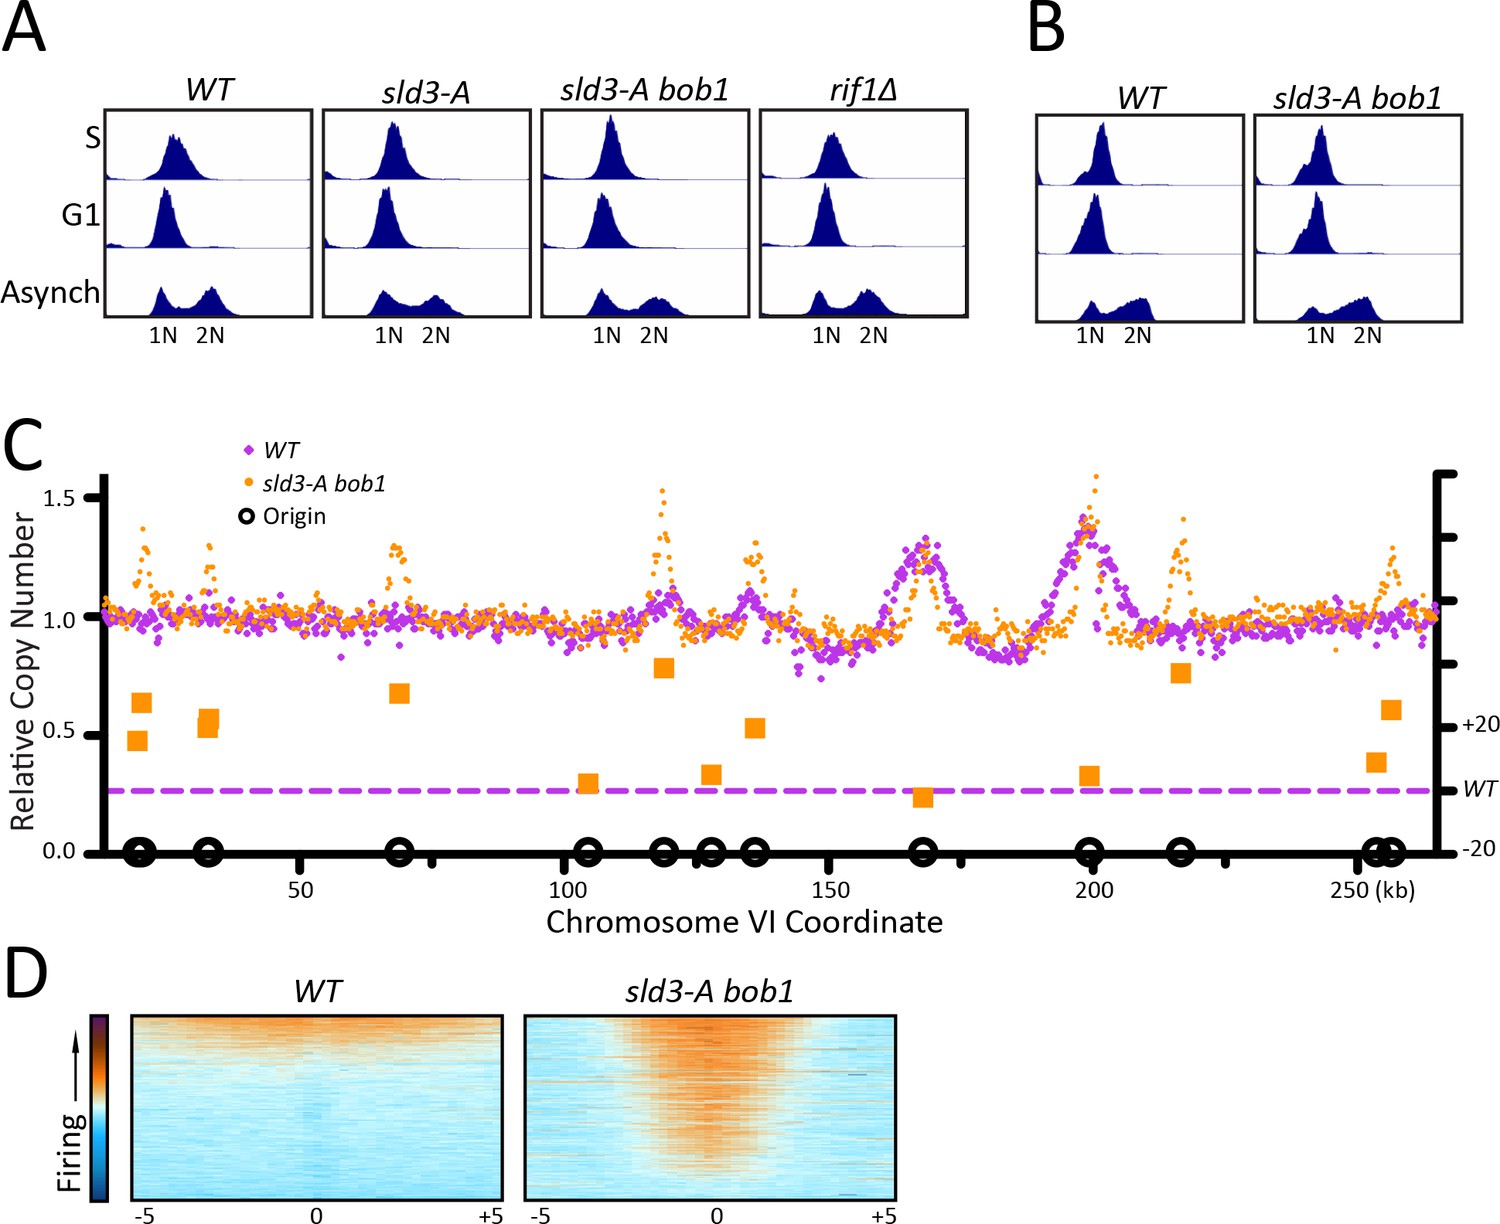
Increasing origin activation using mutations in the pre-RC does not increase telomere length.
(A) WT, sld3-A, sld3-A bob1, and rif1∆ cells were arrested with alpha factor (G1) and then released into HU (S), and the level of phosphorylation of Mcm4 was detected by western. (B) The relative copy number of DNA sequences in S phase compared to G1 was plotted for the right arm of Chromosome VI as indicated in Figure 1C. WT is in purple and sld3-A bob1 is in orange. (C) The relative copy number for 1 kb around the midpoint of each origin was calculated for each strain. For each peak, the WT value was subtracted from mutant value and multiplied by 100. A positive value indicates more origins fired in the population in the mutant compared to WT. Median and interquartile range are plotted over the distribution, and * indicates a significant difference by one-sided Wilcoxon signed rank test: sld3-A bob1 (p<0.0001) and rif1∆ (p<0.0001). (D) For each of the confirmed OriDB origins, relative copy number for that given origin in WT cells is plotted on the X axis and in sld3-A bob1 (orange) is plotted on the Y axis, as in Figure 1D. (E) Southern blot analysis of telomere length of strains indicated. (F) Southern blot of strains passaged in liquid culture for six passages.
Figure 3—figure supplement 1
Mutations in the pre-RC increase origin activation across the genome.
(A) The DNA content of the arrested cells in Figure 3A was measured using flow cytometry. (B) The DNA content of the arrested cells in Figure 3B was measured using flow cytometry. (C) Relative copy number for the entire Chromosome VI is shown. WT is in purple and sld3-A bob1 is in orange, relating to Figure 3B. (D) Heatmap of relative copy number for 10 kb region centered at each OriDB origin. Orange indicates high copy number and blue indicates low copy number. Origins sorted based on highest copy number to lowest copy number.
Figure 4 with 1 supplement
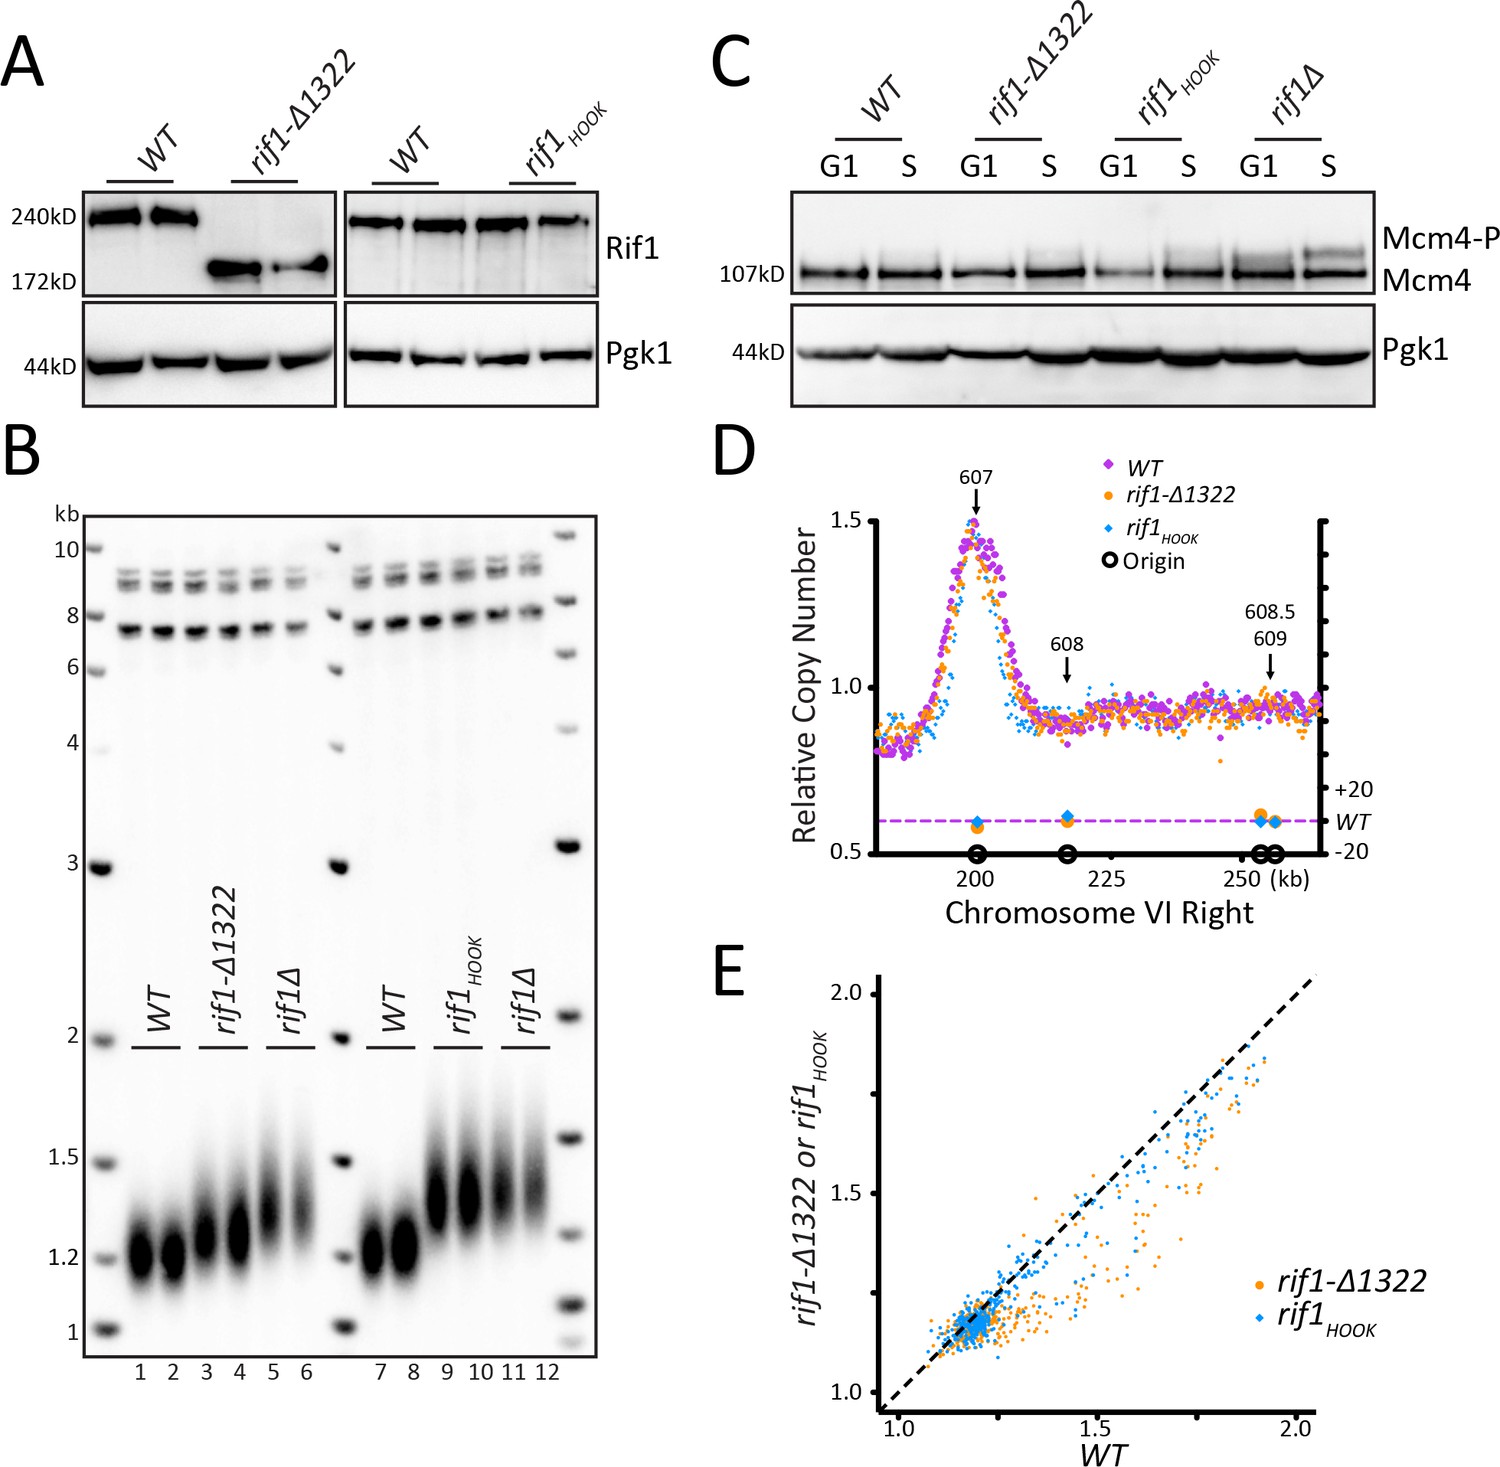
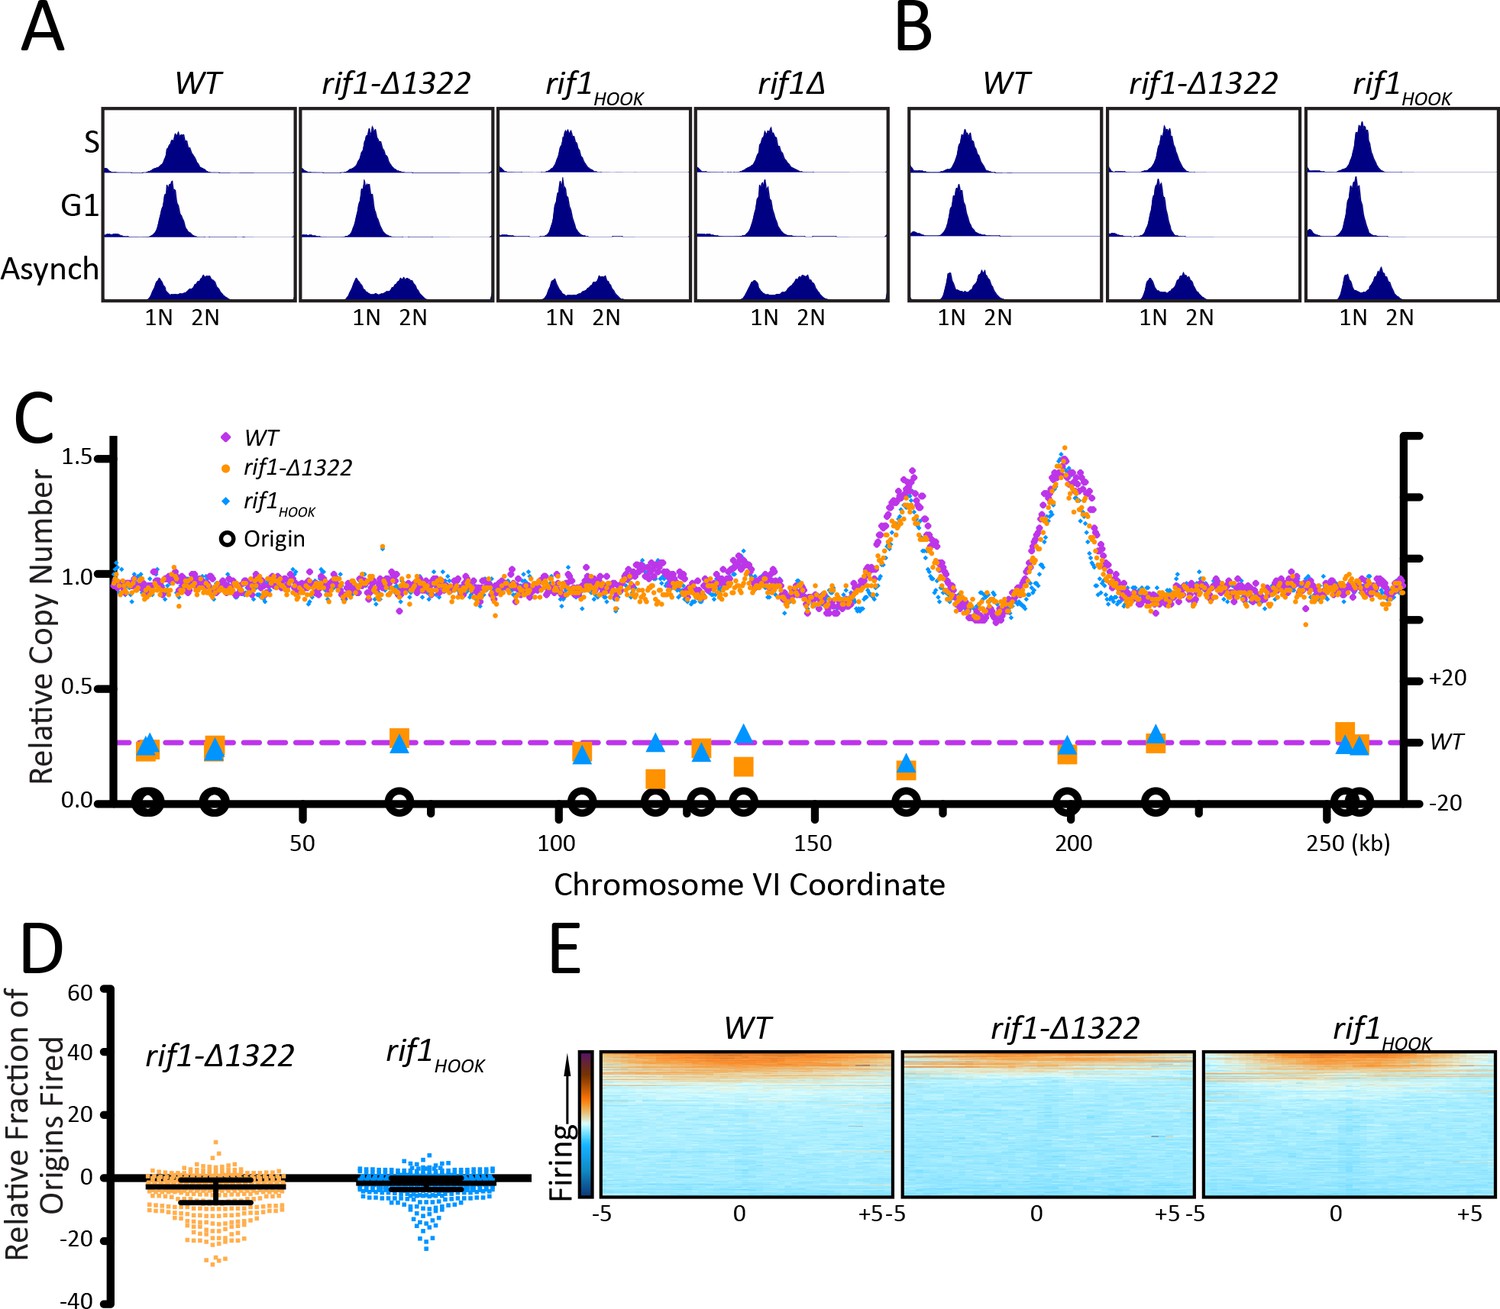
Mutations in Rif1 that increase telomere length do not affect origin firing.
(A) Rif1 protein levels measured by western blot for WT, rif1-∆1322, and rif1HOOK. (B) Southern blot analysis of telomere length of strains indicated. (C) WT, rif1-∆1322, rif1HOOK, and rif1∆ cells were arrested with alpha factor (G1) and then released into HU (S), and the level of phosphorylation of Mcm4 was detected by western. (D) The relative copy number of DNA sequences in S phase compared to G1 was plotted for the right arm of Chromosome VI, as in Figure 1C. WT is in purple, rif1-∆1322 is in orange, and rif1HOOK is in blue. (E) For each of the confirmed OriDB origins, relative copy number for that given origin in WT cells is plotted on the X axis and the copy number in rif1-∆1322 (orange) or rif1HOOK (blue) is plotted on the Y axis, as in Figure 1D.
Figure 4—figure supplement 1
Mutations in Rif1 that increase telomere length do not affect origin firing across the genome.
(A) The DNA content of the arrested cells in Figure 4C was measured using flow cytometry. (B) The DNA content of the arrested cells in Figure 4D was measured using flow cytometry. (C) Relative copy number for the entire Chromosome VI is shown. WT is in purple, rif1-∆1322 is in orange, and rif1HOOK is in blue, relating to Figure 4D. (D) The relative copy number for 1 kb around the midpoint of each origin was calculated for each strain. For each peak, the WT value was subtracted from RIF1 mutant value and multiplied by 100. Median and interquartile range are plotted over the distribution, and one-sided Wilcoxon signed rank test used to test significance: rif1-∆1322 (p=1) and rif1HOOK (p=1). (E) Heatmap of relative copy number for 10 kb region centered at each OriDB origin. Orange indicates high copy number and blue indicates low copy number. Origins are sorted based on highest copy number to lowest copy number.
Tables
Key resources table
| Reagent type (species) or resource | Designation | Source or reference | Identifiers | Additional information |
|---|---|---|---|---|
| Strain, strain background (Saccharomyces cerevesiae) | Saccharomyces cerevisiae, CVy61 (W303-1a) | doi:10.1002/yea.1406 | ||
| Gene (Saccharomyces cerevesiae) | RIF1 | NA | YBR275C | |
| Gene (Saccharomyces cerevesiae) | DBF4 | NA | YDR052C | |
| Gene (Saccharomyces cerevesiae) | CDC7 | NA | YDL017W | |
| Gene (Saccharomyces cerevesiae) | MCM4 | NA | YPR019W | |
| Gene (Saccharomyces cerevesiae) | MCM5/mcm5-bob1 | gift from John Diffley: doi: 10.1038/nature09373 | YLR274W | |
| Gene (Saccharomyces cerevesiae) | SLD3/sld3-A | gift from John Diffley: doi: 10.1038/nature09373 | YGL113W | |
| Antibody | anti-FLAG (mouse monoclonal) | Sigma-Aldrich | Sigma-Aldrich:F3165; RRID:AB_259529 | (1:1000) |
| Antibody | anti-V5 (mouse monoclonal) | Thermo Fisher Scientific | Thermo:R960-25; RRID:AB_2556564 | (1:2000) |
| Antibody | anti-HA (mouse monoclonal) | Sigma-Aldrich (Roche) | Sigma-Aldrich:11583816001; RRID:AB_514505 | (1:3000) |
| Antibody | anti-MYC (mouse monoclonal) | Santa Cruz Biotechnology | Santa Cruz:sc-40; RRID:AB_627268 | (1:3000) |
| Antibody | anti-PGK1 (mouse monoclonal) | Thermo Fisher Scientific | Thermo:459250; RRID:AB_2532235 | (1:10000) |
| Antibody | anti-Mouse IgGHRP (horse) | Cell Signaling Technology | Cell Signaling:7076; RRID:AB_330924 | (1:10000) |
| Chemical compound, drug | Hydroxyurea | US Biological | US Biological: H9120 | 200 mM |
| Chemical compound, drug | Alpha Factor | Sigma or US Biological | Sigma:T6901; US Biological:Y2016 | 25 ng/ml for bar1∆, 8 µg/ml +6 µg/ml for BAR1 |
| Chemical compound, drug | Sytox Green | Invitrogen | Invitrogen:S7020 | 0.5 µl/ml (2.5 µM final) |
| Software, algorithm | FlowJo 10.6.1 | https://www.flowjo.com | RRID:SCR_008520 | |
| Software, algorithm | Adobe Illustrator CS6 | https://www.adobe.com/products/illustrator.html | RRID:SCR_010279 | |
| Software, algorithm | GE Healthcare Life Sciences ImageQuant v8.1 | https://www.gelifesciences.com/en/us/shop/protein-analysis/molecular-imaging-for-proteins/imaging-software/imagequant-tl-8-1-p-00110 | RRID:SCR_018374 | |
| Software, algorithm | GraphPad Prism 5 | www.graphpad.com | RRID:SCR_002798 | |
| Software, algorithm | RStudio 1.2.1335 | www.rstudio.com/ | RRID:SCR_000432 | heatmap.2 https://www.rdocumentation.org/packages/gplots/versions/3.0.3/topics/heatmap.2 |
| Software, algorithm | SnapGene 5.0.8 | www.snapgene.com | RRID:SCR_015052 | |
| Software, algorithm | CellQuest Pro 5.2.1 | https://www.bdbiosciences.com/documents/15_cellquest_prosoft_analysis.pdf | RRID:SCR_014489 | |
| Software, algorithm | Bedtools Multicov | https://bedtools.readthedocs.io/en/latest/ | RRID:SCR_006646 | doi: 10.1002/0471250953.bi1112s47 |
| Software, algorithm | Samtools | http://www.htslib.org | RRID:SCR_002105 | |
| Software, algorithm | BWA-MEM | https://github.com/lh3/bwa | RRID:SCR_010910 | |
| Software, algorithm | Picard MarkDuplicates | https://broadinstitute.github.io/picard/ | RRID:SCR_006525 | |
| Strains | All strains | Supplementary file 1 | ||
| Recombinant DNA reagent | All plasmids | Supplementary file 1 | ||
| Sequence based reagent | All primers and oligos | Supplementary file 1 | ||
| Cloning reagents | Cells and restriction enzymes | Supplementary file 1 |
Additional files
-
Source code 1
Copy number seq analysis.
- https://cdn.elifesciences.org/articles/58066/elife-58066-code1-v2.zip
-
Supplementary file 1
Strains, oligos, plasmids, and cloning strategies.
- https://cdn.elifesciences.org/articles/58066/elife-58066-supp1-v2.xlsx
-
Supplementary file 2
BedGraphs from Copy Number Seq analysis of normalized S to G1 250 bp coverage.
- https://cdn.elifesciences.org/articles/58066/elife-58066-supp2-v2.xlsx
-
Supplementary file 3
Sequencing analysis including confirmed OriDB origins, explanation of how relative copy number scores were computed, and matrices used to generate heatmaps.
- https://cdn.elifesciences.org/articles/58066/elife-58066-supp3-v2.xlsx
-
Transparent reporting form
- https://cdn.elifesciences.org/articles/58066/elife-58066-transrepform-v2.docx
Download links
A two-part list of links to download the article, or parts of the article, in various formats.
Downloads (link to download the article as PDF)
Open citations (links to open the citations from this article in various online reference manager services)
Cite this article (links to download the citations from this article in formats compatible with various reference manager tools)
The role of Rif1 in telomere length regulation is separable from its role in origin firing
eLife 9:e58066.
https://doi.org/10.7554/eLife.58066


