Topologically correct synthetic reconstruction of pathogen social behavior found during Yersinia growth in deep tissue sites
- Department of Molecular Biology and Microbiology, Tufts University Graduate School of Biomedical Sciences, United States
- Graduate Program in Molecular Microbiology, Tufts University Graduate School of Biomedical Sciences, United States
- Department of Biology, Boston College, United States
- W. Harry Feinstone Department of Molecular Microbiology and Immunology Johns Hopkins Bloomberg School of Public Health, United States
- Tufts University School of Medicine, United States
Figures
Figure 1
Droplet gels support clonal growth of Yersinia pseudotuberculosis.
(A) Y. pseudotuberculosis was added to molten agarose/HyStem-C Hydrogel and introduced into a microfluidics device, allowing encapsulation within oil-coated droplets (Materials and methods). Oil was removed from the droplets and bacteria were cultured in situ within the droplets (Thibault et al., 2019). (B) Design of the microfluidics device. Noted are oil and aqueous (molten gel/bacteria mixture) phase inlets (red and blue arrows, respectively). Droplets were collected into a tube at the droplet output (black arrow) (Thibault et al., 2019). (C) Distribution of droplet sizes prior to oil removal. Droplet size was determined by capturing images from phase contrast microscopy followed by image processing (Materials and methods). (D, E) Droplets largely contain one or two bacterial cells immediately after encapsulation. (D) Image of droplets containing Y. pseudotuberculosis gfp+. (E) Presence of bacteria was scored immediately after encapsulation by phase contrast and fluorescence microscopy, scoring for GFP. (F) Y. pseudotuberculosis grows within colonies in droplets. Droplets containing encapsulated Y. pseudotuberculosis were cultured at 26°C, and microcolonies were visualized at indicated timepoints by phase contrast and fluorescence microscopy. Microcolony areas were determined by image analysis (Materials and methods). Each timepoint is median + / - 95% confidence interval (CI) of 3 biological replicates of 50 microcolonies. (G) Representative images of microcolonies from (F) at the noted times visualized by phase contrast and fluorescence microscopy. Scale bar: 50 μm.
Figure 2
Droplet-generated Yersinia pseudotuberculosis microcolonies require Hmp to maintain growth in presence of NO.
Indicated Y. pseudotuberculosis strains were cultured in 2xYT with rotation at 26°C for 7 hr prior to DETA-NONOate exposure. At the indicated timepoints, an aliquot of droplets was fixed and visualized by fluorescence microscopy. (A, D). Microcolony area determined from captured images followed by image analysis (Materials and methods). Each point represents a single droplet with median noted. (B, E). Representative WT (B) and Δhmp (E) microcolonies after 8 hr of treatment with and without DETA-NONOate. Scale bar: 50 μm. (C, F). Overnight broth cultures of Y. pseudotuberculosis were diluted 1:10 in 2xYT broth prior to addition of DETA-NONOate. At indicated timepoints, culture density was determined (Materials and methods).
Figure 3 with 1 supplement
Topological constraints drive non-uniform expression of hmp.
(A). Model of the predicted outcome for the nitric oxide (NO) response of Y. pseudotuberculosis grown in broth versus droplet culture (Davis et al., 2015). Red: bacteria showing high expression of Phmp-mCherry reporter. White: bacteria showing undetectable mCherry fluorescence. (B, C). Y. pseudotuberculosis grown in droplet microcolonies show altered response to NO. Noted bacterial strains harboring gfp+Phmp-mcherry plasmids were grown in either broth (open histograms) or droplets (filled histograms) in the presence of NO donor for the noted times. Droplet microcolonies were dispersed at noted times and analyzed by flow cytometry (Materials and methods). Histograms represent total ungated events. B. Flow analysis of mCherry channel. C. Analysis of GFP channel.
Figure 3—figure supplement 1
Topological constraints drive non-uniform expression of hmp.
(A–D) Y. pseudotuberculosis grown in droplet microcolonies show altered response to NO. Noted bacterial strains harboring gfp+Phmp-mcherry plasmids were grown in either broth (open histograms) or droplets (filled histograms) in the presence of NO donor for the noted times. Droplet microcolonies were dispersed at noted times and analyzed by flow cytometry (Materials and methods). Histograms represent total ungated events. (A) Flow analysis of mCherry channel from WT. (B) Analysis of GFP channel from WT. (C) Flow analysis of mCherry channel from Δhmp. (D) Analysis of GFP channel from Δhmp.
Figure 4

Spatial regulation of hmp expression in tissues can be reproduced in droplet culture.
(A). Experimental overview. Droplets seeded with Y. pseudotuberculosis harboring fluorescence reporters were incubated for 7 hr at 26°C and varying concentrations of DETA-NONOate were added to the cultures for 4 hr at 37°C, 5% CO2. After 4 hr, the droplets were fixed and visualized using brightfield and fluorescence microscopy. (B, C). Representative WT and Δhmp microcolonies after 4 hr of treatment with 1 mM DETA-NONOate.
Figure 5

Strategy for quantification of hmp expression localized on periphery of microcolonies.
(A) Design of script that allows the identification of regions of interest (ROIs) for the purpose of determining the average fluorescence intensities and normalization strategies within the ROIs. Script defines periphery of microcolony and sets mask, allowing a user-defined width extending into the microcolony along with a point of lowest intensity (PLI) which is determined based on the mCherry signal for each microcolony. The fluorescence at the periphery is calculated as a ratio of the average pixel intensity of the mcherry channel in periphery divided by the average pixel intensity of the GFP channel in the periphery, allowing normalization for bacterial expression. The fluorescence for the defined PLI is also calculated in the same fashion, and the periphery verses PLI ratio is determined (Supplemental Data). (B) Example of identification of periphery, mask generation and definition of peripheral ROI. The GFP channel defines the periphery, allowing mask to be set. Within the mask, the periphery is defined as extending 12 pixels into the microcolony. The PLI within the mask is defined as the area of 5-pixel radius with the lowest intensity in the mCherry channel.
Figure 6 with 1 supplement
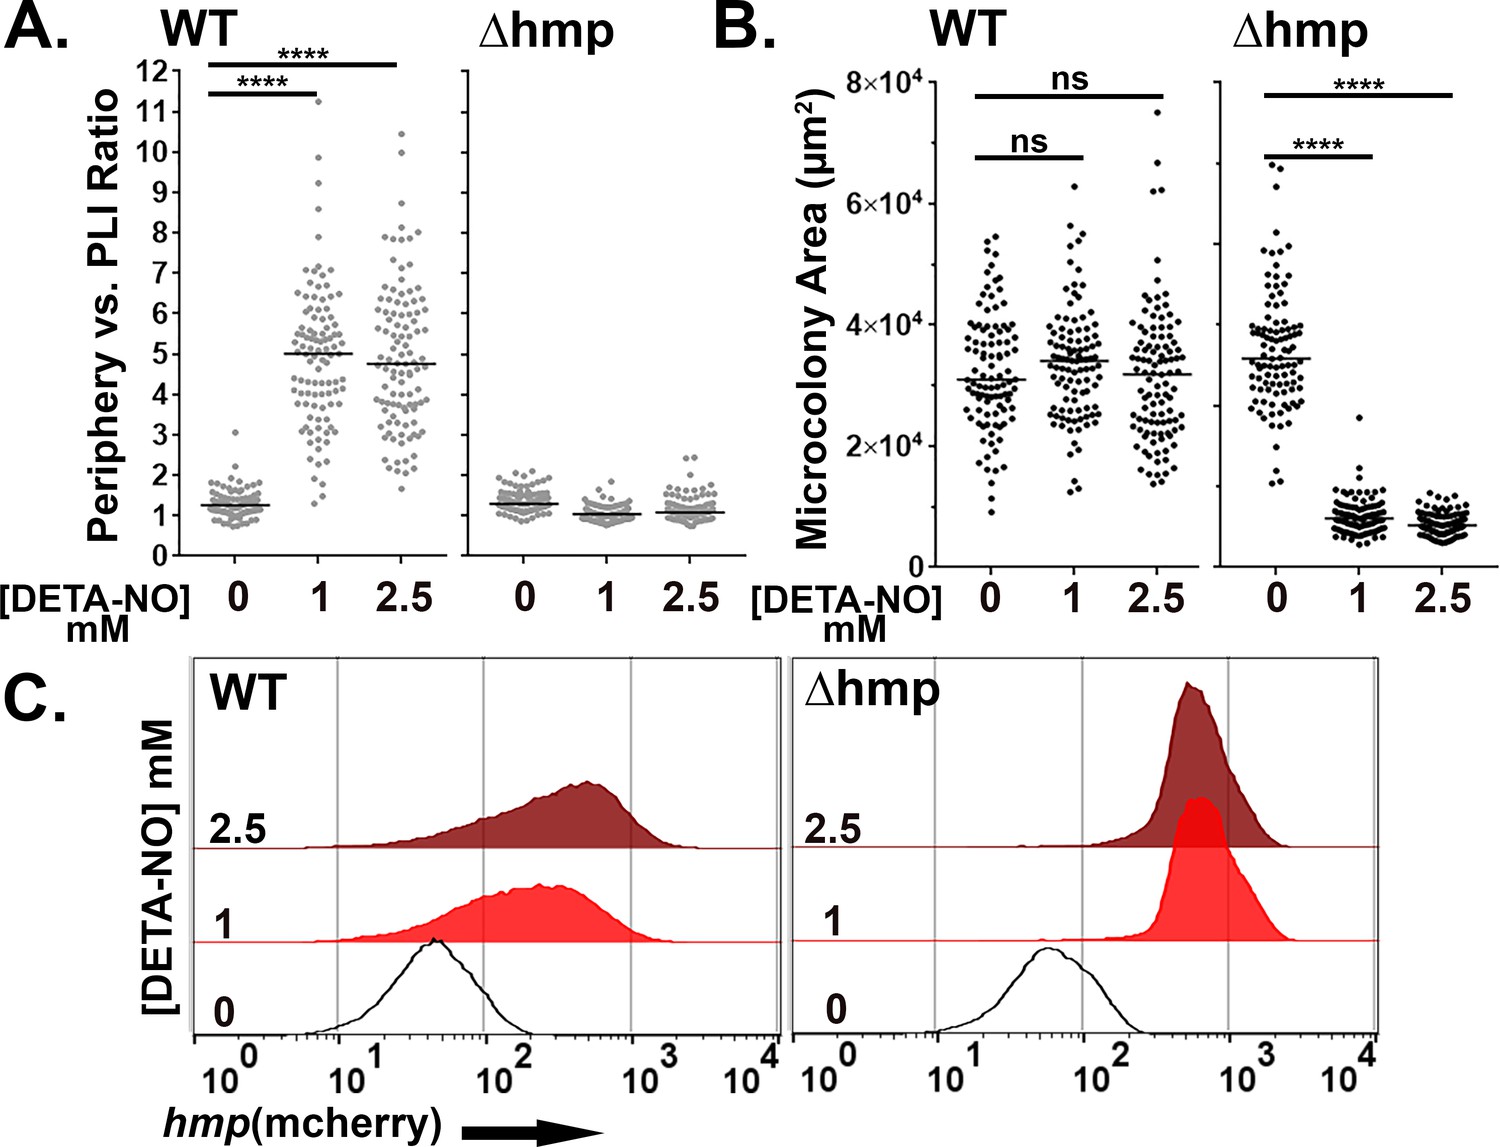
Hmp activity is required for peripheral expression of hmp in response to NO.
(A–C). The presence of Hmp activity is required for Y. pseudotuberculosis to have enhanced expression of Phmp in microcolonies exposed to NO. (A) Periphery versus PLI ratio for microcolonies as a function of DETA-NONOate concentration in microcolonies from noted bacterial strains. (B) Microcolony area (pixels2) for WT and Δhmp microcolonies at different concentrations of DETA-NONOate. Black and gray circles: 100 individual microcolonies measured for each condition. Lines indicate the medians. (C). Flow cytometric analysis of dispersed microcolonies. Droplets were dispersed into single cells after 4 hr of DETA-NONOate treatment at noted concentrations and subjected to flow cytometry (Materials and methods). Bacteria were gated for GFP+ and analyzed for mCherry signal (Figure 6—figure supplement 1). Statistics: Mann-Whitney test, ****p<0.0001, ns: not significant.
Figure 6—figure supplement 1

Gating strategy for flow cytometry.
Droplets were dispersed into single cells after 4 hr of 0 mM DETA-NONOate treatment and subjected to flow cytometry. (A). A live gate was created to remove cellular debris. (B). Bacteria were gated for GFP+ using the gating cutoff described here and the events within this gate were analyzed for mcherry expression. The same gates were applied to all samples presented in Figure 6 and Figure 8.
Figure 7
Recruitment of iNOS+ cells is associated with the maturation of Yersinia pseudotuberculosis microcolonies in tissue.
(A) C57BL/6 mice were inoculated intravenously (i.v.) with 103 WT gfp+ bacteria, and spleens were harvested 3 days post-inoculation (PI). Spleen tissue was probed with α-Ly6G and α-iNOS and visualized by fluorescence microscopy. Neutrophils (α-Ly6G+; red) surround a cluster of Y. pseudotuberculosis (green). Surrounding the sphere of bacteria that is encased by neutrophils (white circle) is a layer of iNOS+ cells. White arrows: The distance between Y. pseudotuberculosis and the iNOS+ cell layer (not to scale). (B) Model for droplet microcolonies. Bacteria are grown in situ within the droplets prior to challenge with iNOS+ cells to mimic Y. pseudotuberculosis microcolony structure in tissue. Black arrows note there is space between iNOS+ cells and cluster of bacteria.
Figure 8
Activated BMDMs drive peripheral expression of hmp in droplet microcolonies, mimicking tissue spatial regulation.
(A) Experimental overview. Droplets containing Y. pseudotuberculosis were grown for 7 hr at 26°C prior to incubation with BMDMs for 4 hr at 37°C, CO2. The fixed microcolonies were visualized using brightfield and fluorescence microscopy and subjected to image analysis (Materials and methods). (B) Resting BMDMs (left) and LPS/IFNγ-primed BMDMs (right) were fixed, probed with α-iNOS and visualized by fluorescence microscopy. (C). C57BL/6 mice were inoculated intravenously (i.v.) with 103 WT gfp+ Phmp-mcherry bacteria, and spleens were harvested 3 days post-inoculation (PI) for fluorescence microscopy. A representative microcolony from tissue is shown. (D, E). Representative WT (D) and Δhmp (E) microcolonies incubated with LPS/IFNγ-primed BMDMs. (F). Microcolony area in presence of BMDMs, incubated as noted. (G) Periphery verses PLI ratios for microcolonies incubated with BMDMs treated as noted. Black and gray circles: 100 individual microcolonies from each condition. Line indicates median. (H). Flow cytometry of dispersed microcolonies after 4 hr of incubation with BMDMs. Dispersed bacteria were gated for GFP+ and mCherry fluorescence was determined (Materials and methods). Statistics: Mann-Whitney test, ****p<0.0001, ***p<0.0005, **p<0.005, *p<0.05, ns: not significant.
Additional files
-
Supplementary file 1
- https://cdn.elifesciences.org/articles/58106/elife-58106-supp1-v2.xlsx
-
Transparent reporting form
- https://cdn.elifesciences.org/articles/58106/elife-58106-transrepform-v2.docx
Download links
A two-part list of links to download the article, or parts of the article, in various formats.
Downloads (link to download the article as PDF)
Open citations (links to open the citations from this article in various online reference manager services)
Cite this article (links to download the citations from this article in formats compatible with various reference manager tools)
Topologically correct synthetic reconstruction of pathogen social behavior found during Yersinia growth in deep tissue sites
eLife 9:e58106.
https://doi.org/10.7554/eLife.58106


