16p11.2 microdeletion imparts transcriptional alterations in human iPSC-derived models of early neural development
- Department of Neurosurgery and The Institute for Stem Cell Biology and Regenerative Medicine, Stanford University School of Medicine, United States
- Department of Neurobiology, Stanford University School of Medicine, United States
Figures
Figure 1

Summary of 16p11.2 CNV clinical features and subject demographics.
See also Supplementary file 1. (A) Microdeletions and microduplications of the 16p11.2 chromosomal region are implicated in a collection of aberrant behavioral, physiological, and morphological conditions. Common conditions associated with each copy number variant are listed here. Red text indicates reciprocal phenotypes. Abbreviations: ADHD, attention-deficit/hyperactivity disorder; ASD, autism spectrum disorder; OCD, obsessive-compulsive disorder; PPD, phonological processing disorder; RELI, receptive-expressive language impairment; DCD, developmental coordination disorder; CHD, congenital heart disease; GERD, gastroesophageal reflux disease; GAD, generalized anxiety disorder; MDD, major depressive disorder. (B) A summary of age, sex, and mutation inheritance information for individuals with the 16p11.2 CNV whose fibroblasts were reprogrammed into hiPSCs. (C) Neuropsychiatric attributes in fibroblast donors. Additional neuropsychiatric information exists for each individual (see SFARI VIP database, Supplementary file 1). Dark gray boxes indicate positive diagnoses, while white boxes represent negative diagnoses.
Figure 2 with 1 supplement
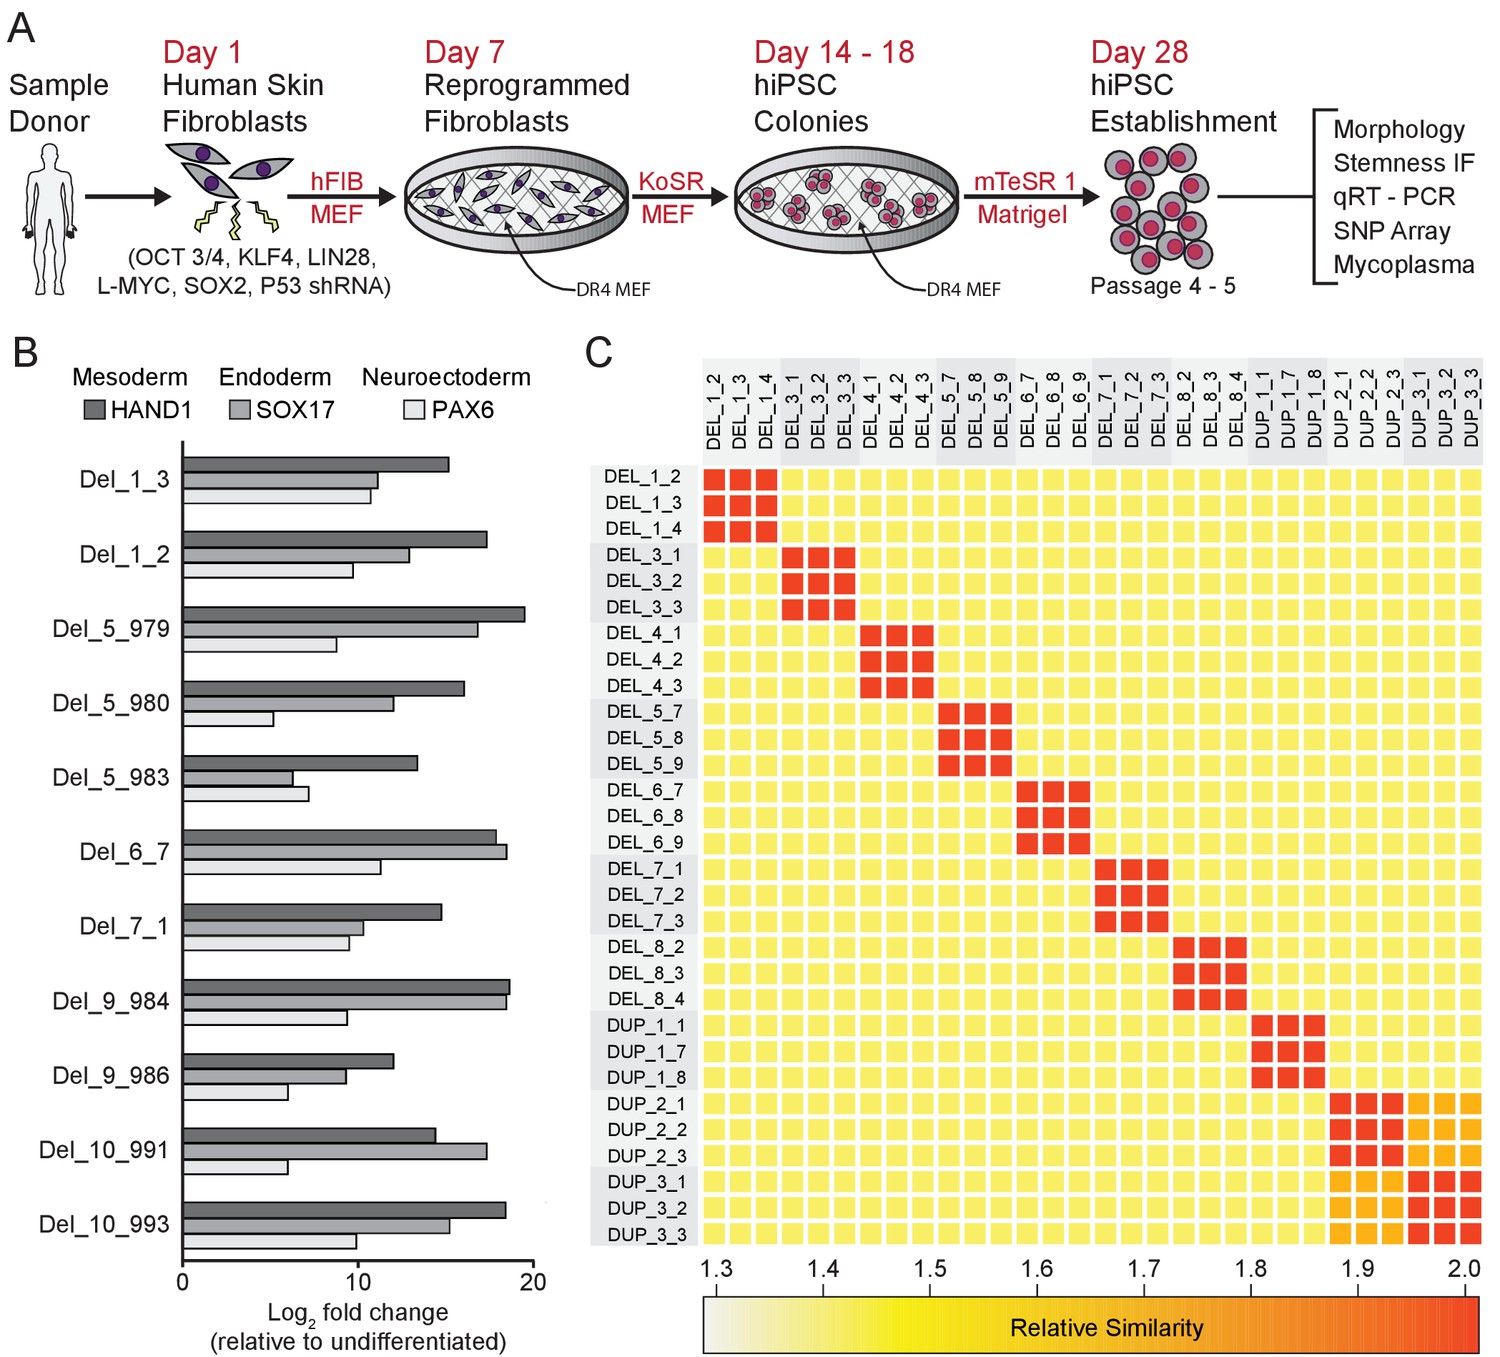
Derivation and validation of 16p11.2 CNV hiPSCs.
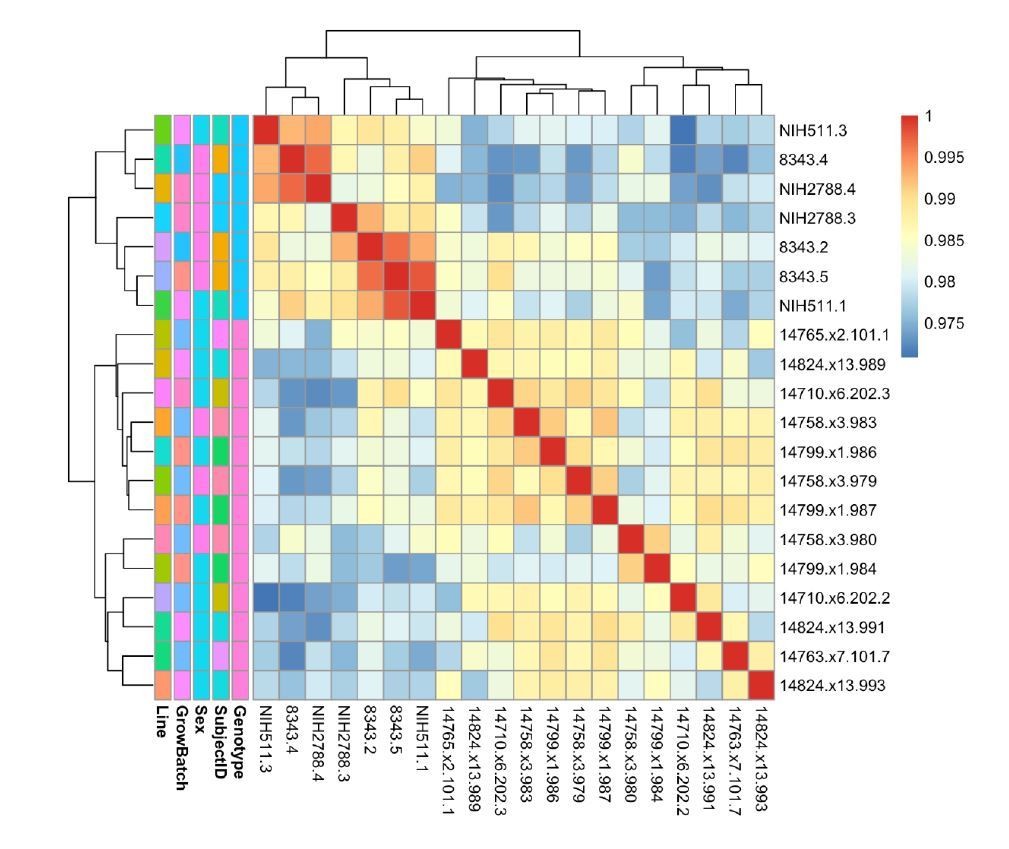
See also Supplementary files 1, 2 and 3; Figure 2—figure supplement 1 and Figure 3—figure supplement 1. (A) Schematic of episomal reprogramming of human fibroblasts into hiPSCs. Abbreviations: hFIB, human fibroblasts; MEF, mouse embryonic fibroblasts; KoSR, KnockOut Serum containing media; IF, immunofluorescence; qRT-PCR, quantitative real-time polymerase chain reaction; SNP, single nucleotide polymorphism. (B) qPCR analysis of lateral mesoderm (Hand1), definitive endoderm (Sox17), and neuroectoderm (PAX6) marker expression following directed differentiation into each respective lineage. (C) SNP-based similarity matrix illustrating the degree of familial relatedness across a subset of hiPSC clones. Increased similarity between clones is indicated in red. Family members share a larger number of SNPs (orange) than unrelated individuals (yellow).
Figure 2—figure supplement 1

Fibroblast reprogramming and pluripotency validation.
(A) Bright field representative image of Day 18 clone of reprogrammed hiPSC surrounded by MEFs (scale bar, 200 µm). (B) Bright field representative image of hiPSC colonies on Day 28, after manual selection and transfer to feeder-free culture conditions (scale bar, 200 µm). Clone DEL_4_1. (C, D, E, F) All hiPSC clones expressed the pluripotency markers NANOG, OCT3/4, TRA-1–60, and TRA-2–49 (scale bars, 100 µm). Clone DEL_5_7. (G) Extinction of Nanog expression following directed differentiation into endoderm, mesoderm and ectoderm lineages. Log2 of fold change in RNA abundance (differentiated/undifferentiated).
Figure 3 with 1 supplement
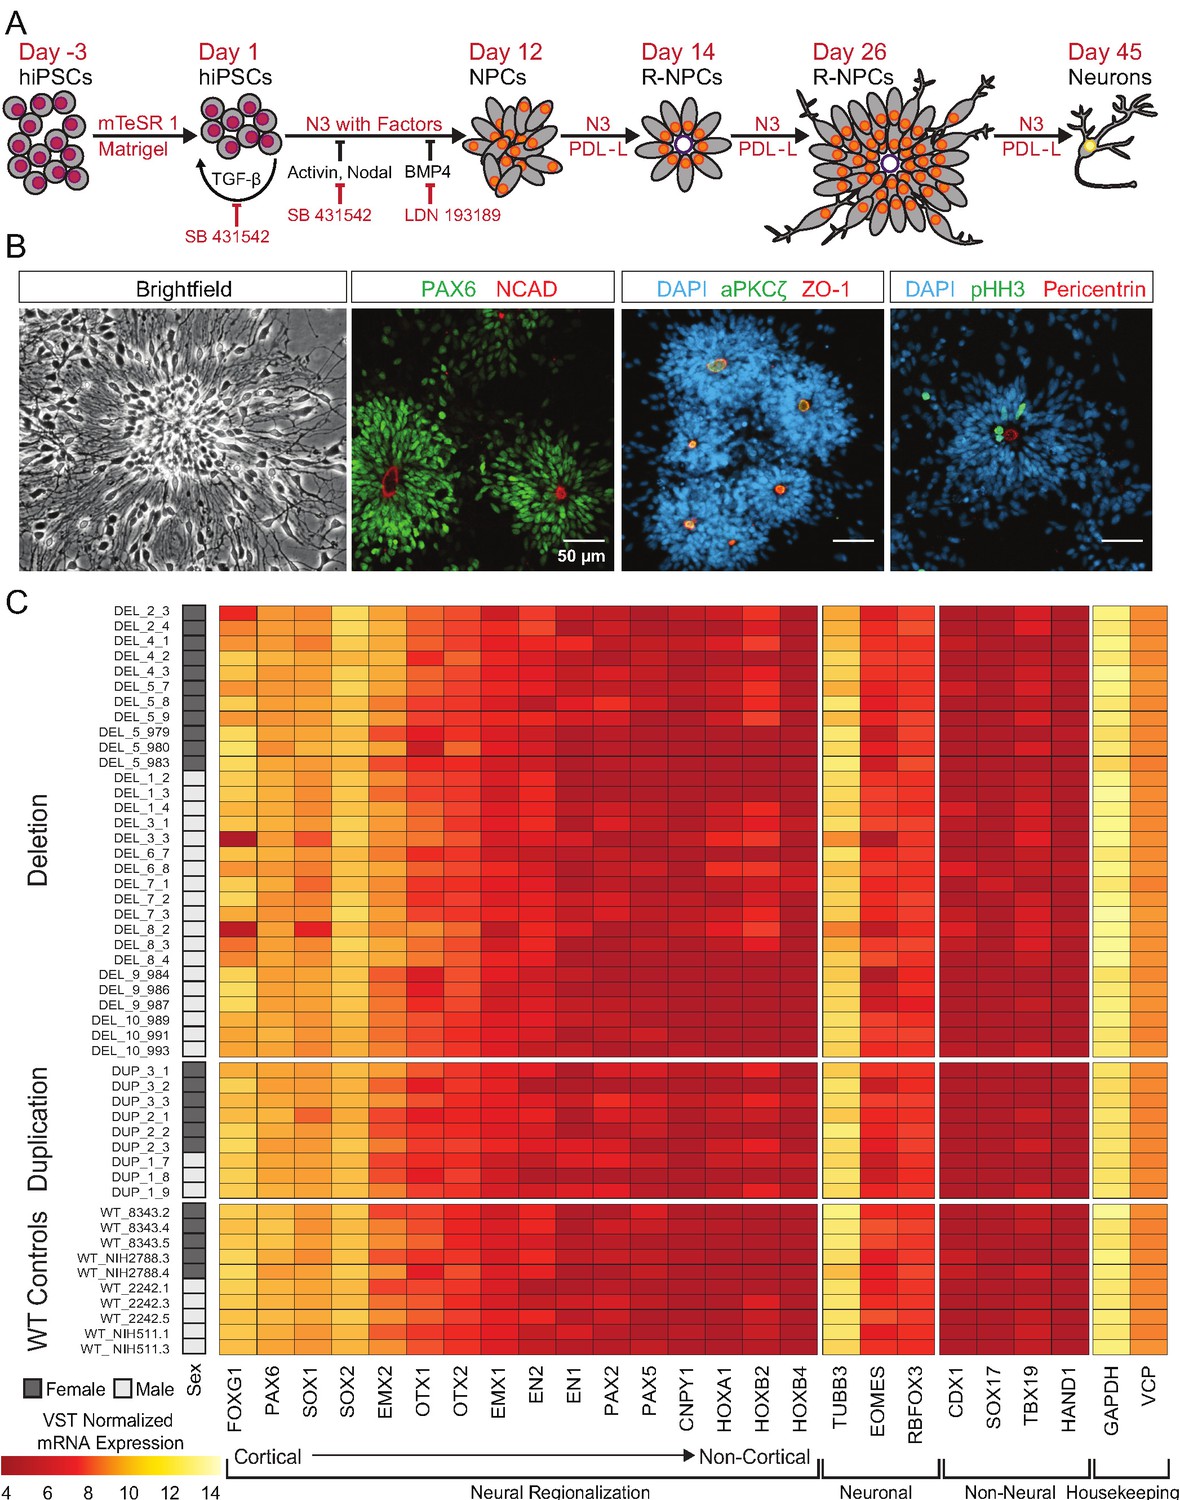
hiPSCs differentiate into cortical neural lineages.
See also Supplementary file 2; Figure 4—figure supplement 1. (A) Schematic of neural differentiation of hiPSCs into cortical progenitor cells and neurons utilizing dual SMAD inhibition. Abbreviations: N3, basal neural differentiation medium, PDL-L, Poly-D-Lysine and Laminin coating; R-NPCs, radial NPCs. (B) Day 26 neural rosettes show the typical radially arrayed clusters of neural progenitor cells in brightfield micrographs. Rosettes are composed of PAX6-positive radial glia encircling a NCAD-positive, ZO-1-positive, and aPKCζ-positive apical adherens complex. Cells currently undergoing M-phase of mitosis, indicated by pHH3, are predominately localized around Pericentrin positive centrosomes at the apical end foot of radial glia (scale bars, 50 µm). Representative rosettes are shown from left to right for (WT_8343.2, WT_8343.2, WT_8343.4, and WT_2242.5). (C) Normalized transcript expression levels of neural regionalization candidate genes generated from RNA-Seq data, ordered from rostral to caudal cell fates, followed by general neuronal and non-neural cell fates, and housekeeping genes. Sex and Genotype status are indicated on the left.
Figure 3—figure supplement 1
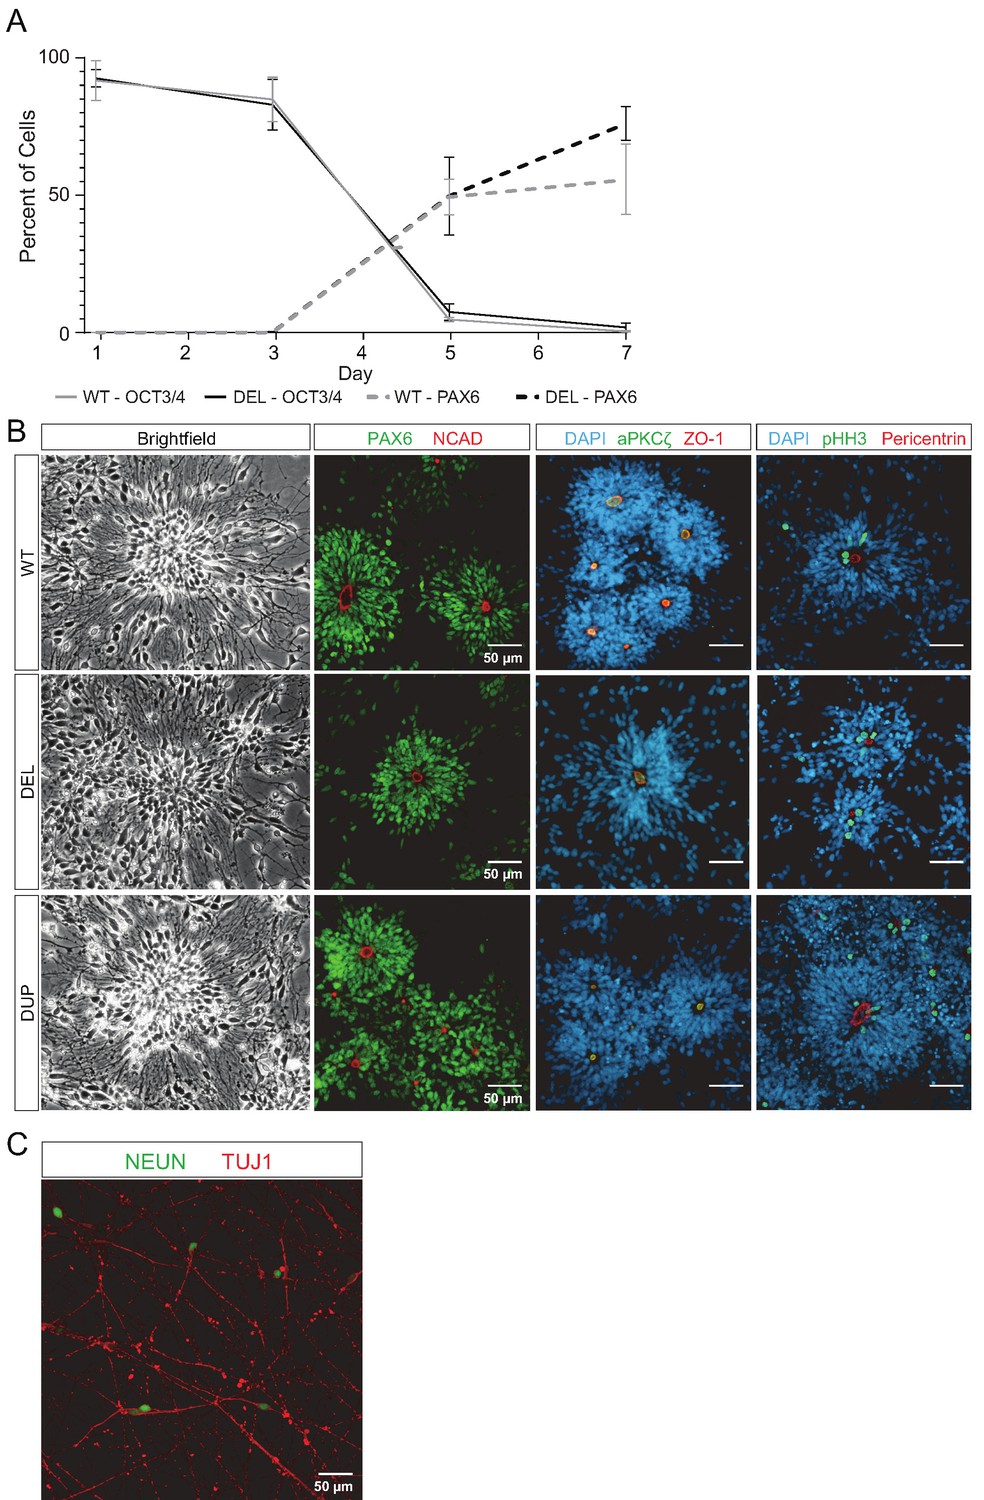
hiPSCs differentiate into NPCs and neurons.
(A) Flow cytometric analysis of the transition between OCT4+ pluripotent hiPSCs and early PAX6+ telencephalic neural progenitor cells. Error bars represent the SEM. Replicates were as follows: WT (3 clones from two donors), DEL (6 clones from three donors). (B) Wild-type (WT), 16p11.2 microdeletion (DEL), and 16p11.2 microduplication (DUP) Day 26 neural rosettes show the typical radially arrayed clusters of neural progenitor cells in brightfield micrographs. Clone IDs for each image: DEL (DEL_5_9, DEL_1_2, DEL_5_8, DEL_9_984), DUP (DUP_3_1, DUP_1_9, DUP_3_3, DUP_1_8), WT (WT_8343.2, WT_8343.2, WT_8343.4, WT_2242.5). (C) Day 45 immature neurons are characterized by long neurites and expression of the neuronal markers TUJ1 and NEUN (scale bar, 50 µm). Clone WT_8343.5.
Figure 4 with 2 supplements
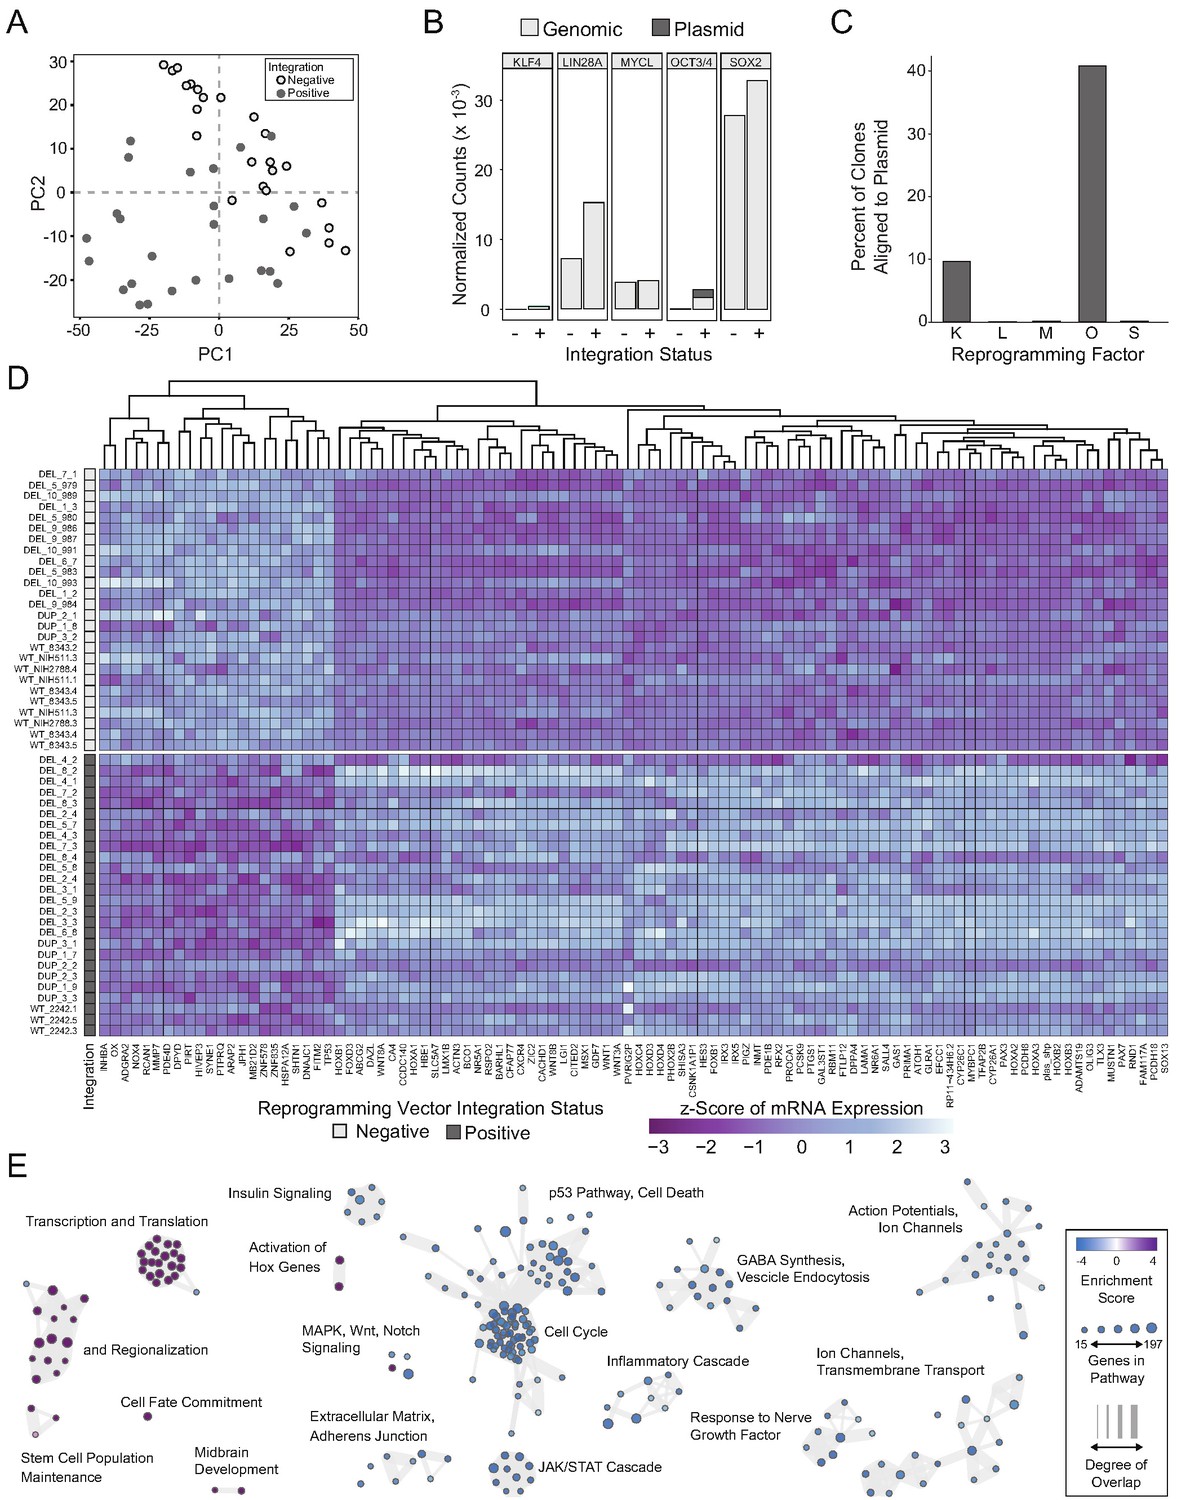
Integration and expression of reprogramming vectors generates pronounced artifacts in the transcriptome.
See also Supplementary files 2 and 4; Figure 4—figure supplements 1 and 2. (A) PCA of variance-stabilized count data before batch correction reveals that samples cluster by integration status within the first two PCs. Axes represent the first two principal components (PC1, PC2). (B) Reprogramming factor expression from reads pseudo aligned to the human genome or to plasmid sequences in Int- and Int+ clones. Y-axis represents estimated counts normalized by size factor. The absence of plasmid-aligned transcripts for most genes is indicated by the absence of dark gray segments for each bar (with the exception of OCT3/4). (C) Percentage of total KLF4 (K), LIN28A (L), MYCL (M), OCT3/4(O), or SOX2 (S) counts pseudo-aligned to plasmid in Int+ clones. Y-axis represents the percentage of counts reported in (B). (D) Heatmap of gene expression represented as Z-scores for the top 100 differentially expressed genes in Int- and Int+ clones as identified with DESeq2. Counts were normalized and scaled using a variance-stabilizing transformation (VST) implemented by DESeq, with batch effect correction using limma. Integration status is visualized on the left (integration free clones on top, light gray indicator). (E) GSEA analysis of DESeq output identified biological functions potentially impacted by cryptic reprogramming vector integration. Individual nodes represent gene lists united by a functional annotation; node size corresponds to the number of genes in pathway, and color reflects whether the pathway is upregulated (purple) or downregulated (blue). Only nodes with significant enrichment in our DESeq output are displayed. The number of genes shared between nodes are indicated by the thickness of their connecting lines. For ease of visualization, individual node labels have been replaced with summary labels for each cluster.
Figure 4—figure supplement 1
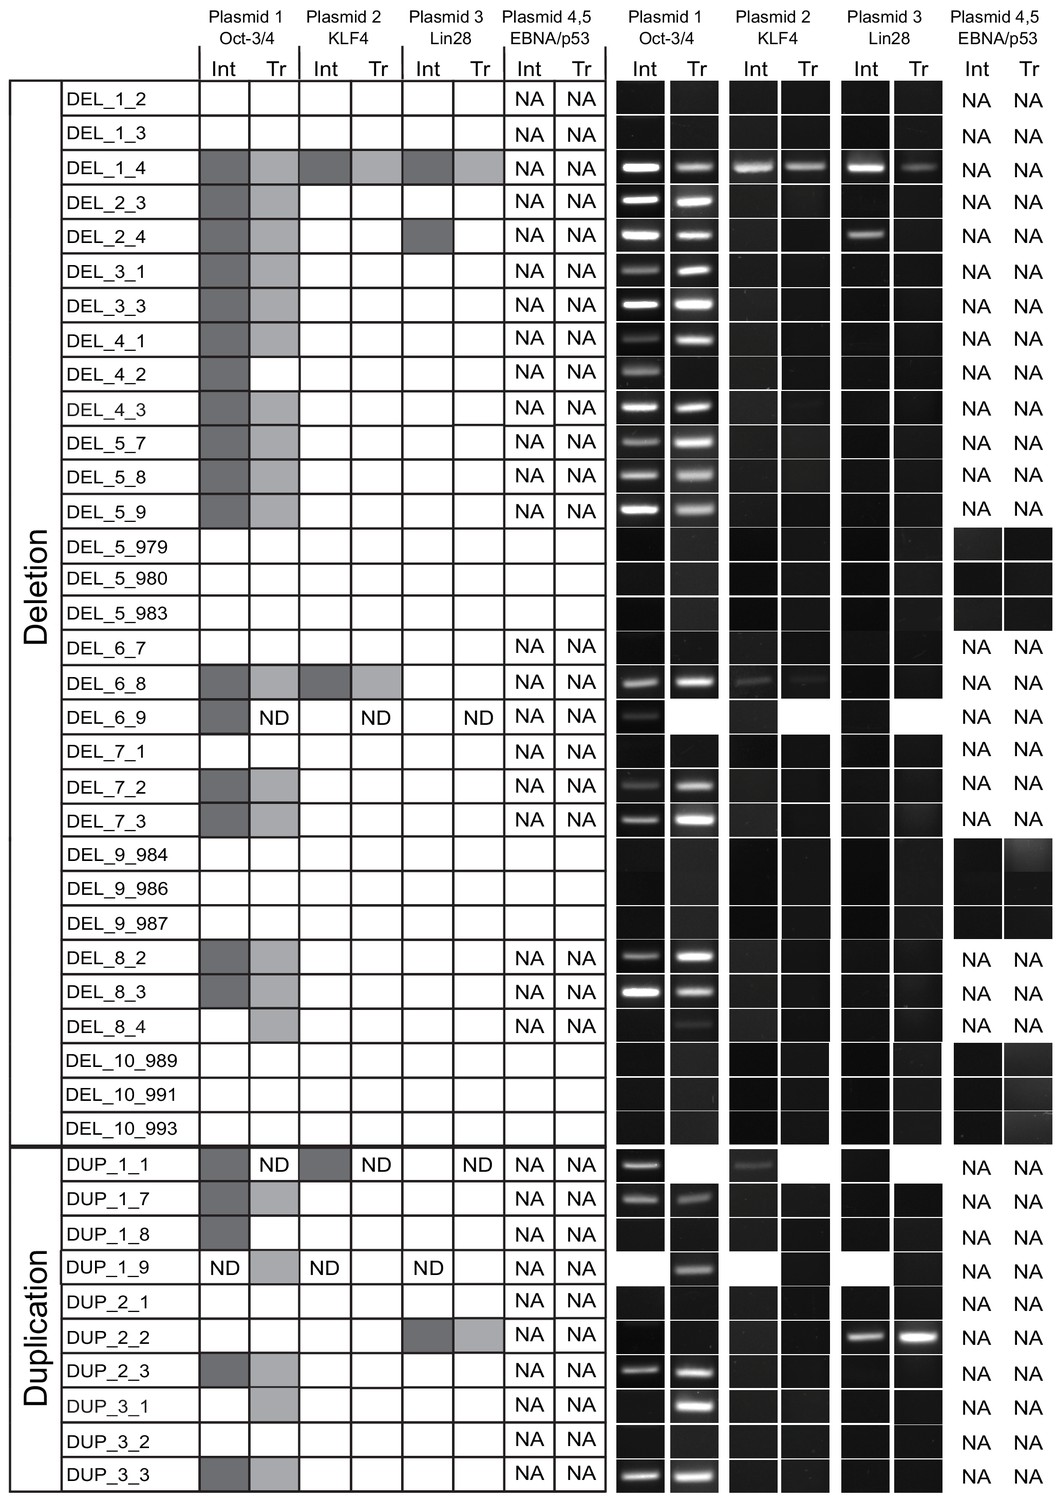
Presence of 16p11.2 reprogramming vector integration and transcripts.
PCR was used to detect reprogramming vector constructs in genomic DNA, and RT-PCR was used to detect mRNA transcripts from each plasmid. Many of the clones were positive for both OCT4 plasmid DNA and transcript. Some clones were also positive for KLF4 or LIN28 plasmid, but no transcripts were detected. A subset of available clones was reprogrammed using additional plasmids carrying EBNA and p53 sequences. No reprogramming vectors were detected in these lines. Plasmid 1 - pCXLE-hOCT4-shp53-F (Addgene plasmid: 27077), plasmid 2 - pCXLE-hUL (L-MyC and Lin28; Addgene plasmid: 27080), plasmid 3 - pCXLE-hSK (Sox2 and KLF4; Addgene plasmid: 27078). Plasmids 4 - pCE-mp53DD (Addgene plasmid: 41856) and plasmid 5 - pCXB-EBNA1 (Addgene plasmid: 41857). Abbreviations: Int, Vector integrant PCR product; Tr, Vector transcription RT-PCR product; ND, not determined; NA, not applicable.
Figure 4—figure supplement 2
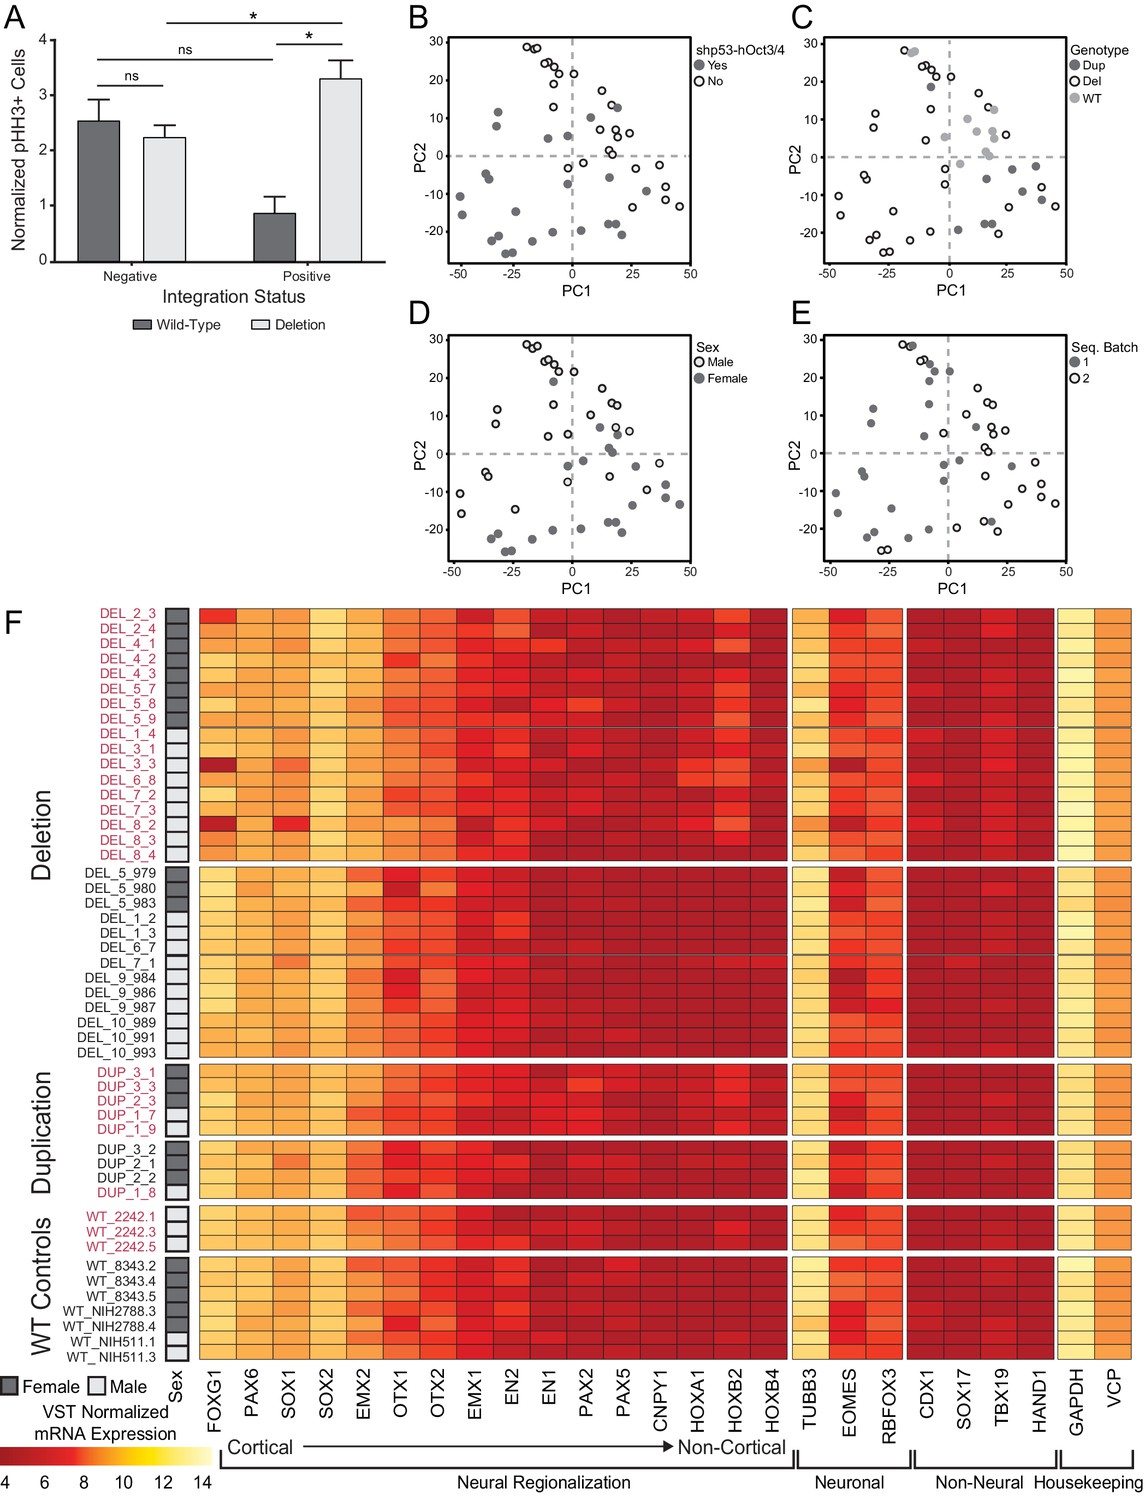
Influence of OCT3/4 integration on cell phenotype and transcriptome.
(A) Total pHH3 counted in Day 26 neural rosette cultures in Int- and Int+ clones normalized by total cell count. Error bars represent the SEM. Replicates were as follows: Int- (WT: 7 clones over 21 images, DEL: 13 clones over 48 images), Int+ (WT: 1 clone over three images, DEL: 21 clones over 87 images). The means for each condition were Int-, WT: 2.43; Int-, DEL: 2.15; Int+, WT: 0.81; Int+, DEL: 3.18. Significance was determined by paired, two-tailed t-tests (p=0.0156 for DEL, 0.0485 for Int+). (B–E) The first two principal components are plotted and shaded by detection of transcripts against the OCT3/4-bearing plasmid (B), donor genotype (C), donor sex (D), and date of library preparation (E). (F) Normalized transcript expression levels of neural regionalization candidate genes generated from RNA-Seq data, as previously described in Figure 3D. hiPSCs are sub-divided into Int+ (red) and Int- (black).
Figure 5 with 4 supplements
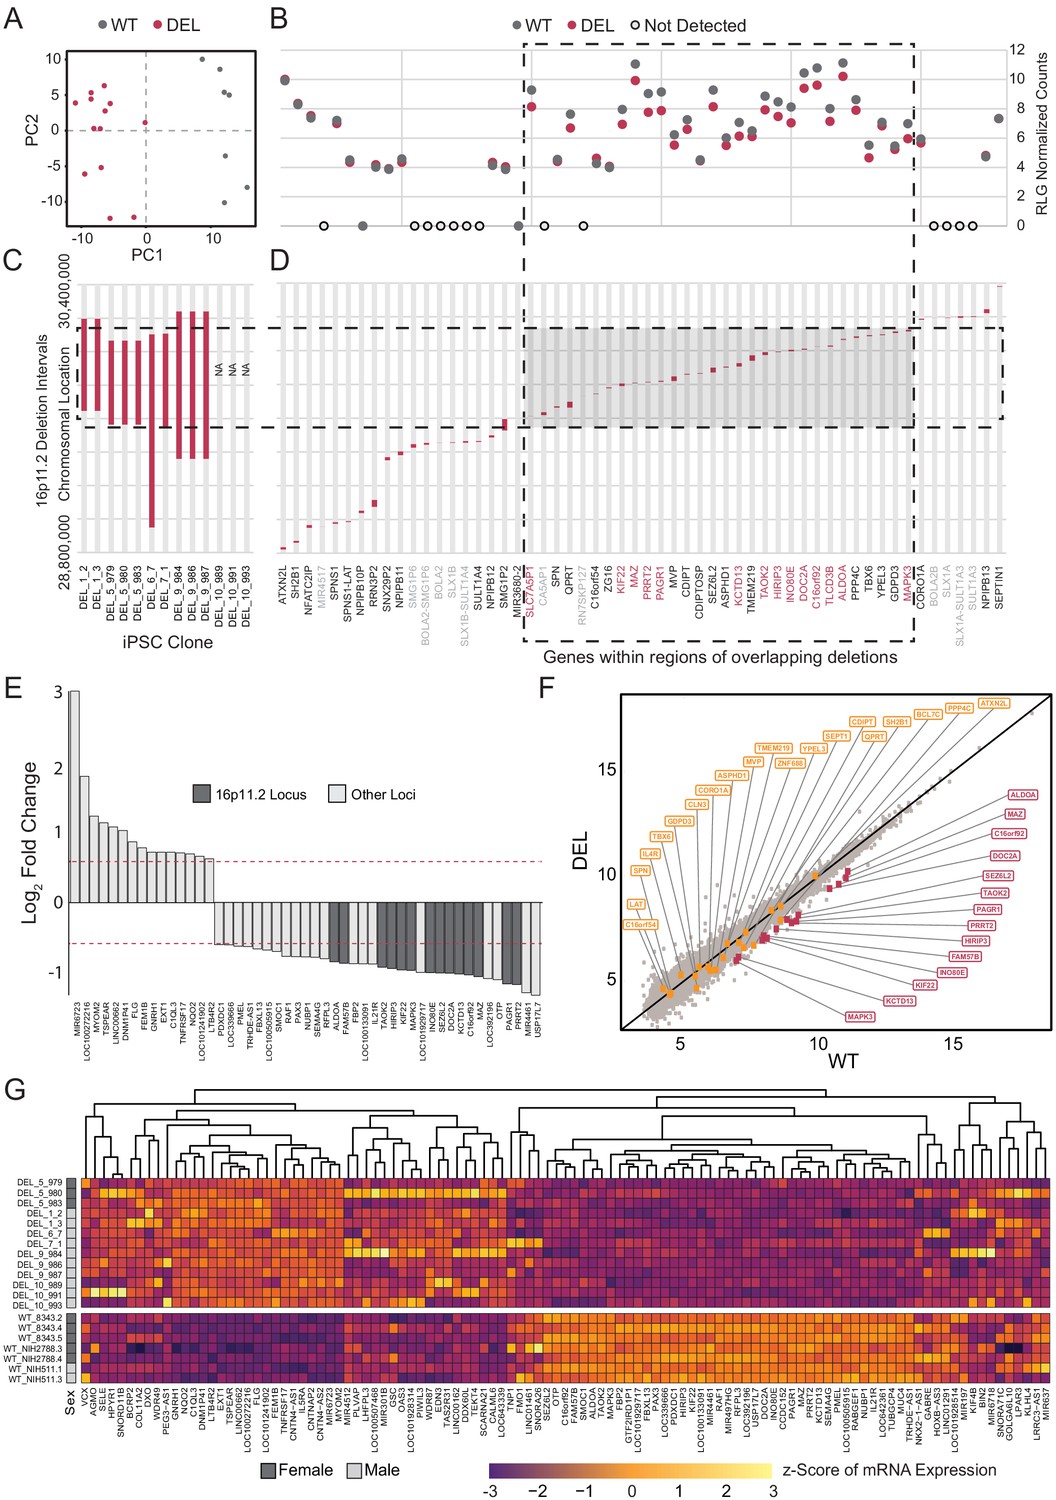
Deletion intervals and differential expression of genes at the 16p11.2 locus.
See also Supplementary files 5 and 6; Figure 5—figure supplements 1, 2, 3 and 4. (A) PCA of variance-stabilized count data after normalization and batch correction reveals that samples cluster by 16p11.2 deletion status within the first two PCs. Axes represent the first two principal components (PC1, PC2). (B) RLG normalized counts of each transcript within the 16p11.2 interval. WT = black symbols, DEL = red symbols, transcripts not detected = gray symbols. (C) Known deletion intervals in integration-free hiPSC clones that were included in the RNA-seq analysis of differentially expressed genes within the 16p11.2 locus. NA, breakpoint information was not available from the Simons Foundation. (D) Canonical gene symbols located between chromosome 16 location 28,800,000 and 30,400,000. Transcripts that reach significance as differentially expressed between WT and DEL clones (FDR < 0.05) are indicated in red. Labels for transcripts that were below detection limits are marked in light gray. (E) Differentially expressed genes that are up- or downregulated at least 1.5-fold. Red lines represent threshold of 1.5-fold change. Genes falling within the 16p11.2 deletion region are highlighted. (F) VST-normalized and batch corrected expression for all genes across all WT clones (X-axis) and DEL clones (Y-axis). Highlighted points represent 16p11.2 region genes that were either called differentially expressed (Red) or not differentially expressed in our pipeline (Orange). (G) Heatmap of gene expression for all the differentially expressed genes identified with DESeq2. Fill values represent counts that have been normalized and scaled using a variance-stabilizing transformation implemented by DESeq, and batch effect corrected using limma and SVA. Sex of the subject is indicated on the left.
Figure 5—figure supplement 1
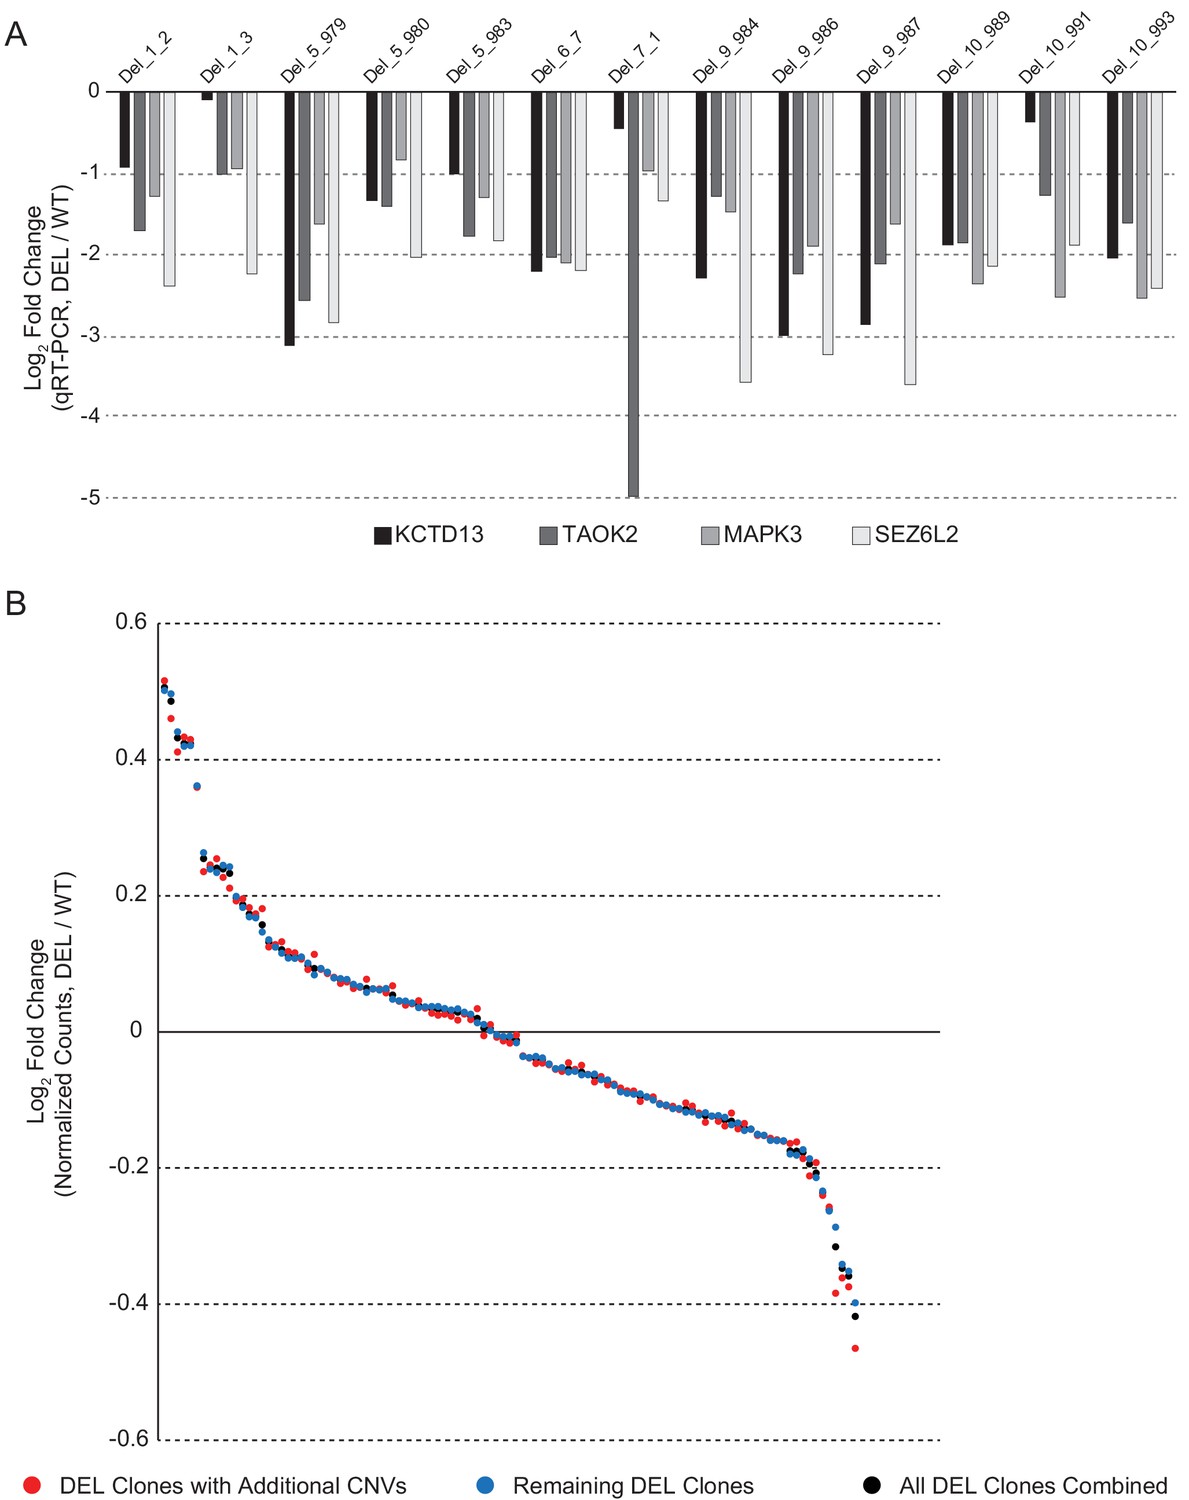
Validation of differentially expressed 16p11.2 interval genes.
(A) qPCR validation of the 16p11.2 interval genes KCTD13, TAOK2, MAPK3 and SEZ6L2 showing a reduction in gene expression in all the DEL lines. Data are expressed as a log2 fold change compared to the average expression of these genes across all WT hiPSC lines. (B) Concordance in DE gene fold change among four clones that have a microdeletion in 14q11.1, a microduplication in 14q11.2, and a microdeletion in 7p11.2, relative to remaining clones and relative to the average of all DEL clones combined. Each dot represents the value for a given DE gene. DE genes were ranked in order of highest fold increase to largest decrease.
Figure 5—figure supplement 2
Concordance of differentially expressed gene changes across individual clones.
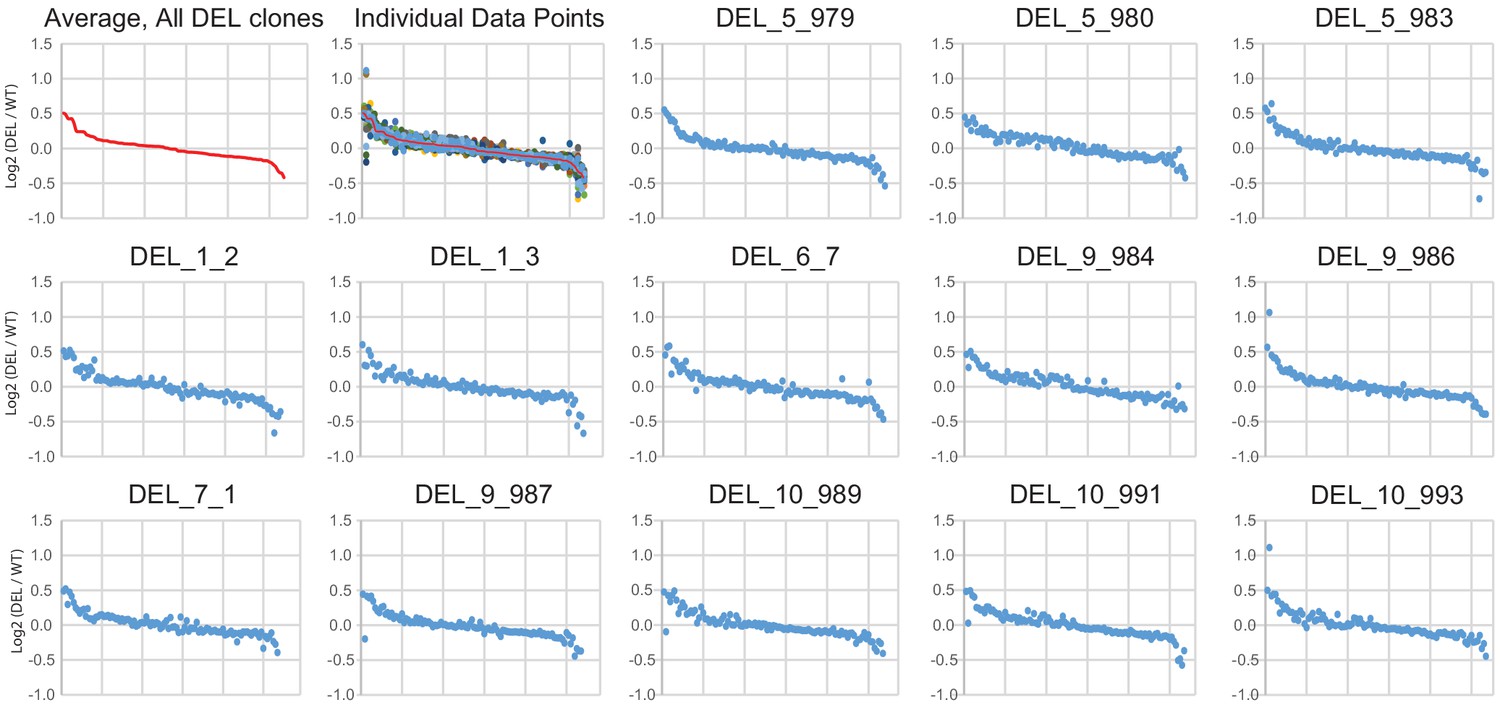
Log2(DEL/WT) for normalized counts is plotted for the average across all DEL clones (first panel, red symbols) or individually for each DE gene in each clone. The second panel overlays the average change for all DEL clones (red) on top of all individual values for each DE gene in each DEL clone. Remaining panels plot each DE gene for individual DEL clones. Genes are rank ordered in all plots from largest increase to largest decrease from left to right (the same order is used in all plots). All plots are calculated as DEL values relative to average expression in the combined WT clones.
Figure 5—figure supplement 3
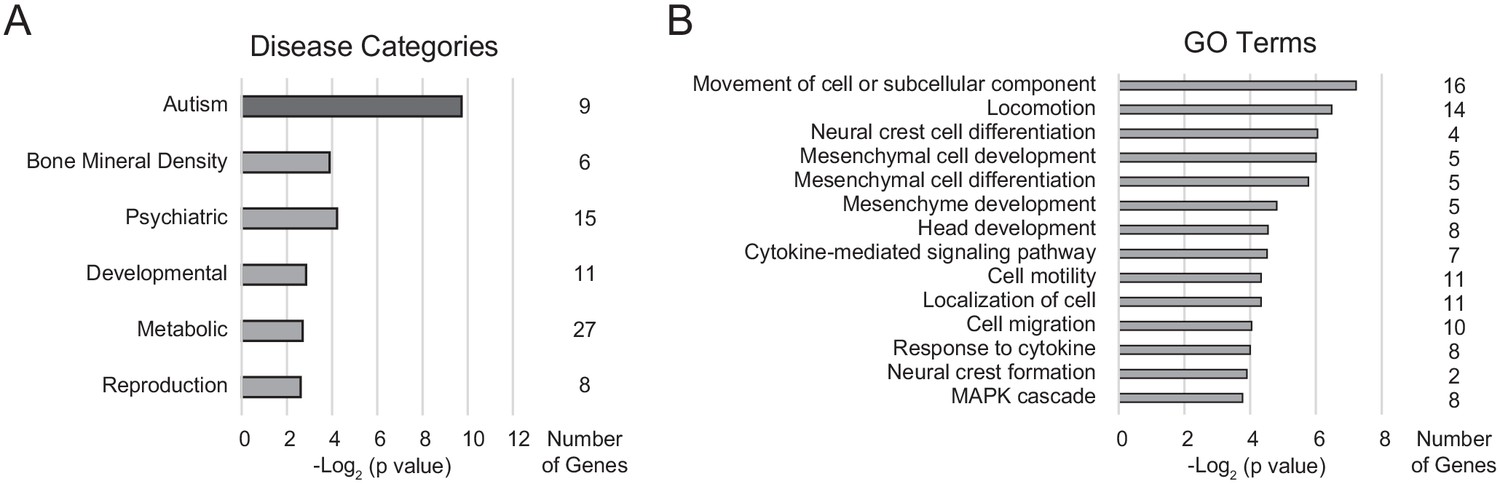
DAVID gene enrichment analysis for differentially expressed genes.
(A) Disease categories observed in the differentially expressed gene list, ordered by unadjusted p-value, and associated number of genes in each category. Categories that are enriched following Bonferroni correction for multiple hypothesis testing correction are colored dark gray. (B) Gene Ontology (GO) term categories in the differentially expressed gene list, ordered by unadjusted p-value, and associated number of genes in each category.
Figure 5—figure supplement 4
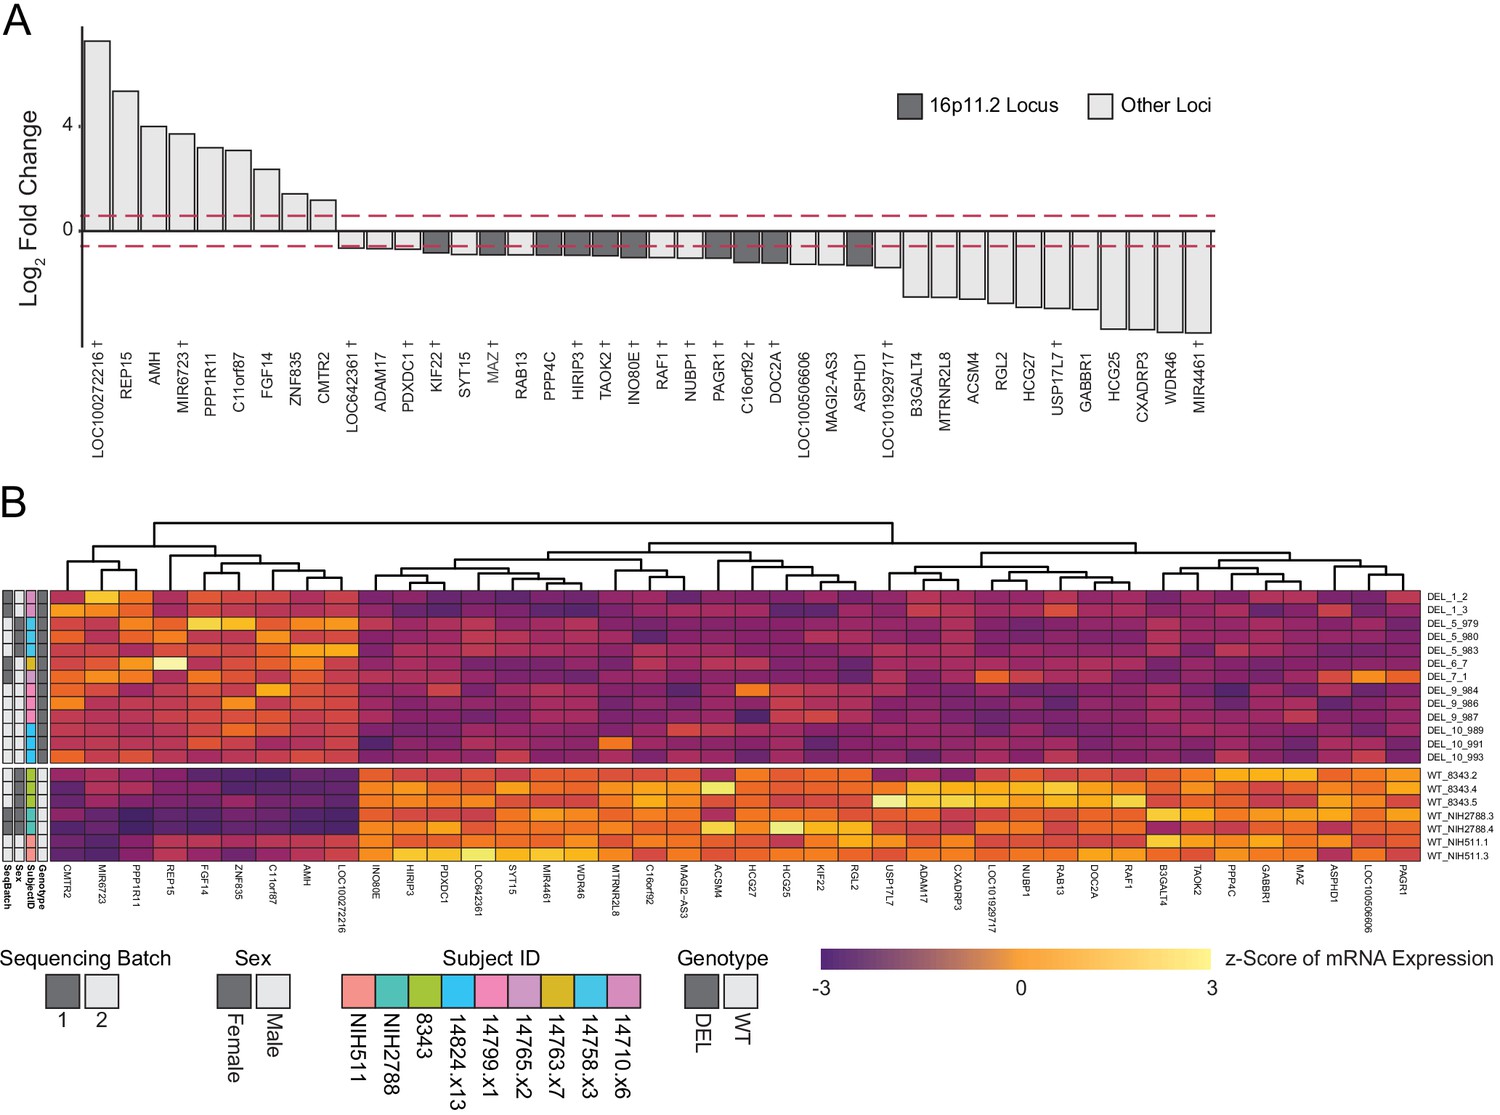
Differential expression analysis with a linear mixed model to account for shared patient identity across clones.
(A) Differentially expressed genes identified using a limma/voom differential expression pathway that are up- or downregulated at least 1.5-fold. Red lines represent threshold of 1.5-fold change. Genes falling within the 16p11.2 deletion region are highlighted. Genes which were also identified in Figure 5E are denoted by a cross. (B) Heatmap of gene expression for all the differentially expressed genes identified with the limma/voom pipeline. Fill values represent the Z-score of counts per million (CPM)-normalized and batch corrected expression values. Sequencing Batch, Sex, Subject ID, and Genotype are indicated on the left.
Figure 6 with 3 supplements
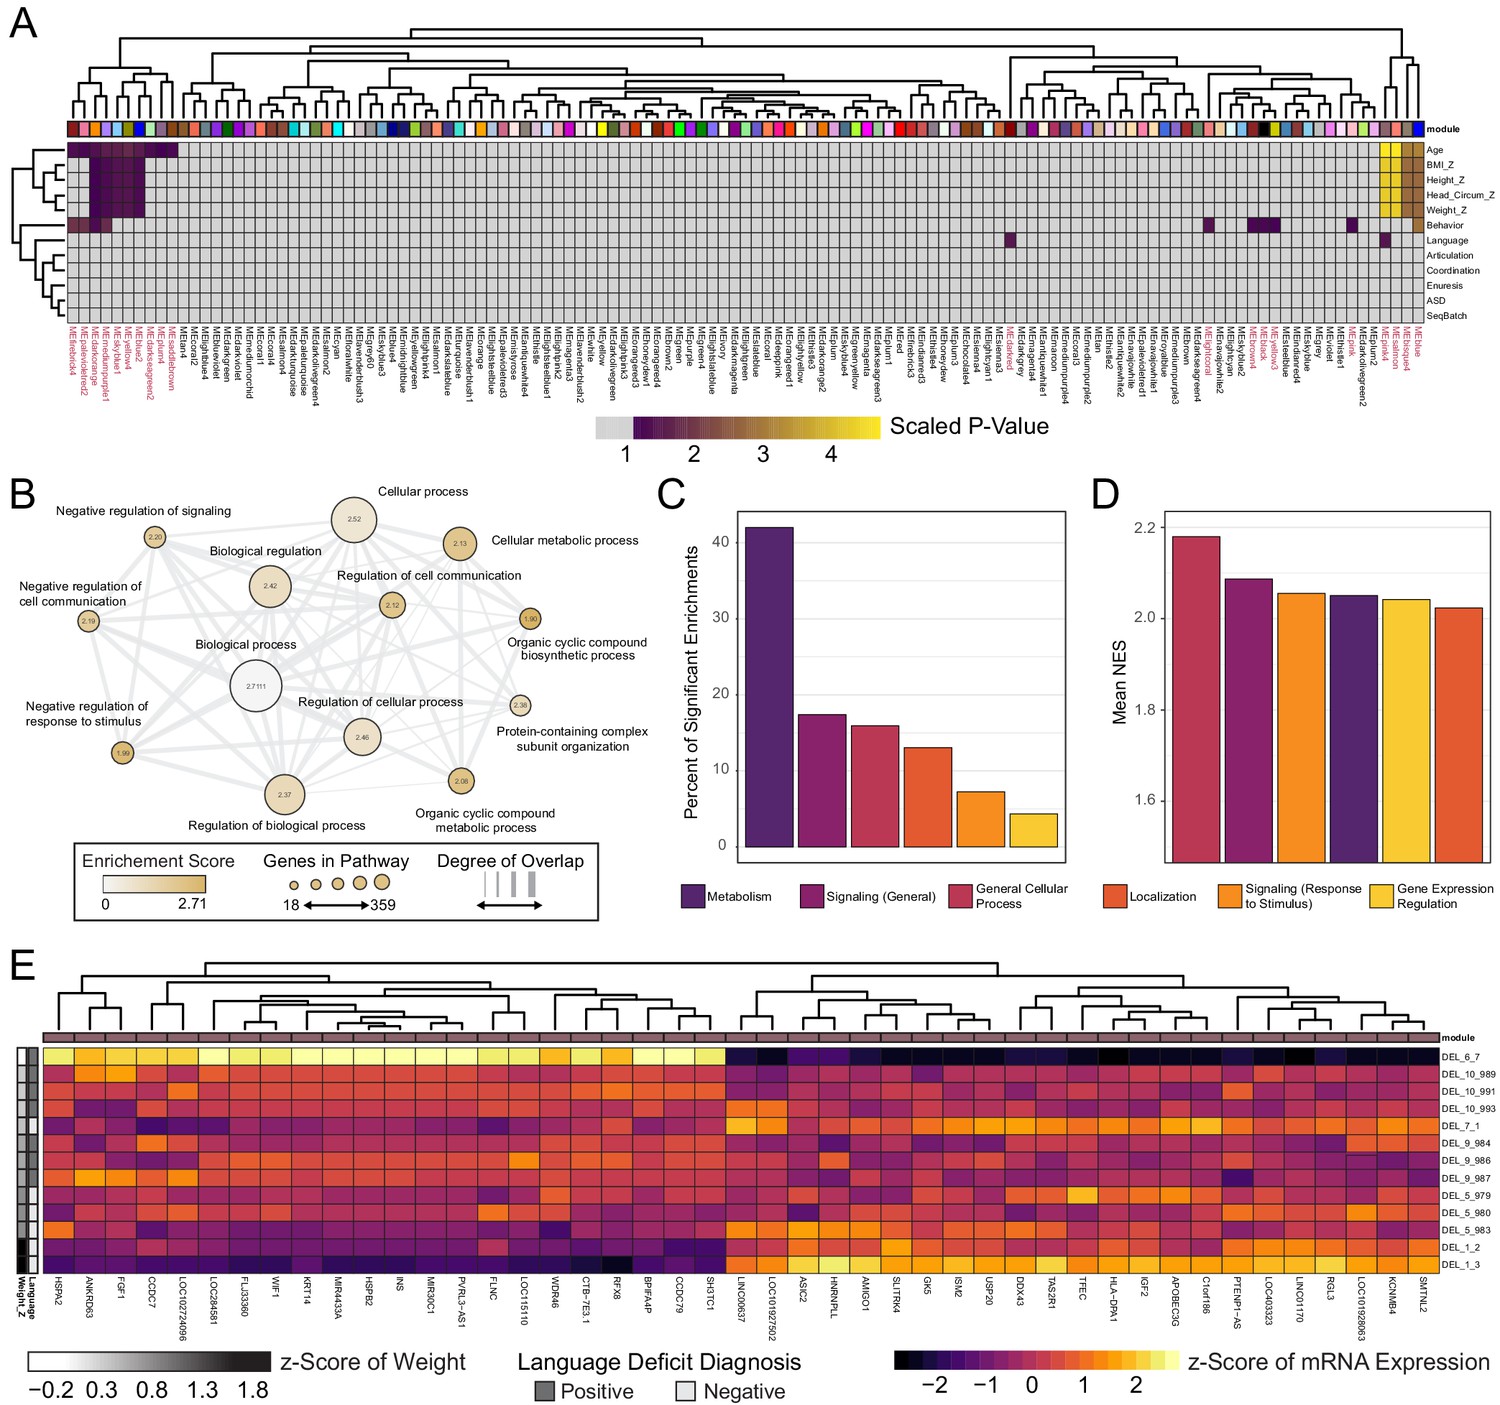
WGCNA reveals modules of co-expressed genes in integration-free clones that correlate with patient clinical features.
See also Supplementary file 7; Figure 6—figure supplements 1, 2 and 3. (A) Heatmap of p-values assessing the significance of module-trait correlations. Values represent a scaled p-value equal to (−1 * log10(p-value)). P-values that fall outside of the significance threshold of p<0.05 are colored gray. WGCNA-produced module color labels are annotated on the X-axis, with red text indicating 20 modules with p<0.05. (B) Depiction of annotations identified as statistically significant (FDR < 0.25) in GSEA for the set of genes identified by WGCNA as the gene networks within the clinical trait-associated modules with highest significance: pink4, salmon, bisque4, and blue (modules represented in the last four columns of panel A). (C) Categories of pathways identified as upregulated among significantly trait-associated module genes by GSEA according to frequency. Enriched pathways identified by GSEA were assigned to categories based on their Gene Ontology relations. (D) Categories of pathways identified as upregulated among significantly trait-associated module genes by GSEA according to normalized enrichment score (NES). Enriched pathways identified by GSEA were assigned to categories based on their Gene Ontology relations. (E) Heatmap of scaled VST-normalized, batch-corrected expression values for genes identified as members of the pink4 module by WGCNA. Phenotype annotations are indicated on the Y-axis.
Figure 6—figure supplement 1
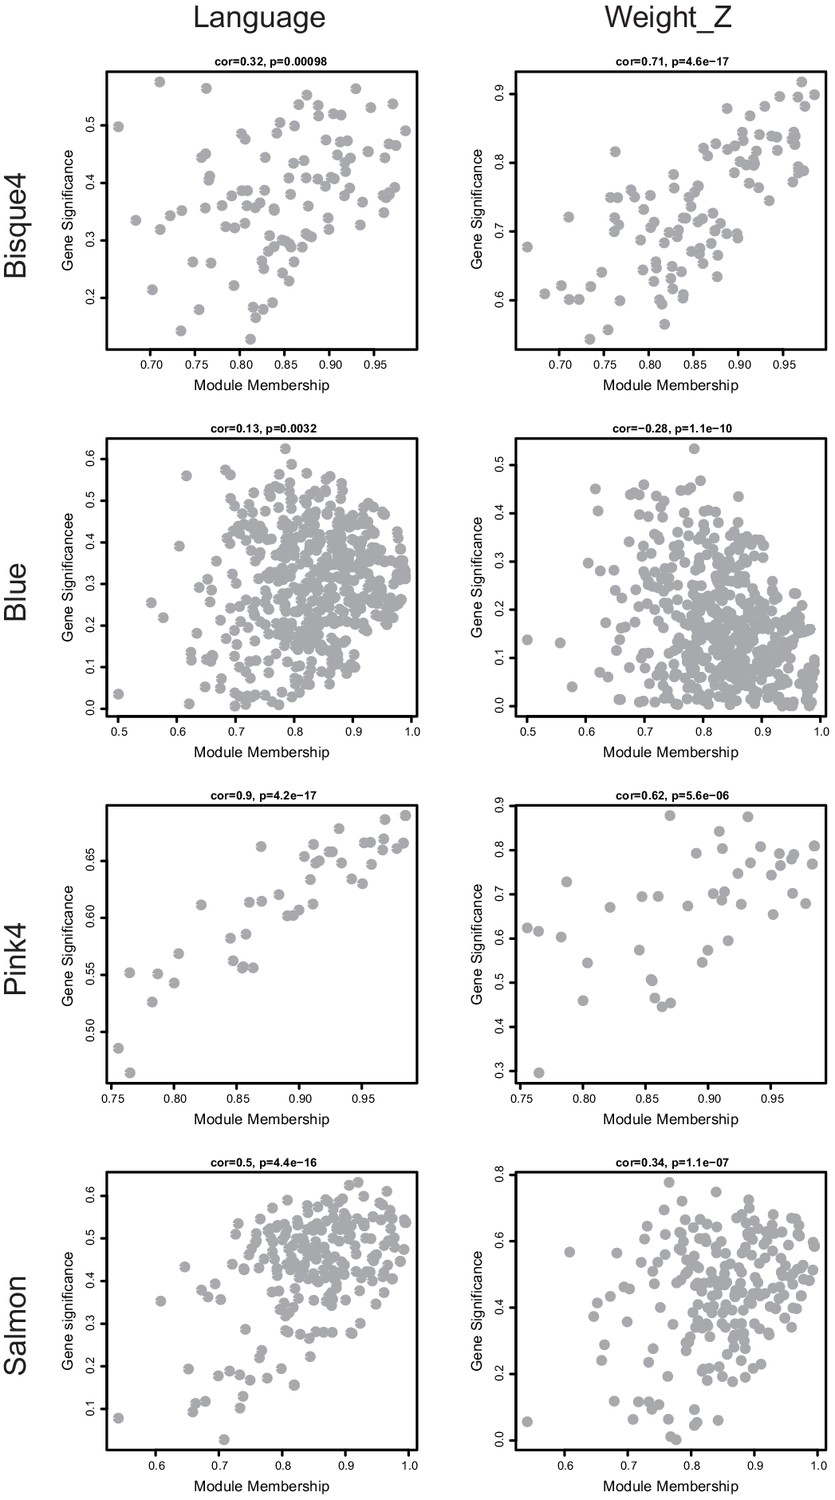
Visualization of module membership (MM) and gene-trait significance (GS) for modules with statistical significance.
Scatterplots depicting the relationship between MM and GS for member genes of modules of interest. Significance relative to the trait Weight_Z (left column) and Language (right column) are displayed. The MM-GS correlation and significance reported by WGCNA are depicted on each plot.
Figure 6—figure supplement 2
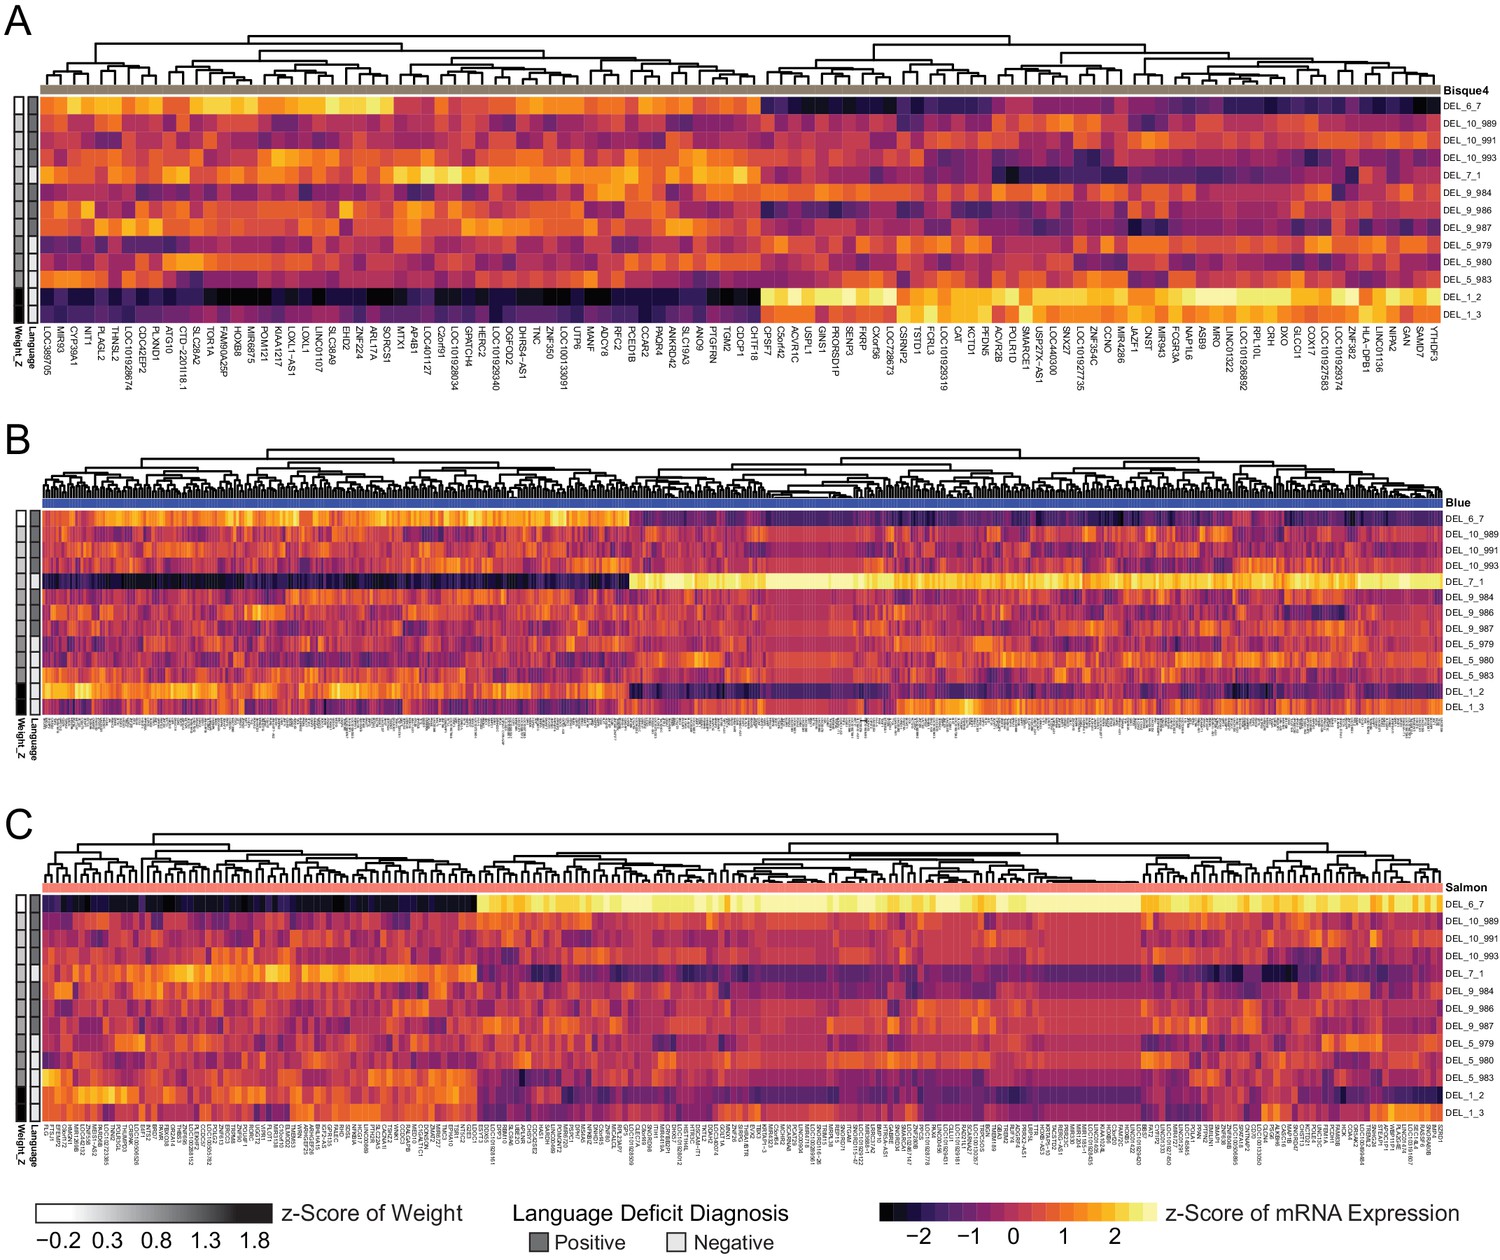
Individual sample outliers drive phenotype correlation in three significant modules.
(A) Heatmap of scaled VST-normalized, batch-corrected expression values for genes identified as members of the bisque4 module by WGCNA. Phenotype annotations are indicated on the left. (B) Heatmap of scaled VST-normalized, batch-corrected expression values for genes identified as members of the blue module by WGCNA. Phenotype annotations are indicated on the left. (C) Heatmap of scaled VST-normalized, batch-corrected expression values for genes identified as members of the salmon module by WGCNA. Phenotype annotations are indicated on the left.
Figure 6—figure supplement 3
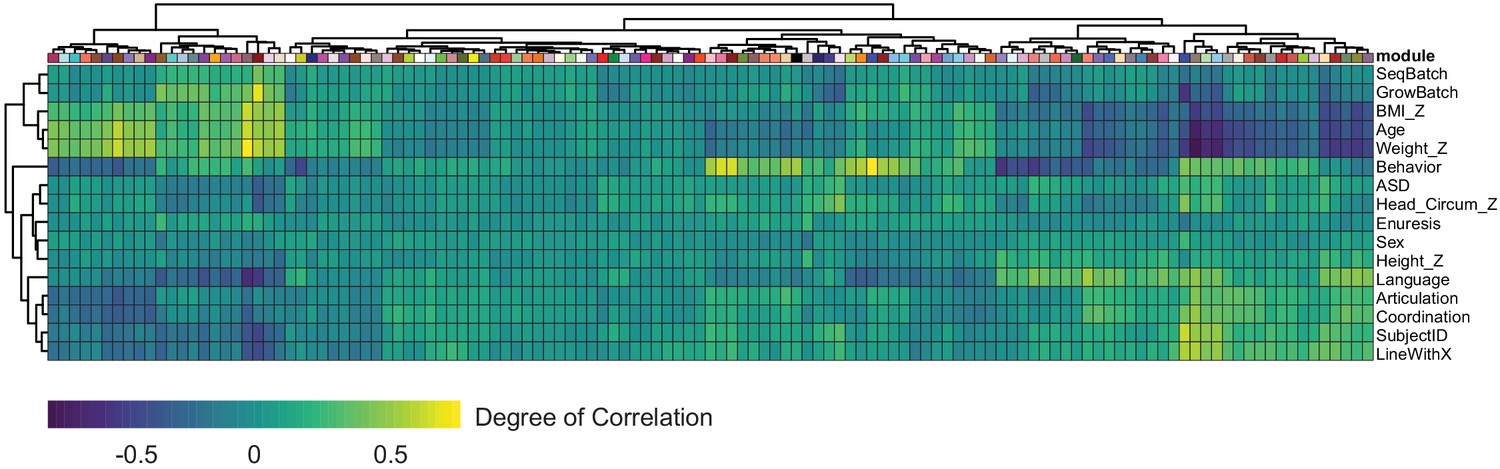
Module correlation with donor clinical information.
Heatmap depicting the Pearson correlation between module eigengene and patient trait calculated by WGCNA. Individual modules are indicated on the X-axis through boxes representing their corresponding color.
Author response image 1
Author response image 2
Author response image 3
Author response image 4

Author response image 5
Author response image 6

Author response image 7
Tables
Key resources table
| Reagent type (species) or resource | Designation | Source or reference | Identifiers | Additional information |
|---|---|---|---|---|
| Antibody | Anti-Oct4 (Goat polyclonal) | Abcam | Cat. No. ab27985 RRID:AB_776898 | IF (1:200) |
| Antibody | Anti-Nanog (Goat polyclonal) | R and D Systems | Cat. No. AF1997 RRID:AB_355097 | IF (1:200) |
| Antibody | Anti-TRA-1–60 (Mouse monoclonal) | Abcam | Cat. No. ab16288 RRID:AB_778563 | IF (1:266) |
| Antibody | Anti-TRA-2–49 (Mouse monoclonal) | Developmental Studies Hybridoma Bank | Cat No. TRA-2-49/6E RRID:AB_528073 | IF (1:200) |
| Antibody | Anti-Pax6 (Rabbit polyclonal) | Biolegend | Cat. No. 901301 RRID:AB_2565003 | IF (1:200) |
| Antibody | Mouse anti-NCad (Mouse monoclonal) | BD Biosciences | Cat. No. 610920 RRID:AB_2077527 | IF (1:173) |
| Antibody | Anti-ZO-1 (Mouse monoclonal) | Invitrogen | Cat. No. 33–9100 RRID:AB_2533147 | IF (1:100) |
| Antibody | Goat anti-aPKCζ (Goat polyclonal) | Santa Cruz | Cat. No. sc-216 RRID:AB_2300359 | IF (1:200) |
| Antibody | Anti-Pericentrin (Mouse monoclonal) | Abcam | Cat. No. ab28144 RRID:AB_2160664 | IF (1:200) |
| Antibody | Anti-pHH3 (Goat polyclonal) | Santa Cruz | Cat. No. sc-12927 RRID:AB_2233069 | IF (1:200) |
| Antibody | Anti-Emx1 (Rabbit polyclonal) | Thermo Scientific | Cat. No. PA5-35373 RRID:AB_2552683 | IF (1:100) |
| Antibody | Anti-Dlx1 (Mouse monoclonal) | Abcam | Cat. No. ab54668 RRID:AB_941307 | IF (1:250) |
| Antibody | Anti-Tuj1 (Mouse monoclonal) | Abcam | Cat. No. ab78078 RRID:AB_2256751 | IF (1:200) |
| Antibody | Anti-NeuN (Rabbit monoclonal) | Abcam | Cat. No. ab177487 RRID:AB_2532109 | IF (1:300) |
| Antibody | Anti-rabbit conjugated with Alexa-488 (Goat polyclonal) | Invitrogen | Cat. No. A-11034 RRID:AB_2576217 | IF (1:500) |
| Antibody | Anti-mouse conjugated with Alexa-488 (Goat polyclonal) | Invitrogen | Cat. No. A-11001 RRID:AB_2534069 | IF (1:500) |
| Antibody | Anti-rabbit conjugated with Alexa-488 (Donkey polyclonal) | Jackson | Code No. 711-545-152 RRID:AB_2313584 | IF (1:500) |
| Antibody | Anti-goat conjugated with Alexa-488 (Donkey polyclonal) | Jackson | Code No. 705-545-003 RRID:AB_2340428 | IF (1:500) |
| Antibody | Anti-mouse conjugated with Alexa-488 (Donkey polyclonal) | Jackson | Code No. 715-545-150 RRID:AB_2340820 | IF (1:500) |
| Antibody | Anti-rabbit conjugated with Cy3 (Donkey polyclonal) | Jackson | Code No. 711-165-152 RRID:AB_2307443 | IF (1:500) |
| Antibody | Anti-goat conjugated with Cy3 (Donkey polyclonal) | Jackson | Code No. 705-165-147 RRID:AB_2307351 | IF (1:500) |
| Antibody | Anti-mouse conjugated with Cy3 (Donkey polyclonal) | Jackson | Code No. 715-165-150 RRID:AB_2340813 | IF (1:500) |
| Antibody | Anti-rabbit conjugated with Cy5 (Donkey polyclonal) | Jackson | Code No. 711-175-152 RRID:AB_2340607 | IF (1:500) |
| Antibody | Anti-goat conjugated with Cy5 (Donkey polyclonal) | Jackson | Code No. 705-175-147 RRID:AB_2340415 | IF (1:500) |
| Antibody | Anti-mouse conjugated with Cy5 (Donkey polyclonal) | Jackson | Code No. 715-175-151 RRID:AB_2340820 | IF (1:500) |
| Chemicals Compound, Drug | RHO/ROCK Pathway Inhibitor Y27632 | Stem Cell Technologies | Cat. No. 72302 | |
| Chemicals Compound, Drug | SB-431542 | Tocris | Cat. No. 1614 | |
| Chemicals Compound, Drug | LDN-193189 | Stemgent | Cat. No. 04007402 | |
| Chemicals Compound, Drug | ProLong Gold Antifade Mountant with DAPI | Thermo Fisher Scientific | Cat. No. P36931 | |
| Chemicals Compound, Drug | TRIzol | Thermo Fisher Scientific | Cat. No. 15596026 | |
| Peptides, Recombinant Proteins | Human Recombinant FGF2 | R and D Systems | Cat. No. 233-FB | |
| Peptides, Recombinant Proteins | hESC-qualified Matrigel Matrix | Corning | Product No. 354277 | |
| Peptides, Recombinant Proteins | Human Recombinant Insulin | Thermo Fisher Scientific | Cat. No. 12585014 | |
| Peptides, Recombinant Proteins | Poly-D-Lysine | Sigma Aldrich | Cat. No. P7280 | |
| Peptides, Recombinant Proteins | Laminin | Roche | Cat. No. 11243217001 | |
| Commercial Assay, Kit | Amaxa Human Dermal Fibroblast Nucleofector Kit | Lonza | Cat. No. VDP - 1001 | |
| Commercial Assay, Kit | Epi5 Reprogramming Kit | Thermo Fisher Scientific | Cat. No. A15960 | |
| Commercial Assay, Kit | GeneJET Genomic DNA purification KIT | Thermo Fisher Scientific | Cat. No. K0722 | |
| Commercial Assay, Kit | Platinum Taq DNA Polymerase High Fidelity Kit | Thermo Fisher Scientific | Cat. No. 11304011 | |
| Commercial Assay, Kit | GeneJET RNA purification kit | Thermo Fisher Scientific | Cat. No. K0731 | |
| Commercial Assay, Kit | High Capacity cDNA Reverse Transcription Kit | Applied Biosystems | Cat. No. 4368814 | |
| Cell Line (Homo-sapiens) | 16p11.2 Deletion and Duplication iPSC lines | SFARI | See Figure 2—figure supplement 1 | |
| Cell Line (M. musculus) | DR4 MEF Feeder Cells | Transgenic Mouse Facility at Stanford University | ||
| Recombinant DNA Reagent | pCXLE-hOCT3/4-shp53-F | Addgene | Cat. No. Plasmid27077 | |
| Recombinant DNA Reagent | pCXLE-hSK | Addgene | Cat. No. Plasmid27078 | |
| Recombinant DNA Reagent | pCXLE-hUL | Addgene | Cat. No. Plasmid27080 | |
| Sequence-based Reagent | pCXLE-hOCT4-shp53-F-fwd | This paper | PCR primers | CAGTGTCCTTTCCTCTGGCCCC |
| Sequence-based Reagent | pCXLE-hOCT4-shp53-F-rev | This paper | PCR primers | ATGAAAGCCATACGGGAAGCAATAGC |
| Sequence-based Reagent | pCXLE-hSK-fwd | This paper | PCR primers | AATGCGACCGAGCATTTTCCAGG |
| Sequence-based Reagent | pCXLE-hSK-rev | This paper | PCR primers | TGCGTCAGCAAACACAGTGCACA |
| Sequence-based Reagent | pCXLE-hUL-fwd | This paper | PCR primers | CAGAGCATCAGCCATATGGTAGCCT |
| Sequence-based Reagent | pCXLE-hUL-rev | This paper | PCR primers | ACAACGGGCCACAACTCCTCAT |
| Sequence-based Reagent | Actb-fwd | This paper | PCR primers | AGAGCTACGAGCTGCCTGAC |
| Sequence-based Reagent | Actb-rev | This paper | PCR primers | AGCACTGTGTTGGCGTAGAC |
| Sequence-based Reagent | Hand1-fwd | This paper | PCR primers | GTGCGTCCTTTAATCCTCTTC |
| Sequence-based Reagent | Hand1-rev | This paper | PCR primers | GTGAGAGCAAGCGGAAAAG |
| Sequence-based Reagent | Sox17-fwd | This paper | PCR primers | CGCACGGAATTTGAACAGTA |
| Sequence-based Reagent | Sox17-rev | This paper | PCR primers | GGATCAGGGACCTGTCACAC |
| Sequence-based Reagent | Pax6-fwd | This paper | PCR primers | TGGGCAGGTATTACGAGCTG |
| Sequence-based Reagent | Pax6-rev | This paper | PCR primers | ACTCCCGCTTATACTGGGCTA |
| Software, Algorithm | SnapGene | SnapGene | RRID:SCR_015052 | |
| Software, Algorithm | ImageJ | ImageJ | RRID:SCR_003070 | |
| Software, Algorithm | Photoshop | Adobe | RRID:SCR_014199 | |
| Software, Algorithm | Prism v7.04 | GraphPad | RRID:SCR_002798 | |
| Software, Algorithm | FastQC v0.11.6 | Babraham Bioinformatics | RRID:SCR_014583 | |
| Software, Algorithm | kallisto v0.43.1 | Pachter Lab | RRID:SCR_016582 | |
| Software, Algorithm | R | R Project for Statistical Computing | RRID:SCR_001905 | |
| Software, Algorithm | RStudio | RStudio | RRID:SCR_000432 | |
| Software, Algorithm | Tximport v1.8.0 | tximport | None yet available | |
| Software, Algorithm | DESeq2 v1.20.0 | DESeq2 | RRID:SCR_015687 | |
| Software, Algorithm | ggplot2 v3.0.0 | ggplot2 | RRID:SCR_014601 | |
| Software, Algorithm | pheatmap v1.0.10 | pheatmap | RRID:SCR_016418 | |
| Software, Algorithm | GSEA | Broad Institute | RRID:SCR_003199 | |
| Software, Algorithm | EnrichmentMap | Bader Lab | RRID:SCR_016052 | |
| Software, Algorithm | Cytoscape | Institute for Systems Biology; Washington; USA; University of California at San Diego; California; USA | RRID:SCR_003032 | |
| Software, Algorithm | UCSC Genome Browser | University of California at Santa Cruz; California; USA | RRID:SCR_005780 | |
| Software, Algorithm | STAR v2.5.3a | STAR | RRID:SCR_015899 | |
| Software, Algorithm | LIMMA v3.36.5 | LIMMA | RRID:SCR_010943 | |
| Software, Algorithm | WGCNA | University of California at Los Angeles; California; USA | RRID:SCR_003302 | |
| Software, Algorithm | 16 p resource Code | Kristin L. Muench | RRID:SCR_016845 | |
| Other | Genome-Wide Human SNP Array, 6.0 platform | Affymetrix | Performed by CapitalBio Corp., Beijing, China | |
| Other | Ultra-low attachment and ultra-low cluster 96-well plates | Corning | Cat. No. CLS3474 | |
| Other | Lumox 50 mm plates | Sarstedt | Cat. No. 833925 | |
| Other | NextSeq 500 | Illumina | Performed byStanford Functional Genomics Facility, Stanford, California, U.S.A. |
Additional files
-
Supplementary file 1
Demographic, diagnostic, and breakpoint information.
Abbreviations: NA, not applicable; ND, not determined.
- https://cdn.elifesciences.org/articles/58178/elife-58178-supp1-v2.xlsx
-
Supplementary file 2
Pluripotency, vector silencing, and neural competency information.
(A) Subset summary of quality control data for hiPSC reprogramming and differentiation. (B) Entire quality control data for hiPSC reprogramming and differentiation. Abbreviations: NA, not applicable; ND, not determined. Plasmids used for the PCR targeted a portion of the plasmid-specific WPRE region.
- https://cdn.elifesciences.org/articles/58178/elife-58178-supp2-v2.xlsx
-
Supplementary file 3
CNVs located outside the 16p11.2 chromosomal locus.
SNP array analysis revealed hiPSC-clone-specific CNVs throughout the genome. Their copy number, location, and size are listed.
- https://cdn.elifesciences.org/articles/58178/elife-58178-supp3-v2.xlsx
-
Supplementary file 4
Gene sets significantly enriched in ranked list of DESeq2 output Comparing Int+ and Int- Clones.
All genes submitted to DESeq2 were ranked according to the -log10 of adjusted p-value and the sign of their fold change, such that the top of the list represented upregulated and significant genes, and the bottom of the list downregulated and significant genes, with non-significant and high p-value genes toward the middle. Gene sets were generated by GSEA and additional annotation provided by Enrichment Map.
- https://cdn.elifesciences.org/articles/58178/elife-58178-supp4-v2.xlsx
-
Supplementary file 5
Differentially expressed genes in 16p11.2 deletion clones relative to control clones.
Annotated differentially expressed gene list generated by DESeq2. Genes are ranked by adjusted p-value.
- https://cdn.elifesciences.org/articles/58178/elife-58178-supp5-v2.xlsx
-
Supplementary file 6
DAVID gene ontology enrichment analysis.
Gene ontology enrichments were ordered by unadjusted p-values.
- https://cdn.elifesciences.org/articles/58178/elife-58178-supp6-v2.xlsx
-
Supplementary file 7
GSEA output following WGCNA gene identification.
Pathways as characterized as upregulated (‘na_pos’) within the set of genes that make up the modules blue, bisque4, salmon, and pink4.
- https://cdn.elifesciences.org/articles/58178/elife-58178-supp7-v2.xlsx
-
Transparent reporting form
- https://cdn.elifesciences.org/articles/58178/elife-58178-transrepform-v2.docx
Download links
A two-part list of links to download the article, or parts of the article, in various formats.
Downloads (link to download the article as PDF)
Open citations (links to open the citations from this article in various online reference manager services)
Cite this article (links to download the citations from this article in formats compatible with various reference manager tools)
16p11.2 microdeletion imparts transcriptional alterations in human iPSC-derived models of early neural development
eLife 9:e58178.
https://doi.org/10.7554/eLife.58178


