Stem cell regionalization during olfactory bulb neurogenesis depends on regulatory interactions between Vax1 and Pax6
- Aix Marseille Univ, CNRS, IBDM, Campus de Luminy, France
- Department of Obstetrics, Gynecology, and Reproductive Sciences and the Center for Reproductive Science and Medicine, University of California, San Diego, United States
Figures
Figure 1
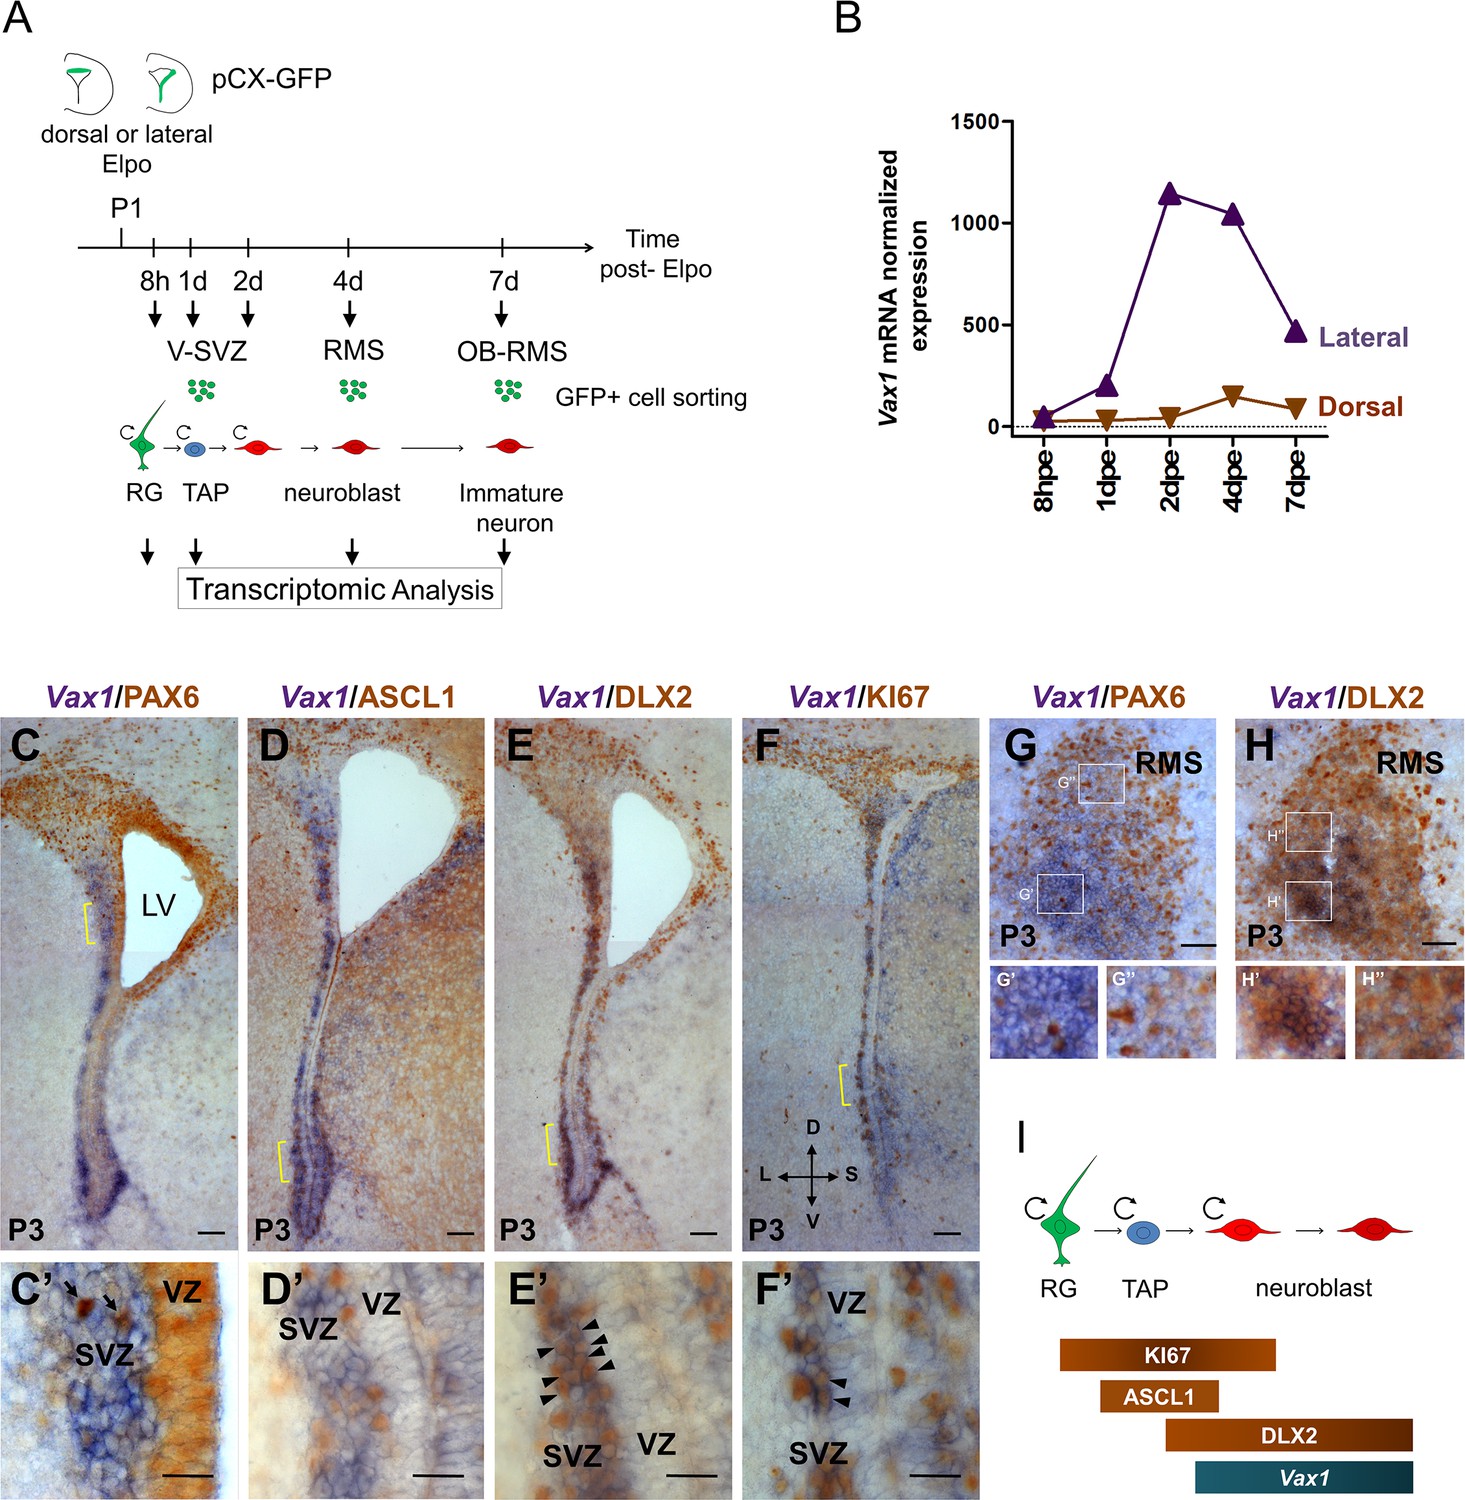
Vax1 is expressed in the lateral V-SVZ.
(A) Representation of the strategy used for transcriptomic analysis in time and space in the dorsal and lateral OB lineages. pCX-GFP plasmid was introduced into neural stem cells (NSCs) residing within the dorsal or lateral V-SVZ and GFP-positive cells were isolated by FACS at different time points after electroporation (Elpo). The mRNA content was analyzed by micro-array (Tiveron et al., 2017). (B) Quantification of Vax1 mRNA expression detected by micro-array analysis in dorsal (brown) and lateral (purple) progenies during neurogenesis. (C–H) In situ hybridization revealing Vax1 mRNA (in blue) combined with immuno-histochemistry using antibodies detecting (in brown) PAX6 (C, C’, G), ASCL1 (D, D’), DLX2 (E, E’, H) or KI67 (F, F’) proteins in the V-SVZ (C–F) or RMS (G, H) at postnatal day 3 (P3). (C’–F’) High magnification of cellular staining in the V-SVZ (area indicated by the yellow bracket in C-F). Arrows (C’): examples of strong PAX6 only positive cell in the dorso-lateral SVZ; blue staining underneath labels cells from a distinct plane. Arrow heads (E’, F’): double positive cells for DLX2 and KI67, respectively. High magnification of the RMS highlights the differential expression of Vax1 and Pax6 along the dorso-ventral axis (G’,G”) and the co-localization with Dlx2 (H’,H”). (I) Schematic representation of gene expression profile in different cell types of the neurogenic sequence. Circular arrow indicates proliferating cells. LV: lateral ventricle, RG: radial glia, TAP: transit amplified precursor, VZ: ventricular zone, SVZ: sub-ventricular zone. D: dorsal, L: lateral, S: septal, V: ventral. Scale bars: 100 µm (C–F), 20 µm (C’–F’), 50 µm (G–H).
Figure 2 with 2 supplements

Vax1 is necessary for the production of Calbindin-positive interneurons in the olfactory bulb.
(A) Representation of the Vax1 conditional allele (Vax1cKO) and the the inducible reporter tdTomato allele in the Rosa26 locus (R26tdTom). Right panel: strategy used to recombine the Vax1 mutant allele in the V-SVZ cells in the lateral wall at postnatal day 0 (P0). TdTomato (Tom)-positive cells were analyzed 15 days post-electroporation (dpe) in the olfactory bulb (OB). (B) Images showing the distribution of Tom+ cells (in red) in the OB at 15dpe in control and mutant brains. Nuclei (in blue) are stained by Hoechst. (C) Quantification of granule cells (GC) number in the OB GCL in both conditions. Data are shown as means ± SD, dots represent individual animals. WT: n = 12, Vax1cKO: n = 17. (D) Images showing Calbindin+ (in green) and Tom+ cells in the GL at 15dpe. Arrow heads indicate double stained neurons. High magnification of representative double positive cells is shown below. (E) Quantification of the percentage of Calbindin+ neurons among the Tom+ PGC population (WT: n = 11, Vax1cKO: n = 17) showing reduction of CB-N in the mutant. GCL: granule cell layer, GL: glomerular layer. *p≤0.05. Scale bars: 200 µm (B), 50 µm (D).
-
Figure 2—source data 1
Quantification of tdTomato+ granule cells and Calbindin+ PGC in Vax1 mutant.
- https://cdn.elifesciences.org/articles/58215/elife-58215-fig2-data1-v2.xlsx
Figure 2—figure supplement 1
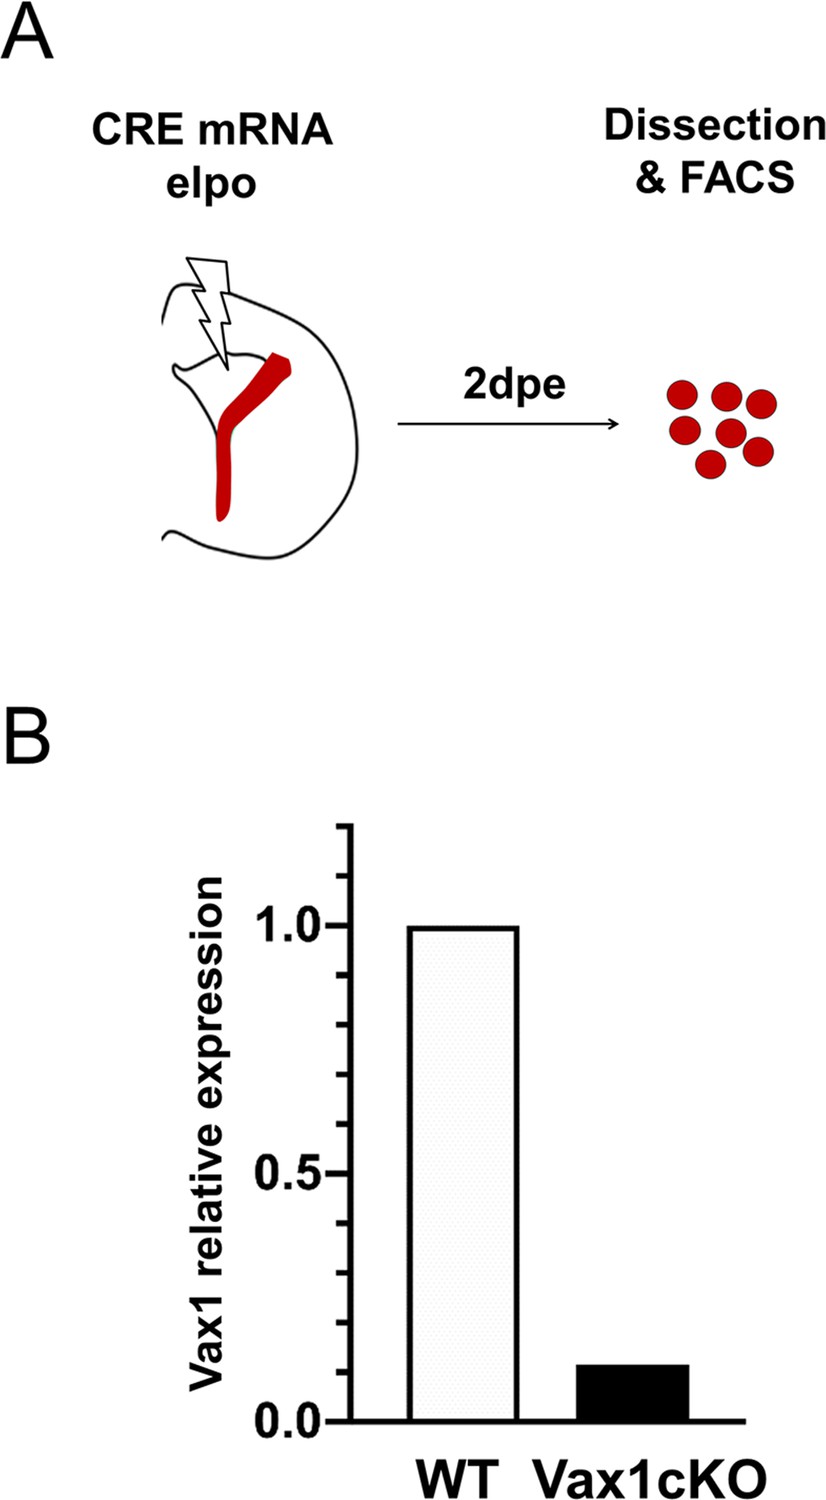
CRE-recombination of the Vax1flox allele in progenitors induce a substantial reduction of Vax1 mRNA expression in the homozygote mutant (Vax1cKO) compared to WT animal.
(A) Strategy used to target lateral V-SVZ NSCs with Cre-mRNA. Tomato+ recombined cells were isolated 2 days after electroporation. (B) Vax1 mRNA level quantified by RT-PCR was normalized to beta-actin and reported in Vax1cKO condition as relative level to control (WT).
Figure 2—figure supplement 2
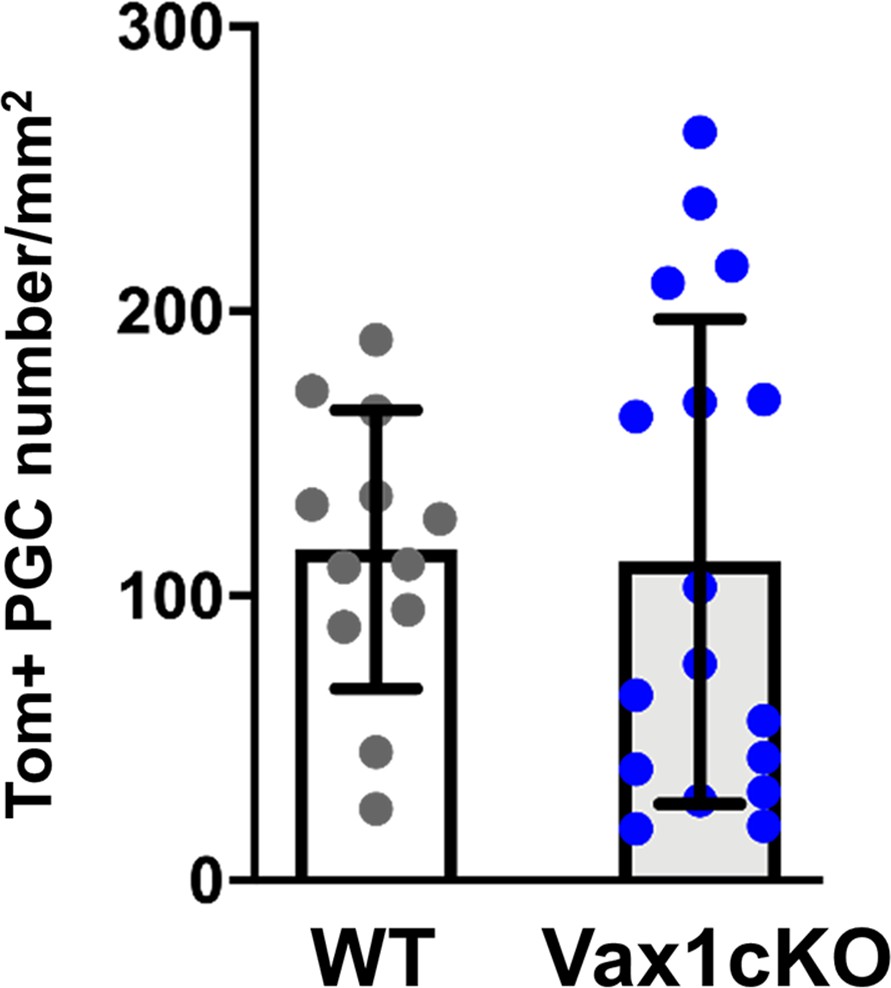
Quantification of tdTomato-positive periglomerular cell (PGC) number in the OB of Vax1 mutant brains.
Cells were analyzed 15 days after electroporation of lateral V-SVZ progenitors by Cre mRNA in WT or Vax1cKO mice. Data are shown as means ± SD, dots represent individual animals. WT: n = 12, Vax1cKO: n = 17.
-
Figure 2—figure supplement 2—source data 1
Quantification of tdTomato+ PGC in Vax1 mutant.
- https://cdn.elifesciences.org/articles/58215/elife-58215-fig2-figsupp2-data1-v2.xlsx
Figure 3 with 1 supplement
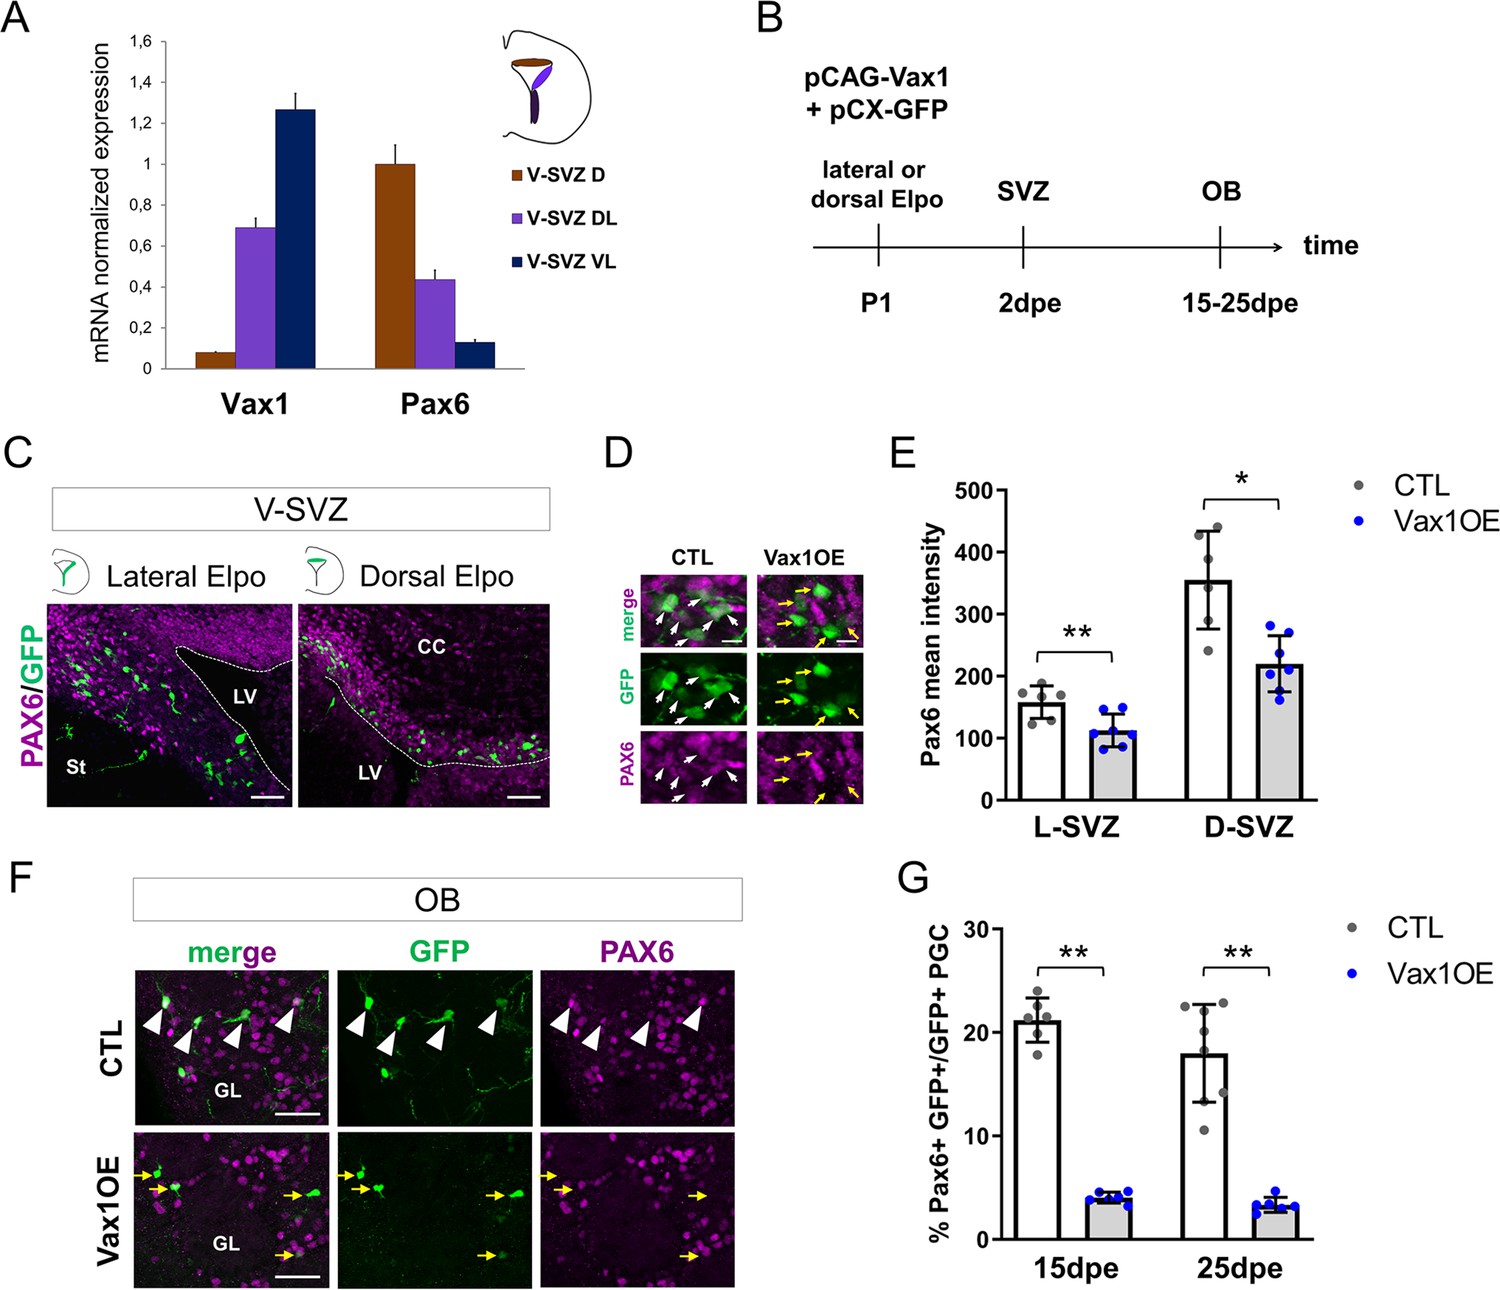
Vax1 inhibits PAX6 expression in the V-SVZ and the OB.
(A) Quantitative RT-PCR revealing Vax1 and Pax6 gene expression in tissue micro-dissected from three distinct areas of the V-SVZ. D: dorsal, DL: dorso-lateral, VL: ventro-lateral. (B) Strategy design for the Vax1 gain-of-function experiment. The Vax1 expressing plasmid (pCAG-Vax1) was introduced into lateral or dorsal progenitors in combination with pCX-GFP by electroporation at P1. Brains were analyzed at different time points in the V-SVZ or the OB. (C) Representative images showing simultaneous expression of PAX6 and GFP proteins in dorsal or lateral lineage in the V-SVZ. (D) High-magnification images illustrating the downregulation of Pax6 in GFP+ cells after electroporation of lateral V-SVZ by Vax1. White arrows: GFP/Pax6 double positive cells, yellow arrows point to cells with reduced or absentPax6 expression. (E) Quantification of PAX6 mean intensity in control or Vax1-overexpressing (OE) V-SVZ GFP+ cells from dorsal (D, n = 6 for the control, n = 7 for Vax1 condition) or lateral (L, n = 6 for the CTL, n = 7 for Vax1 condition) walls. (F) Images showing simultaneous expression of PAX6 and GFP in the OB glomerular layer of control or Vax1OE brains. Arrow head: double GFP/PAX6-positive cells; yellow arrow: GFP only cells. (G) Quantification of GFP+PAX6+ neurons in the OB GL at 15dpe (n = 6 for the CTL, n = 6 for Vax1OE) and 25dpe (n = 8 for the CTL, n = 6 for Vax1OE). PGC: periglomerular cell. *p≤0.05, **p≤0.01. Scale bars: 50 µm (C,F), 10 µm (D).
-
Figure 3—source data 1
Quantification of PAX6 in Vax1-overexpressing progenitors and neurons.
- https://cdn.elifesciences.org/articles/58215/elife-58215-fig3-data1-v2.xlsx
Figure 3—figure supplement 1
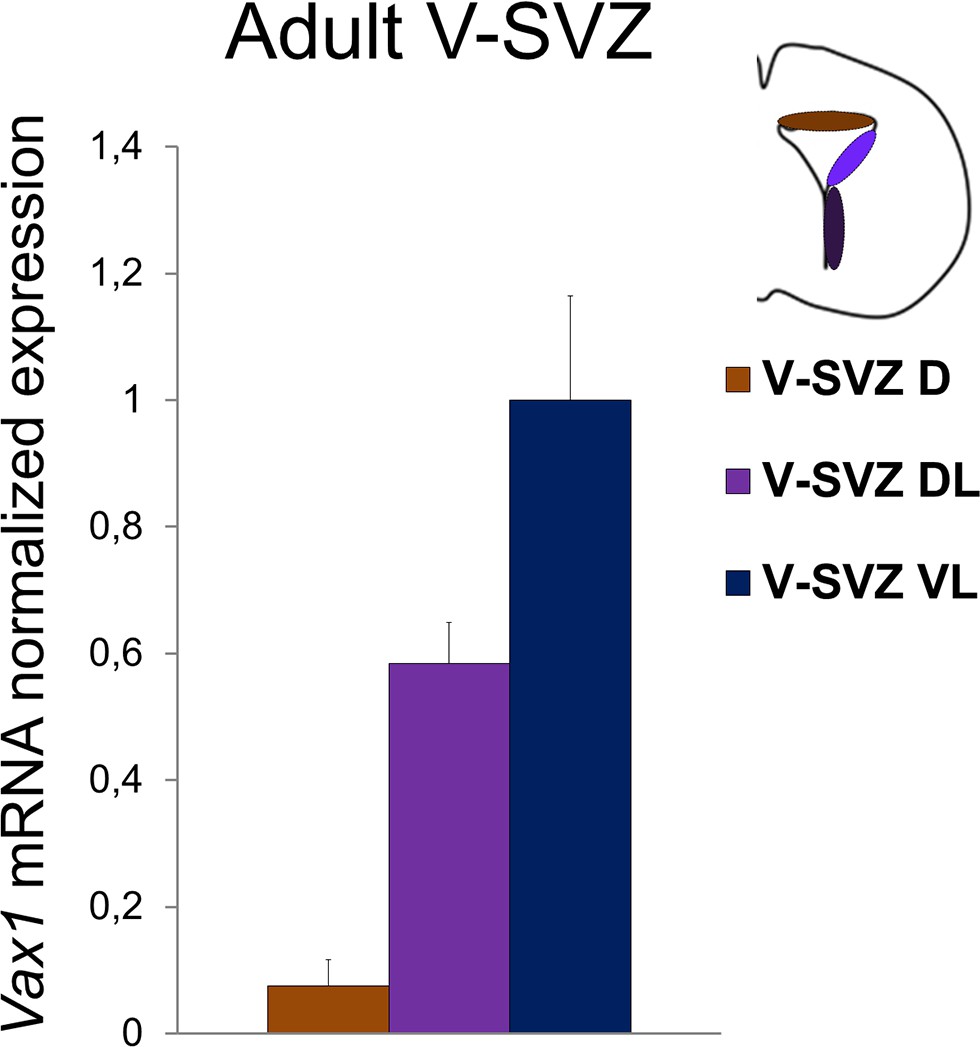
Quantitative RT-PCR revealing Vax1 gene expression in adult brain.
Cells were dissected out from three distinct areas of the V-SVZ. Error bars represent technical triplicate. D: dorsal, DL: dorso-lateral, VL: ventro-lateral.
Figure 4 with 1 supplement
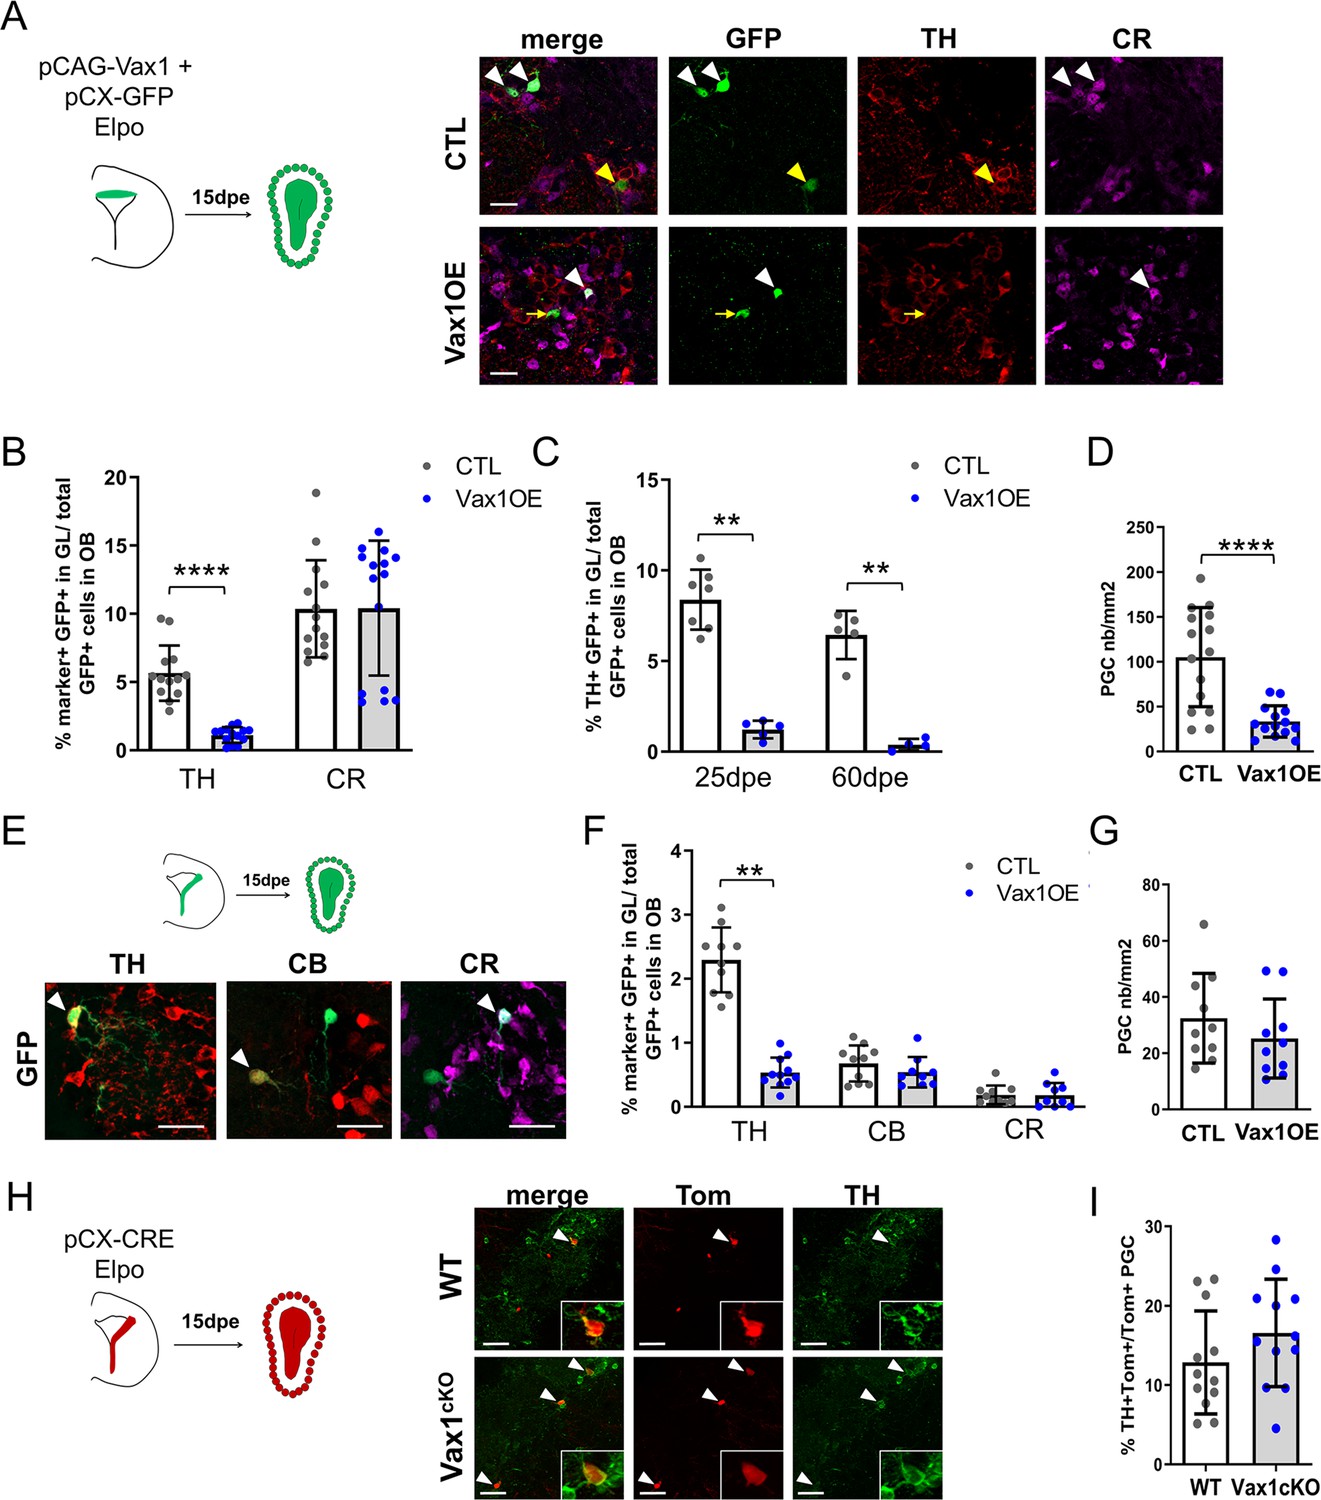
Overexpression of Vax1 in V-SVZ neural stem cells inhibits dopaminergic phenotype.
(A) Experimental design (left) for the electroporation of NSCs in the dorsal wall with pGAC-Vax1 + pCX-GFP. Images (right) showing expression of Tyrosine Hydroxylase (TH) and Calretinin (CR) in the OB glomerular layer 15 days after electroporation in Vax1 over-expression (OE) and control brains. White arrow head: GFP/CR- double positive neuron, yellow arrow head: GFP/TH double positive neuron, yellow arrow: GFP-only cell. (B) Histogram showing the reduction of the density of GFP+ periglomerular cells (PGC) in the Vax1OE OB (CTL n = 15, Vax1 n = 14). (C) The quantification of TH+ and CR+/GFP-positive cells shows a large decrease of the proportion of dopaminergic neurons among the total GFP+ cells in the OB of Vax1 condition (TH n = 14, CR n = 15) compared to control (n = 13/14). (D) The reduction of the TH+ population is sustained with time as it is still observed at 25- (CTL n = 7, Vax1 n = 5) and 60- (CTL n = 5, Vax1 n = 4) days post electroporation. (E) Experimental design (left) for the electroporation of NSCs in the lateral wall with pGAC-Vax1 + pCX-GFP. Representative images (right) of immunostaining with TH, Calbindin (CB), and CR antibodies in the OB GL. Arrow head: example of double positive staining with GFP for each marker. (F) Histogram presenting the quantification of the three different neuronal populations among the GFP+ neurons in the OB of control (n = 10 for each marker) or Vax1OE (TH n = 11, CB and CR n = 9) conditions. (G) Histogram showing the density of GFP + PGC in both conditions (CTL n = 10, Vax1 n = 10). (H) Lateral NSCs of Vax1cKO: rosa26tdTom brains were electroporated at birth with pCX-CRE and neuronal phenotype was analyzed in OB at 15 dpe. Representative images of TH staining in the GL of control or Vax1 deficient OB. Arrow head: GFP+ cells co-labelled with TH. Insert: high magnification of a double positive neuron. (I) Histograms presenting the percentage of TH+ neurons among Tom+ PGC (CTL: n = 12, three independent litters; Vax1: n = 12, three independent litters). A slight increase of the TH+ population was observed in absence of Vax1 compared to control but statistical test (Mann Whitney U test) failed to give significant p values (p=0.16). **p≤0.01, ****p≤0.0001. All scale bars: 20 µm except in H (50 µm).
-
Figure 4—source data 1
Quantification of OB neuronal subpopulations in Vax1- overexpressing or Vax1 mutant mice.
- https://cdn.elifesciences.org/articles/58215/elife-58215-fig4-data1-v2.xlsx
Figure 4—figure supplement 1
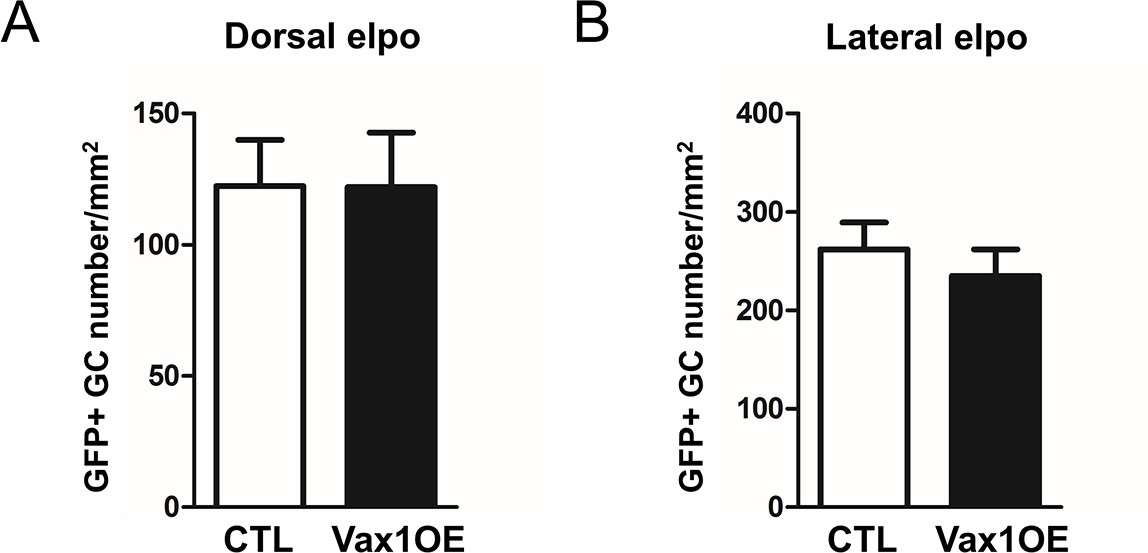
Forced expression of Vax1 has no effect on cell density in the OB granule cell (GC) layer, 15 days after electroporation of dorsal (CTL n = 15, Vax1 n = 14) or (B) lateral (n = 10 for both conditions) V-SVZ progenitors.
Data are represented by mean ± SEM.
Figure 5
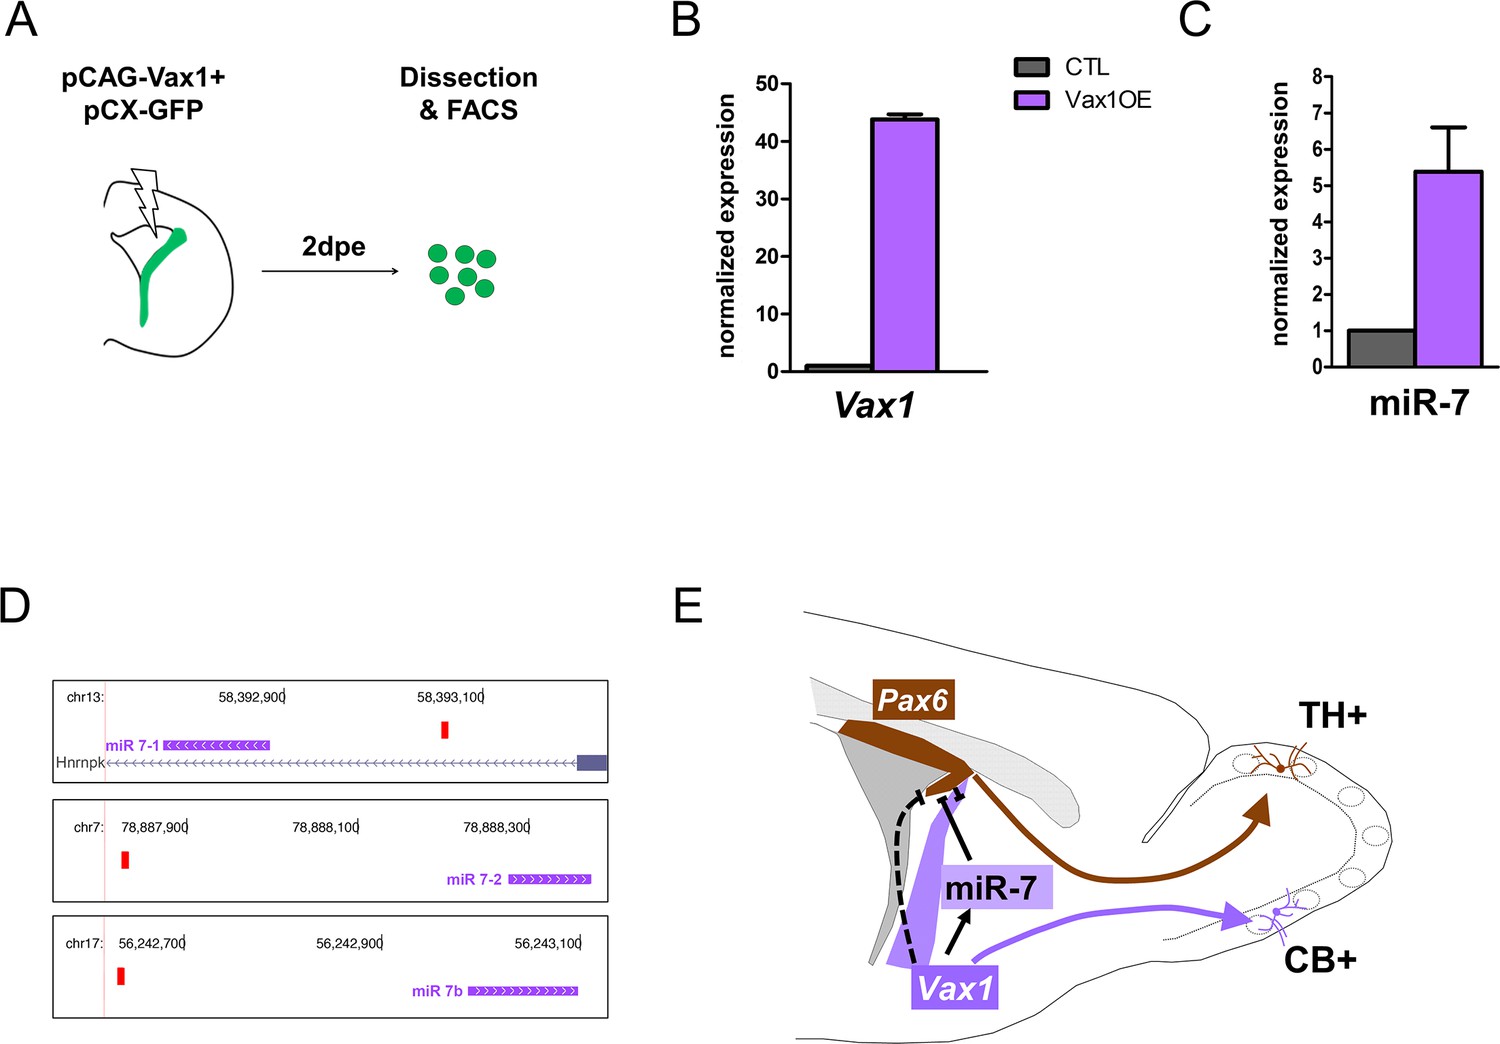
Vax1 induces the expression of miR-7 in the lateral V-SVZ.
(A) Strategy used to determine the expression of microRNAs in Vax1-overexpressing progenitors. PCAG-Vax1 and pCX-GFP were simultaneously introduced into NSCs by electroporation of the lateral wall of postnatal P1 brains. Lateral V-SVZ was dissected out 2 days after electroporation and GFP+ cells were isolated by flow cytometry (FACS) to perform quantitative RT-PCR analysis. (B) Quantification of Vax1 mRNA level by qRT-PCR in control and Vax1OE conditions, normalized to beta-actin and reported in Vax1 condition as relative level to control, validating the overexpression of Vax1 after electroporation. (C) Quantification of miR-7 expression in both conditions. Expression level of miR-7 was normalized by invariant expression of microRNA let-7a and reported in Vax1 condition as relative level to control. Experiments in B and C were performed in triplicate, and data were obtained from (B) two independent biological replications or (C) three technical replications. (D) Genome browser images representing the chromosomal portions encoding the three MiR-7 loci (depicted in pink). Mir-7–1 lies within an intronic sequence of the Hnrnpk gene whereas MiR-7–2 and MiR-7b reside within intergenic sequences. Vax1-binding sites found in the upstream regulatory region of the three MiR-7 are represented by red boxes. (E) Model of cross-regulatory interaction between Vax1, miR-7, and Pax6 in the lateral V-SVZ to control the number of dopaminergic neurons generated by the neural stem cells regionalized in this aspect. This model is supported by our present data and previous work (de Chevigny et al., 2012a) where it was shown that miR-7 was required to inhibit PAX6 expression in lateral NSCs to produce the correct number of dopaminergic neurons in the postnatal OB. Here, we propose that Vax1 acts upstream of miR-7 by positively regulating its expression and consequently inhibiting PAX6. However, it is also possible that Vax1 directly represses the expression of Pax6 mRNA (dashed line) by acting on its promoter (Mui et al., 2005). Additionally, Vax1 is required to generate Calbindin neurons from the ventral aspect of the lateral V-SVZ.
-
Figure 5—source data 1
Quantification of expression level of Vax1 and miR-7 in V-SVZ cells.
- https://cdn.elifesciences.org/articles/58215/elife-58215-fig5-data1-v2.xlsx
Tables
Key resources table
| Reagent type (species) or resource | Designation | Source or reference | Identifiers | Additional information |
|---|---|---|---|---|
| Strain, strain background (Mus musculus) | Vax1flox | PMID:27013679 | RRID:MGI:5796178 | |
| Strain, strain background (Mus musculus) | Gt(ROSA)26Sortm14(CAG-tdTomato)Hze (Ai14) | Jackson Laboratories | RRID:IMSR_JAX:007914 | |
| Strain, strain background (Mus musculus) | CD1 | Charles River | Crl : CD1(ICR) RRID:IMSR_CRL:022 | |
| Sequence-based reagent | Mouse Vax1 cDNA | GenBank | BC111818 | |
| Sequence-based reagent | Cre mRNA | Miltenyi Biotec | 130-101-113 | |
| Recombinant DNA reagent | pCX-EGFP (plasmid) | PMID:17934458 | Dr Xavier Morin (CNRS, Aix-Marseille University) | |
| Recombinant DNA reagent | pCX-CRE (plasmid) | PMID:17934458 | Dr Xavier Morin (CNRS, Aix-Marseille University) | |
| Antibody | Anti-digoxigenin (Sheep polyclonal) | Roche | 11093274910 RRID:AB_514497 | IHC (1:1000) |
| Antibody | Anti-Pax6 (Rabbit polyclonal) | Millipore | AB2237 RRID:AB_1587367 | IF, IHC (1: 1000) |
| Antibody | Anti-Ascl1 (mouse monoclonal) | BD Biosciences | 556604 RRID:AB_396479 | IHC (1:100) |
| Antibody | Anti-Ki67 (mouse monoclonal) | BD Biosciences | 550609 RRID:AB_393778 | IHC (1:200) |
| Antibody | Anti-Dlx2 (guinea pig polyclonal) | Prof. K. Yoshikawa, Osaka University, Osaka, Japan | PMID:16707790 | IHC (1: 2000) |
| Antibody | Anti-Calbindin D-28K (Rabbit polyclonal) | Millipore | AB1778 RRID:AB_2068336 | IF (1 :1000) |
| Antibody | Anti-Calbindin D-28K (mouse monoclonal) | Swant | 300 RRID:AB_10000347 | IF (1:3000) |
| Antibody | Anti- Calretinin (mouse monoclonal) | Synaptic systems | 214111 RRID:AB_2619906 | IF (1:1000) |
| Antibody | Anti-Tyrosine hydroxylase (chicken polyclonal) | Avès Labs | TYH, RRID:AB_10013440 | IF (1:1000) |
| Commercial assay or kit | SYBR GreenER qPCR SuperMix | ThermoFisher Scientific | 11762100 | |
| Commercial assay or kit | miScript SYBR Green PCR Kit | Qiagen | 218073 | |
| Commercial assay or kit | miRCURY LNA miRNA PCR Assay | Qiagen | 339306 | |
| Commercial assay or kit | miRNAeasy kit | Qiagen | 217004 | |
| Software, algorithm | ZEN Blue | Zeiss | RRID:SCR_013672 | |
| Software, algorithm | Axiovision imaging system | Zeiss | RRID:SCR_002677 | |
| Software, algorithm | Fiji | http://fiji.sc | RRID:SCR_002285 | |
| Software, algorithm | ImageJ | https://imagej.nih.gov/ij/ | RRID:SCR_003070 | |
| Software, algorithm | R Commander | https://CRAN.R-project.org/package=Rcmdr | RRID:SCR_001905 | |
| Software, algorithm | FlowJo | https://www.flowjo.com/solutions/flowjo | RRID:SCR_008520 |
Additional files
Download links
A two-part list of links to download the article, or parts of the article, in various formats.
Downloads (link to download the article as PDF)
Open citations (links to open the citations from this article in various online reference manager services)
Cite this article (links to download the citations from this article in formats compatible with various reference manager tools)
Stem cell regionalization during olfactory bulb neurogenesis depends on regulatory interactions between Vax1 and Pax6
eLife 9:e58215.
https://doi.org/10.7554/eLife.58215


