Membrane characteristics tune activities of endosomal and autophagic human VPS34 complexes
- MRC Laboratory of Molecular Biology, Francis Crick Avenue, United Kingdom
- Babraham Institute, United Kingdom
Figures
Figure 1 with 3 supplements
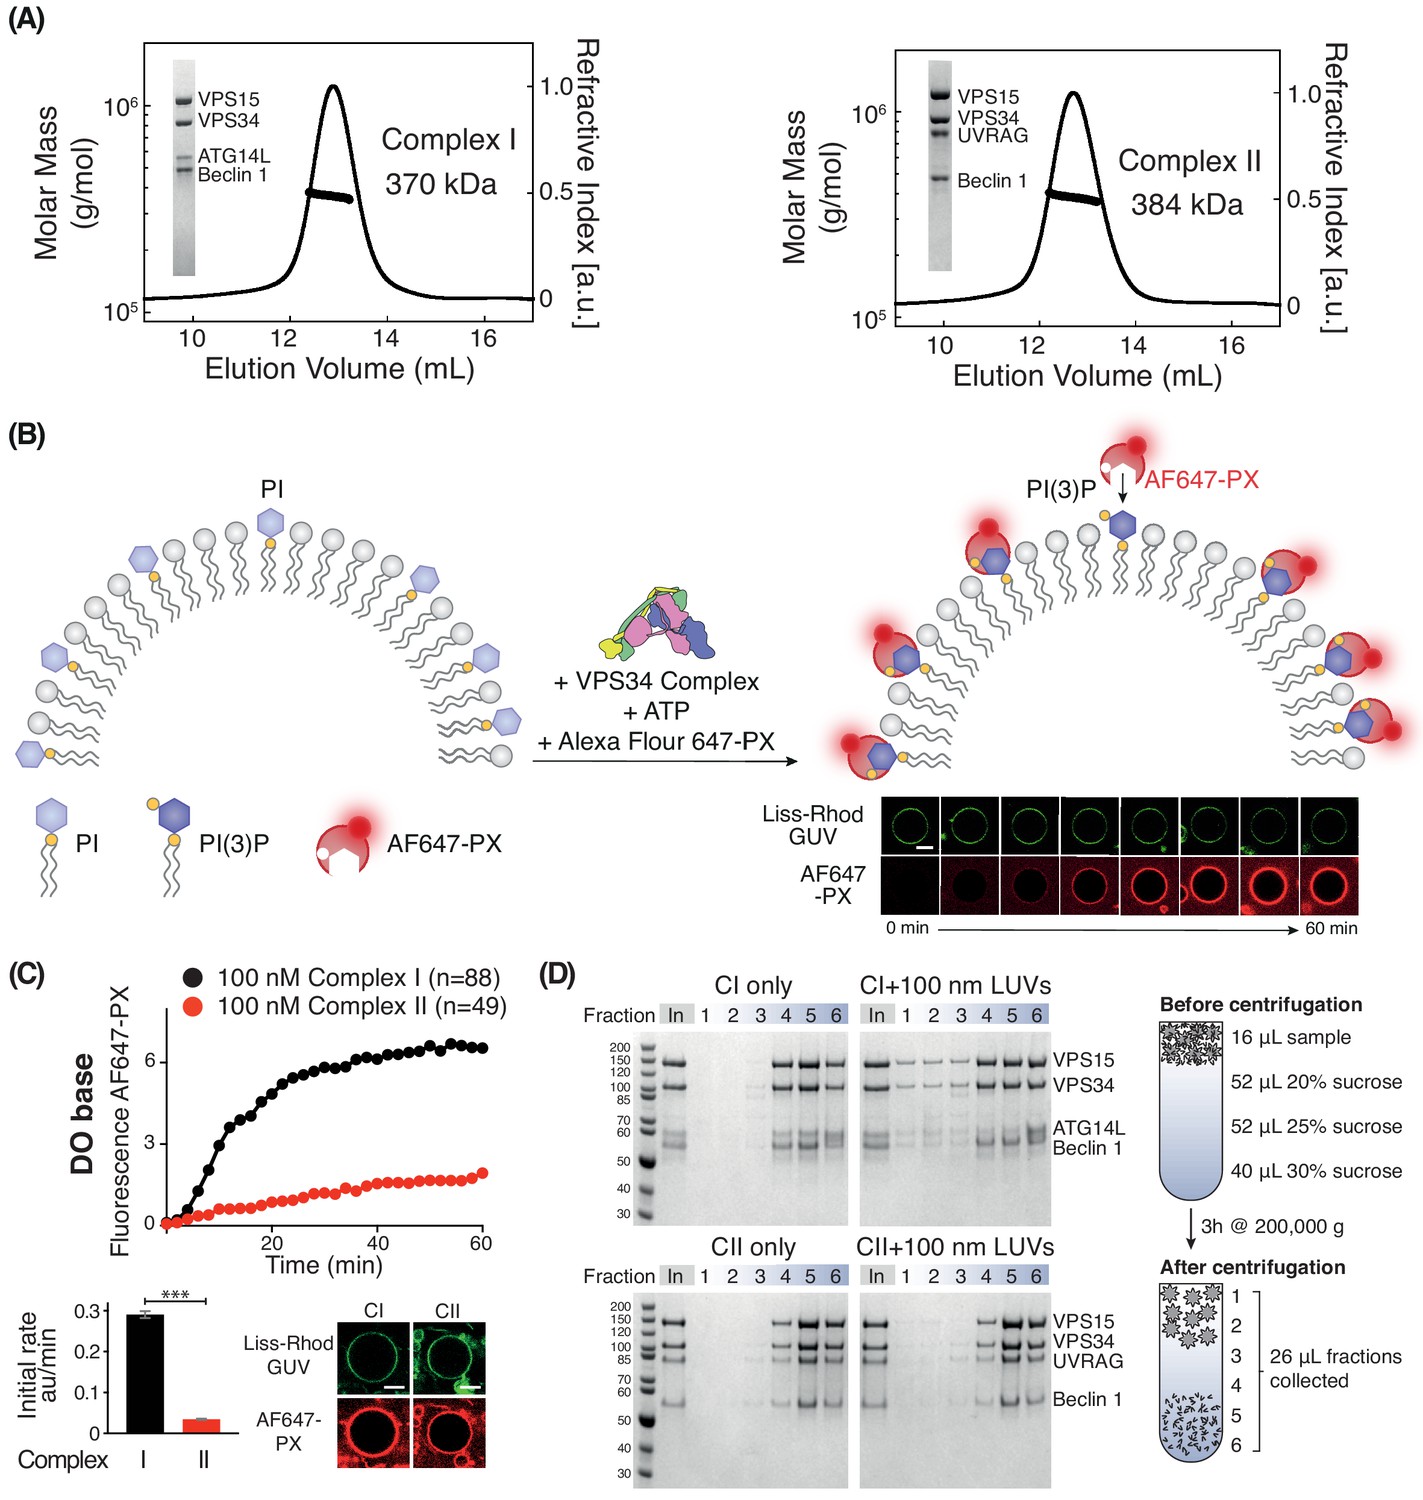
Activities of human complexes I and II on GUVs.
(A) SEC-MALS analysis of purified human Class III PI3K complex I (left panel) and complex II (right panel). The protein samples were run on a Superose 6 10/300 column. Insets: SDS-PAGE of starting material stained with Coomassie staining. Both complex I and complex II are monodisperse, with an average mass for complex I consistent with a 1:1:1:1 Beclin 1/VPS15/VPS34/ATG14L complex (370 kDa, theoretical mass: 363 kDa) and an average mass for complex II consistent with a 1:1:1:1 Beclin 1/VPS15/VPS34/UVRAG complex (384 kDa, theoretical mass: 386 kDa). (B) Assay design for activities of human complexes I and II on GUVs, using confocal microscopy and a labelled PI(3)P-binding p40-PX domain (AF647-PX). Fluorescence from the Lissamine-Rhodamine (Liss-Rhod GUV) channel delineates the membrane, while the AF647 is indicative of VPS34 activity on the membrane. Scale bar: 5 μm. (C) Complex I is more active than complex II on GUVs with ‘DO base’ lipids (18% mixed chain PI, 10% DOPS, 17% DOPE and 55% DOPC). In the lower panels, the initial rates after a lag phase (AF647-PX fluorescence change/min in arbitrary units, AU) and confocal images corresponding to the AF647-PX and Liss-Rhod channels at the end of the reaction are shown. For clarity, only mean values of measurements for each time point in the reaction progress curves are plotted here and throughout all figures. Plots with SDs for each time point are shown in Supplementary file 3. All scale bars: 5 μm. ***: p<0.001 (p<0.0001). Figure 1—figure supplement 2 illustrates some of the raw images that were used for quantification. Scale bars: 15 μm. (D) Membrane binding of complexes I and II using a lipid flotation assay. Large unilamellar vesicles (LUVs, 100 nm) and proteins were mixed and pipetted on a sucrose gradient. The gradient was then centrifuged, fractionated and analysed by SDS-PAGE. Fractions 1–3 are the least dense fractions of a sucrose gradient, containing floating vesicles and membrane-bound proteins. Fractions 5–6 are the highest density sucrose fractions, containing the pelleted proteins. The complexes alone sediment into the denser portion of the gradients (left), but the presence of LUVs cause the complexes to associate with LUVs floating on the top of the gradient (right). Gel quantification can be seen in Figure 1—figure supplement 3.
Figure 1—figure supplement 1

Activities of complexes I and II on GUVs containing cholesterol and sphingomyelin.
(A) Structures of 18:1-Sphingomyelin and Cholesterol. Lipid composition (left, bottom) used to examine the influence of 18:1-Sphingomyelin and Cholesterol on VPS34 activity. (B) Complex I is more active than complex II on GUVs made of DO+SM+Chol with 10% 18:1-SM and 10% cholesterol. For clarity, only mean values are plotted for each time point. Plots with SDs for each time point are in Supplementary file 3. Scale bars: 5 µm. ***: p<0.001, (B) p<0.0001.
Figure 1—figure supplement 2
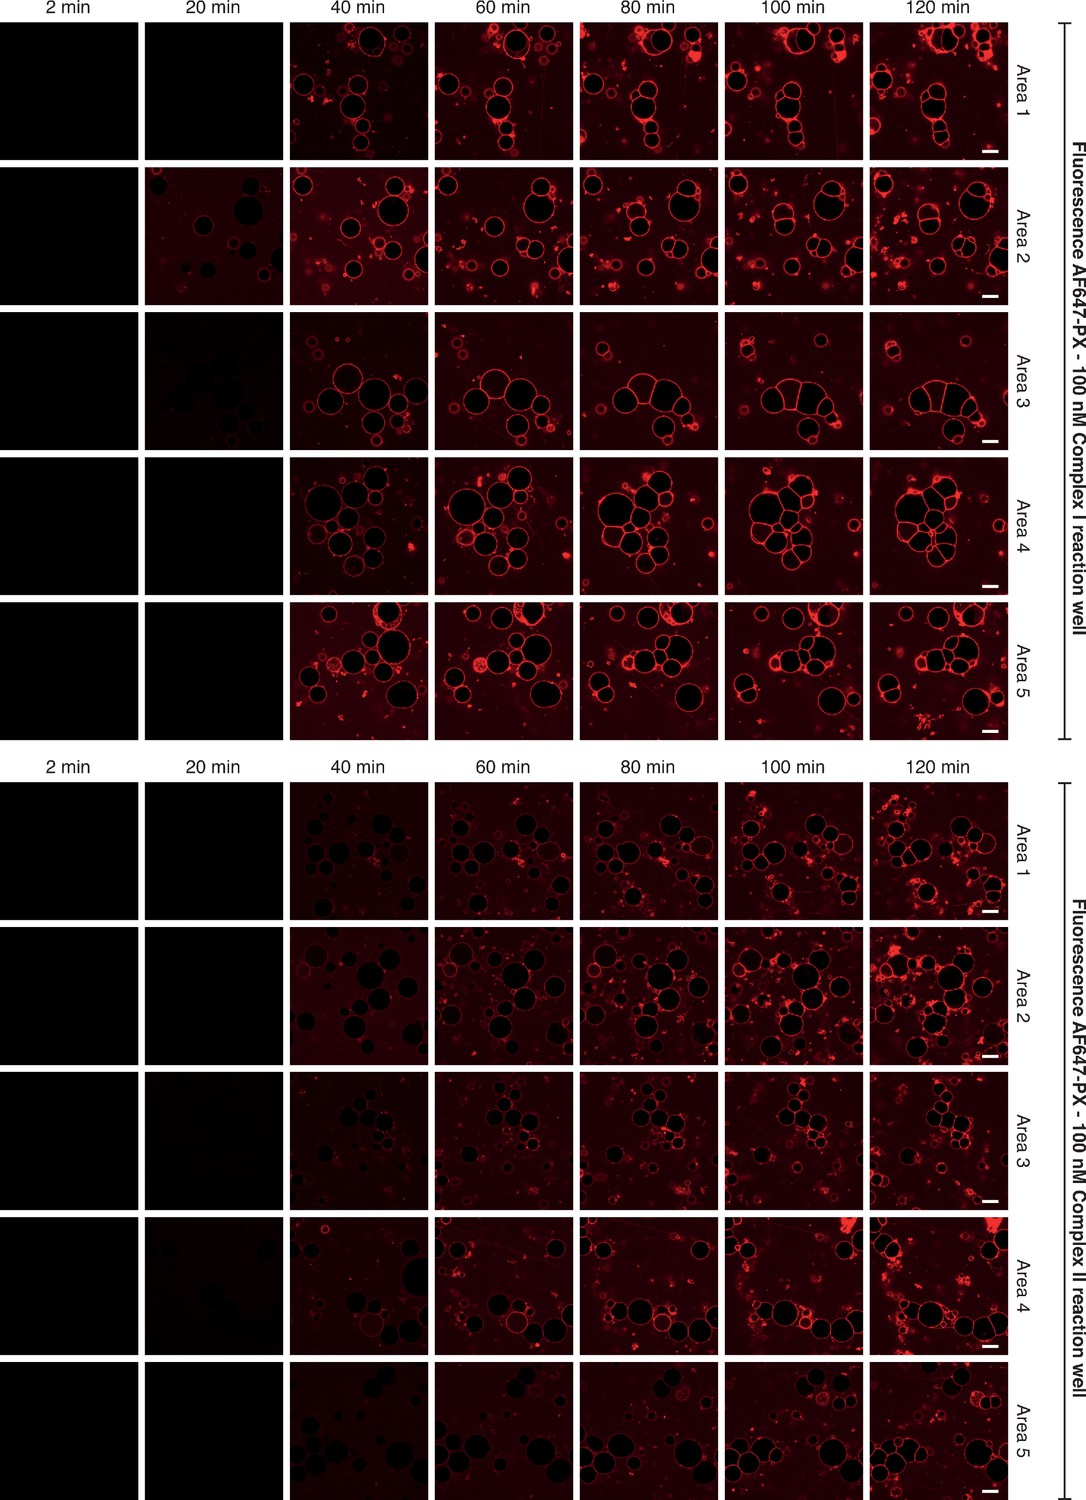
Selected images of GUVs for the time courses shown in Figure 1C.
This illustrates some of the raw images that were collected to obtain the reaction progress curves illustrated in Figure 1C. Five areas per well were randomly selected for imaging. For the time course, images were taken every 2 min for 120 min. Here, only images taken at 2, 20, 40, 60, 80, 100 and 120 min of the time course are depicted for simplicity. Scale bars: 15 µm.
Figure 1—figure supplement 3
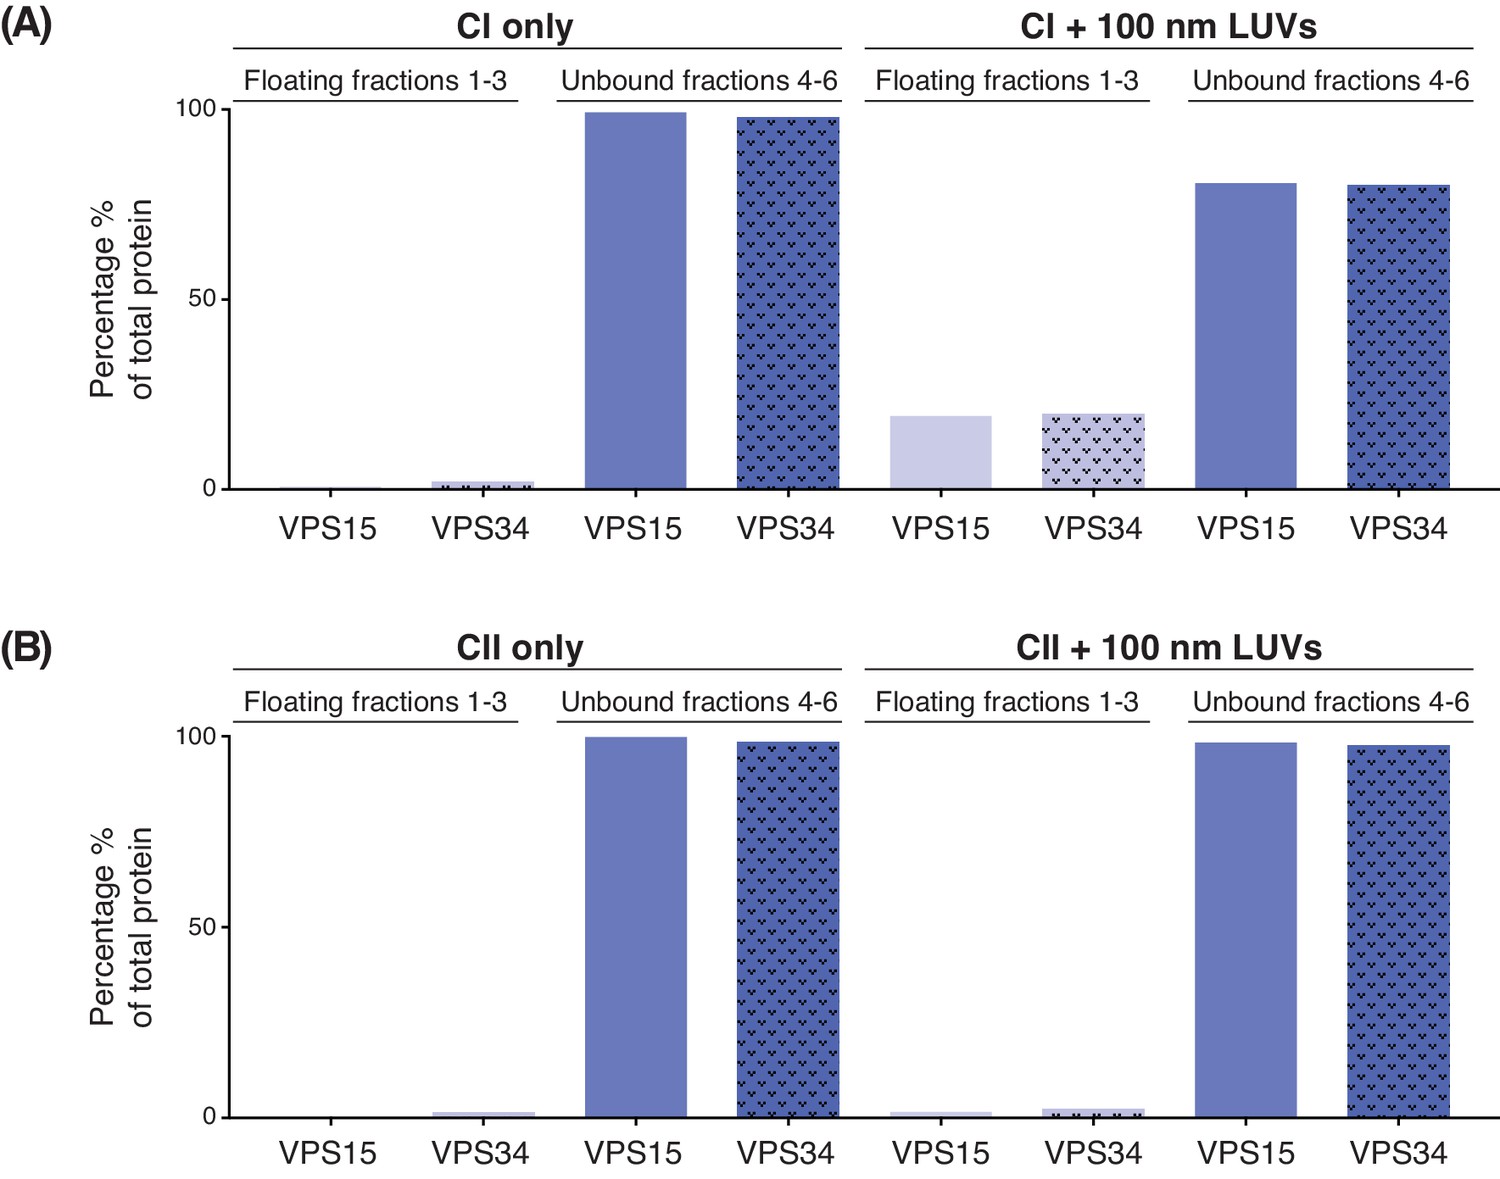
Quantification of membrane binding of complex I (A) and complex II (B) using a lipid flotation assay (Figure 1 (D)).
The amount of VPS15 and VPS34 in the floating fractions 1–3 (light purple) is compared to the amount in the unbound fractions 4–6 (dark purple).
Figure 2
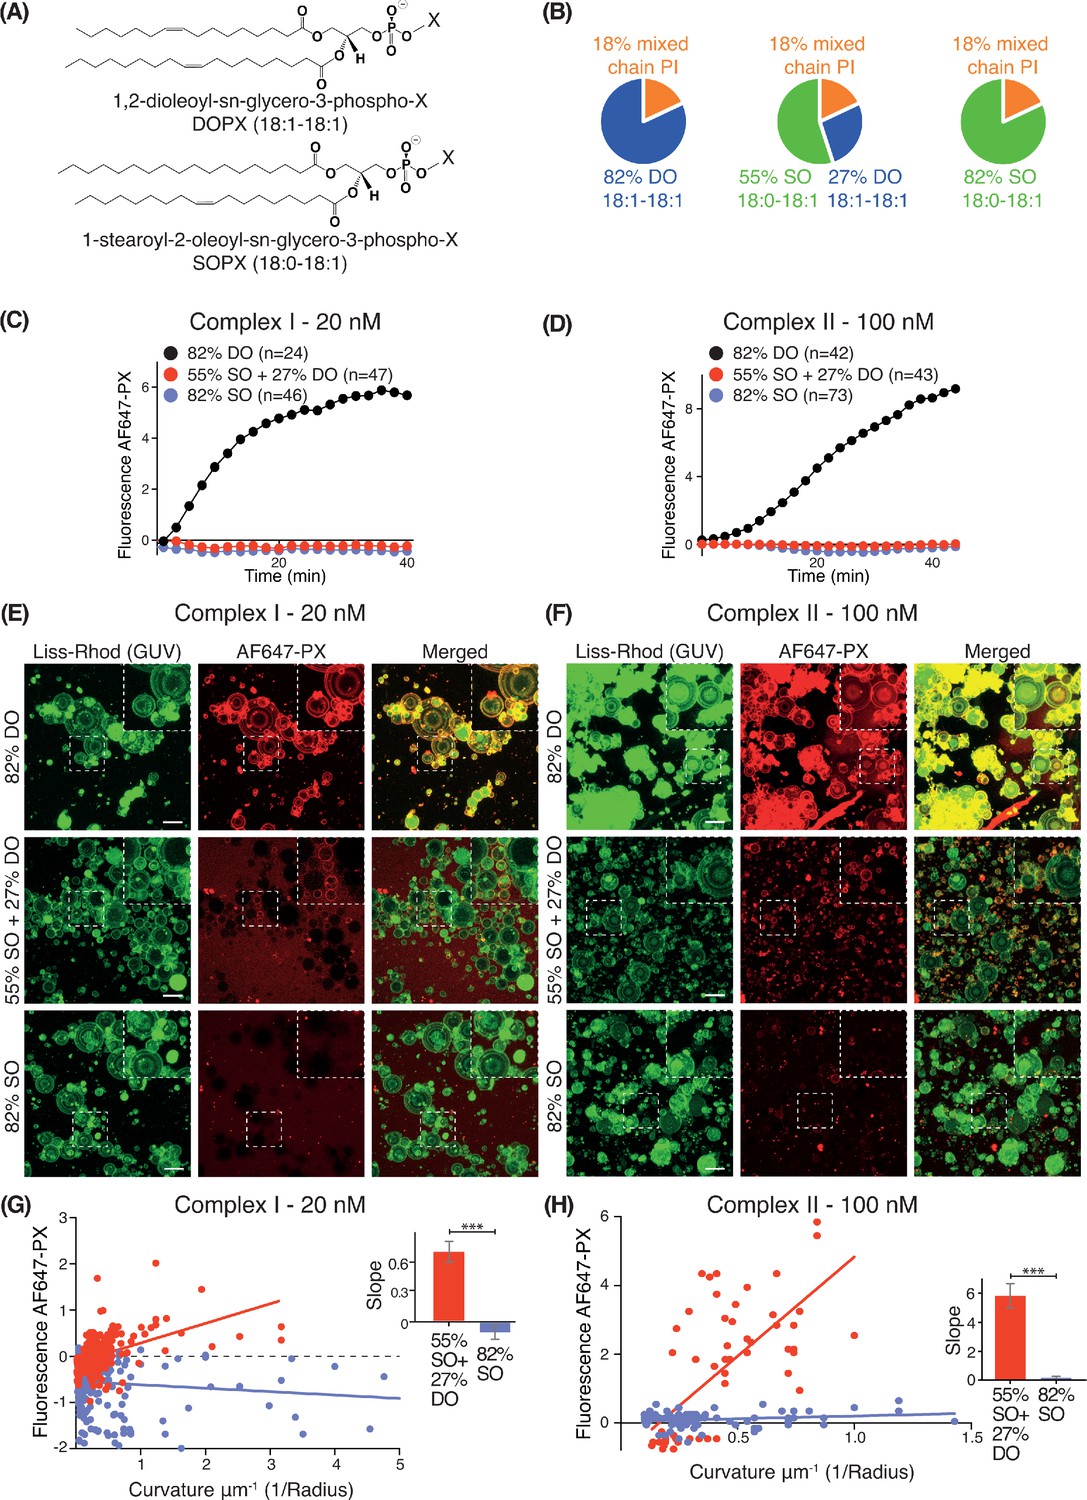
Effect of non-substrate lipid packing on complexes I and II.
(A) Structures of a phospholipid with DO (1,2-dioleoyl) acyl chains or SO (1-stearoyl-2-oleoyl) acyl chains. (B) Lipid mixtures used to examine the effects of saturation of the non-substrate, ‘background’ lipids on activities of complexes I and II. The 82% DO lipids means that all of the background lipids (PC, PS and PE) are 1,2-dioleoyl (DO) lipids. Similarly, 82% SO means all of the background lipids are 1-stearoyl-2-oleoyl. (C) GUV assays for complex I using the lipid compositions shown in (B). Only the DO background lipids (82% DO) show significant activity. (D) GUV assays for complex II as in (C). (E) and (F) Z-stack analysis of (C) and (D). At 60 min, ten Z slices were obtained from an area, then projected into one plane with maximum projection to cover a wide range of sizes. Upper right cropped areas: Magnified images of the boxed areas. Scale bars: 15 µm. (G) and (H) Correlation between fluorescence intensity and membrane curvature (1/GUV Radius) from the same data as in (E) and (F), respectively. Right: Slopes for the plots. ***: p<0.001 (for (G) p<0.0001), (for (H) p<0.0001). For clarity, only mean values are plotted for each time point. Plots with SDs for each time point are in Supplementary file 3.
Figure 3
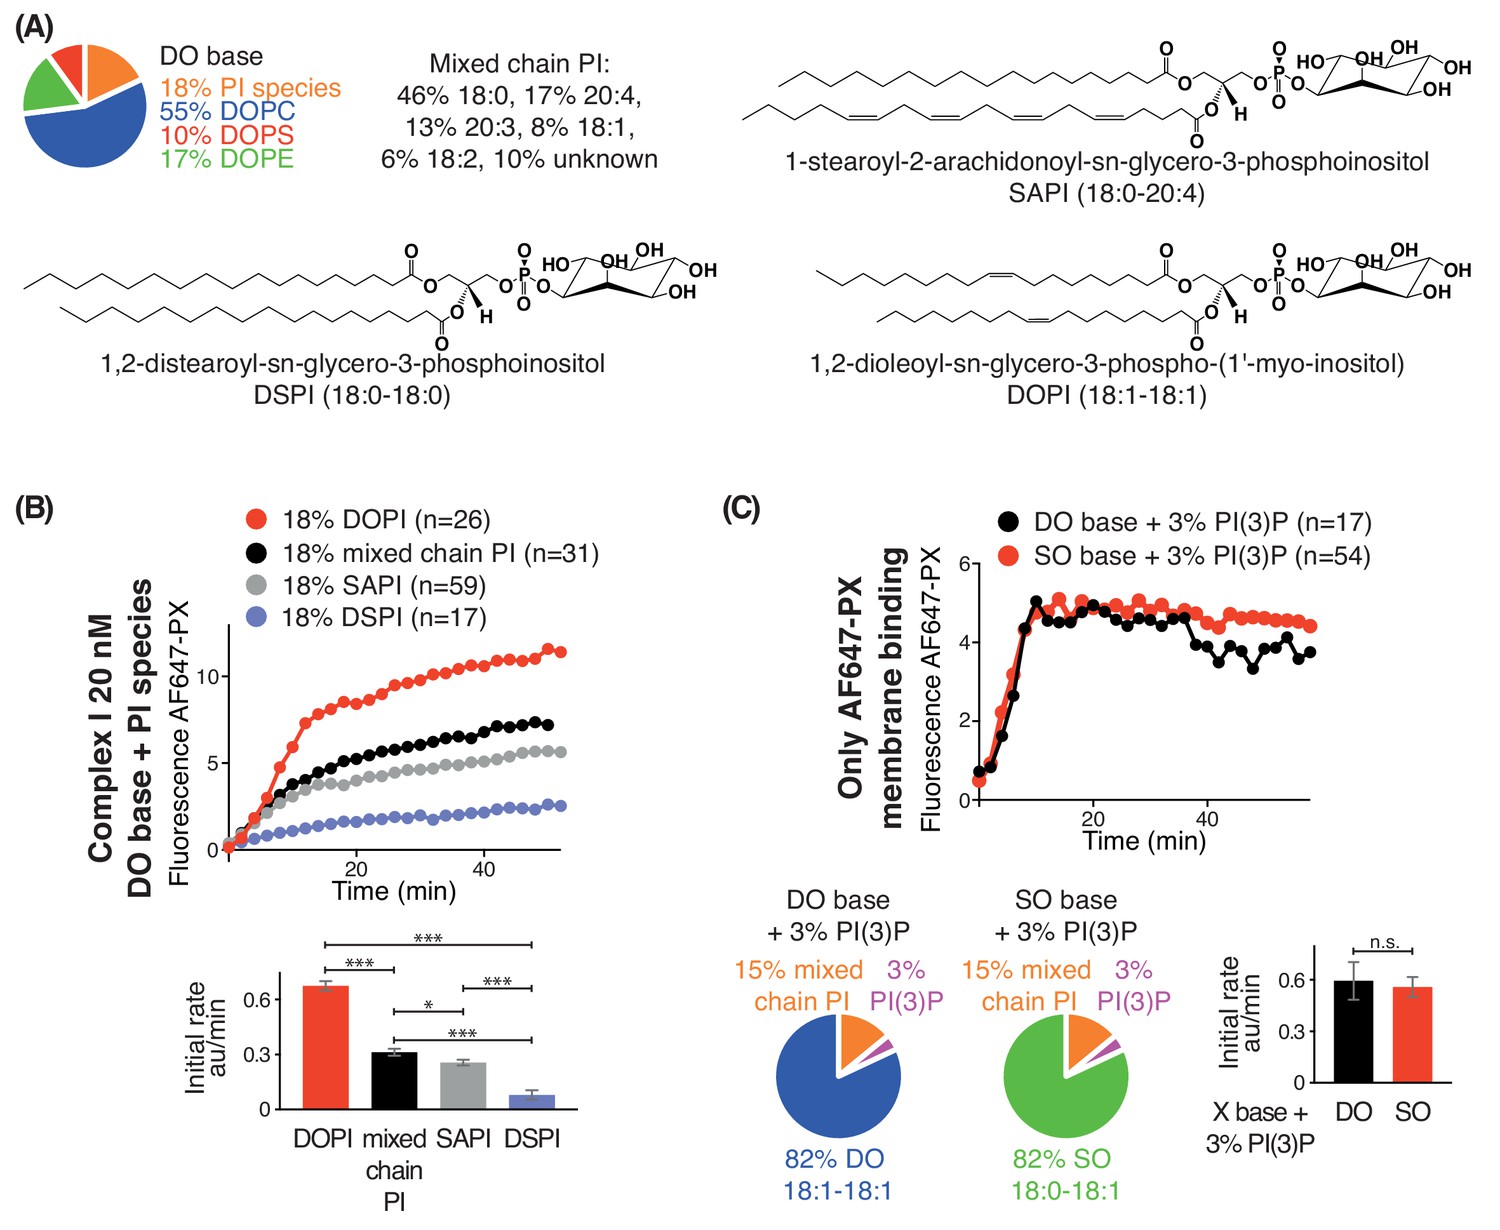
Increasing substrate PI acyl chain unsaturation increases complex I activity.
(A) Structures of the PI lipids used in the context of the DO base background lipids. (B) Activities of complex I on GUVs containing the various PI substrates shown in (A) in the context of DO base background lipids. ***: p<0.001 (for all p<0.0001); *: p<0.05 (mixed chain PI vs SAPI p=0.0250). (C) Binding of the AlexaFlour 647-labelled p40 PX domain to 3% PI(3)P-containing GUVs is not dependent on lipid saturation of the background lipids. n.s.: not significant (p=0.7645). For clarity, only mean values are plotted for each time point. Plots with SDs for each time point are in Supplementary file 3.
Figure 4
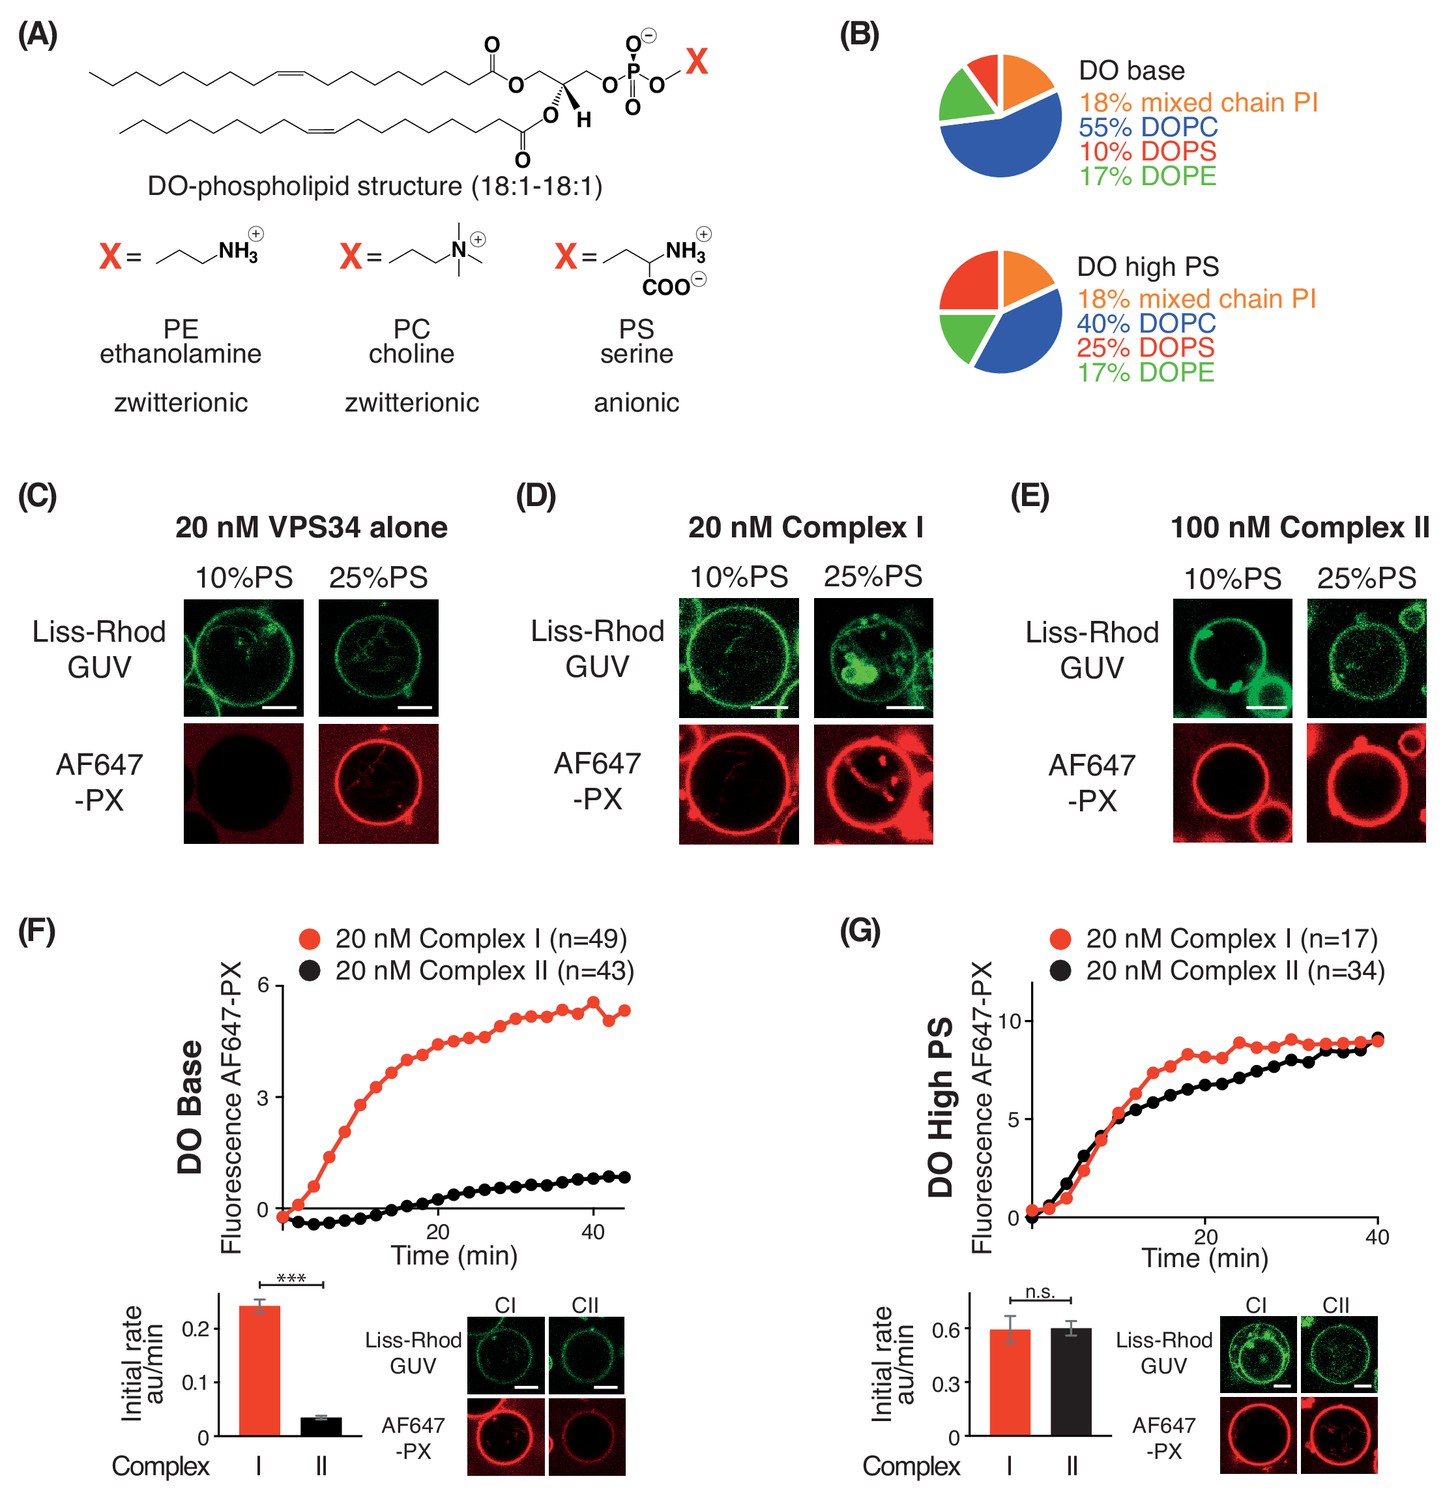
PS is an activator for complex I, complex II, and VPS34 alone.
(A) Structures of DO phospholipid backbone (top) and head group for PE, PC, and PS (bottom). (B) Lipid compositions used to examine the influence of additional PS on VPS34 activity. (C–E) Activities of VPS34 alone, complex I and complex II on GUVs containing 10% PS (DO base) and 25% PS (DO high PS). Images were obtained 60 min after adding enzyme. (C) Activity of VPS34 alone (20 nM) on GUVs with 10% PS (DO base) and 25% PS (DO high PS). (D) Activity of complex I (20 nM) on GUVs with 10% PS (DO base) and 25% PS (DO high PS). (E) Activity of complex II (100 nM) on GUVs with 10% PS (DO base) and 25% PS (DO high PS). (F) and (G) Comparison of complexes I and II (20 nM) on GUVs with 10% PS (DO base) (F), or on 25% PS (DO high PS) (G). (F) ***: p<0.001 (p<0.0001); (G) n.s.: not significant (p=0.9274). For clarity, only mean values are plotted for each time point. Plots with SDs for each time point are in Supplementary file 3. All scale bars: 5 μm.
Figure 5

Analysis of membrane binding of human complex I using HDX-MS.
(A) Representative peptides in complex I that showed significant HDX changes in the presence of lipids. (B) Overview of HDX changes illustrated on a model of human complex I. The model was built using SWISSMODEL and the structure of yeast complex II (PDB ID: 5DFZ). Peptides showing changes in HDX upon membrane binding are indicated by arrows. The model is colored by differences in HDX between the absence and presence of membranes (right inset). The left inset shows a schematic of complex I, identifying the subunits. CC1: coiled-coil I; CC2: coiled-coil II; CC3: coiled-coil III; BARA: β-α-repeated, autophagy-specific domain; C2: C2 domain; Helical: helical domain; Kinase: kinase domain; WD40: WD40 domain; BATS: BATS domain; C-term: ATG14L C-terminal domain.
Figure 6
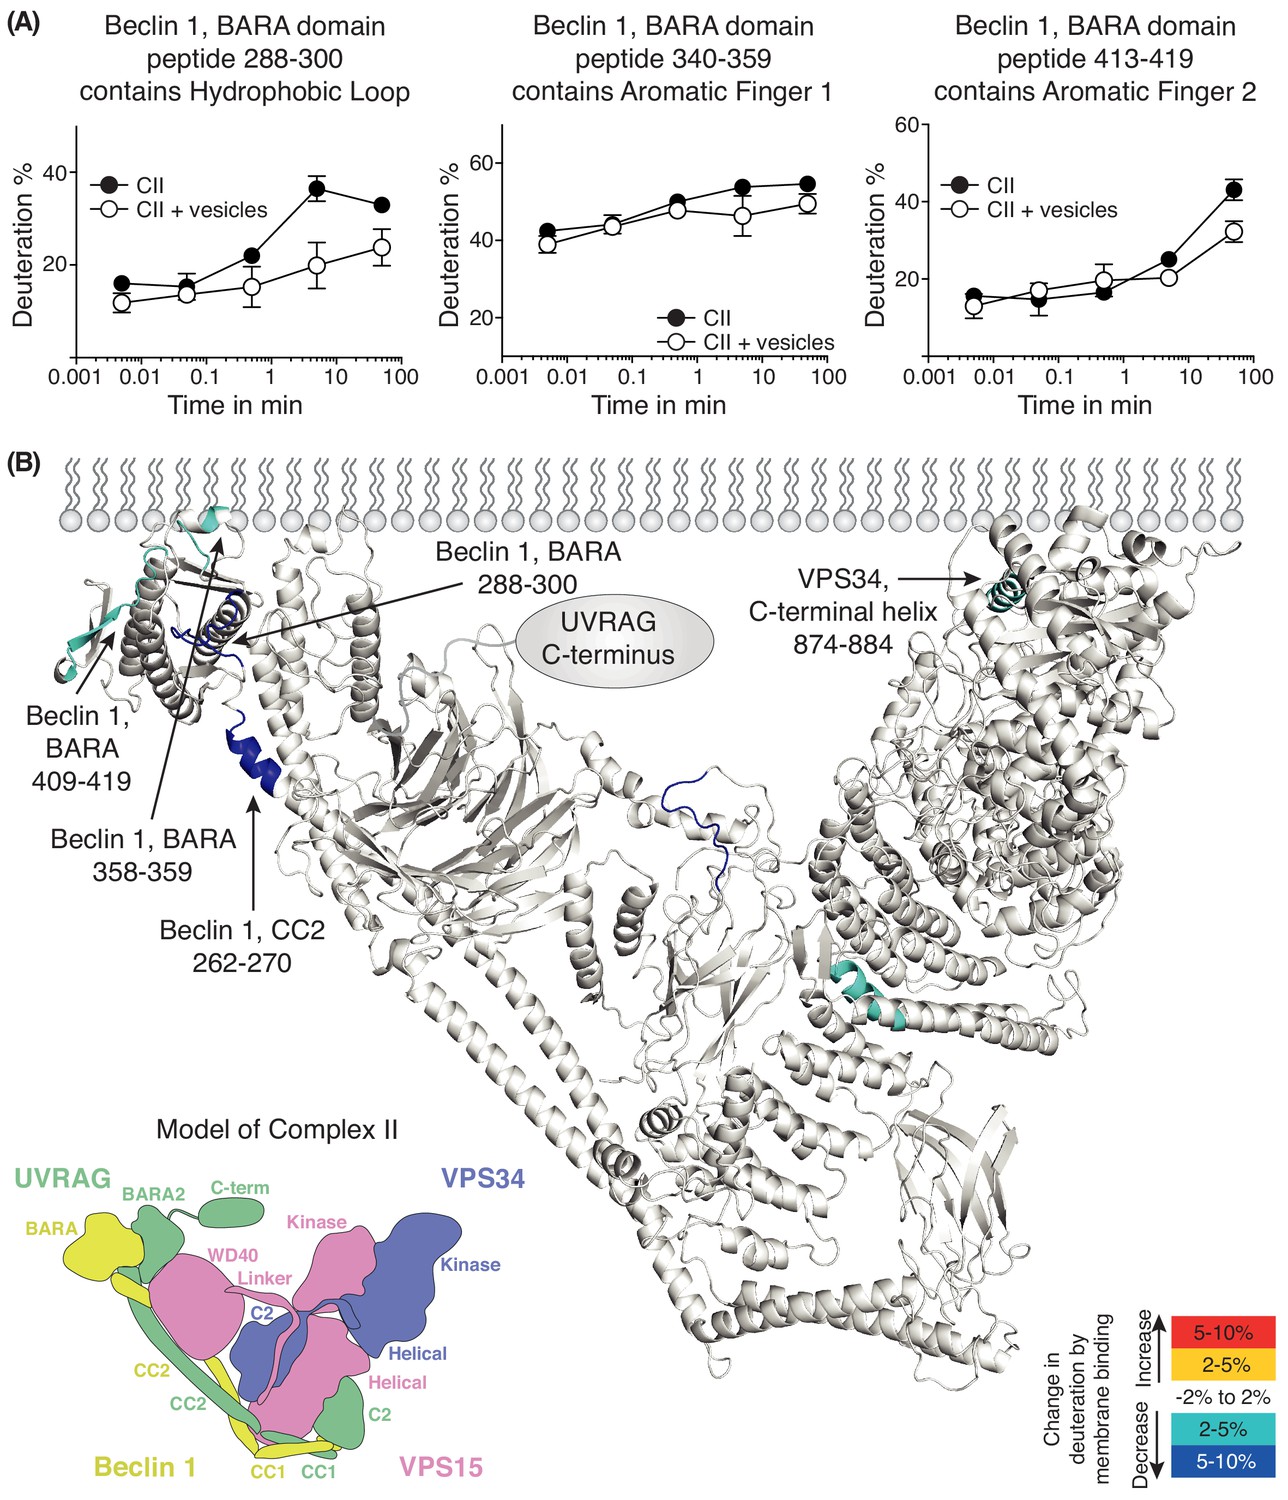
Analysis of membrane binding of human complex II using HDX-MS.
(A) Representative peptides in complex II that showed significant HDX changes in the presence of lipids. (B) Overview of HDX changes illustrated on a model of human complex II. The model was built using SWISSMODEL and the structure of yeast complex II (PDB ID: 5DFZ). Peptides showing changes in HDX upon membrane binding are indicated by arrows. The model is colored by differences in HDX between the absence and presence of membranes (right inset). The left inset shows a schematic of complex II identifying the subunits and domains. CC1: coiled-coil I; CC2: coiled-coil II; BARA: β-α-repeated, autophagy-specific domain; BARA2: BARA2 domain; C2: C2 domain; Helical: helical domain; Kinase: kinase domain; WD40: WD40 domain; C-term: UVRAG C-terminal extension.
Figure 7

Influence of the Amphipathic Lipid Packing Sensor (ALPS) motif in the ATG14L BATS domain on the activities of complexes I and II.
(A) Constructs used to examine the influence of the BATS domain on VPS34 activity in the contexts of complex I and a complex I/II chimera on GUVs. (B) The ALPS motif of the BATS domain is important for the activity of complex I. Upper: Activities of wild-type complex I (WT), and complex I with the ΔALPS mutations on GUVs with DO base lipids. Lower left: Initial rates. Lower right: Confocal micrographs of the GUV assay at 60 min after adding proteins. ***: p<0.001 (p<0.0001). (C) Activities of WT and ΔALPS complex I as well as the VPS34 kinase subunit on its own on GUVs with DO high PS. ***: p<0.001 (for all p<0.0001). (D) Activities on GUVs with DO base lipids for complex II and for fusions of the BATS domain to UVRAG C-terminus. U + BATS: UVRAG + BATS; UΔC + BATS: UVRAGΔC + BATS as illustrated in (A). ***: p<0.001 (for all p<0.0001); **: p<0.01 (CI WT vs CII U+BATS p=0.0059). For clarity, only mean values are plotted for each time point. Plots with SDs for each time point are in Supplementary file 3. All scale bars: 5 μm.
Figure 8
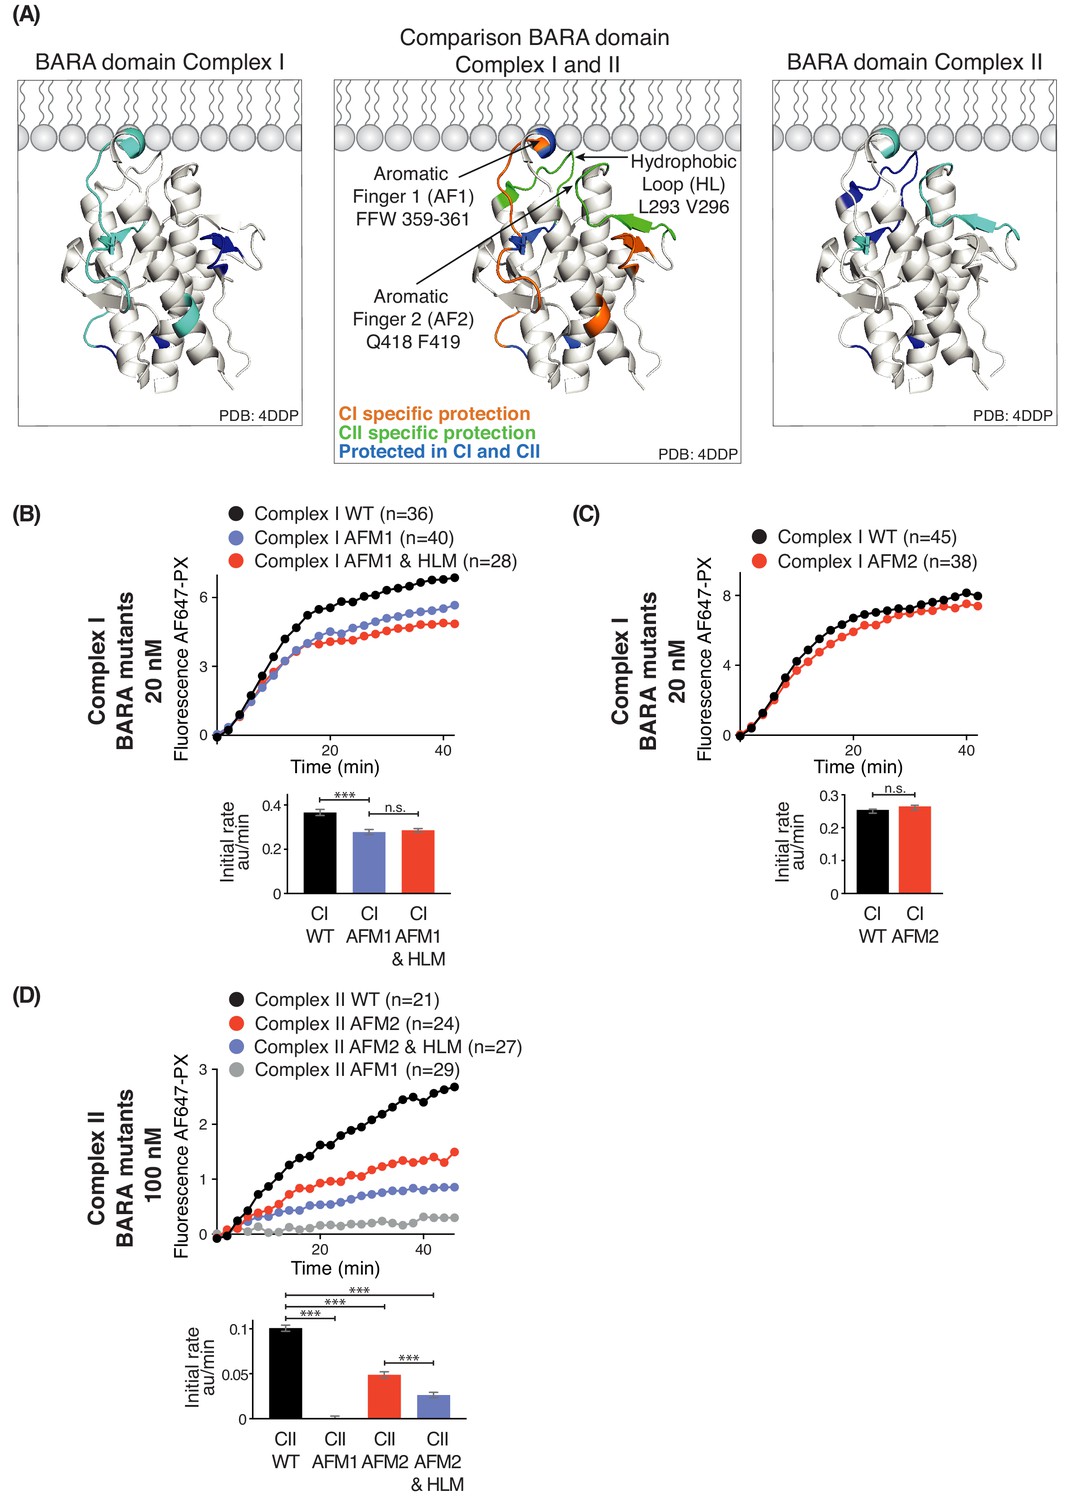
Influence of Beclin 1 BARA domain mutations on the activities of complexes I and II.
(A) Summary of HDX changes for the Beclin 1 BARA domain of human complex I (left) and II (right) overlaid on a ribbon diagram of the structure of the domain (PDB ID 4DDP). In the middle panel, peptides are coloured by whether they are specifically protected in complex I (orange), complex II (green), or both complexes I and II (blue). Elements involved in HDX changes are AF1 (Aromatic finger motif 1; 359-FFW-361), AF2 (Aromatic finger motif 2; 418-QF-419), and HL (Hydrophobic loop; 293-LPSVPV-298). (B–D) Effects of mutations in the membrane-binding elements of complexes I and II on activities using GUVs with DO base lipids. Top: Reaction progress curves. Only mean values are plotted. Plots with SDs are in Supplementary file 3. Bottom: initial rates. (B) AFM1 and HL mutations in the BARA domain modestly affect the activity of complex I on GUVs. Beclin 1 constructs: wild-type (WT), aromatic finger one mutant (AFM1), and AFM1+ hydrophobic loop mutant (AFM1+HLM). ***: p<0.001 (p<0.0001); n.s.: not significant (p=0.4238). (C) AFM2 mutation has no influence on complex I activity. n.s.: not significant (p=0.5186). (D) All of the mutations have an effect on complex II activity. ***: p<0.001 (for all p<0.0001). For clarity, only mean values are plotted for each time point. Plots with SDs for each time point are in Supplementary file 3. ***: p<0.001; n.s.: not significant.
Figure 9
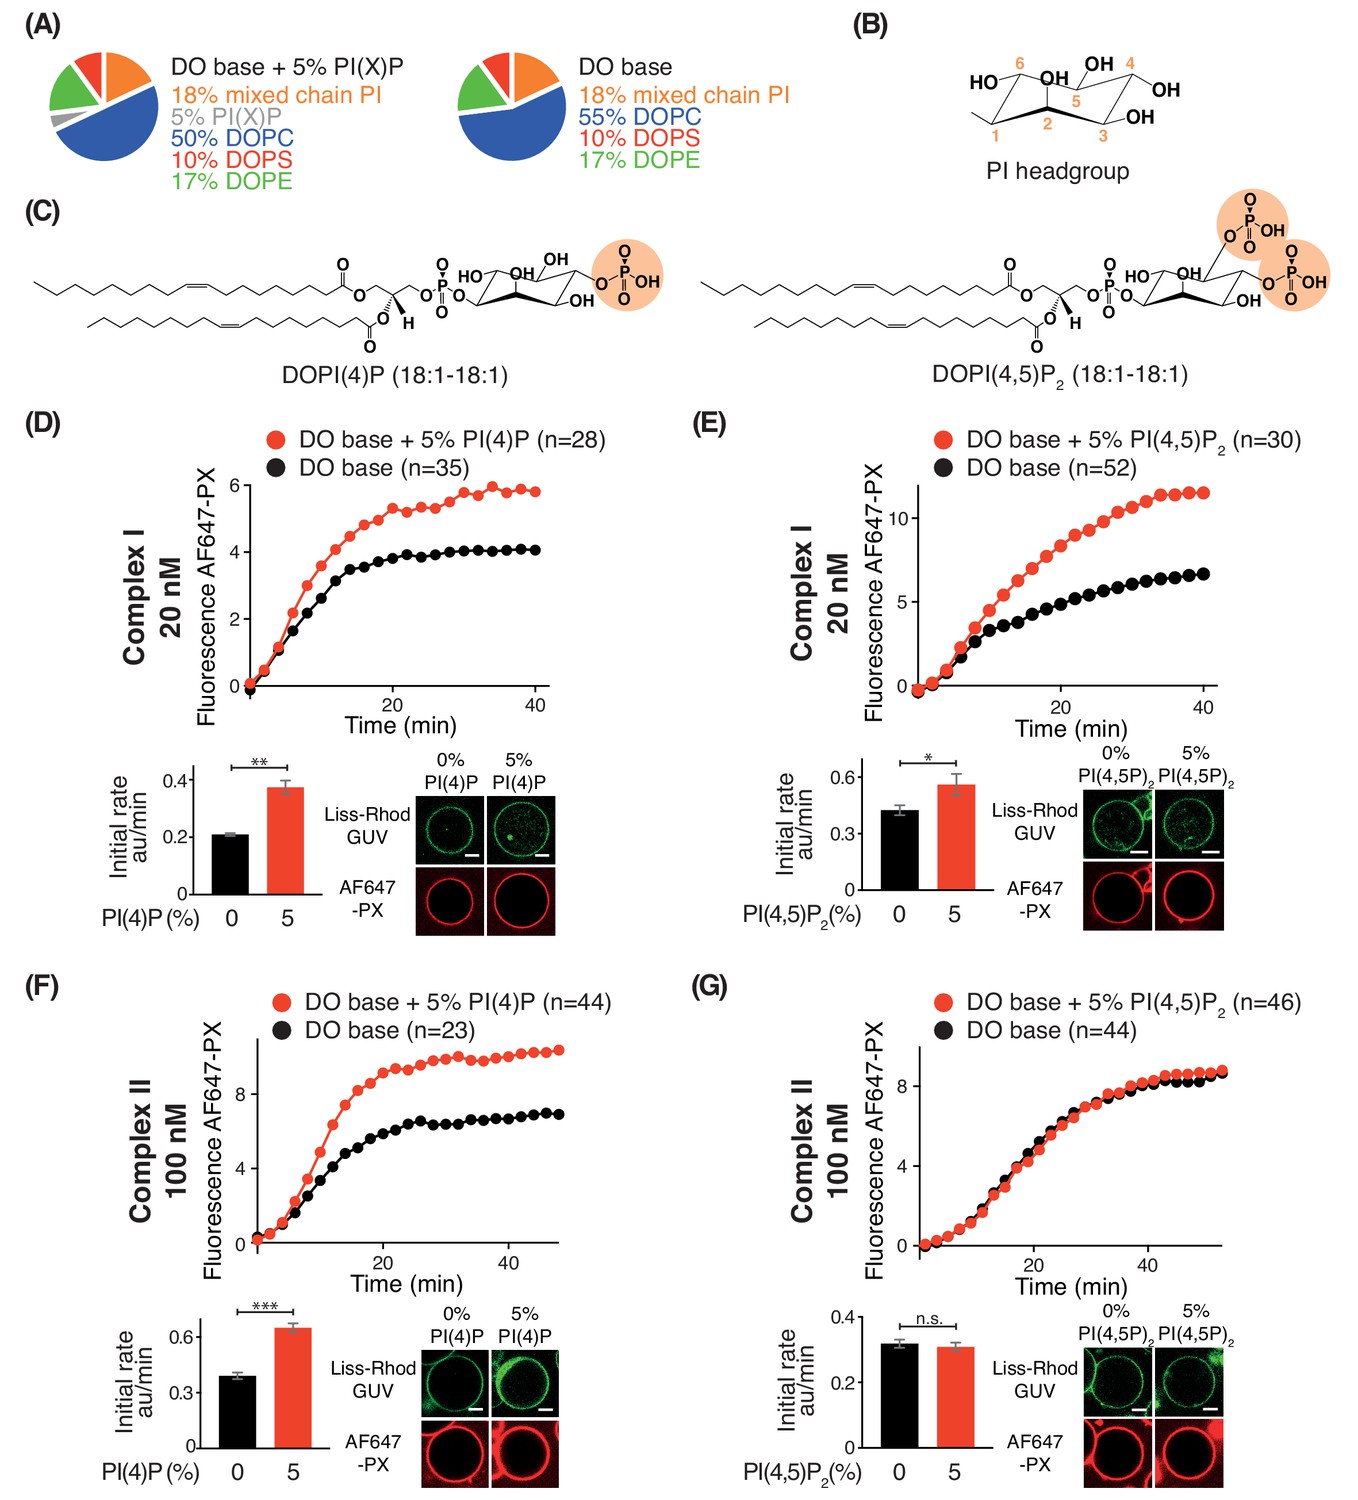
Effects of phosphoinositides on complexes I and II.
Activities of GUVs in which 5% of the PC in the base mixture is replaced by either 5% PI(4)P or 5% PI(4,5)P2 compared with base lipid-containing GUVs. (A) Composition of GUVs. (B) General structure of a phosphatidylinositol headgroup. (C) Structures of DOPI(4)P and DOPI(4,5)P2. (D-G) For each figure, the upper panel shows the reaction time course, the lower left panel shows the initial rates and the lower right illustrates confocal micrographs 60 min after adding the enzyme complexes. (D) Influence of 5% DOPI(4)P on complex I activity. **: p<0.01 (p=0.0059). (E) Influence of 5% DOPI(4,5)P2 on complex I activity. *: p<0.05 p=0.0140). (F) Influence of 5% DOPI(4)P on complex II activity. ***: p<0.001 (p<0.0001). (G) Influence of 5% DOPI(4,5)P2 on complex II activity. n.s.: not significant (p=0.5796). For clarity, only mean values are plotted for each time point. Plots with SDs for each time point are in Supplementary file 3. All scale bars: 5 μm.
Tables
Key resources table
| Reagent type (species) or resource | Designation | Source or reference | Identifiers | Additional information |
|---|---|---|---|---|
| Chemical compound, drug | DOPC | Avanti Polar Lipids, Inc | 850375C | Dissolved in chloroform |
| Chemical compound, drug | DOPE | Avanti Polar Lipids, Inc | 850725C | Dissolved in chloroform |
| Chemical compound, drug | DOPS | Avanti Polar Lipids, Inc | 840035C | Dissolved in chloroform |
| Chemical compound, drug | Brain PC (Porcine) | Avanti Polar Lipids, Inc | 840053C | Dissolved in chloroform |
| Chemical compound, drug | Brain PE (Porcine) | Avanti Polar Lipids, Inc | 840022C | Dissolved in chloroform |
| Chemical compound, drug | Brain PS (Porcine) | Avanti Polar Lipids, Inc | 840032C | Dissolved in chloroform |
| Chemical compound, drug | Liver PI (mixed chain PI, Bovine) | Avanti Polar Lipids, Inc | 840042C | Dissolved in chloroform |
| Chemical compound, drug | DSPE-PEG(2000) Biotin | Avanti Polar Lipids, Inc | 880129C | Dissolved in chloroform |
| Chemical compound, drug | DO Liss Rhod PE | Avanti Polar Lipids, Inc | 810150P | Dissolved in chloroform |
| Chemical compound, drug | SOPC | Avanti Polar Lipids, Inc | 850467C | Dissolved in chloroform |
| Chemical compound, drug | SOPE | Avanti Polar Lipids, Inc | 850758C | Dissolved in chloroform |
| Chemical compound, drug | SOPS | Avanti Polar Lipids, Inc | 840039C | Dissolved in chloroform |
| Chemical compound, drug | DSPI | Avanti Polar Lipids, Inc | 850143P | Dissolved in chloroform:methanol:H2O = 20:9:1 |
| Chemical compound, drug | SAPI | Avanti Polar Lipids, Inc | 850144P | Dissolved in chloroform:methanol:H2O = 20:9:1 |
| Chemical compound, drug | DOPI | Avanti Polar Lipids, Inc | 850149P | Dissolved in chloroform:methanol:H2O = 20:9:1 |
| Chemical compound, drug | DOPI(3)P | Avanti Polar Lipids, Inc | 850150P | Dissolved in chloroform |
| Chemical compound, drug | DOPI(4)P | Avanti Polar Lipids, Inc | 850151P | Dissolved in chloroform |
| Chemical compound, drug | DOPI(4,5)P2 | Avanti Polar Lipids, Inc | 850155P | Dissolved in chloroform |
| Chemical compound, drug | Cholesterol | Sigma | C2044 | Dissolved in chloroform |
| Chemical compound, drug | 18:1 Sphingomyelin | Avanti Polar Lipids, Inc | 860587 c | Dissolved in chloroform |
| Recombinant DNA reagent | HsVPS34 + HsVPS15-3xTEV-ZZ | (Ohashi et al., 2016) | pYO1025 | See Supplementary file 6 for more details |
| Recombinant DNA reagent | HsBeclin 1, untagged | This work | pYO1006 | See Supplementary file 6 for more details |
| Recombinant DNA reagent | ZZ-3XTEV-HsATG14L | This work | pYO1017 | See Supplementary file 6 for more details |
| Recombinant DNA reagent | ZZ-3XTEV-HsUVRAG | This work | pYO1018 | See Supplementary file 6 for more details |
| Recombinant DNA reagent | HsBeclin 1 + ZZ-3XTEV-UVRAG | This work | pYO1023 | See Supplementary file 6 for more details |
| Recombinant DNA reagent | HsBeclin 1 + HsUVRAG, both untagged | This work | pYO1031 | See Supplementary file 6 for more details |
| Recombinant DNA reagent | HsBeclin 1 AFM1 (FFW/DDD at 359–361), untagged + ZZ-3xTEV-HsATG14L | This work | pYO1051 | See Supplementary file 6 for more details |
| Recombinant DNA reagent | HsBeclin 1 AFM1 (FFW/DDD at 359–361), untagged + ZZ-3xTEV-HsUVRAG | This work | pYO1052 | See Supplementary file 6 for more details |
| Recombinant DNA reagent | ZZ_3xTEV-ATG14 delta ALPS (1-470) | This work | pYO1077 | See Supplementary file 6 for more details |
| Recombinant DNA reagent | HsBeclin 1 + HsATG14L, both untagged | This work | pYO1101 | See Supplementary file 6 for more details |
| Recombinant DNA reagent | HsBeclin 1 AFM2 (Q418D F419D), untagged + ZZ-3xTEV-HsATG14L | This work | pYO1118 | See Supplementary file 6 for more details |
| Recombinant DNA reagent | HsBeclin 1 AFM2 (Q418D F419D), untagged + ZZ-3xTEV-UVRAG | This work | pYO1120 | See Supplementary file 6 for more details |
| Recombinant DNA reagent | HsUVRAG + HsATG14L BATS domain(413-492) fusion, untagged | This work | pYO1123 | See Supplementary file 6 for more details |
| Recombinant DNA reagent | HsUVRAG delta Cter (1-464) + HsATG14L BATS domain(413-492) fusion, untagged | This work | pYO1124 | See Supplementary file 6 for more details |
| Recombinant DNA reagent | GST-TEV-Cys-PX (2-149) | This work | pYO1125 | See Supplementary file 6 for more details |
| Recombinant DNA reagent | HsBeclin 1 AFM1+HLM (FFW/DDD at 359–361 and L293A V296A), untagged + ZZ-HsATG14L | This work | pYO1134 | See Supplementary file 6 for more details |
| Recombinant DNA reagent | HsBeclin1 HLM+AFM2 (L293A V296A+ Q418D F419D) | This work | pYO1190 | See Supplementary file 6 for more details |
| Recombinant DNA reagent | His6-TEV-HsVPS34 | This work | pSM41 | See Supplementary file 6 for more details |
Additional files
-
Supplementary file 1
Composition of GUVs and LUVs used for VPS34 assays.
- https://cdn.elifesciences.org/articles/58281/elife-58281-supp1-v1.xlsx
-
Supplementary file 2
Sources of lipids for GUVs and LUVs.
- https://cdn.elifesciences.org/articles/58281/elife-58281-supp2-v1.xlsx
-
Supplementary file 3
Reaction time courses with error bars.
- https://cdn.elifesciences.org/articles/58281/elife-58281-supp3-v1.ai
-
Supplementary file 4
Summary of HDX results for complex I with Lipids.
- https://cdn.elifesciences.org/articles/58281/elife-58281-supp4-v1.xlsx
-
Supplementary file 5
Summary of HDX results for complex II with Lipids.
- https://cdn.elifesciences.org/articles/58281/elife-58281-supp5-v1.xlsx
-
Supplementary file 6
Summary of plasmids used to express the proteins and protein complexes.
- https://cdn.elifesciences.org/articles/58281/elife-58281-supp6-v1.xlsx
-
Transparent reporting form
- https://cdn.elifesciences.org/articles/58281/elife-58281-transrepform-v1.pdf
Download links
A two-part list of links to download the article, or parts of the article, in various formats.
Downloads (link to download the article as PDF)
Open citations (links to open the citations from this article in various online reference manager services)
Cite this article (links to download the citations from this article in formats compatible with various reference manager tools)
Membrane characteristics tune activities of endosomal and autophagic human VPS34 complexes
eLife 9:e58281.
https://doi.org/10.7554/eLife.58281


