Damage-responsive, maturity-silenced enhancers regulate multiple genes that direct regeneration in Drosophila
- Arizona State University, United States
- University of North Carolina at Chapel Hill, United States
- University of California, Berkeley, United States
Figures
Figure 1 with 2 supplements
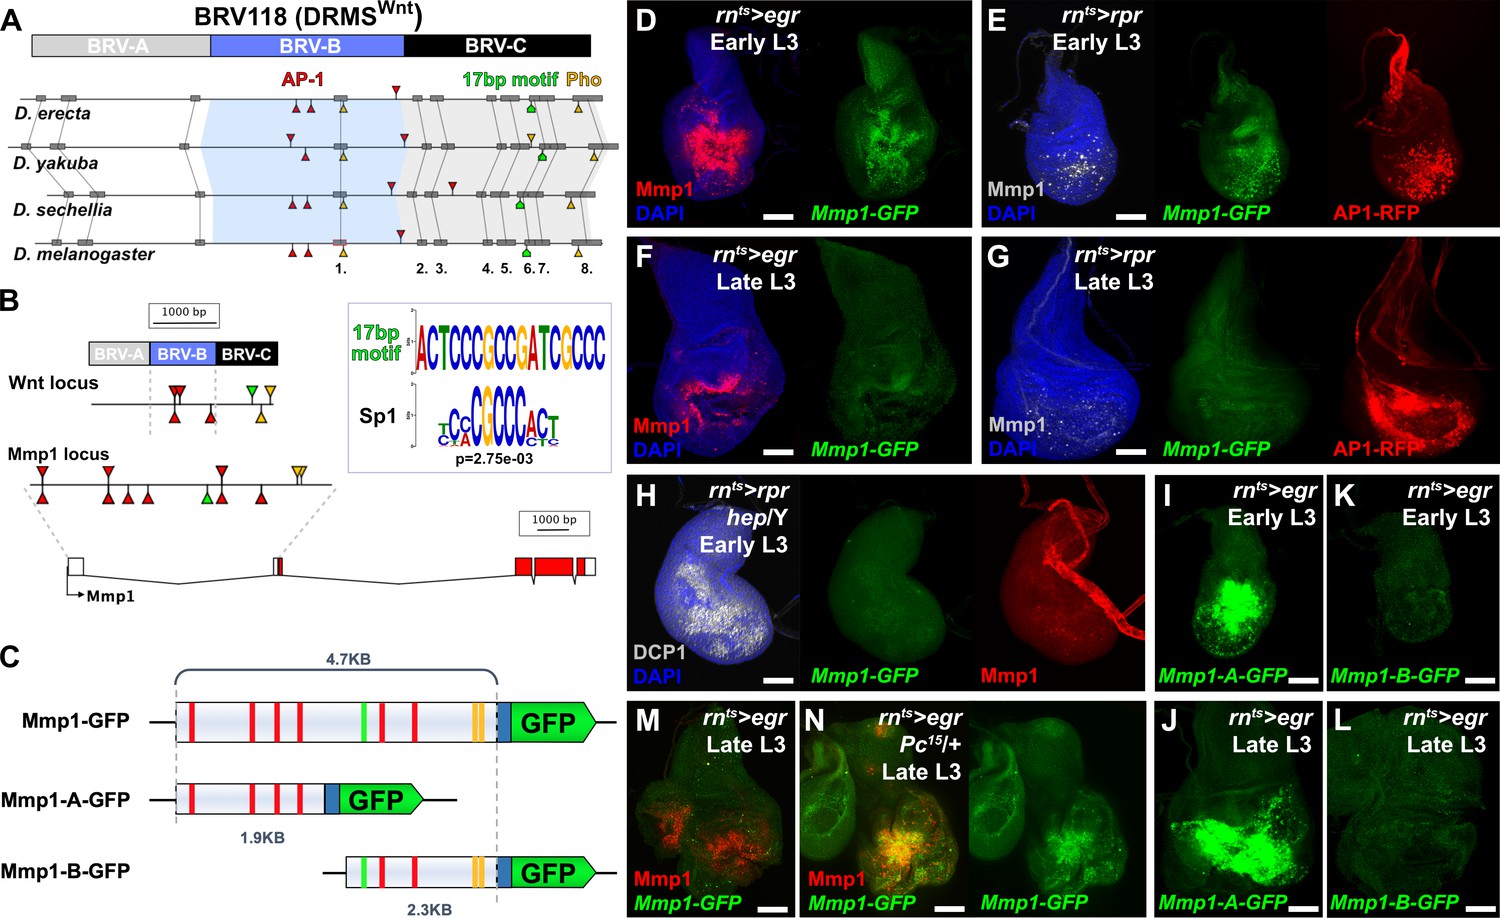
Mmp1 is regulated by a bipartite damage-responsive enhancer with organizational similarity to BRV118 (DRMSWnt).
(A) Schematic illustrating the conservation of the BRV118 enhancer at the Wnt locus (top) in four Drosophila species. The main damage-responsive region, BRV-B (blue box), the maturity silencing region, BRV-C, (black box) and their equivalent sequences in other species are indicated. Matching sequence of 50 bp or greater are shown as gray boxes and numbered. Also indicated are AP-1 binding sites (red arrowheads), Pleiohomeotic (Pho) sites (yellow arrowheads) and the conserved 17 bp motif (green markers). Binding site orientation is indicated by appearance above or below the line, (B) Schematic comparing the BRV118 enhancer from the Wnt locus (top) with that of a putative enhancer at the Mmp1 locus (bottom). AP-1 and Pho binding sites, and the 17 bp motif consensus, are illustrated in both DNA sequences, as in (A). The 17 bp motif and the Sp1 motifs are shown (inset), (C) Schematics of the Mmp1-GFP and related reporters. AP-1 binding sites (red bars), Pho binding sites (yellow bars) and the 17 bp motif (green bars) are indicated. Blue box: hsp70 minimal promoter, (D) Early L3 wing imaginal disc following ablation with rnts>egr stained for Mmp1 (red) and DAPI (blue), and showing activity of the Mmp1-GFP reporter (green), (E) Early L3 wing disc following ablation with rpr, showing levels of Mmp1 (gray), the activity of the Mmp1-GFP reporter (green) and the AP-1-RFP reporter (red), (F) Late L3 wing disc following egr ablation, showing that both the damage-induced Mmp1 (red) and Mmp1-GFP reporter expression (green) is weaker than that of early L3 discs, (G) Late L3 wing disc ablated with rpr as in (E), showing expression of both Mmp1 and the reporter are weaker in late L3 discs, while AP-1-RFP remains strongly activated on both days, DAPI: blue, (H) Early L3 hemizygous hep- mutant wing disc following rpr ablation, showing that neither Mmp1 (red) or the Mmp1-GFP reporter (green) is activated despite damage, indicated by dead cells (DCP1, gray), (I-J) Early L3 (I) and late L3 (J) wing discs bearing the Mmp1-A-GFP reporter (green) following egr ablation. The reporter is strongly activated, even in mature discs, (K-L) Early L3 (K) and late L3 (L) wing discs bearing the Mmp1-B-GFP reporter (green), showing no activity following egr ablation, (M-N) Mmp1 protein (red) and Mmp1-GFP expression (green) in late L3 egr ablated discs in a wild type (M) or Pc15 heterozygous mutant background (N), showing increased levels of Mmp1 and GFP with reduced Pc gene function. Scale bars = 50 μm.
Figure 1—figure supplement 1
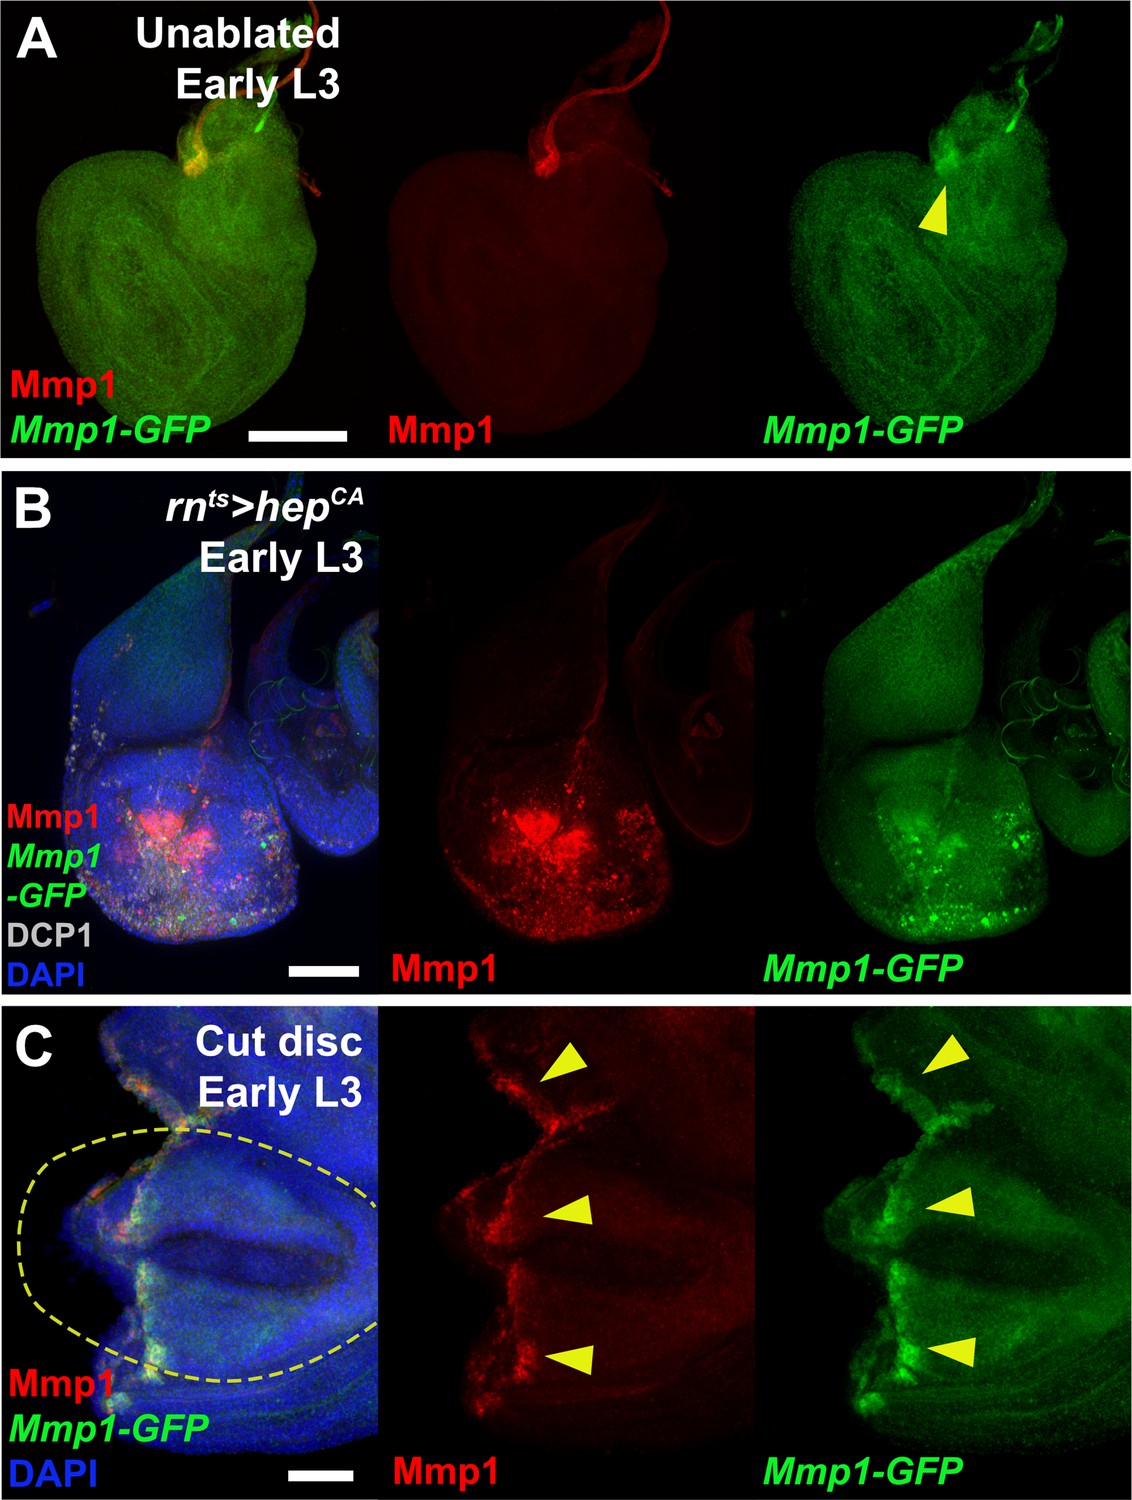
The Mmp1 enhancer is activated by ectopic JNK signaling and physical wounding.
(A) An early L3 disc bearing the Mmp1-GFP enhancer reporter (green), showing the reporter weakly recapitulates developmental Mmp1 (red) in the air sac primordium (yellow arrowhead), (B) Early L3 disc with ectopic activation of JNK signaling in the pouch via expression of UAS-hepCA with rnts>. Both Mmp1 (red) and the enhancer GFP reporter (green) are strongly activated. Cleaved caspase DCP1: gray, DAPI: blue, (C) Early L3 disc bearing the Mmp1-GFP enhancer reporter (green), physically fragmented, cultured for 8 hr and stained for Mmp1 (red). Both GFP and Mmp1 are coincident in cells along the wound edge (yellow arrowheads). Original wing pouch is indicated with yellow dotted line, DAPI: blue. Scale bars in (A) and (B) = 50 μm, scale bar in (C) = 20 μm.
Figure 1—figure supplement 2
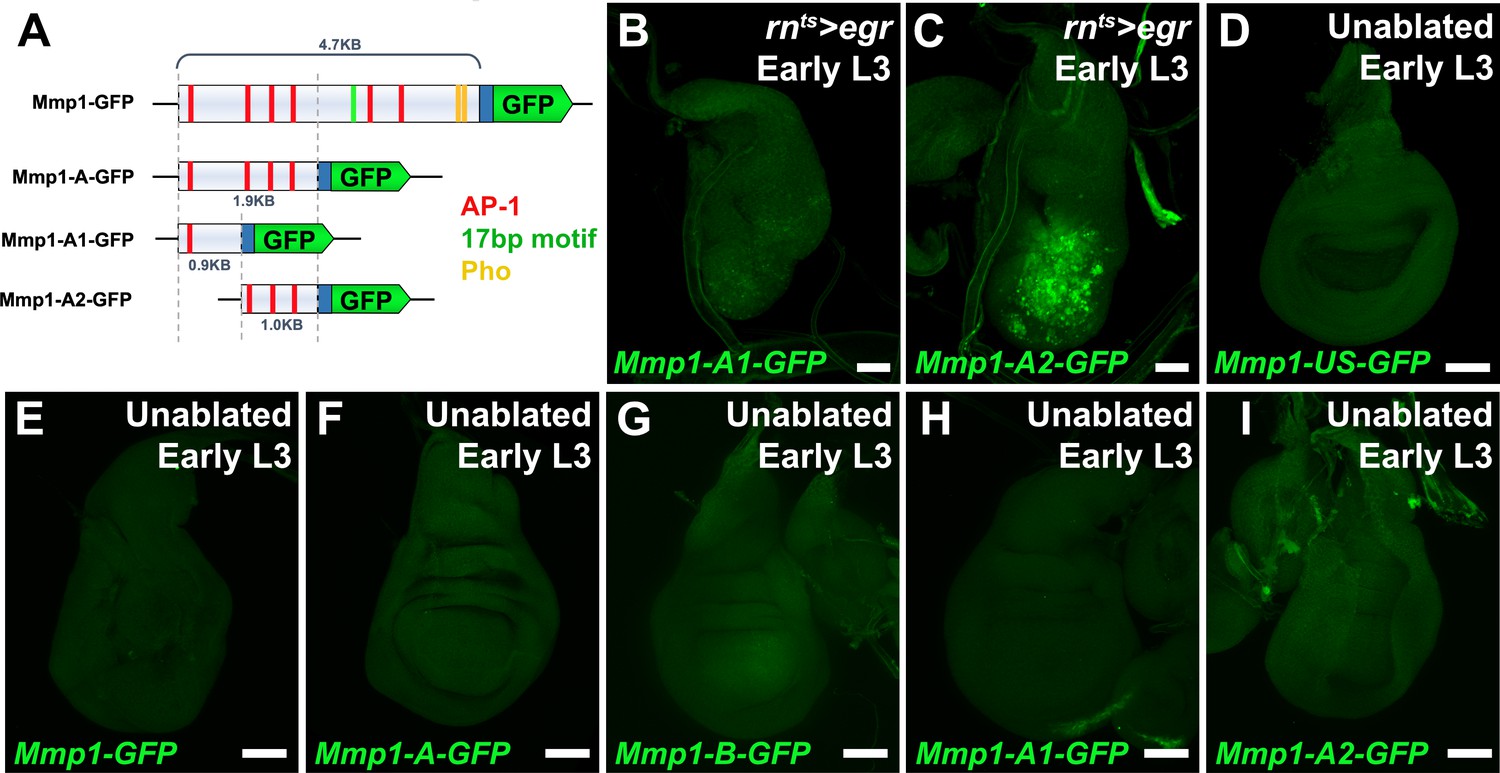
The Mmp1 enhancer is damage activated and is defined by a 1 kb fragment.
(A) Schematic of the Mmp1 reporter and related constructs used to investigate damage-activation of the enhancer. AP-1 binding sites (TGASTMA, red bars), Pho binding sites (AATGGCB, yellow bars) and the 17 bp motif (TGGCGATCGGCGGGAGT, green bars) are indicated. Blue box: hsp70 minimal promoter, (B-C) Early L3 discs bearing the Mmp1-A1-GFP (B) and Mmp1-A2-GFP reporter (C) showing GFP expression (green) following ablation with egr. The 1 kb fragment of the enhancer with three consensus AP-1 binding sites is responsible for the majority of damage-induced activity, (D-I) Early L3 undamaged discs bearing the GFP reporters indicated. None of the reporters express GFP (green) in developing discs in the absence of ablation, including the Mmp1-US reporter (D) or subdivisions of the Mmp1 enhancer (E-I). Scale bars = 50 μm.
Figure 2 with 2 supplements
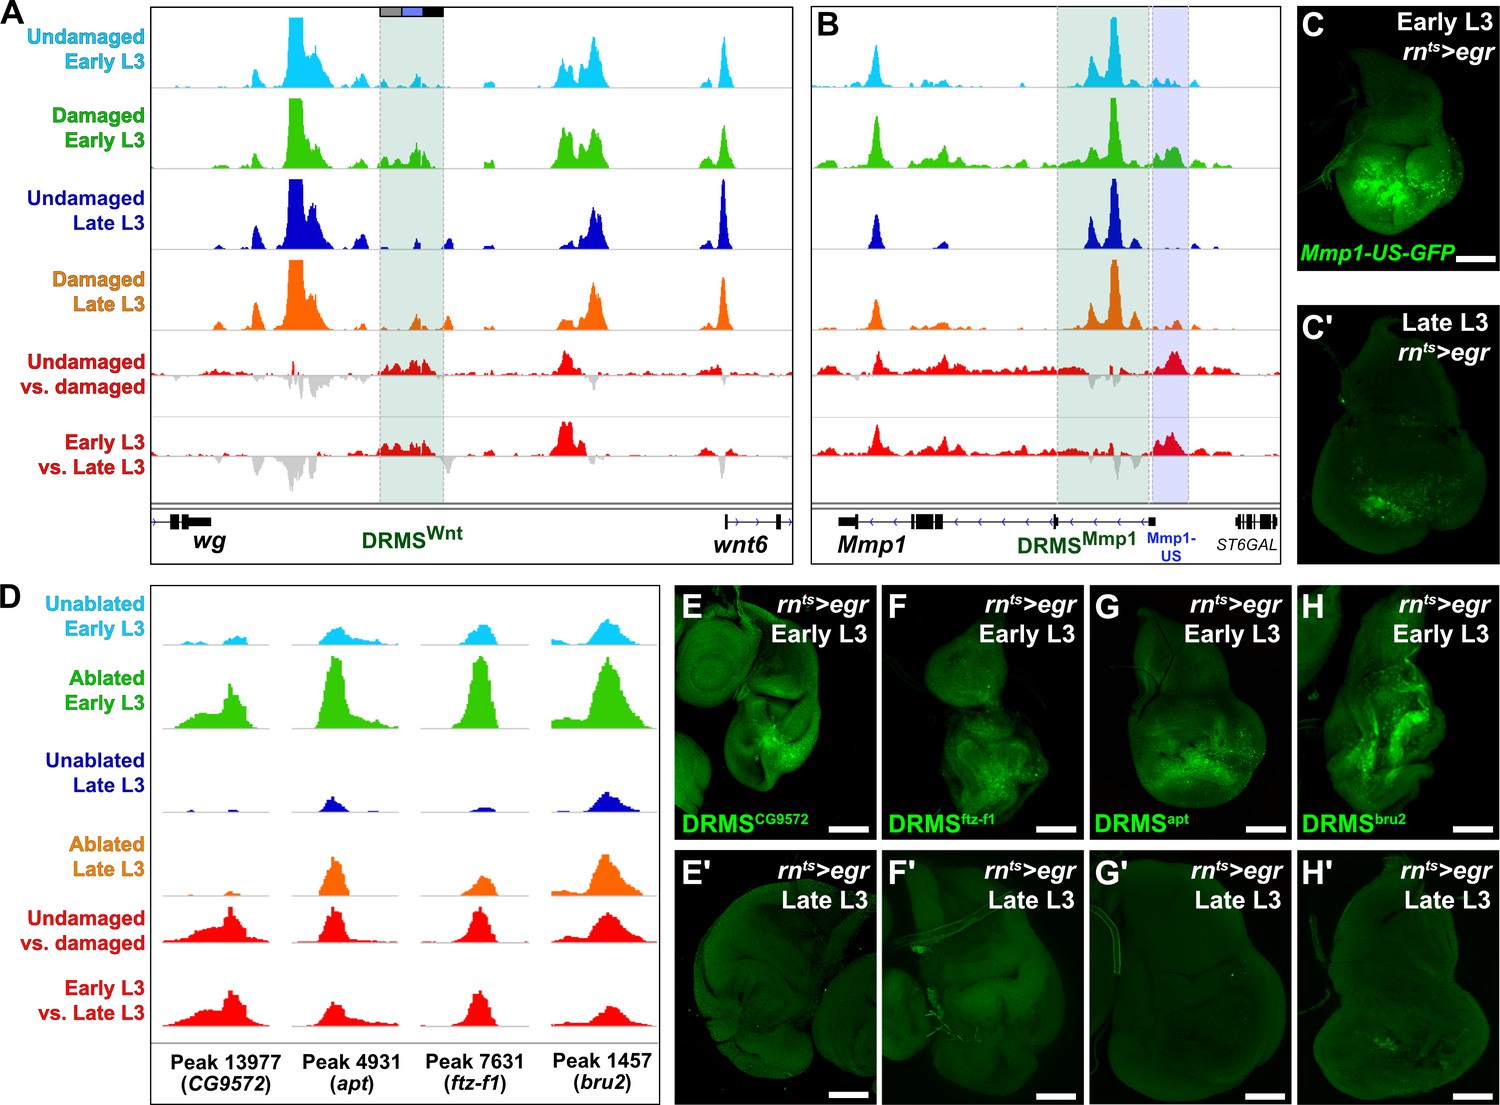
ATAC-seq of regenerating discs identifies damage-responsive and maturity-silenced regions.
(A–B) ATAC-seq chromatin accessibility trace (z scores) at the Wnt (wg/Wnt6) locus (A) and the Mmp1 locus (B) for the four conditions indicated. Traces showing the difference between early L3 undamaged versus damaged discs (damage-responsiveness), and early L3 damaged versus late L3 damaged discs (maturity silencing) is shown in the bottom two traces (subtracted z scores, red and gray). The dark green boxes indicate the experimentally validated DRMSWnt enhancer (BRV118, [Harris et al., 2016]) and DRMSMmp1 enhancer (this work), the blue box indicates the Mmp1 upstream region (Mmp1-US) tested for DRMS activity, (C-C’) Characterization of the Mmp1-US enhancer. Early L3 (C) and late L3 (C’) rnts>egr ablated discs bearing GFP reporter of the Mmp1-US region (peak 5105), showing damage-responsive and maturity-silenced behavior, (D) ATAC-seq chromatin accessibility traces of the peaks (and associated genes) indicated, chosen for in vivo validation based on their strong DRMS signatures, (E-H’) Early L3 (E-H) and late L3 (E’-H’) rnts>egr ablated discs bearing GFP reporters of the peaks indicated in (D). Each reporter has damage-responsive expression in early L3 discs, which is reduced in damaged late L3 discs, consistent with chromatin accessibility of the region. Scale bars = 50 μm.
Figure 2—figure supplement 1
ATAC-seq identifies damage-responsive chromatin changes that are located at genomic regions resembling enhancers.
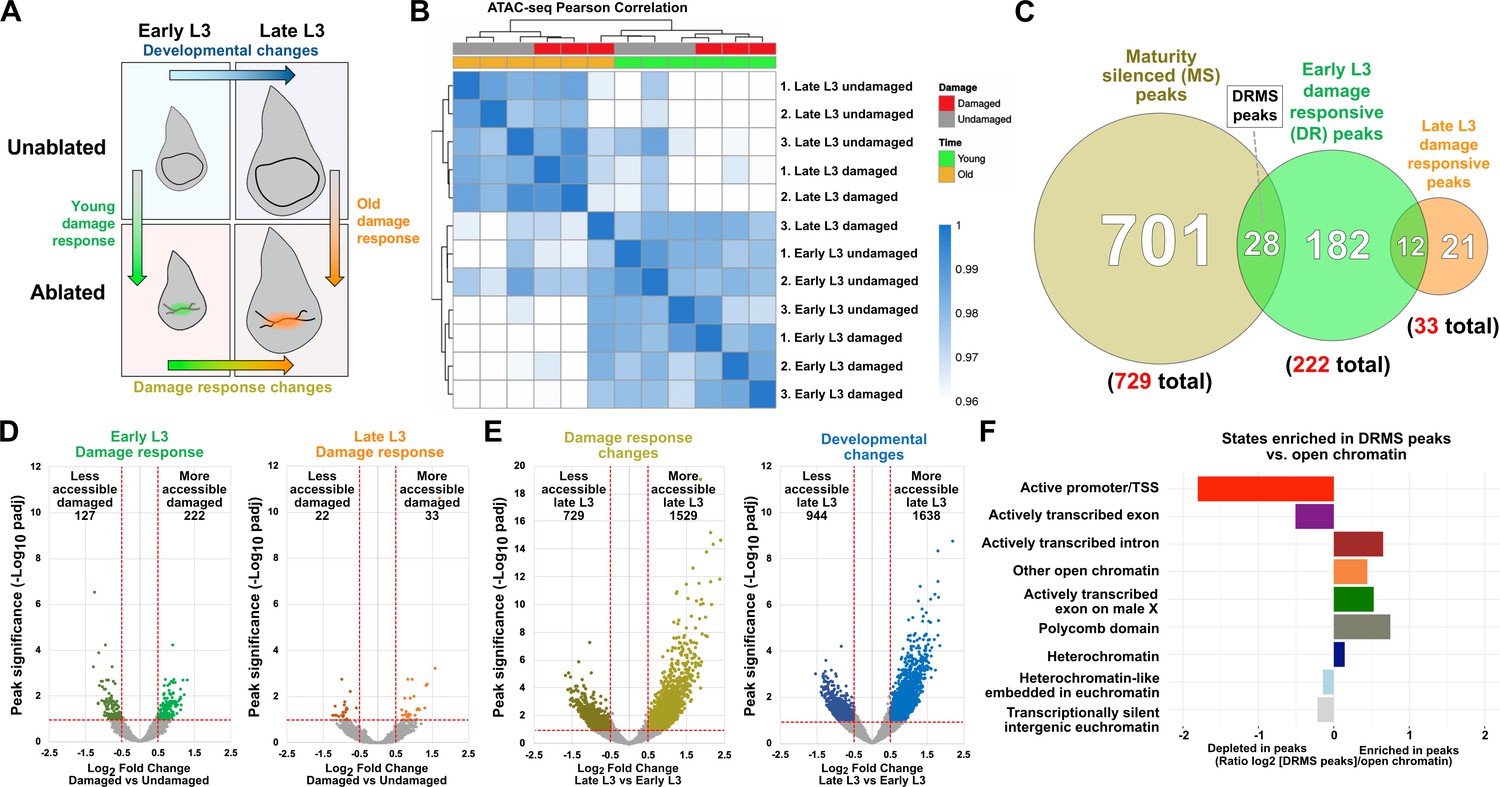
(A) Sample comparisons used in the ATAC-seq analysis, (B) Pearson correlation on CPM-normalized counts from DEseq2 of ATAC-seq data shows data cluster by developmental stage, damage status and biological repeat, with the exception of one late L3 damaged sample (repeat 3). Removal of this repeat does not significantly alter the conclusions reached from these data, (C) Venn diagram showing the number of genomic regions (padj <0.1 and log2 fold change >0.5) that are silenced with maturity (more accessible in damaged early L3 versus damaged late L3 discs, 729 peaks), damage-responsive in early L3 (more accessible in damaged early L3 discs versus undamaged, 222 peaks) and damage-responsive in late L3 (more accessible in damaged late L3 discs versus undamaged, 33 peaks). The damage-responsive and maturity silenced peaks (DRMS) are defined as the subset of early L3 damage-responsive peaks that are significantly less accessible in damaged late L3 discs (28 peaks), (D-E) Volcano plots showing chromatin accessibility changes upon damage (D) in early L3 discs (left) and late L3 discs (right), and changes that occur from early L3 to late L3 (E) in damaged discs (left) and undamaged discs (right). Lines indicate significance threshold (p <0.1) and fold change cutoff (log2FC >0.5), and the number of peaks that fall within these values (colored data points) are shown above, (F) Ratiometric graph showing the distribution of the DRMS peaks across the genome relative to total open chromatin detected by ATAC-seq, categorized into the chromatin states defined by ChIP-seq data of chromatin modifications from Kharchenko et al., 2011. DRMS peaks detected in our ATAC-seq experiments are enriched at open chromatin found in introns and in other open chromatin but depleted at promoters and exons.
Figure 2—figure supplement 2
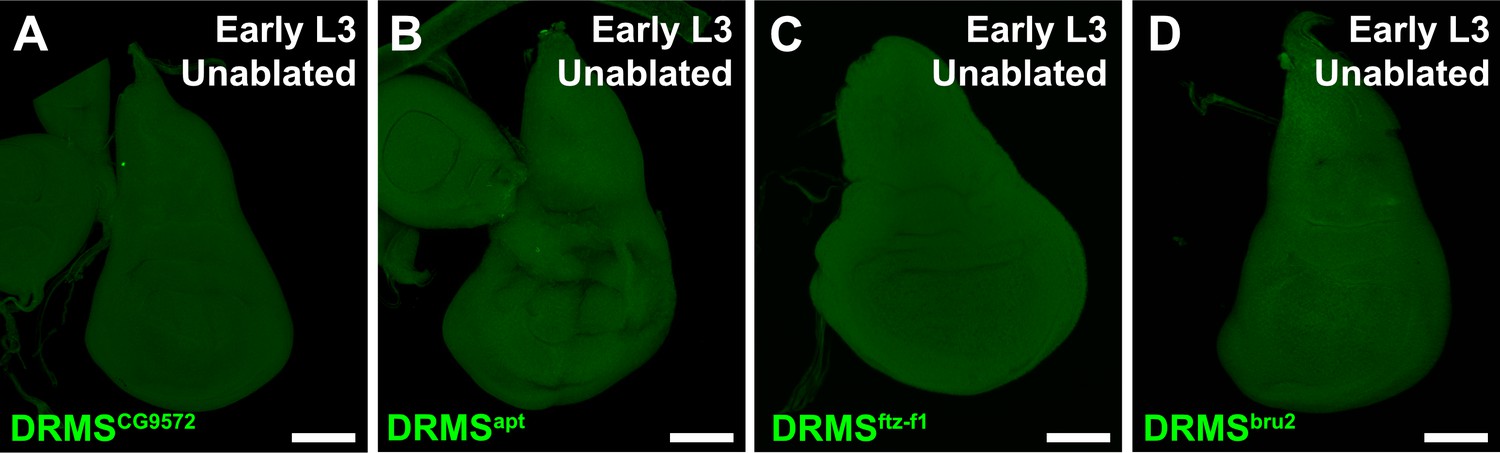
In vivo validated DRMS enhancers are not activated in the absence of damage.
(A–D) Early L3 undamaged discs bearing GFP reporters of the DRMS enhancers indicated. Enhancers fail to drive expression of GFP (green) in the absence of damage. Scale bars = 50 μm.
Figure 3 with 2 supplements
DUAL Control: a novel genetic ablation system to manipulate gene expression in regenerating discs.
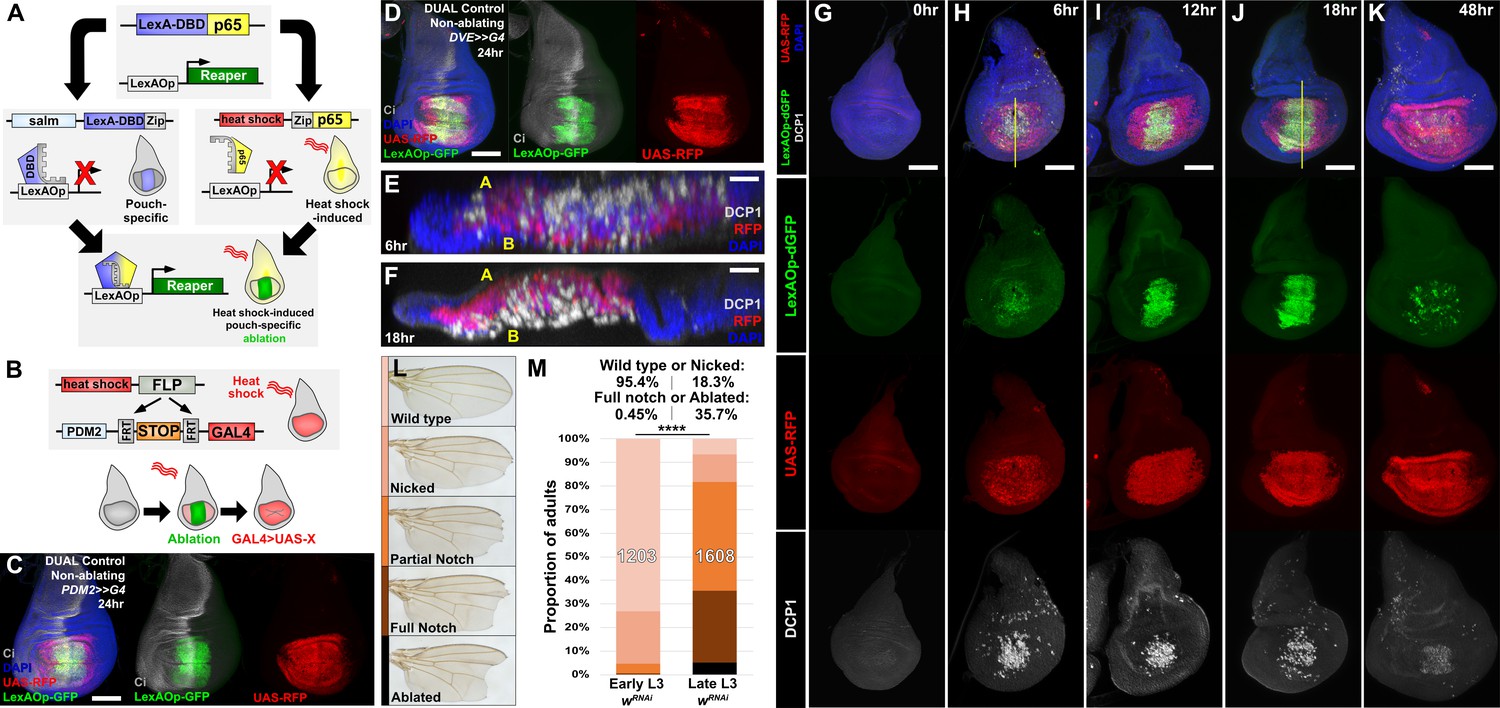
(A) Schematic of the DUAL Control genetic ablation system, based on split LexA. See manuscript text for details. salm: spalt enhancer, Zip: Leucine zipper domain, p65: transcriptional activator domain, (B) Schematic of the PDM2>>GAL4 driver used in DUAL Control to manipulate gene expression in regenerating cells. Heat shock-induced FLP removes the transcriptional stop cassette through FRT recombination, allowing a single heat shock to activate both ablation (green) and GAL4 expression (red) in different cell populations, (C) Non-ablating DUAL Control with PDM2>>GAL4 crossed to a double fluorescent tester stock, bearing UAS-RFP (red) and lexAOp-GFP (green), heat shocked at early L3 (day 3.5 at 25°C) and imaged 24 hr post heat shock (PHS). Cells that can be ablated (salm domain) are marked by GFP (green), while the surrounding cells that can be genetically manipulated (PDM2 domain) are marked by RFP (red). The ablation domain straddles the compartment boundary, indicated by Ci staining (gray), (D) As in (C), using non-ablating DUAL Control with the stronger DVE>>GAL4 driver. The expression of the DVE domain is similar to PDM2, (E-F) Sections through discs seen in (H) and (J), showing apoptotic cells (DCP1, gray) and pouch cells (RFP, red). The majority of dead cells and debris present within the disc proper at 6 hr PHS (E) is extruded basally from the disc epithelium by 18 hr PHS (F). A: Apical surface of the disc proper epithelium, B: Basal surface of the disc proper epithelium, DAPI, blue, (G-K) Time course of DUAL Control ablation with rpr on day 3.5 discs bearing lexAOp-dGFP (fast-degrading) and UAS-RFP, imaged at the indicated number of hours PHS. GFP (green), RFP (red) and cell death (DCP1, gray) can be detected at 6 hr PHS, and persist until 18 hr PHS. At 12 hr PHS the rate of new dead cell production decreases, while DCP1 positive cells and GFP label persist. GFP expression subsequently declines and is mostly absent by 48 hr PHS. GAL4 expression (RFP) is consistent from 6 hr PHS to pupariation throughout the regeneration period. DAPI, blue. Yellow lines in (H) and (J) indicate cross-sections in (E) and (F), (L) Classification of adult wing phenotypes following ablation and regeneration, (M) DUAL control used to ablate discs with rpr in early (day 3.5) or late (day 4.5) L3 discs, assayed for regeneration by wing size. Graphs illustrate the proportion of adults that eclose with the wing phenotypes indicated in (L), demonstrating the loss of regenerative capacity that occurs between early and late L3. In this and subsequent figures, the number of flies scored is labeled on the graph of each genotype, and the percentage of each genotype characterized as ‘Wild type or Nicked’ and ‘Full notched or Ablated’ is indicated above. UAS-wRNAi is used as a control for regeneration scoring. **** p <0.0001, Fisher exact test. Scale bars in (E) and (F) = 20 μm, other scale bars = 50 μm.
Figure 3—figure supplement 1
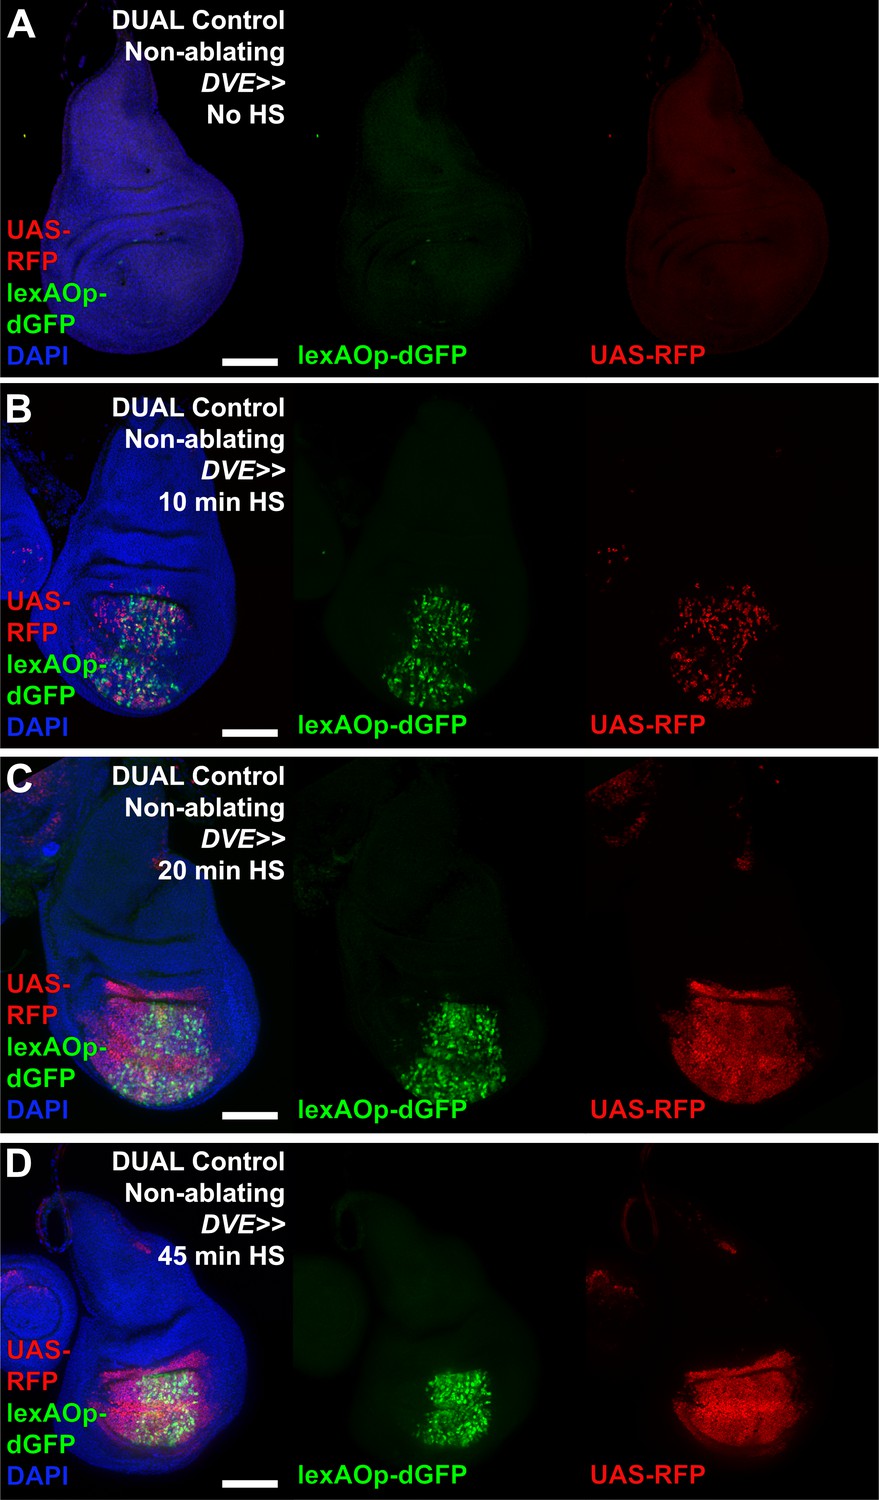
Activation of DUAL Control with various heat shock durations.
(A–D) Discs bearing a non-ablating DUAL Control DVE>>GAL4 crossed to lexAOp-dGFP; UAS-RFP fluorescent reporters and imaged at 24 hr after heat shock (HS). In the absence of a heat shock discs show no GFP (green) or RFP (red) expression. After a 10 min heat shock both reporters are weakly activated in the pouch (B). Longer duration heat shock of 20 min (C) and 45 min (D) increase activity of both LexA and GAL4 sides of the DUAL Control system. DAPI: blue. Scale bars = 50 μm.
Figure 3—figure supplement 2
egr-induced ablation with DUAL Control is weaker than that of rpr.
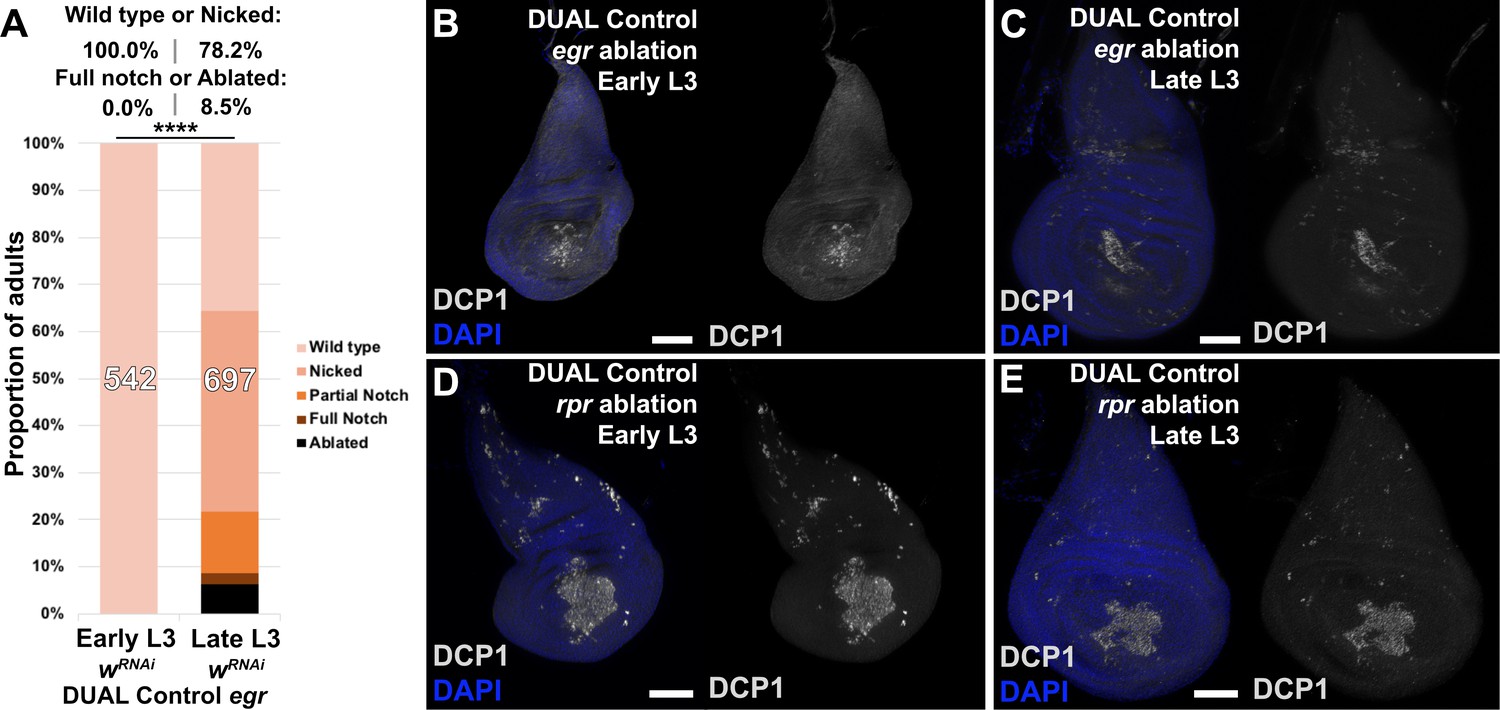
(A) Early or late L3 discs ablated with egr using DUAL Control, assayed for regeneration by wing size. Graph illustrates the proportion of adults eclosing with the indicated wing phenotypes, with the number of wings scored for each condition shown. The percentage of wings scored as ‘wild type or nicked’ and ‘full notched or ablated’ is labeled above. Assay shows more complete wings overall than those of discs ablated with rpr (main figure). UAS-wRNAi is used as a control for regeneration scoring, **** p <0.0001, Fisher exact test, (B-C) Discs ablated by DUAL Control with egr in early L3 (B) or late L3 (C) stained for DCP1 (gray). Ablation is comparable between timepoints, (D-E) Discs as in (B-C) ablated with rpr, showing comparable levels of ablation at both timepoints, but a greater abundance of DCP1 than in discs damaged with egr, consistent with reduced levels of egr-induced ablation in this system. DAPI: blue. Scale bars = 50 μm.
Figure 4 with 1 supplement
Manipulation of genes previously known to function during regeneration using DUAL Control.
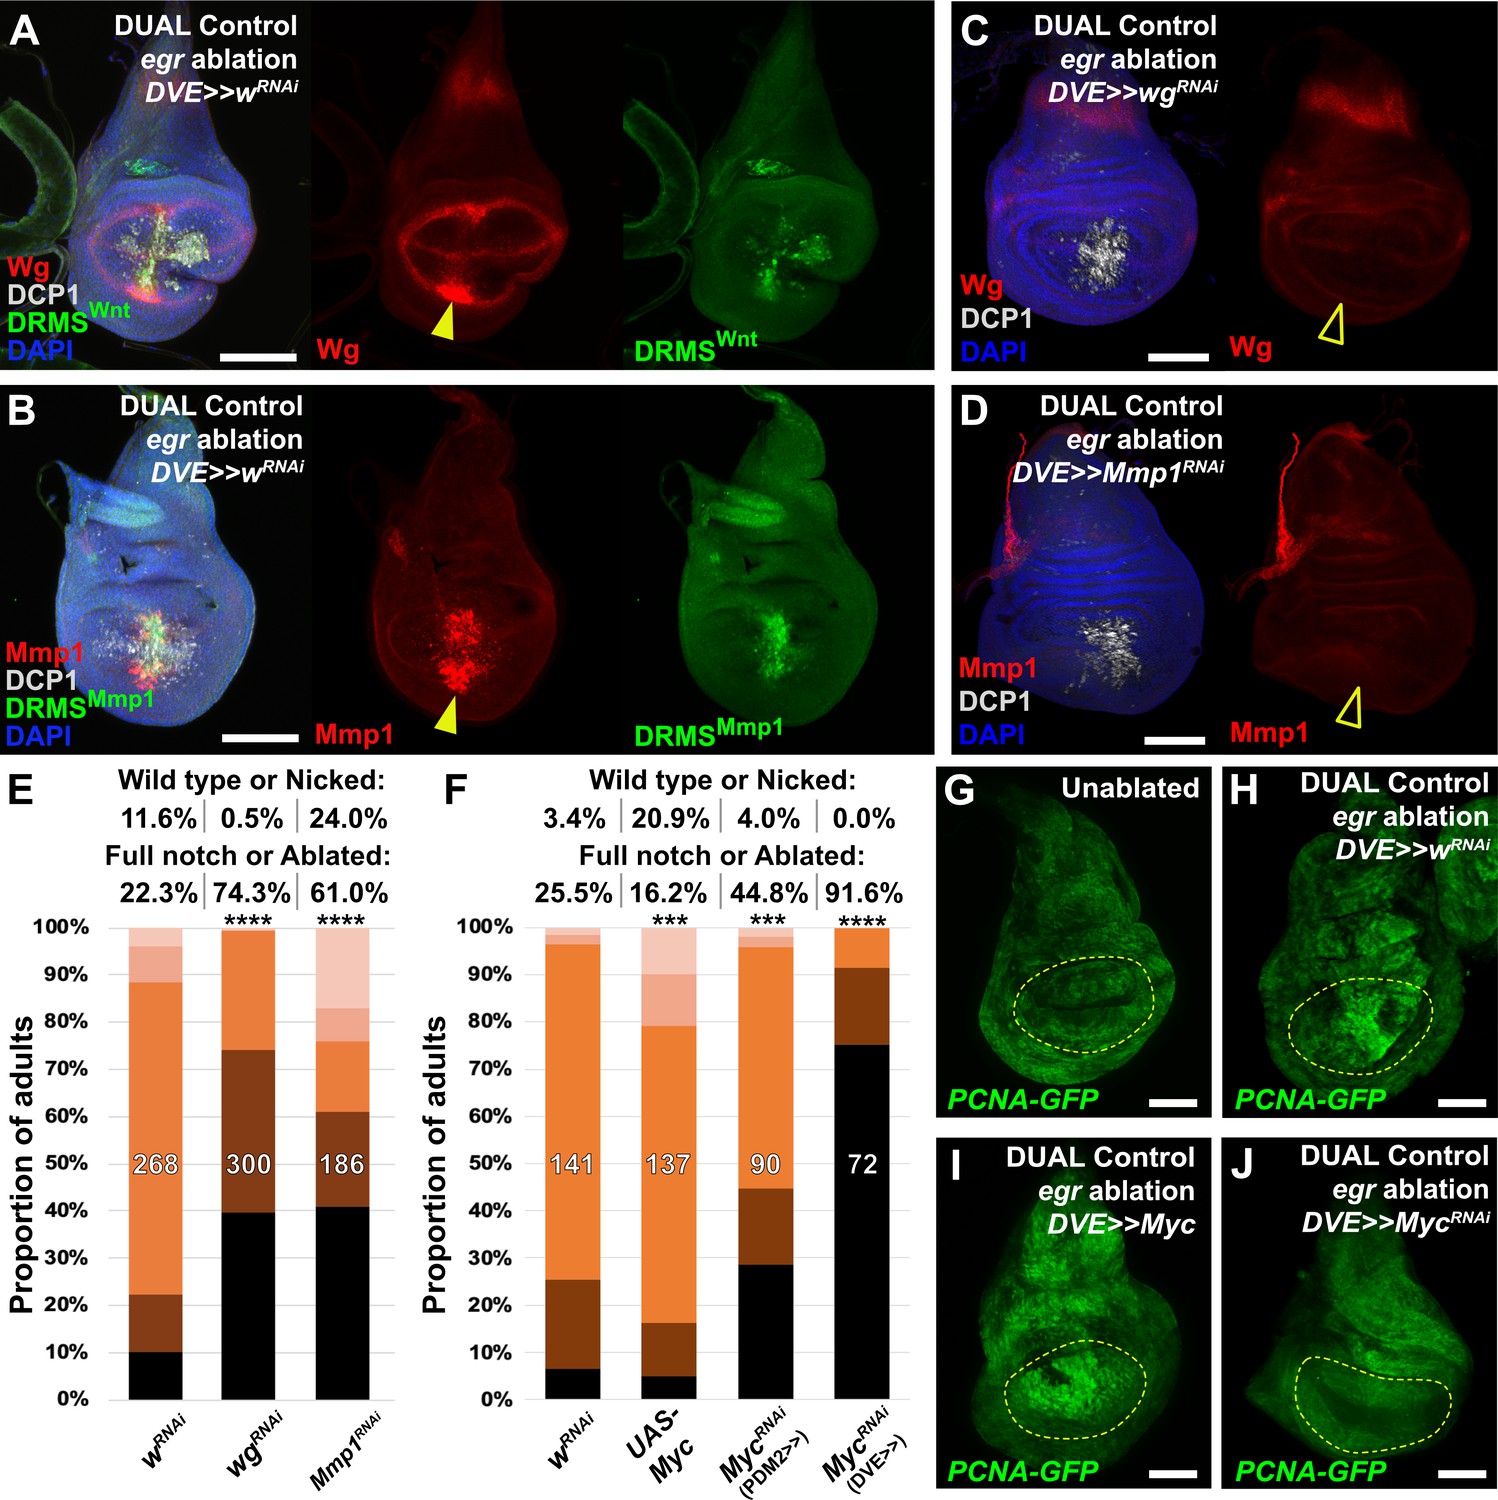
(A–B) Early L3 discs bearing the DRMSWnt-GFP reporter (A) or the DRMSMmp1-GFP reporter (B), ablated with egr using DUAL Control expressing a control RNAi (UAS-wRNAi) and imaged after 24 hr. Ablation activates expression of both wg and Mmp1 (red, arrowheads), and both DRMS reporters (green), (C-D) RNAi knockdown of damage-induced wg (C) and Mmp1 (D) expression (red) with DVE>>GAL4 in DUAL Control egr ablated discs. Note that developmental expression of wg in the hinge and notum, and Mmp1 in the tracheal tubes is unaffected by the knockdown, which is limited to the regenerating pouch tissue (open arrowheads). DCP1: gray, DAPI: Blue, (E) RNAi knockdown of DRMS-regulated genes wg and Mmp1 with DVE>>GAL4 in early L3 discs ablated with rpr using DUAL Control demonstrates their requirement for regeneration compared to wRNAi control. **** p <0.0001, Fisher exact test, (F) Manipulation of Myc alters regenerative ability of discs. Ectopic activation with UAS-Myc leads to improved wing sizes in late L3 rpr ablated discs compared to wRNAi, while knock down of Myc using PDM2 or DVE drivers prevents regrowth, with the DVE driver having a stronger effect, *** p = 0.0006 (UAS-Myc), *** p = 0.0002 (MycRNAi, PDM2>>), **** p <0.0001, Fisher exact test, (G-J) Discs bearing a PCNA-GFP reporter of E2F activity, and thus proliferation, in unablated discs (G), discs ablated with egr using DUAL Control (H), ablated with egr using DUAL Control and ectopically expressing Myc in the pouch with DVE>>GAL4 (I), and ablated with egr using DUAL Control and expressing Myc RNAi in the pouch with DVE>>GAL4 (J). Proliferation (GFP, green) is increased in blastema cells as a result of ablation, strongly upregulated throughout the pouch as a result of ectopic Myc, and significantly reduced in cells with Myc knockdown. Yellow outline indicates the pouch. Scale bars = 50 μm.
Figure 4—figure supplement 1
Characterizing known regulators of regeneration using DUAL Control.
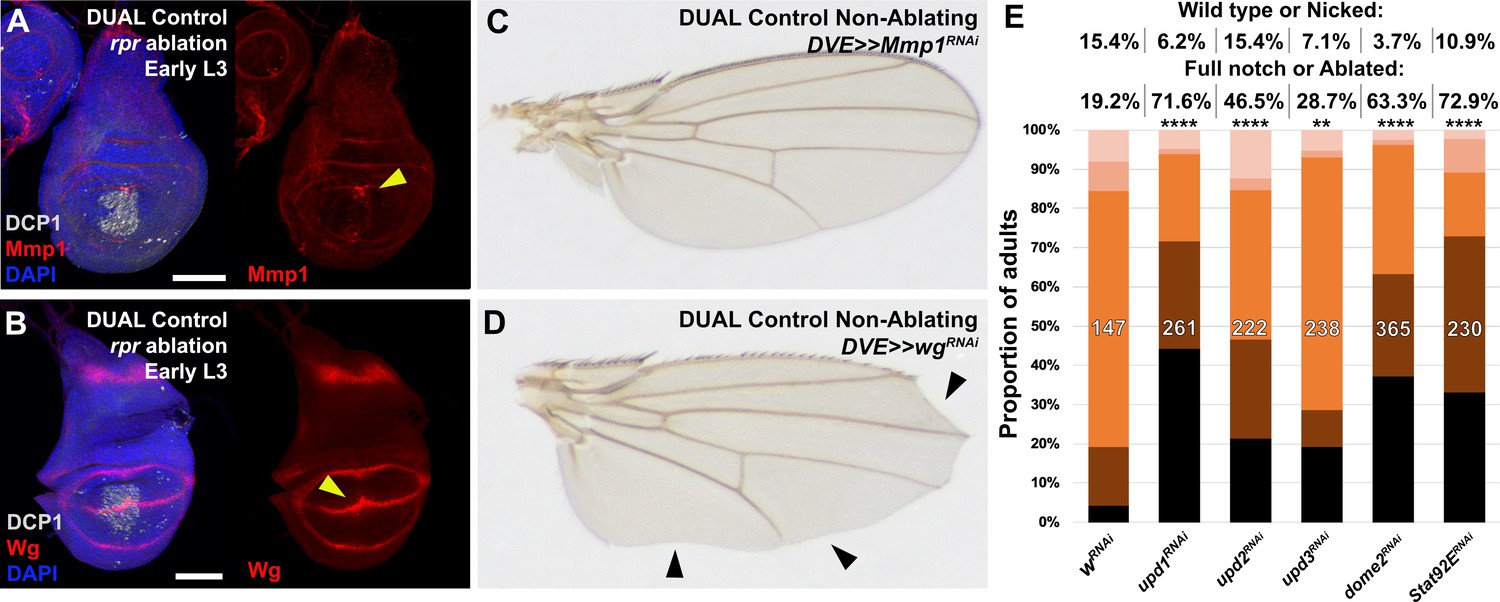
(A–B) Early L3 discs ablated with rpr using DUAL Control, stained for Mmp1 (A) or Wg (B). Both are expressed following ablation by rpr (arrowheads) but at lower levels than egr (main figure), likely due to the reduced activation of JNK signaling by rpr. DCP1: gray, DAPI: blue, Scale bars = 50 μm, (C-D) Adult wings resulting from knockdown of Mmp1 (C) or wg (D) using DUAL Control DVE>>GAL4 in the absence of ablation, showing knockdown of Mmp1 for this duration does not strongly influence wing development, while knockdown of wg results in loss of the margin around the entire wing typical of reduced Wg (arrowheads in D). This phenotype is distinguishable from ablation, which occurs only at the distal wing tip in a distinctive pattern, starting between L3 and L4 and extending inwards towards the center of the wing blade, (E) Discs ablated with rpr using DUAL Control and expressing the indicated RNAi transgenes using DVE>>GAL4, assayed for regeneration by adult wing size. Graph illustrates the proportion of adults eclosing with the indicated wing phenotypes, with the number of wings scored for each condition shown. The percentage of wings scored as ‘wild type or nicked’ and ‘full notched or ablated’ is labeled above. Loss of JAK/STAT signaling via knockdown of the upd ligands, domeless (dome) or Stat92E during regeneration strongly reduces wing regrowth compared to wRNAi control. ** p = 0.0024 (upd3RNAi), **** p <0.0001, Fisher exact test.
Figure 5 with 2 supplements
Uncharacterized gene CG9572/asperous is a novel regulator of wing disc regeneration.
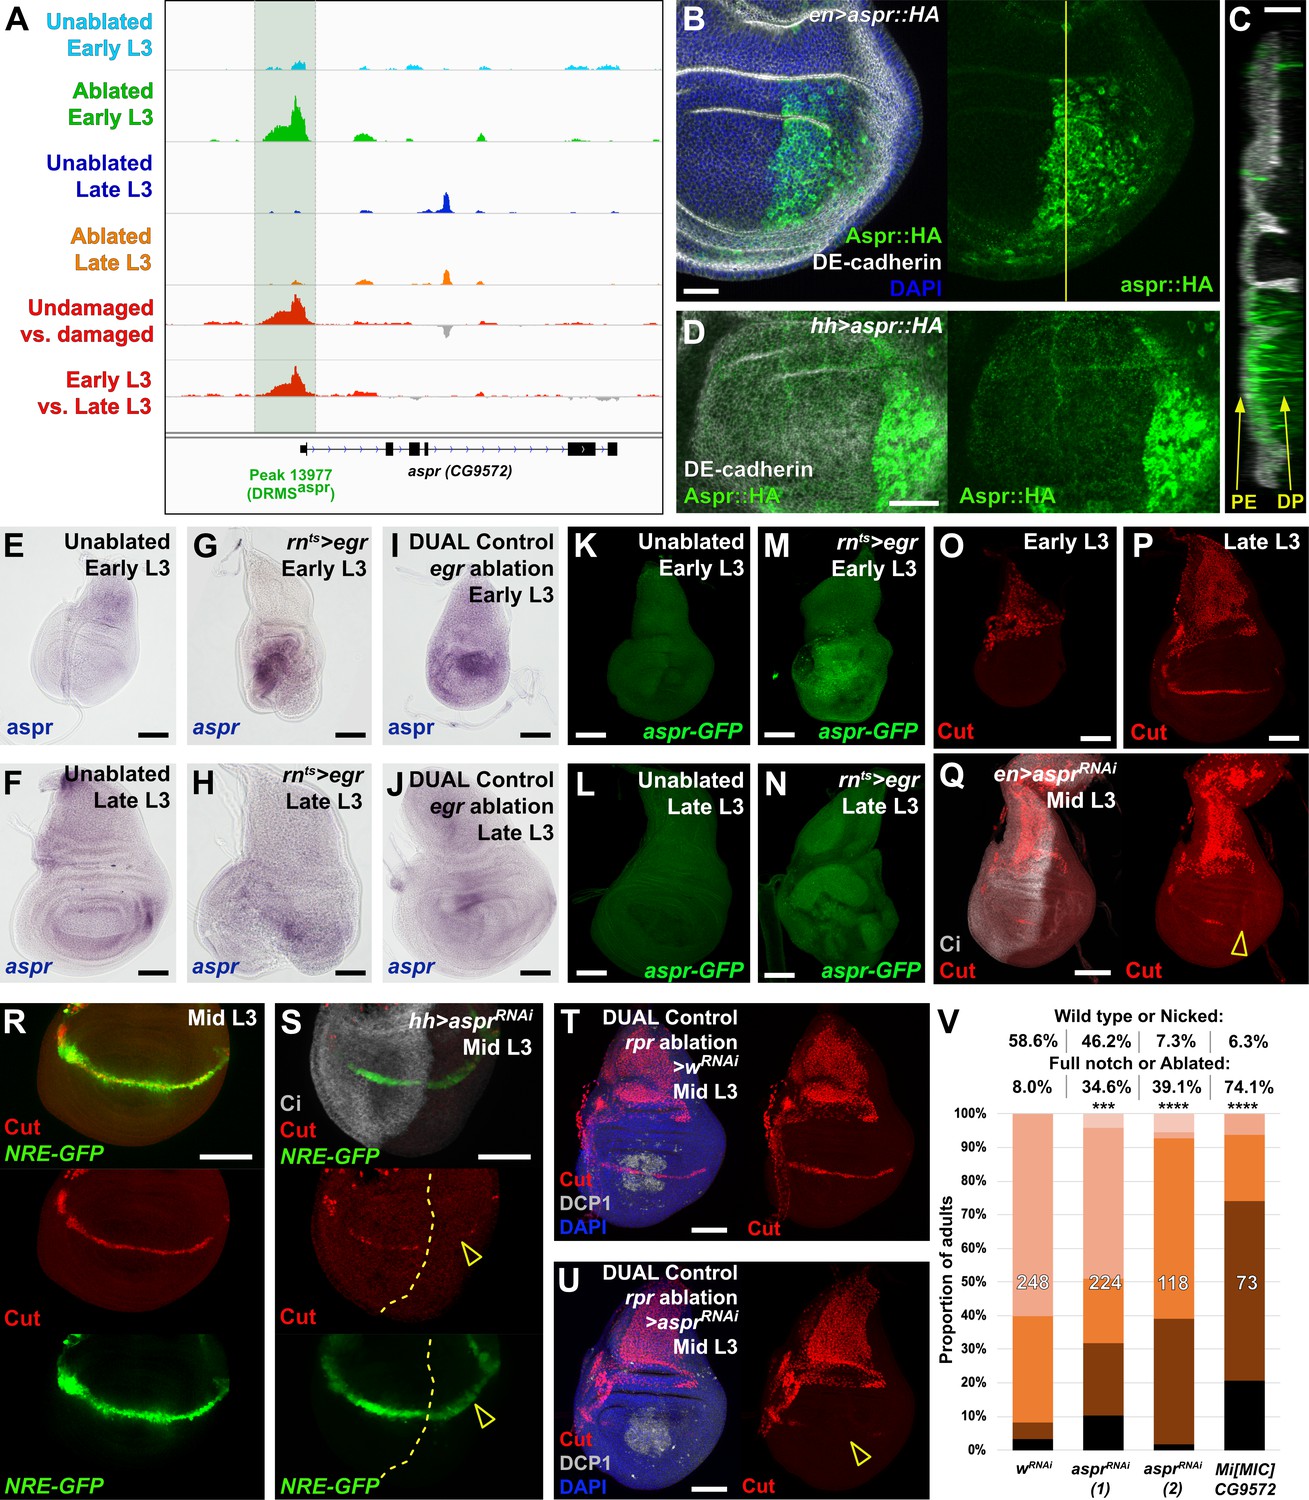
(A) ATAC-seq chromatin accessibility traces at the asperous (aspr) locus, showing the computationally detected DRMS peak that was experimentally validated as a DRMS enhancer (DRMSaspr, dark green box), (B) Ectopic expression of an epitope tagged Aspr (Aspr::HA, green) in the posterior compartment using en-GAL4. The protein is cytoplasmic and is mostly excluded from nuclei. DE-cadherin (gray). DAPI: blue. Yellow line indicates plane of image in (C), (C) Z-section though the disc shown in (B), showing mostly apical localization of Aspr::HA in the expressing cells (green), and presence of Aspr::HA between the disc proper (DP) and peripodial epithelium (PE), suggesting extracellular localization. DE cadherin shows cell membranes (gray), (D) High magnification imaging of an apical disc section of a disc expressing Aspr::HA (green) under the control of hh-GAL4, showing punctae of staining away from the expressing cells at a level between the peripodial membrane and the disc proper epithelium, (E–F) RNA in situ hybridization detects weak aspr expression in the ventral and lateral areas of the disc in early L3 (E) and late L3 (F) discs, but is mostly absent from the pouch, (G–J) RNA in situ hybridization detecting aspr in early L3 (G and I) or late L3 (H and J) discs following ablation with egr using rnts> (G–H) or DUAL Control (I–J). In both cases, aspr is upregulated in blastema cells in the pouch upon ablation in early L3 discs, but only weakly in late L3, (K–N) Expression of an aspr GFP MiMIC reporter line (green) in early L3 (K and M) and late L3 discs (L and N) during normal development (K–L) and following ablation with rnts>egr (M–N). Consistent with the RNA in situ expression data, aspr reporter activity is mostly absent during normal development, being activated by damage in early L3 discs, with reduced activity in late L3 discs, (O–P) Expression of cut during normal development in early L3 (O) and late L3 (P) wing discs. Cut protein (red) is detected in cells of the notum, including myoblasts and trachea, at both developmental time points, and becomes upregulated at the D-V boundary in late L3 in response to Notch signaling, (Q) Knockdown of aspr in the posterior compartment with en-GAL4 driving aspr RNAi delays onset of cut expression, as shown by a lack of Cut at mid L3 (open arrowhead) when it usually extends across the entire posterior compartment. Ci: Gray, (R–S) Cut protein (red) and a Notch reporter NRE-GFP (green) in mid-L3 wing discs, showing expression of both extending across the entire D-V boundary in wild type discs (R), while discs expressing aspr RNAi in the posterior compartment using hh-GAL4 have delayed expression of Cut and weaker NRE-GFP activity (S, open arrowheads). Ci (gray) demarcates A-P compartment boundary (yellow dotted line), (T–U) Mid L3 discs ablated with rpr using DUAL Control DVE>>GAL4 and driving a control RNAi (T) or aspr RNAi (U). Cut protein (red) is quickly reestablished following rpr ablation with a control RNAi, and extends across the D-V boundary (T). Knockdown of aspr in the entire pouch with DVE>>GAL4 prevents reestablishment of Cut during regeneration (U, open arrowhead). DCP1: gray, DAPI: blue, (V) Knockdown of aspr using two different RNAi lines, or heterozygosity for a presumed aspr mutant (Mi[MIC]CG9572), in discs ablated with rpr using DUAL Control DVE>>GAL4 reduces regeneration compared to wRNAi control, as assessed by wing size. *** p = 0.0007 (asprRNAi (1)), **** p <0.0001, Fisher exact test. Scale bars in (B–D) = 20 μm, other scale bars = 50 μm.
Figure 5—figure supplement 1
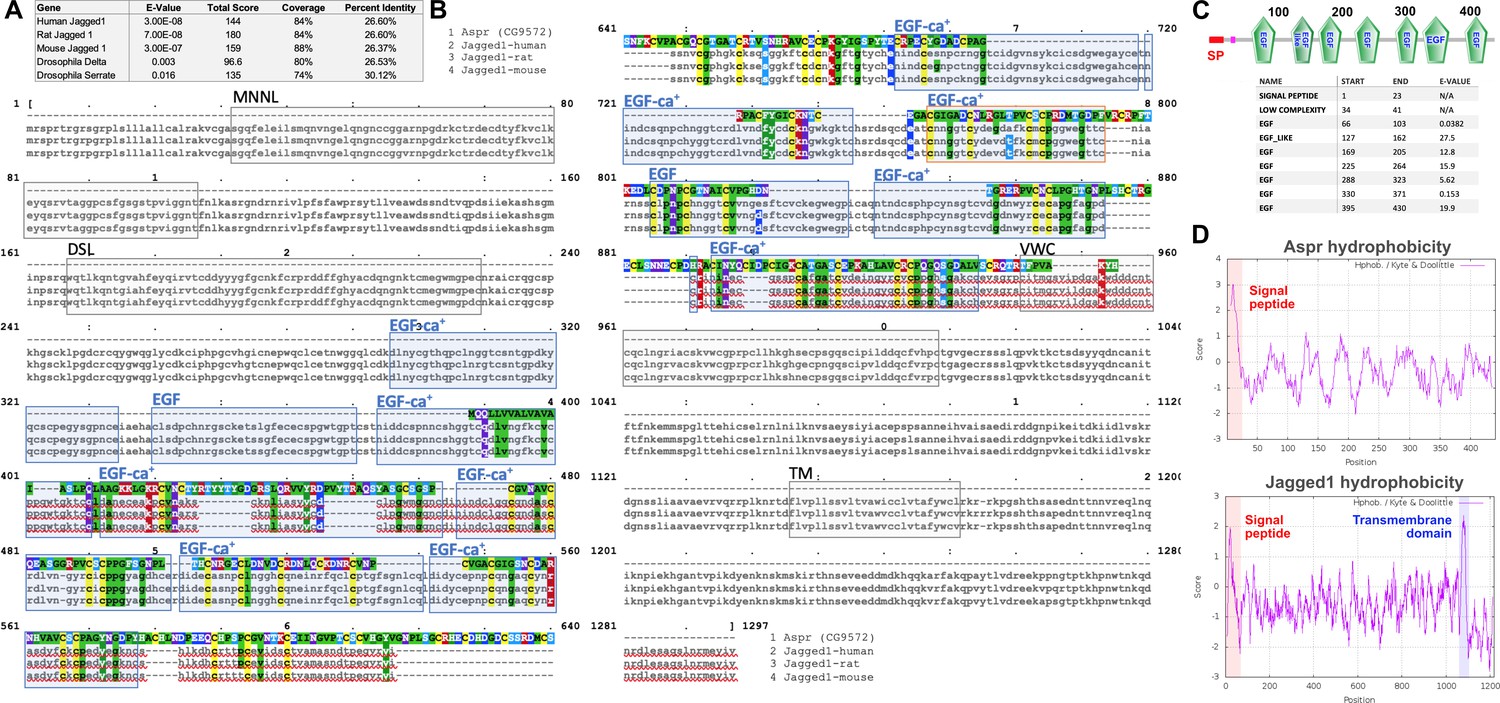
asperous (aspr, CG9572) peptide sequence is consistent with a non-membrane bound Notch ligand.
(A) Table showing protein blast (blastp) results of Aspr against known Notch ligands of Drosophila (Delta and Serrate) and Jagged proteins of human, rat and mouse, showing a high similarity to the mammalian Jagged proteins, (B) Alignment of Aspr protein sequence with that of Jagged from human, rat and mouse, showing high regions of similarity in predicted EGF repeats. Blue boxes: Predicted EGF or EGF-ca+ domains in all species, Orange box: EGF repeat in mouse and rat. MNNL: N terminus of Notch ligand domain, DSL: Delta/Serrate/Lag-2 domain, VWC: von Willebrand factor type C domain, TM: Transmembrane domain, (Clustal omega, https://www.ebi.ac.uk/services), (C) Predicted domain structure of Aspr showing EGF repeats (green) and an N terminal signal peptide (SP, red box), Coordinates of the predicted domains in Aspr, and their expected value is shown, (SMART protein annotation tool, http://smart.embl-heidelberg.de), (D) Hydropathy plots of the Aspr peptide sequence and mouse Jag1, showing the N-terminal hydrophobic signal peptide sequence (red box), and the transmembrane region in Jag1 (blue box) that is absent from Aspr, (ProtScale, https://web.expasy.org/protscale).
Figure 5—figure supplement 2

aspr promotes regeneration.
(A–B) Adult wings from discs ectopically expressing aspr with rn-GAL4 constitutively driving UAS-aspr::HA (A) or knockdown of aspr using UAS-asprRNAi (B) at 25°C. Wings have no obvious developmental defects, (C) Disc expressing Aspr::HA (green) in the posterior compartment using en-GAL4. DE-cadherin (gray) shows disruption of the pouch tissue due to unusual folding at the expression boundary of Aspr::HA (arrowhead). This fold is further highlighted by the disrupted Cut pattern (red, arrowhead), although levels and timing of Cut expression are otherwise unaffected. Scale bars = 50 μm, (D) Discs ablated with rnts>egr and expressing control wRNAi and asprRNAi, assayed for regeneration by adult wing size as in Smith-Bolton et al., 2009. Graph illustrates the proportion of adults eclosing with the indicated wing phenotypes, with the number of wings scored for each condition shown. The percentage of wings scored as ‘full or 75%’ and ‘25% or 0%’ is labeled above. Knockdown of aspr using UAS-asprRNAi leads to a reduction in regenerated wing size, *** p = 0.0008, Fisher exact test, (E) Genome browser screenshot (www.Flybase.org) showing position and orientation of the Mi[MIC]CG9572 transposon insertion within the first intron (after the coding start site) of aspr. The GFP on the transposon acts as an enhancer trap for activity of aspr, while the intronic position likely prematurely terminates aspr transcription, (F) Semi-quantitative PCR of rnts>egr ablated discs from MiMIC hemizygous animals (Mi[MIC]CG9572[MI02471]/Y) show strongly reduced levels of aspr mRNA compared to ablated wild type (WT) discs, consistent with this line being a transcriptional mutant. Levels of mRNA in discs ectopically expressing aspr using rn-GAL4 (rn >aspr::HA) and in unablated wild type discs are shown as controls. Level of actin mRNA is shown as a amplification control for each sample, (G) Wing regeneration assay as in (D) using rnts>egr, comparing regeneration in male control flies versus hemizygous males with the Mi[MIC]CG9572 insertion. The Mi[MIC] line has strongly reduced ability to regrow wing tissue compared to the control at two different developmental time points, **** p <0.0001, * p = 0.032, Fisher exact test, (H) Discs ablated with rpr using DUAL Control and expressing UAS-aspr::HA using DVE>>GAL4, assayed for regeneration by adult wing size and compared to the standard control wRNAi. Graph illustrates the proportion of adults eclosing with the indicated wing phenotypes, with the number of wings scored for each condition shown. The percentage of wings scored as ‘wild type or nicked’ and ‘full notched or ablated’ is labeled above. Overexpression of aspr::HA does not strongly affect regeneration. ns: not significant, Fisher exact test.
Figure 6 with 2 supplements
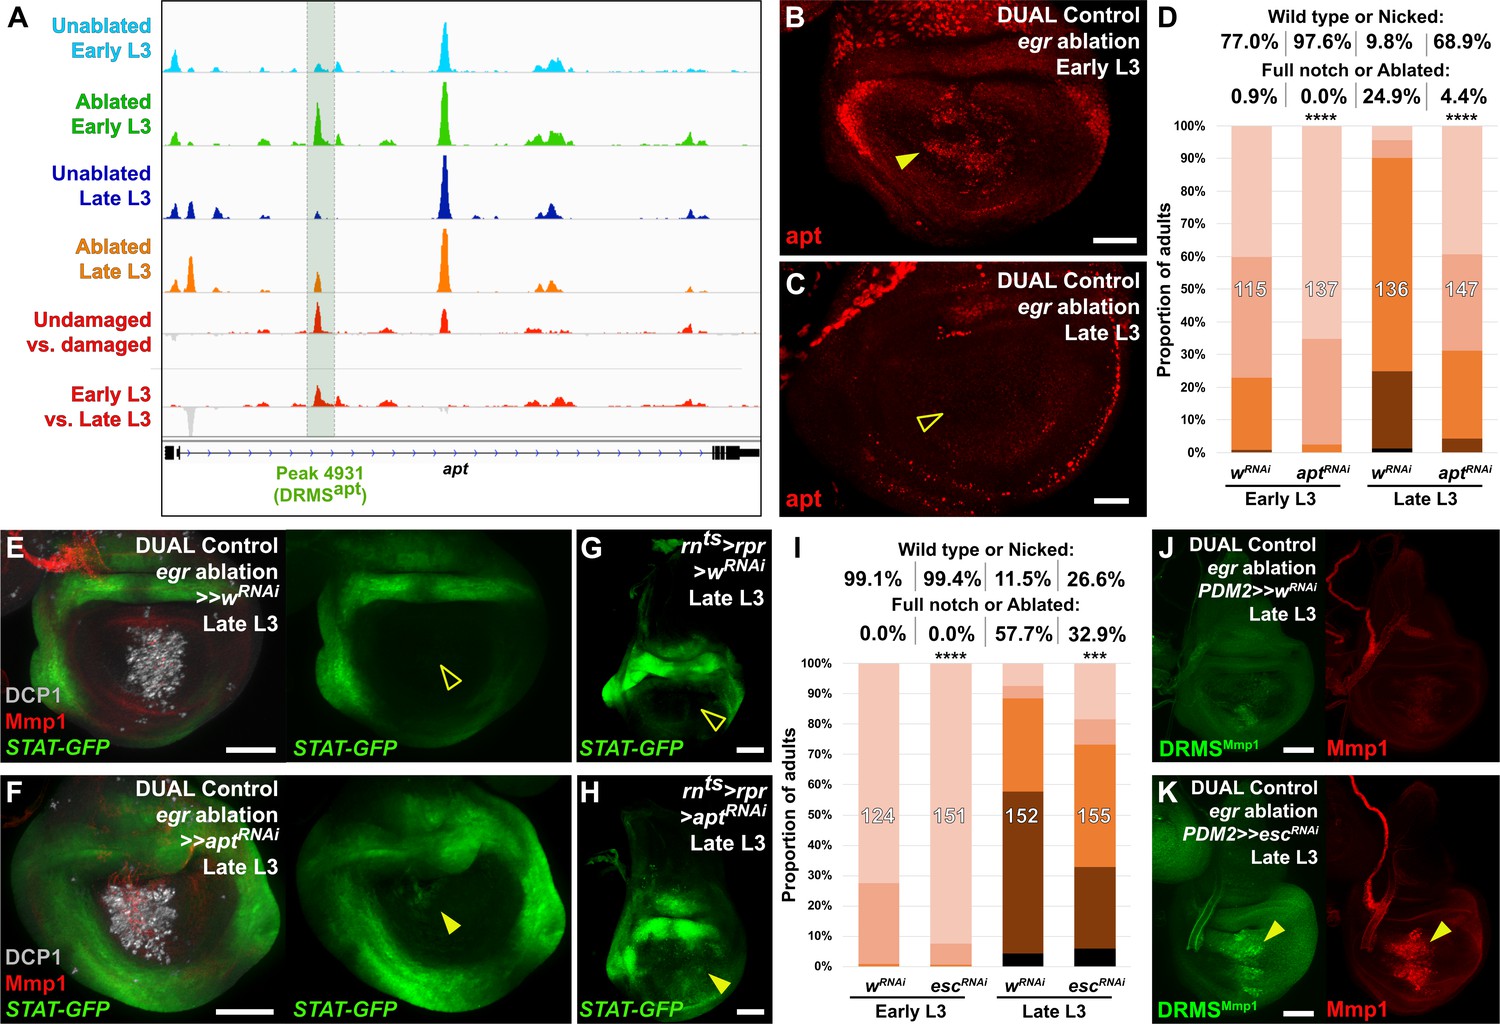
The DRMS enhancer-regulated gene apontic (apt) and the chromatin regulator esc can be manipulated to augment regenerative capacity in mature discs.
(A) ATAC-seq chromatin accessibility traces at the apt locus, showing the computationally detected DRMS peak that was experimentally validated as a DRMS enhancer (DRMSapt, dark green box), (B-C) Apt protein (red) detected in the disc proper in early L3 (B) and late L3 (C) discs ablated with egr using DUAL Control. Apt is expressed in blastema cells upon ablation in early L3 discs (arrowhead) but is absent in late L3 (open arrowhead). Developmental expression of apt persists in cells of the peripodial epithelium and trachea at both time points, (D) RNAi knockdown of damage-induced apt with DVE>>GAL4 in discs ablated with rpr using DUAL Control increases regeneration in both early and late L3 discs compared to wRNAi control, as assessed by wing size. **** p <0.0001, Fisher exact test, (E-H) Late L3 discs bearing a Stat92E reporter (STAT-GFP) ablated with DUAL Control DVE>> using egr (E-F) or rnts>rpr (G-H) in the presence of control RNAi (E and G) or apt RNAi (F and H). Ablation in control samples shows no increase in reporter activity in the regenerating cells of late L3 discs (E and G, open arrowheads), while knockdown of apt in the pouch results in increased Stat92E reporter expression in cells surrounding the zone in the medial disc where ablation occurs using DUAL Control (F, arrowhead), or in the majority of the pouch when ablated with rnts>rpr, which targets the entire pouch (H, arrowhead). GFP expression from earlier developmental expression persists in the hinge region of all samples. DCP1: gray, Mmp1:red, (I) RNAi knockdown of damage-induced esc with PDM2>>GAL4 in discs ablated with rpr using DUAL Control increases regeneration in both early and late L3 discs compared to wRNAi control, as assessed by wing size. **** p <0.0001, Fisher exact test. (J-K) Late L3 discs bearing DRMSMmp1 GFP reporter (green) ablated with DUAL Control using egr. Control discs expressing a control RNAi (J) show little damage-induced reporter activity or Mmp1 expression (red). By comparison, knockdown of esc by PDM2>>GAL4 (K) increases damage-induced reporter expression and Mmp1 (arrowheads). Scale bars in (B) and (C) = 20 μm, other scale bars = 50 μm.
Figure 6—figure supplement 1
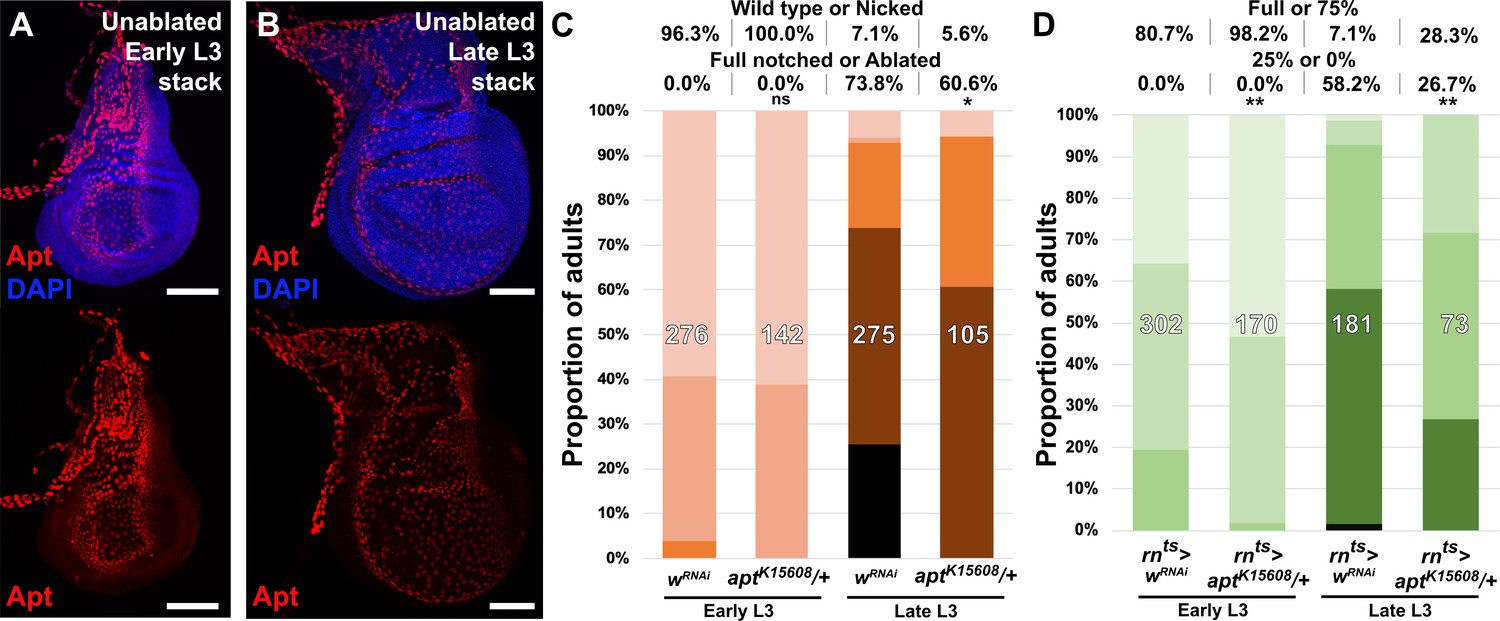
apt mutant discs have increased regenerative capacity.
(A–B) Levels of Apt detected by an anti-Apt antibody (red) in an early L3 (A) and late L3 (B) undamaged discs, showing very strong expression in the trachea and cells of the peripodial membrane overlaying the disc epithelium where expression is not detected. DAPI: blue, Scale bars = 50 μm, (C) Early and late L3 heterozygous apt mutant discs (aptK15608/+) ablated with rpr using DUAL Control and assayed for regeneration by wing size, with UAS-wRNAi as a control for regeneration scoring. Graph illustrates the proportion of adults eclosing with the indicated wing phenotypes, with the number of wings scored for each condition shown. The percentage of wings scored as ‘wild type or nicked’ and ‘full notched or ablated’ is labeled above. Assay shows apt mutant discs have a slightly increased regenerative capacity at both developmental time points, although this difference is only statistically significant in late L3, * p = 0.011, ns: not significant, Fisher exact test, (D) Early and late L3 heterozygous apt mutant discs (aptK15608/+) ablated with rnts>egr and assayed for regeneration by wing size as in Smith-Bolton et al., 2009, with UAS-wRNAi as a control for regeneration scoring. Graph illustrates the proportion of adults eclosing with the indicated wing phenotypes, with the number of wings scored for each condition shown. The percentage of wings scored as ‘full or 75%’ and ‘25% or 0%’ is labeled above. Assay shows apt mutant discs have increased regenerative capacity at both developmental time points, ** p = 0.0076 (early L3), ** p = 0.008 (late L3), Fisher exact test.
Figure 6—figure supplement 2
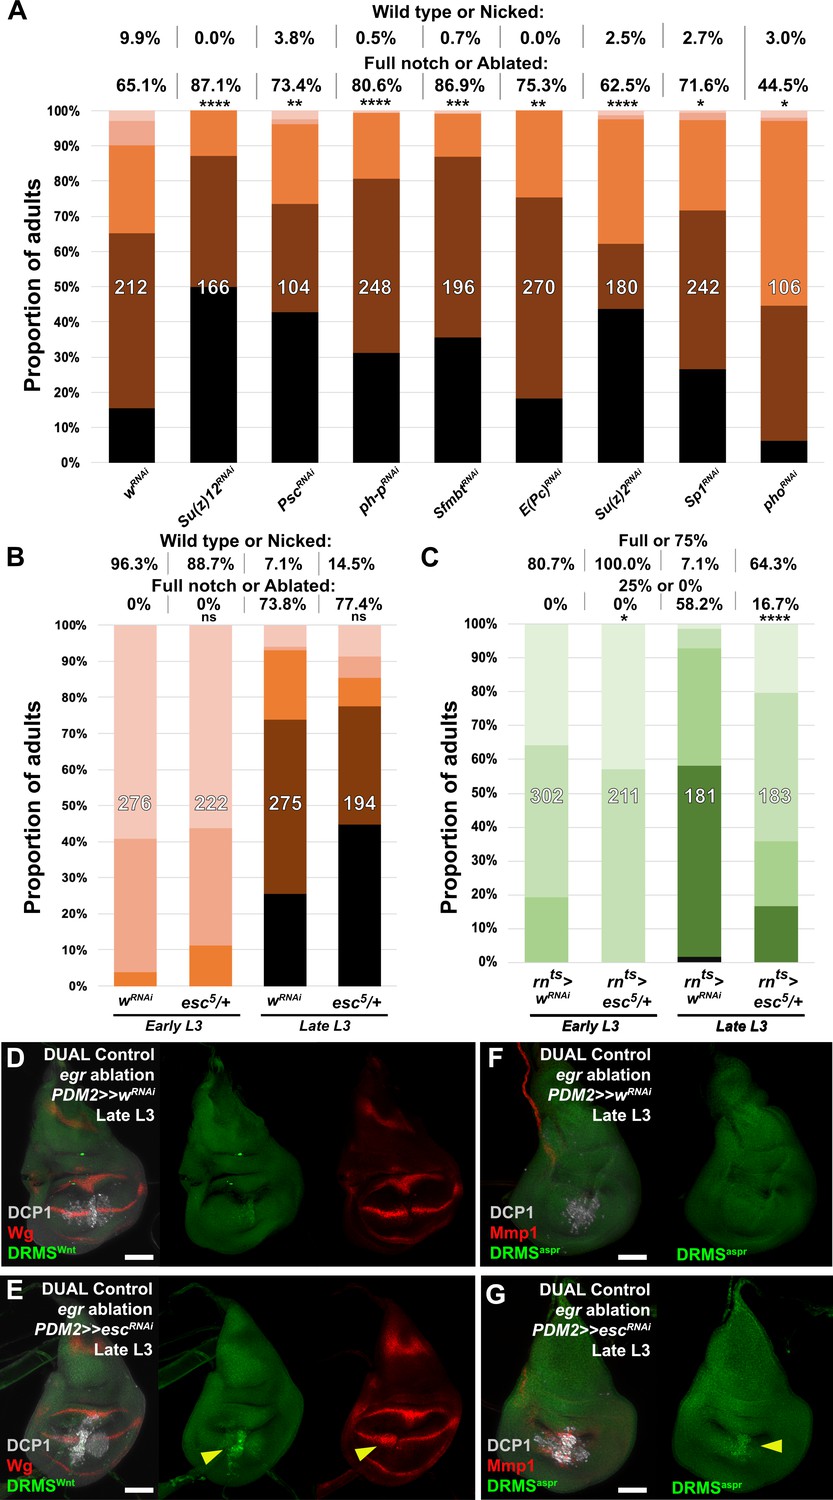
The chromatin regulator extra sex combs (esc) limits regenerative capacity in part via DRMS silencing.
(A) Knockdown of various epigenetic silencing factors in late L3 rpr ablated discs using DUAL Control PDM2>>GAL4. Graph illustrates the proportion of adults eclosing with the indicated wing phenotypes, with the number of wings scored for each condition shown. The percentage of wings scored as ‘wild type or nicked’ and ‘full notched or ablated’ is labeled above. The loss of most factors negatively impacts regeneration compared to the wRNAi control. **** p <0.0001, ** p = 0.003 (PscRNAi), *** p = 0.0002 (SfmbtRNAi), ** p = 0.003 (E(pc)RNAi), * p = 0.038 (Sp1RNAi), * p = 0.037 (phoRNAi), Fisher exact test, (B) Early or late L3 heterozygous esc mutant discs (esc5/+) ablated with rpr using DUAL Control and assayed for regeneration by wing size, with UAS-wRNAi as a control for regeneration scoring. Graph illustrates the proportion of adults eclosing with the indicated wing phenotypes, with the number of wings scored for each condition shown. The percentage of wings scored as ‘wild type or nicked’ and ‘full notched or ablated’ is labeled above. There is not a significant difference in regenerative capacity in esc mutant discs when ablated with DUAL Control. ns: not significant, Fisher exact test, (C) Early or late L3 heterozygous esc mutant discs (esc5/+) ablated with rnts>egr and assayed for regeneration by wing size as in Smith-Bolton et al., 2009, with UAS-wRNAi as a control for regeneration scoring. Graph illustrates the proportion of adults eclosing with the indicated wing phenotypes, with the number of wings scored for each condition shown. The percentage of wings scored as ‘full or 75%’ and ‘25% or 0%’ is labeled above. Assay shows loss of one copy of esc results in increased regenerative capacity at both developmental time points following ablation of the whole pouch using rnts>egr, * p = 0.024 (early L3), **** p <0.0001 (late L3), Fisher exact test, (D-G) Late L3 discs bearing DRMSWnt (D-E) and DRMSAspr (F-G) GFP reporters (green) ablated with DUAL Control using egr. Control RNAi discs (D and F) show little damage-induced reporter activity, or expression of wg or Mmp1 (red) at this late stage. By comparison, knockdown of esc by PDM2>>GAL4 increases damage-induced reporter expression (E and G arrowheads), as well as wg and Mmp1. DCP1: gray. Scale bars = 50 μm.
Additional files
-
Supplementary file 1
Pairwise comparisons of ATAC-seq data showing peaks above cutoff values in between each sample: young undamaged vs. young damaged, old undamaged vs. old damaged, young undamaged vs. old undamaged, young damaged vs. old damaged.
For each comparison the basic peak attributes are shown (chromosome, start and end dm3 coordinates, width in bp, unique peak ID and mean signal) and values of the peaks in each sample comparison (log2 fold change in signal, standard error, p value and adjusted p value).
- https://cdn.elifesciences.org/articles/58305/elife-58305-supp1-v2.xlsx
-
Supplementary file 2
ATAC-seq peaks categorized as damage-responsive (above cutoffs in young undamaged vs. young damaged), maturity-silenced (above cutoffs in young damaged vs. old damaged) or as damage-responsive, maturity-silenced (DRMS) peaks (at the intersection of the two).
Also shown are peaks categorized as damage-responsive in old discs (above cutoffs in old undamaged vs. old damaged) for completeness. Peak attributes and comparison values are shown as in Supplementary file 1.
- https://cdn.elifesciences.org/articles/58305/elife-58305-supp2-v2.xlsx
-
Supplementary file 3
Genes associated with each peak that is categorized as damage-responsive, maturity-silenced or DRMS, as in Supplementary file 2.
For each peak the closest two genes are shown, with the chromosome, start and stop coordinates, gene name, Flybase gene ID, the distance of the peak to the gene and the number of peaks associated with that gene.
- https://cdn.elifesciences.org/articles/58305/elife-58305-supp3-v2.xlsx
-
Supplementary file 4
List of primer sequences used for cloning Mmp1 GFP reporters (including subdivisions and Mmp-1-US region), DRMS enhancer regions and in situ probes for detecting aspr expression.
- https://cdn.elifesciences.org/articles/58305/elife-58305-supp4-v2.xlsx
-
Supplementary file 5
Regeneration scoring data and bar graphs of the stacked bar charts shown in main figures throughout this work.
Color schemes indicating the degree of regeneration are as in main figures, Y axis is percent of total adult flies scored. Error bars are SEM.
- https://cdn.elifesciences.org/articles/58305/elife-58305-supp5-v2.xlsx
-
Transparent reporting form
- https://cdn.elifesciences.org/articles/58305/elife-58305-transrepform-v2.docx
Download links
A two-part list of links to download the article, or parts of the article, in various formats.
Downloads (link to download the article as PDF)
Open citations (links to open the citations from this article in various online reference manager services)
Cite this article (links to download the citations from this article in formats compatible with various reference manager tools)
Damage-responsive, maturity-silenced enhancers regulate multiple genes that direct regeneration in Drosophila
eLife 9:e58305.
https://doi.org/10.7554/eLife.58305


