Dopamine promotes instrumental motivation, but reduces reward-related vigour
- Nuffield Department of Clinical Neurosciences, University of Oxford, United Kingdom
- Department of Psychology, University of Cambridge, United Kingdom
- Oxford Parkinson’s Disease Centre, University of Oxford, United Kingdom
- Department of Experimental Psychology, University of Oxford, United Kingdom
Figures
Figure 1

Saccade task design and example eye-tracking traces.
(a) Trial design: participants fixated on the centre, heard a cue for the condition (Performance/Random/10 p/0 p), waited a delay (1400/1500/1600 ms) and then looked towards to the circle that lit up, and were given 10 p or 0 p reward depending on the condition, along with feedback on their response time (fast/slow). (b) To measure contingent motivation, we compared ‘Performance’ trials, where participants had to be faster than their median RT to win reward (thus giving 50% trials rewarded on average), with ‘Random’ trials where a random 50% of trials were rewarded. To measure motivation by expected reward we compared ‘10 p’ trials where rewards were guaranteed, with ‘0 p’ trials where no-reward was guaranteed. (c) Example eye-position traces for one participant and condition (different colours are different trials). (d) Example mean velocity and acceleration profiles for all PD ON in the 10 p condition. (e) Example of the main sequence and velocity residuals – the points show a subset of individual trials illustrating the ‘main sequence’ relationship where larger saccades have greater velocity, shown by the regression line. The distance from each point to its line is the velocity residual, which we take as out main measure of response vigour. (f) Peak velocity of individual saccades increases with the amplitude of movement – the ‘main sequence’; example showing the 10 p condition, for PD ON, OFF and HC. Saccadic vigour, our measure of interest, was indexed by the residuals after regressing out amplitude from peak velocity, for each participant.
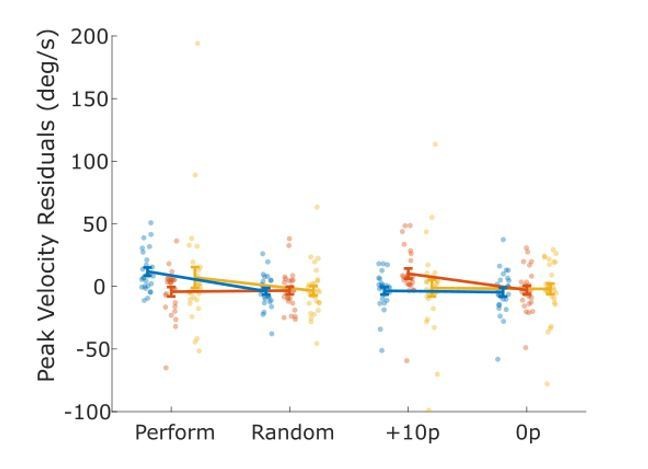
Figure 2
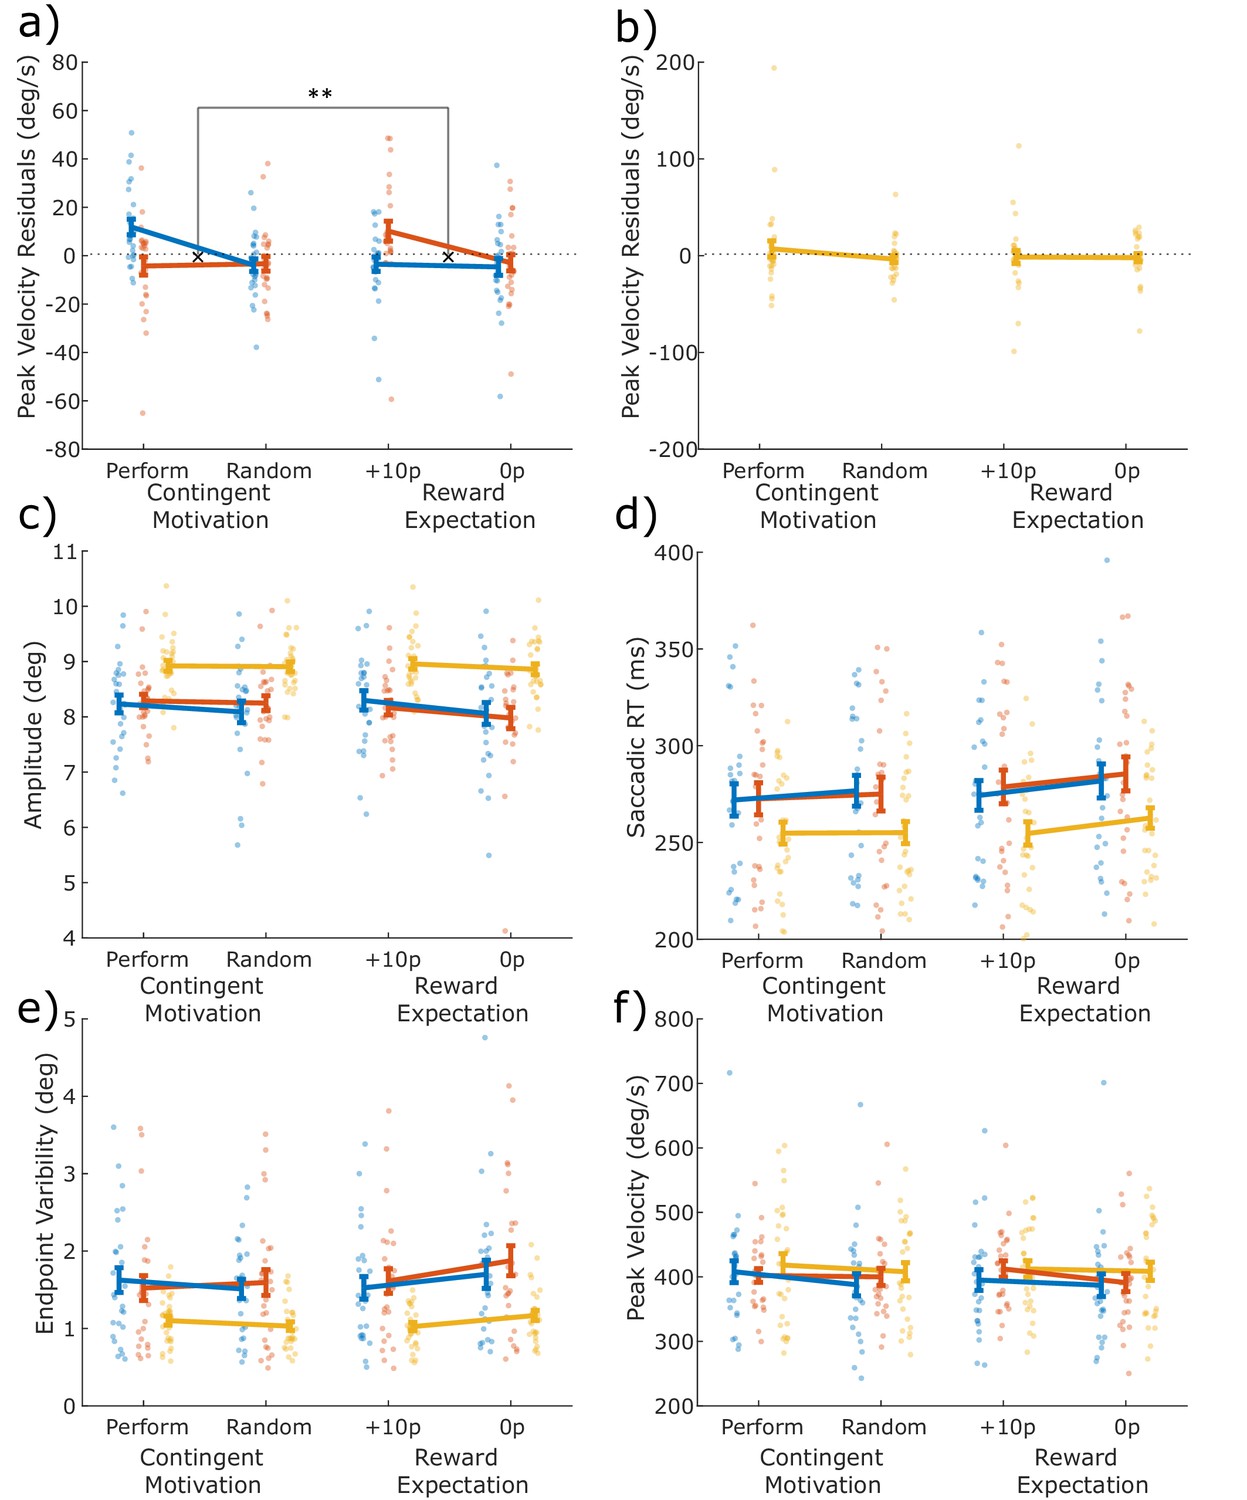
Differential effects of dopamine on two types of motivation.
The mean measures for the four conditions (Performance, Random, Guaranteed 10p, Guaranteed 0p) for each variable, with individual data points. The difference between Performance and Random shows the effect of Contingent motivation, while the difference between 10p and 0p shows the motivating effect of reward expectation. (a) Peak velocity residuals indexed behavioural vigour. When ON dopamine, patients were motivated to invigorate their saccades when reward depended on response time, but not when expecting a guaranteed reward. In contrast, when OFF dopamine, vigour was driven by expectation of guaranteed reward, but not by contingency (F (1, 200) = 9.5190, p = .0023, = . 0454). (b) HC were similar to PD ON dopamine (please note the different y-axis limits). (c–e) No dopaminergic effects were observed for (c) saccade amplitude, (d) saccade RT, (e) endpoint variability, or (f) raw peak velocity, although PD patients had slower, smaller and more variable saccades than HC. All measures are in visual degrees, except saccade RT (ms). Error bars show within-subject SEM. Statistics are presented in Table 2. Data are available in Figure 2—source data 1.
-
Figure 2—source data 1
Source individual data for all saccade measures for PD ON, OFF and HC.
The figures can be constructed using the DrawSaccadeFigures.m Matlab file available from the ContingentAnalysis GitHub repo (see Data and Code Availability section of manuscript).
- https://cdn.elifesciences.org/articles/58321/elife-58321-fig2-data1-v2.mat.zip
Figure 3 with 1 supplement
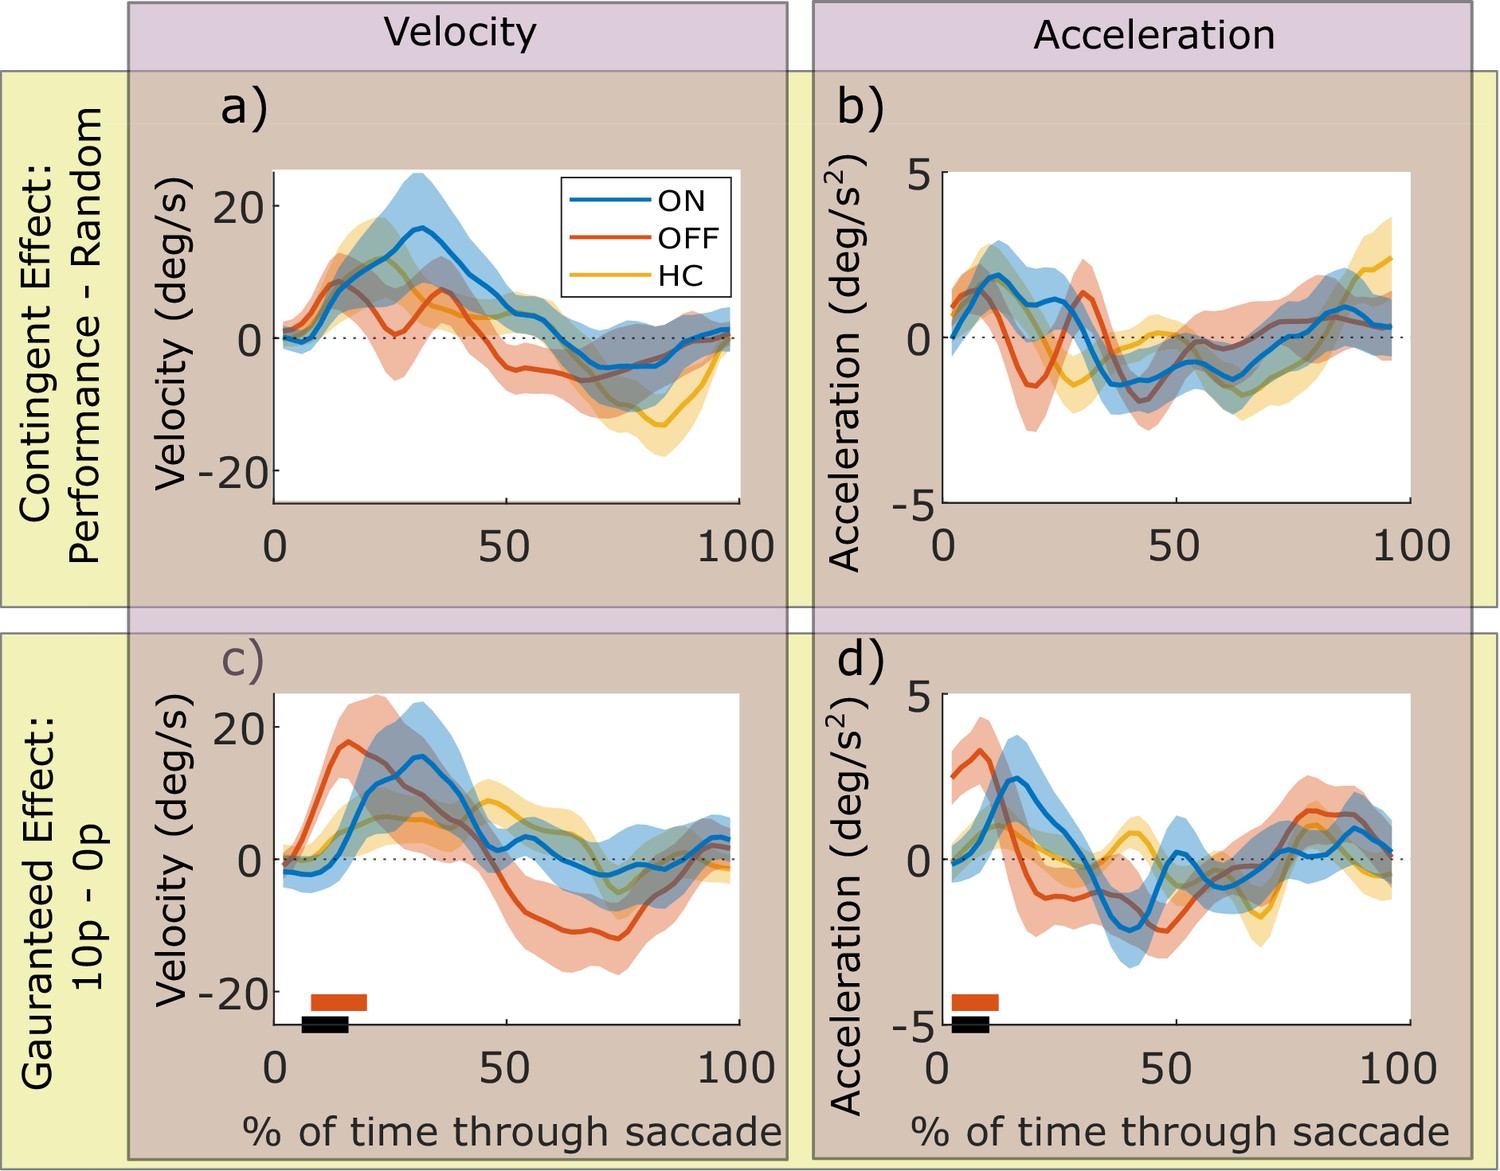
Motivational effects on instantaneous velocity and acceleration within a saccade.
The top row shows the effects of contingent rewards (i.e. measures in Performance conditions minus the Random condition), and the bottom row shows effects of guaranteed rewards (10 p condition minus 0 p condition). The x-axis is % of normalised time where 0 indicates the start of a saccade, and 100 is the end. The instantaneous velocity (a and c) is increased by contingent (a) and guaranteed (c) rewards, and PD patients OFF have an earlier and greater increase in velocity for guaranteed rewards than PD ON. The orange bar shows time-points where PD OFF had velocity significantly greater than zero (cluster-wise permutation tests, p<0.05), the black bar shows time-points where PD ON and OFF significantly differed (PD ON and HC did not differ from zero, so there are no blue or yellow bars). Acceleration traces (b and d) showed this was due to guaranteed motivation increasing acceleration at the start of the movement for PD OFF (d; significant cluster, p<0.05). Shading shows SEM. Source data are available in Figure 3—source data 1. Figure 3—figure supplement 1. Individual participants’ velocity and acceleration traces.
-
Figure 3—source data 1
Source individual data for saccade velocity and acceleration for PD ON, OFF and HC.
The figures can be constructed using the DrawVelFigures.m Matlab file available from the ContingentAnalysis GitHub repo (see Data and Code Availability section of manuscript).
- https://cdn.elifesciences.org/articles/58321/elife-58321-fig3-data1-v2.mat.zip
Figure 3—figure supplement 1
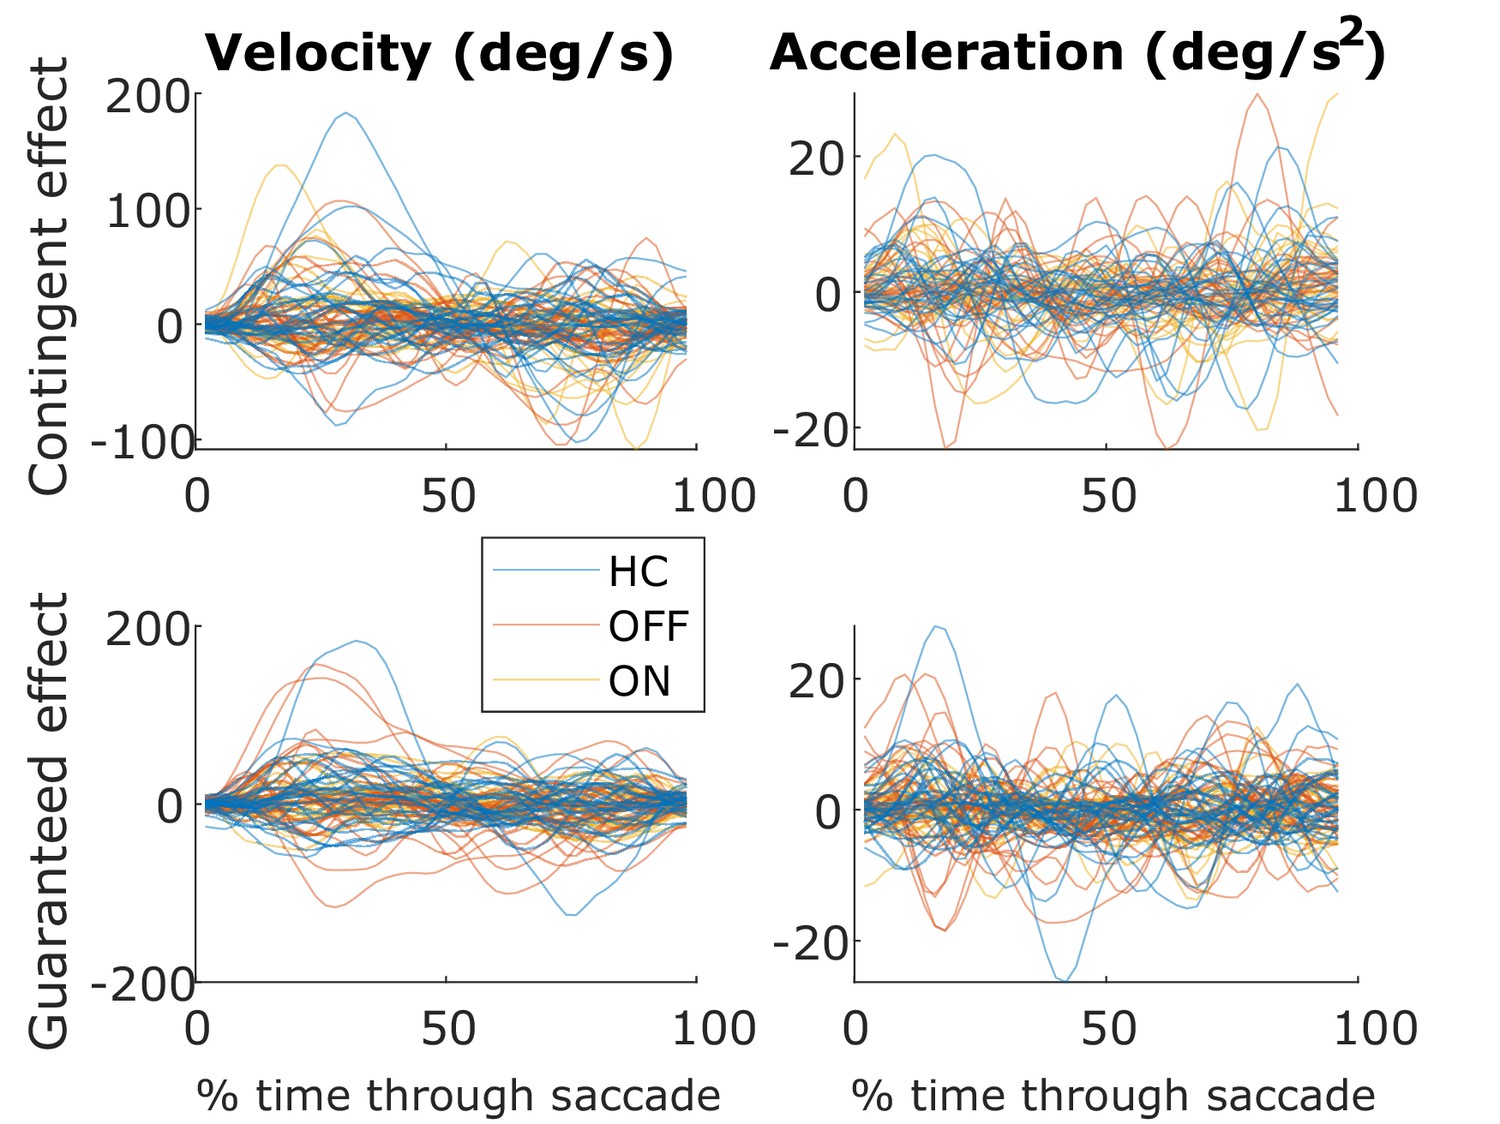
Individual participants’ velocity and acceleration traces.
Individual data showing each participant’s mean effects of contingent (Performance – Random) and guaranteed (10 p – 0 p) rewards on velocity and acceleration during saccades.
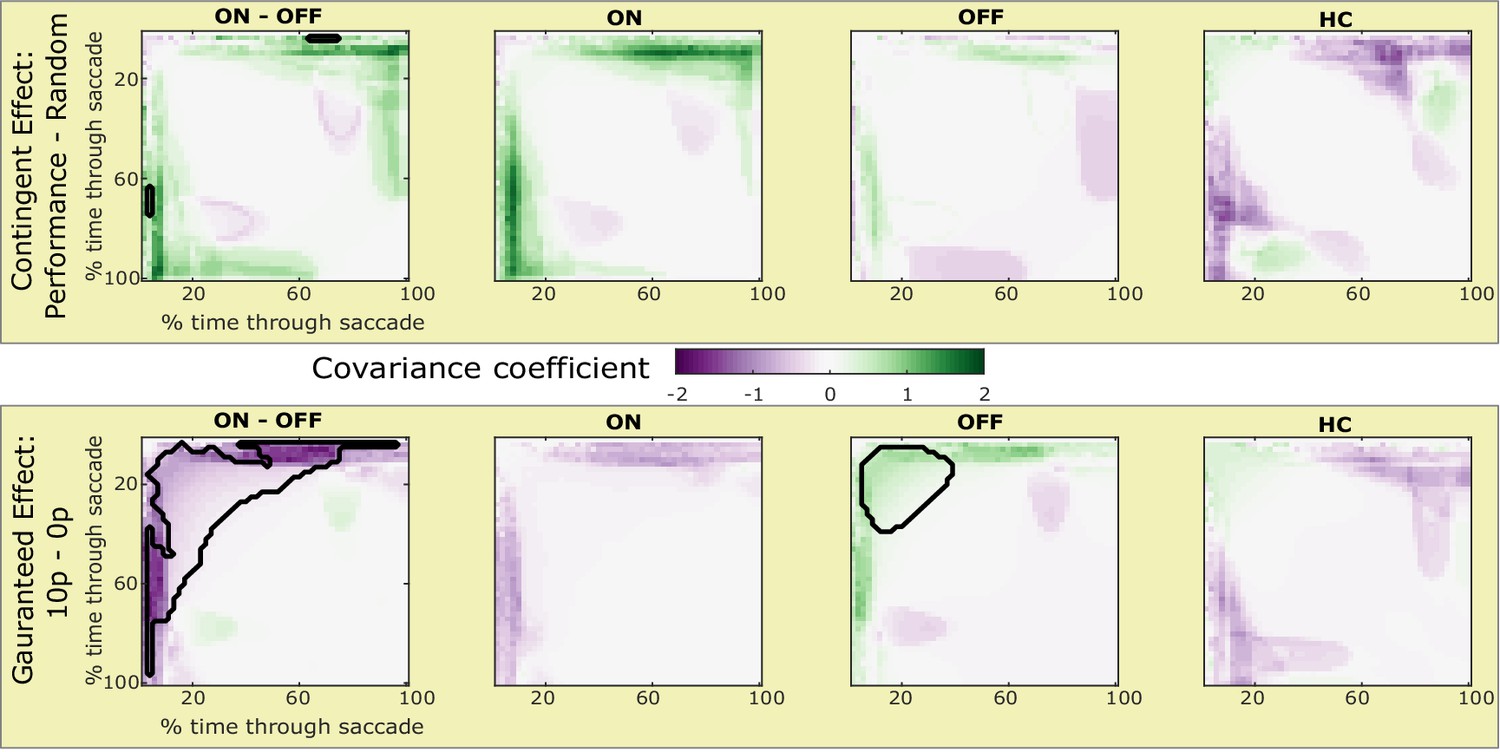
Figure 4 with 1 supplement

Motivational effects on eye-position autocorrelation within saccades.
Each image shows the effect of reward on mean correlation coefficient between the eye-position at one (interpolated) time-point within a saccade with all other time-points in that same saccade. As noise accumulates during the movements, the correlations increase over the time-points, while reductions in correlation can suggest negative feedback during movements. The top row shows the effect of contingent rewards (Performance – Random) on the (Fisher transformed) autocorrelation coefficients, and the bottom row shows the effect of guaranteed rewards (10 p – 0 p). Green areas mean that motivation increased correlation, while purple areas reflect a decrease, and clusters significantly different from zero are outlined in black (cluster permutation testing, p<0.05). When examining the dopaminergic effects (a and e: PD ON – OFF), a significant cluster was found, such that patients differed in their correlations early in the saccade when rewards were guaranteed (e). This was due to guaranteed rewards increasing early correlation only for PD OFF (g). The time of this increase matches the time of increased acceleration shown in Figure 3d. There was also a small cluster of significant difference between PD ON and OFF for contingent rewards (a), but there were no clusters within ON (b) or OFF (c) separately. HC had no clusters of significant differences (d and h). Source data are available in Figure 4—source data 1. Figure 4—source data 2. Individual data for autocorrelation. Figure 4—figure supplement 1. Motivational effects on saccade time-time covariance within saccades.
-
Figure 4—source data 1
Source individual data for autocorrelation coefficients for PD ON, OFF and HC.
The figures can be constructed using the DrawAutocorrelFigures.m Matlab file available from the ContingentAnalysis GitHub repo (see Data and Code Availability section of manuscript).
- https://cdn.elifesciences.org/articles/58321/elife-58321-fig4-data1-v2.mat.zip
-
Figure 4—source data 2
Individual participants’ autocorrelation matrices.
Individual data showing each participant’s mean effects of contingent (Performance – Random) and guaranteed (10 p – 0 p) rewards on (Fisher transformed) eye-position autocorrelation matrices. Blank matrices for PD patients reflect excluded participants.
- https://cdn.elifesciences.org/articles/58321/elife-58321-fig4-data2-v2.pdf
Figure 4—figure supplement 1
Motivational effects on time-time covariance within saccades.
Each plot shows the effect of motivation (top row = contingent, bottom row = guaranteed) on the signed log covariance matrix, for PD ON, OFF, HC, and the difference between PD ON and OFF. Green means motivation increased covariance, purple means a decrease, and the significant clusters are outlined in black (cluster-wise permutation testing, p<0.05). Cluster-wise permutation testing found that PD OFF had greater covariance early on when rewards were guaranteed, while PD ON had greater covariance when rewards were contingent. Please note that covariance is contaminated by variance, such that these changes may be due to higher or lower variance at particular time points, which is why we present the autocorrelation metric in the main Figure 4.
Figure 5
No correlations between contingent and guaranteed rewards.
Scatter plots of the effect of contingent and guaranteed rewards (i.e. contingent effect = Performance minus Random trials, guaranteed effect = guaranteed 10 p minus guaranteed 0 p trials) on peak velocity residuals, within each group (top row: PD ON, PD OFF, HC), and between medication conditions (bottom row). Dots show the mean values. No Spearman’s correlations were significant (ON: ρ = −0.1549, p=0.4503; OFF: ρ = 0.3730, p=0.0614; HC: ρ = −0.2153, p=0.2609; Contingent ON vs OFF: ρ = −0.3429, p=0.0869; Guaranteed ON vs OFF: ρ = 0.1432, p=0.4834; ON-OFF Contingent vs Guaranteed: ρ = −0.2438, p=0.2291).
-
Figure 5—source data 1
Source individual data for velocity residual correlations for PD ON, OFF and HC.
The figures can be constructed using the DrawCorrelFigures.m Matlab file available from the ContingentAnalysis GitHub repo (see Data and Code Availability section of manuscript).
- https://cdn.elifesciences.org/articles/58321/elife-58321-fig5-data1-v2.mat.zip
Figure 6 with 2 supplements
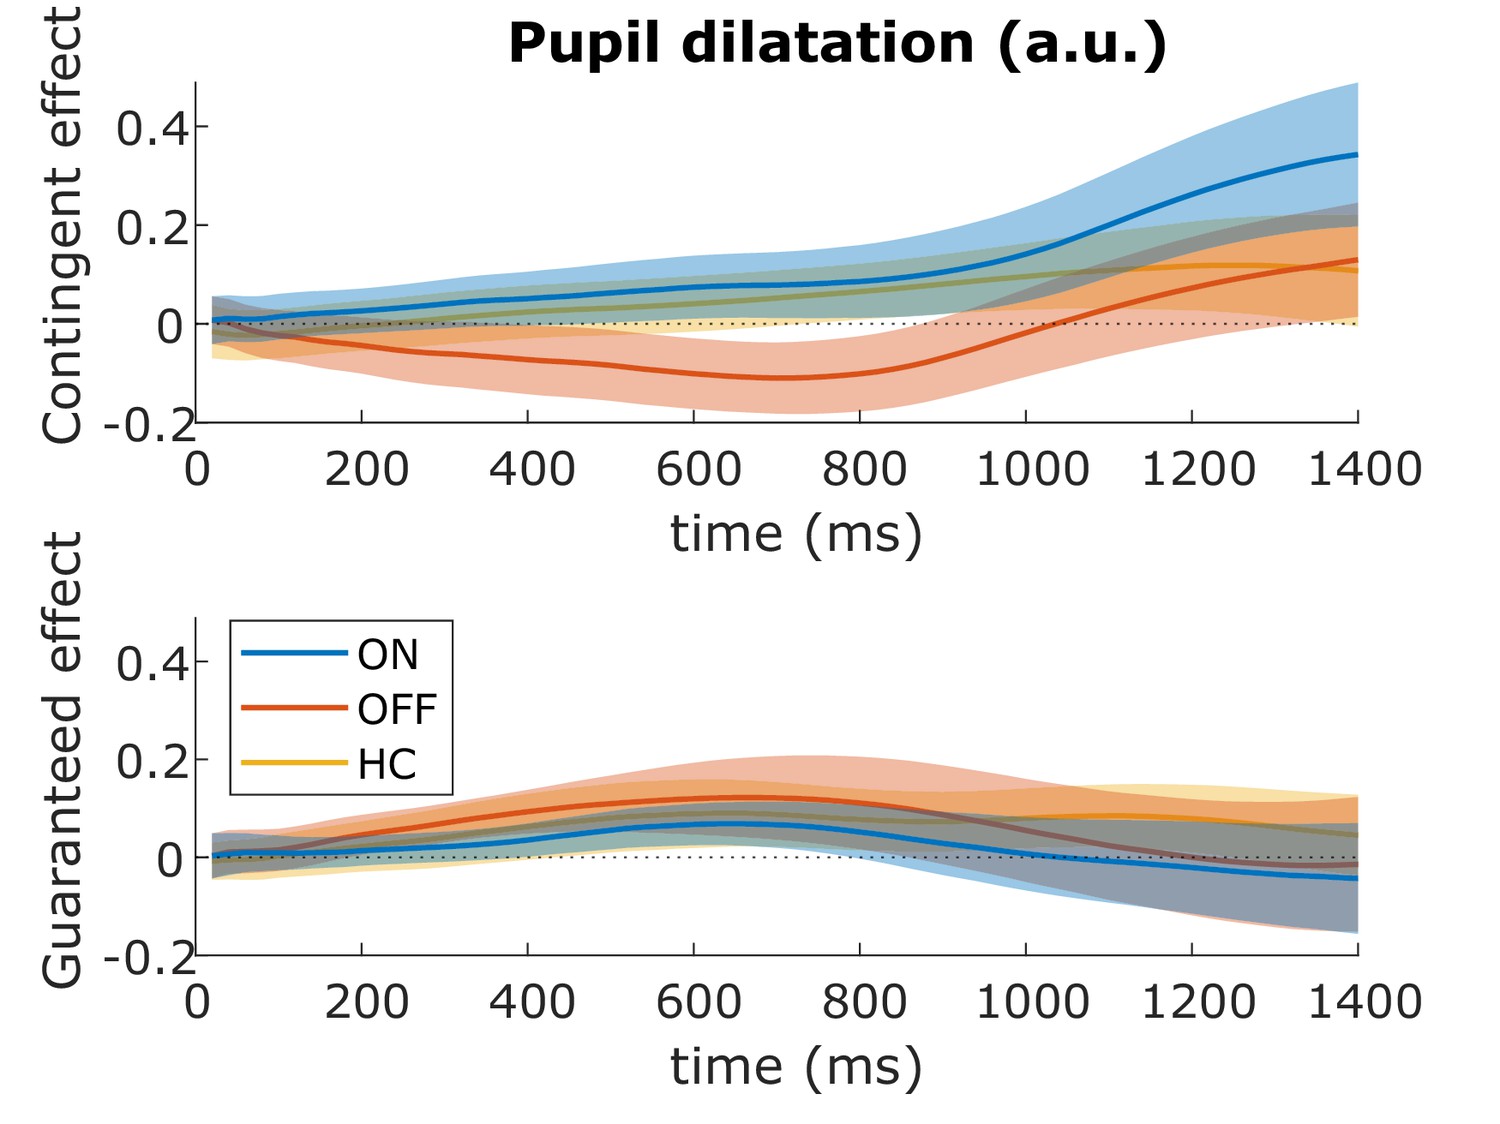
No effects of motivation on pupil dilatation.
The effects of contingent (top) and guaranteed rewards (bottom) on pupil dilatation in the different conditions up to 1400 ms after the reward cue. Pupil dilatation is baselined to the time of cue onset. There were no significant clusters of difference between any groups (cluster-wise permutation testing: p>0.05), nor did a window-of-interest (1000–1400 ms) ANOVA find any significant effects (Supplementary file 2A-C). Shading shows SEM. Source data are available in Figure 6—source data 1. Figure 6—figure supplement 1. No correlation of pupil dilatation and motivational effects on velocity. Figure 6—figure supplement 2. Individual data for pupil dilatation.
-
Figure 6—source data 1
Source individual data for pupil dilatation for PD ON, OFF and HC.
The figures can be constructed using the DrawPupilFigures.m Matlab file available from the ContingentAnalysis GitHub repo (see Data and Code Availability section of manuscript).
- https://cdn.elifesciences.org/articles/58321/elife-58321-fig6-data1-v2.mat.zip
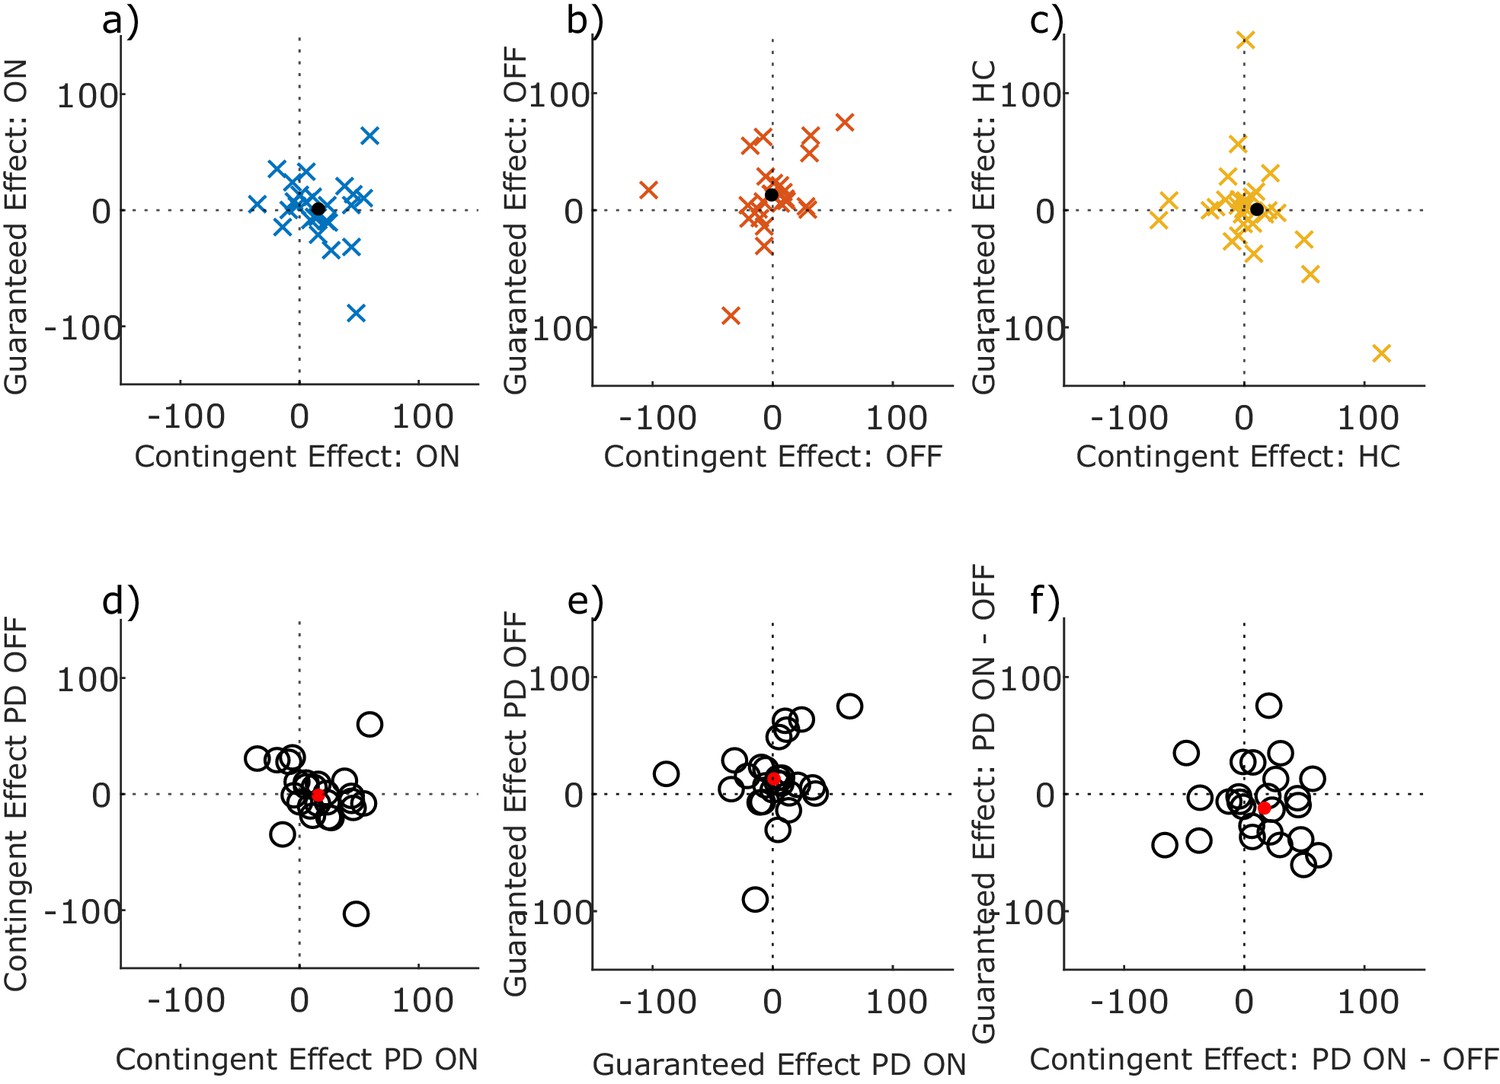
Figure 6—figure supplement 1
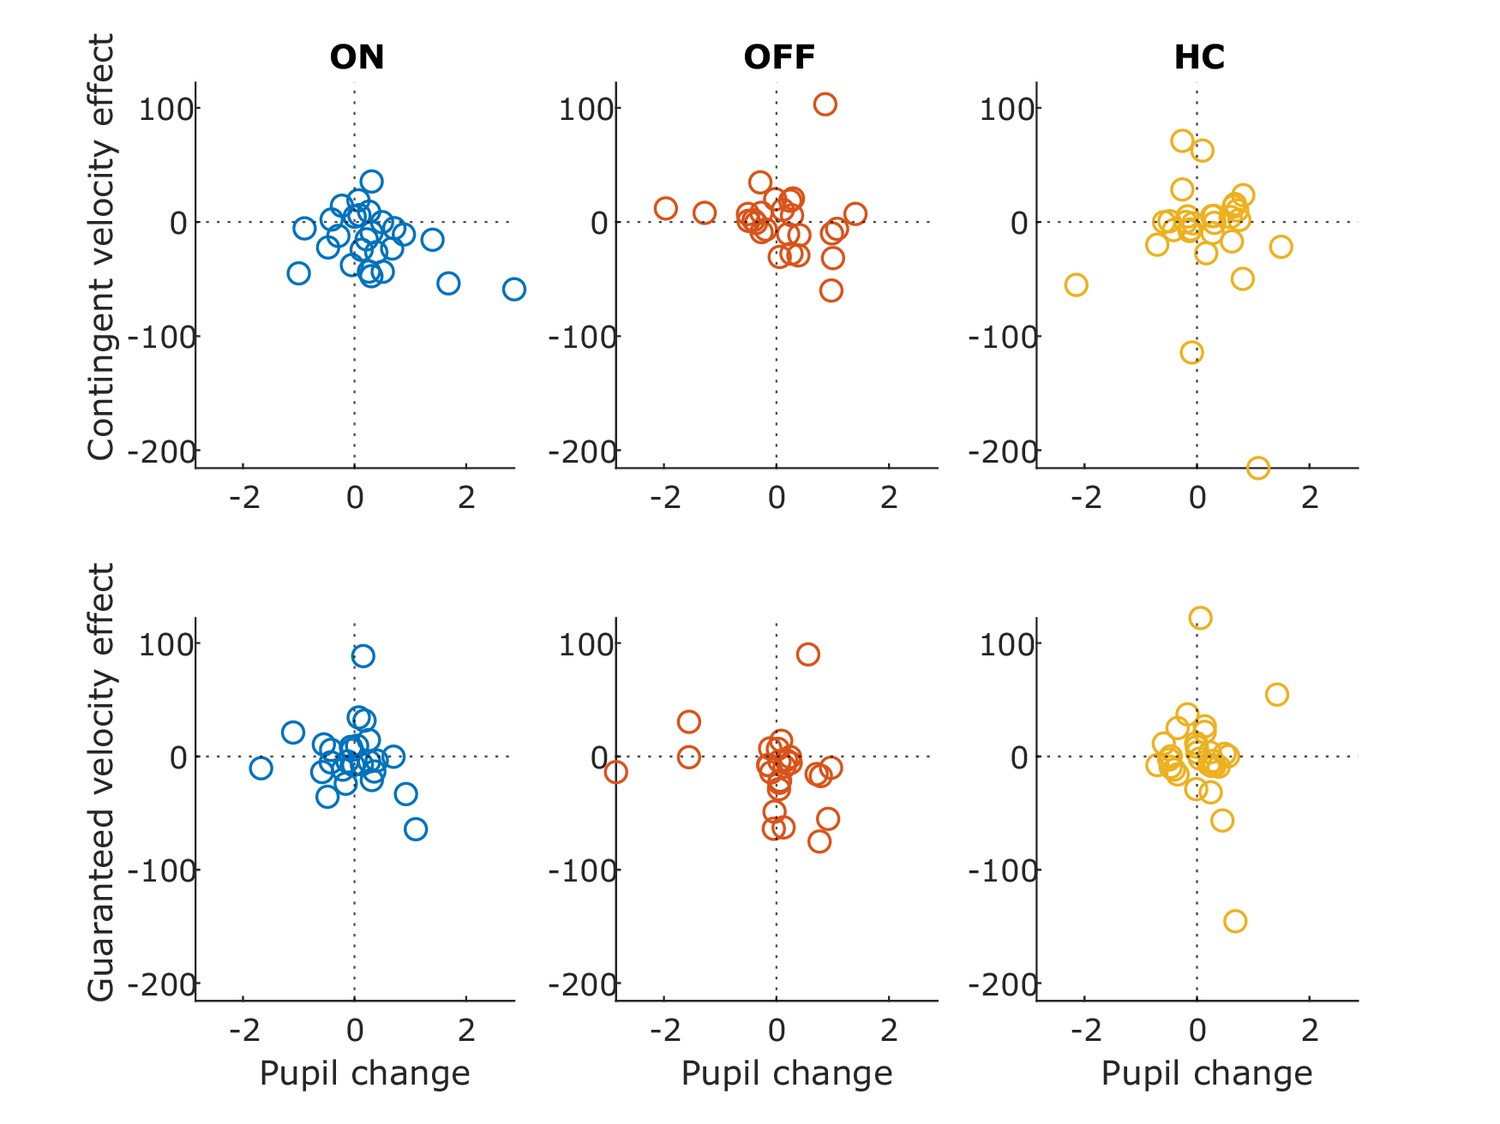
No correlation of pupil dilatation and motivational effects on velocity.
Scatter plots of the effect of contingent and guaranteed rewards (i.e. contingent effect = Performance minus Random trials, guaranteed effect = guaranteed 10 p minus guaranteed 0 p trials) on pupil dilatation and peak velocity residuals, within each group (top row = Contingent effects, bottom row = Guaranteed effects; columns = groups). No Spearman’s correlations were significant (Contingent ON: ρ = −0.2759, p=0.1720; OFF: ρ = −0.0182, p=0.9257; HC: ρ = −0.2123, p=0.2964; Guaranteed ON: ρ = −0.3224, p=0.1085; OFF: ρ = −0.0813, p=0.6931; HC: ρ = −0.0990, p=0.6080).
Figure 6—figure supplement 2
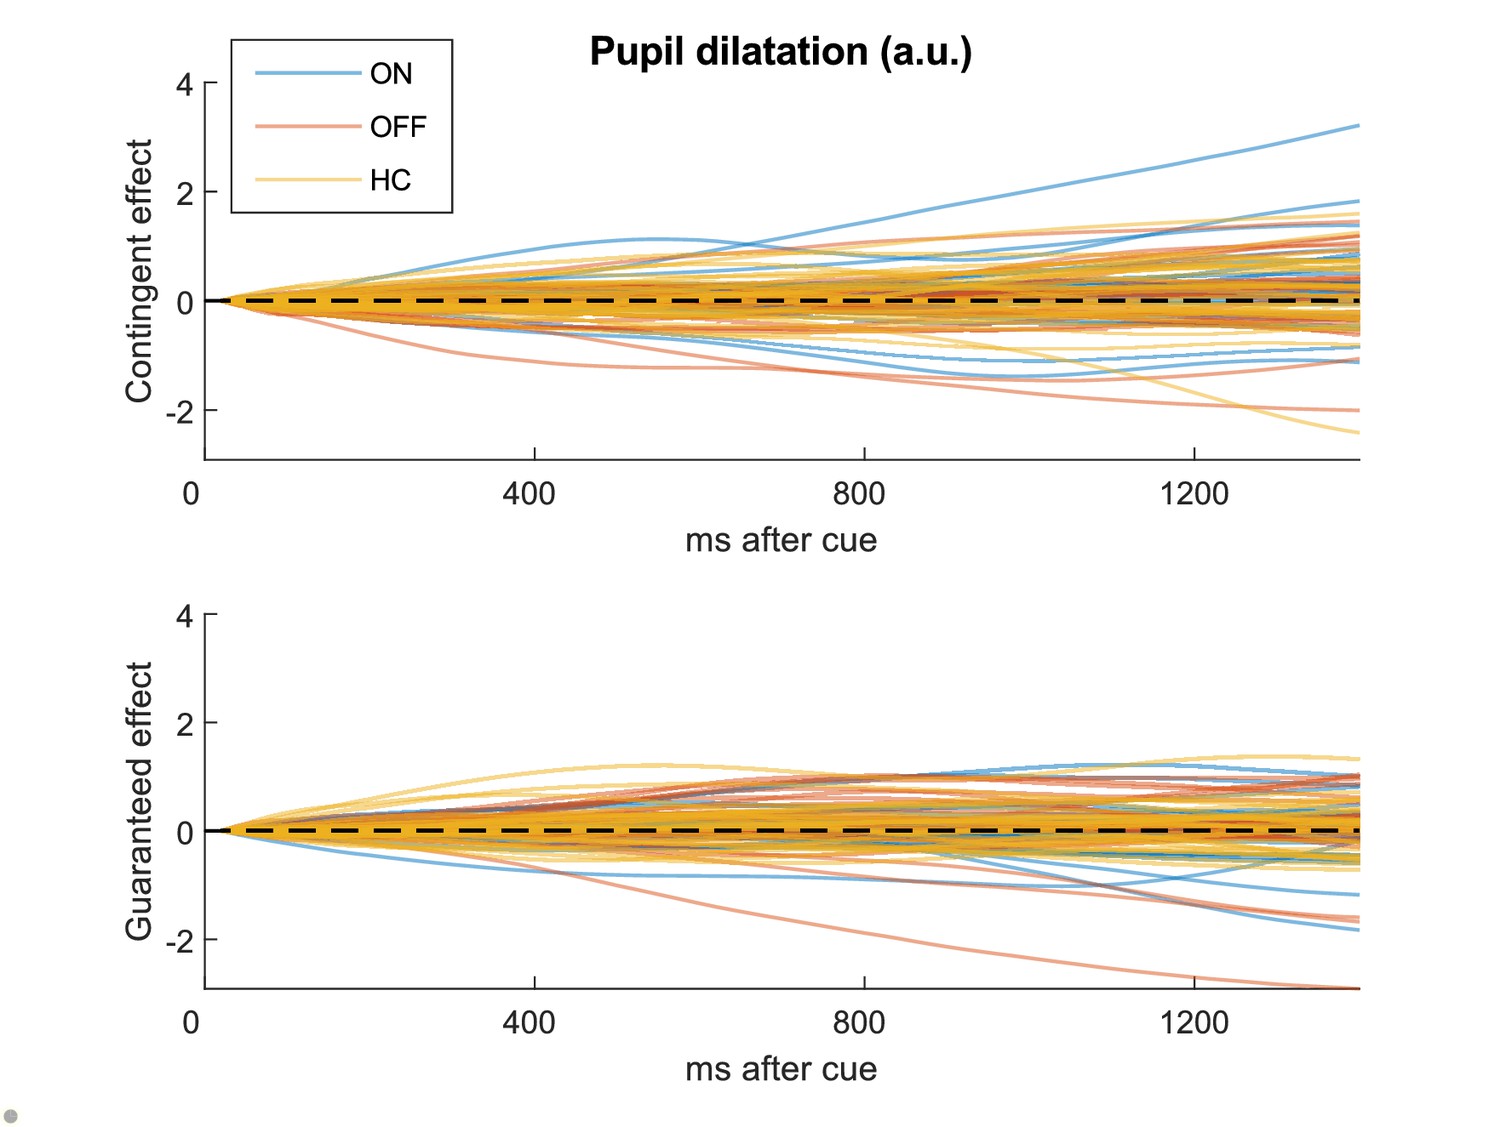
Individual data for pupil dilatation.
Individual participants’ mean pupil dilatation traces for each condition, showing the effects of contingent (Performance – Random) and guaranteed (10 p – 0 p) rewards.
Figure 7
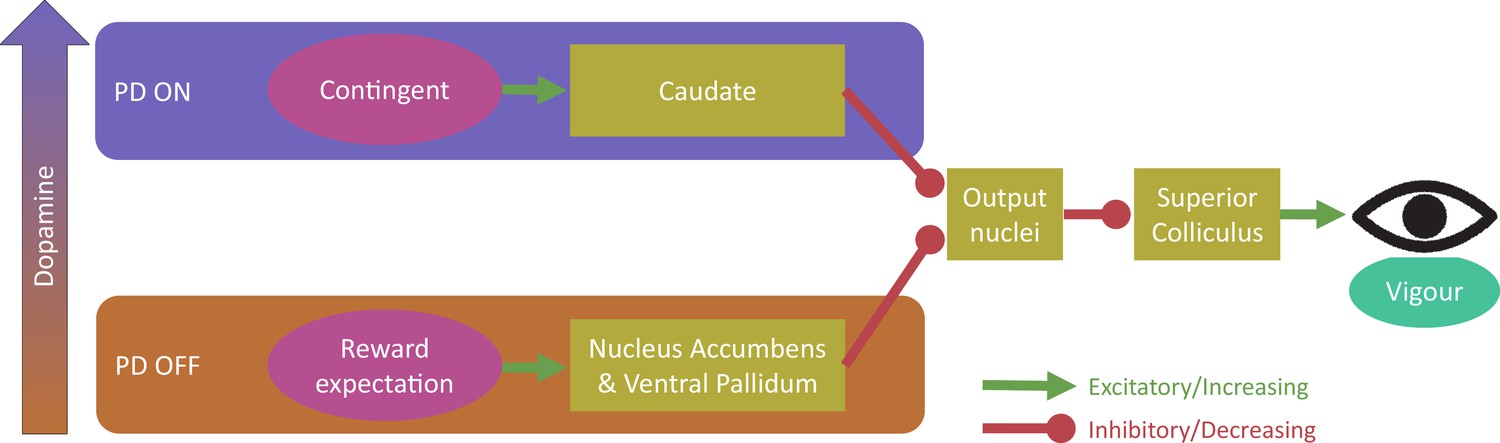
Proposed model for dopaminergic dissociation of reward expectation and contingent motivation.
We propose that dopamine (in PD patients) increases contingent motivation by acting on the caudate nucleus, which disinhibits the superior colliculus (via the basal ganglia output nuclei) and affects the firing activity within the saccade, influencing vigour. Separately, high tonic dopamine impairs reward expectation motivation via the nucleus accumbens and ventral pallidum, which also disinhibit the basal ganglia output nuclei to affect superior colliculus firing activity and thus vigour within the saccade. Possible mechanisms for this dissociative dopamine influence include separate dopaminergic regions innervating the two pathways, ‘global’ vs ‘local’ signalling, or different expression of D1-like and D2-like receptors (see text for details).
Author response image 1
Tables
Table 1
Participant demographics for PD patients and Healthy Controls (HC) included in the analysis.
Standard deviations are given in parentheses. **=p < 0.01 (independent samples t-test). ACE = Addenbrooke’s Cognitive Exam, AMI = Apathy and Motivation Index, HADS = Hospital Anxiety and Depression scores (A and D given separately), BDI-II = Beck Depression Inventory-II, FSS = Fatigue Severity Scale, UPDRS-III = Unified Parkinson’s disease rating scale Part 3, performed ON and OFF medication, LED = Daily Levodopa Equivalent Dose, # on agonists = number of patients taking dopamine agonists in addition to levodopa.
| PD | HC | |
|---|---|---|
| Number | 26 | 29 |
| Age | 67.69 (1.48) | 67.41 (6.83) |
| Gender (M:F) | 19:7 | 15:14 |
| ACE | 93.04 (6.47) | 97.10 (2.11)** |
| AMI | 1.48 (0.56) | 1.28 (0.47) |
| HADS-A | 2.92 (2.92) | 4.29 (2.79) |
| HADS-D | 2.50 (1.84) | 2.17 (1.83) |
| BDI-II | 4.90 (3.60) | 5.84 (3.78) |
| FSS | 3.19 (1.21) | 3.02 (1.03) |
| UPDRS-III ON | 26.69 (9.20) | N/A |
| UPDRS-III OFF | 35.04 (11.17) | N/A |
| LED | 490.23 (324.28) | N/A |
| # on agonists | 6 | N/A |
Table 2
Statistics for main behavioural analyses.
Three-way (motivation*contingency*drug) repeated-measures ANOVA on each behavioural measure, for the PD patients ON and OFF medication. An effect of contingency means the guaranteed conditions (10 p, 0 p) were different to the contingent conditions (Performance, Random). An effect of motivation means the 10 p and Performance conditions were different to the Random and 0 p conditions. An interaction of the two means that contingent rewards differed from guaranteed rewards. The Contingency * Motivation * Drug condition means that the effects of contingent and non-contingent rewards differed by PD medication state. Significant effects are highlighted in red. *p < 0.05, **p < 0.01.
| Measure | Effect | F (1, 200) | p | |
|---|---|---|---|---|
| Peak Velocity Residuals | Motivation | 9.7704 | *.0020 | .0466 |
| Contingency | 0.0194 | . 8895 | . 0001 | |
| Drug | 0.0004 | . 9850 | . 0000 | |
| Motivation * Contingency | 0.0051 | . 9429 | . 0000 | |
| Motivation * Drug | 0.2626 | . 6089 | . 0013 | |
| Contingency * Drug | 11.1072 | **.0010 | . 0526 | |
| Contingency * Motivation * Drug | 9.5190 | **.0023 | . 0454 | |
| Amplitude | Motivation | 3.5577 | . 0607 | . 0175 |
| Contingency | 1.2284 | . 2690 | . 0061 | |
| Drug | 0.0000 | . 9984 | . 0000 | |
| Motivation * Contingency | 0.5545 | . 4573 | . 0028 | |
| Motivation * Drug | 0.2278 | . 6337 | . 0011 | |
| Contingency * Drug | 1.7763 | . 1841 | . 0088 | |
| Contingency * Motivation * Drug | 0.0287 | . 8655 | . 0001 | |
| Saccadic RT | Motivation | 3.4333 | . 0654 | . 0169 |
| Contingency | 4.2922 | *.0396 | . 0210 | |
| Drug | 0.3560 | . 5514 | . 0018 | |
| Motivation * Contingency | 0.3663 | . 5457 | . 0018 | |
| Motivation * Drug | 0.0694 | . 7925 | . 0003 | |
| Contingency * Drug | 0.6246 | . 4303 | . 0031 | |
| Contingency * Motivation * Drug | 0.0185 | . 8920 | . 0001 | |
| Endpoint Variability | Motivation | 2.6780 | . 1033 | . 0132 |
| Contingency | 3.6181 | . 0586 | . 0178 | |
| Drug | 1.0095 | . 3162 | . 0050 | |
| Motivation * Contingency | 3.9524 | *.0482 | . 0194 | |
| Motivation * Drug | 1.2787 | . 2595 | . 0064 | |
| Contingency * Drug | 1.3819 | . 2412 | . 0069 | |
| Contingency * Motivation * Drug | 0.1626 | . 6872 | . 0008 | |
| Raw Peak Velocity | Motivation | 6.5921 | *.0110 | .0319 |
| Contingency | 0.3831 | .5366 | .0019 | |
| Drug | 1.8937 | .1703 | .0094 | |
| Motivation * Contingency | 0.1179 | .7316 | .0006 | |
| Motivation * Drug | 0.0563 | .8126 | .0003 | |
| Contingency * Drug | 0.5462 | .4608 | .0027 | |
| Contingency * Motivation * Drug | 2.4061 | .1224 | .0119 |
Table 3
Statistics for behavioural analysis on HC saccade data.
HC had a motivation*contingency interaction for endpoint variability, as only expected rewards decreased variability. **=p < 0.01.
| Group | Effect | F (df = 1, 112) | p | |
|---|---|---|---|---|
| Peak Velocity Residuals | Motivation | 0.9019 | . 3443 | . 0080 |
| Contingency | 0.3463 | . 5574 | . 0031 | |
| Motivation * Contingency | 0.6995 | . 4047 | . 0062 | |
| Amplitude | Motivation | 2.3510 | . 1280 | . 0206 |
| Contingency | 0.0255 | . 8734 | . 0002 | |
| Motivation * Contingency | 1.2551 | . 2650 | . 0111 | |
| Saccade RT | Motivation | 3.2227 | . 0753 | . 0280 |
| Contingency | 2.5743 | . 1114 | . 0225 | |
| Motivation * Contingency | 2.7992 | . 0971 | . 0244 | |
| Endpoint Variability | Motivation | 0.9304 | . 3368 | . 0082 |
| Contingency | 0.6651 | . 4165 | . 0059 | |
| Motivation * Contingency | 8.2781 | **.0048 | . 0688 | |
| Raw Peak Velocity | Motivation | 1.1321 | .2896 | .0100 |
| Contingency | 0.1615 | .6885 | .0014 | |
| Motivation * Contingency | 0.2538 | .6154 | .0023 |
Author response table 1
| Effect | Estimate | t | p | |
|---|---|---|---|---|
| Peak Velocity Residuals | Motivation | 3.0488 | 1.922 | 0.0546 |
| Contingency | 0.1392 | 0.0878 | 0.9301 | |
| Drug | -0.0539 | -0.0339 | 0.9729 | |
| Motivation * Contingency | 0.2380 | 0.1500 | 0.8808 | |
| Motivation * Drug | 0.5420 | 0.3417 | 0.7326 | |
| Contingency * Drug | 2.6239 | 1.6542 | 0.0981 | |
| Contingency * Motivation * Drug | 3.5318 | 2.2266 | *0.0260 |
Additional files
-
Supplementary file 1
Statistics for main saccade measures.
- https://cdn.elifesciences.org/articles/58321/elife-58321-supp1-v2.docx
-
Supplementary file 2
Statistics for Pupil Dilatation.
- https://cdn.elifesciences.org/articles/58321/elife-58321-supp2-v2.docx
-
Supplementary file 3
Statistics for fixation period.
- https://cdn.elifesciences.org/articles/58321/elife-58321-supp3-v2.docx
-
Supplementary file 4
Correlations of questionnaires with motivational effects.
- https://cdn.elifesciences.org/articles/58321/elife-58321-supp4-v2.docx
-
Transparent reporting form
- https://cdn.elifesciences.org/articles/58321/elife-58321-transrepform-v2.docx
Download links
A two-part list of links to download the article, or parts of the article, in various formats.
Downloads (link to download the article as PDF)
Open citations (links to open the citations from this article in various online reference manager services)
Cite this article (links to download the citations from this article in formats compatible with various reference manager tools)
Dopamine promotes instrumental motivation, but reduces reward-related vigour
eLife 9:e58321.
https://doi.org/10.7554/eLife.58321


