Female-biased upregulation of insulin pathway activity mediates the sex difference in Drosophila body size plasticity
- Department of Cellular and Physiological Sciences, Life Sciences Institute, The University of British Columbia, Canada
- MRC London Institute of Medical Sciences, and Institute of Clinical Sciences, Faculty of Medicine, Imperial College London, United Kingdom
Figures
Figure 1 with 7 supplements
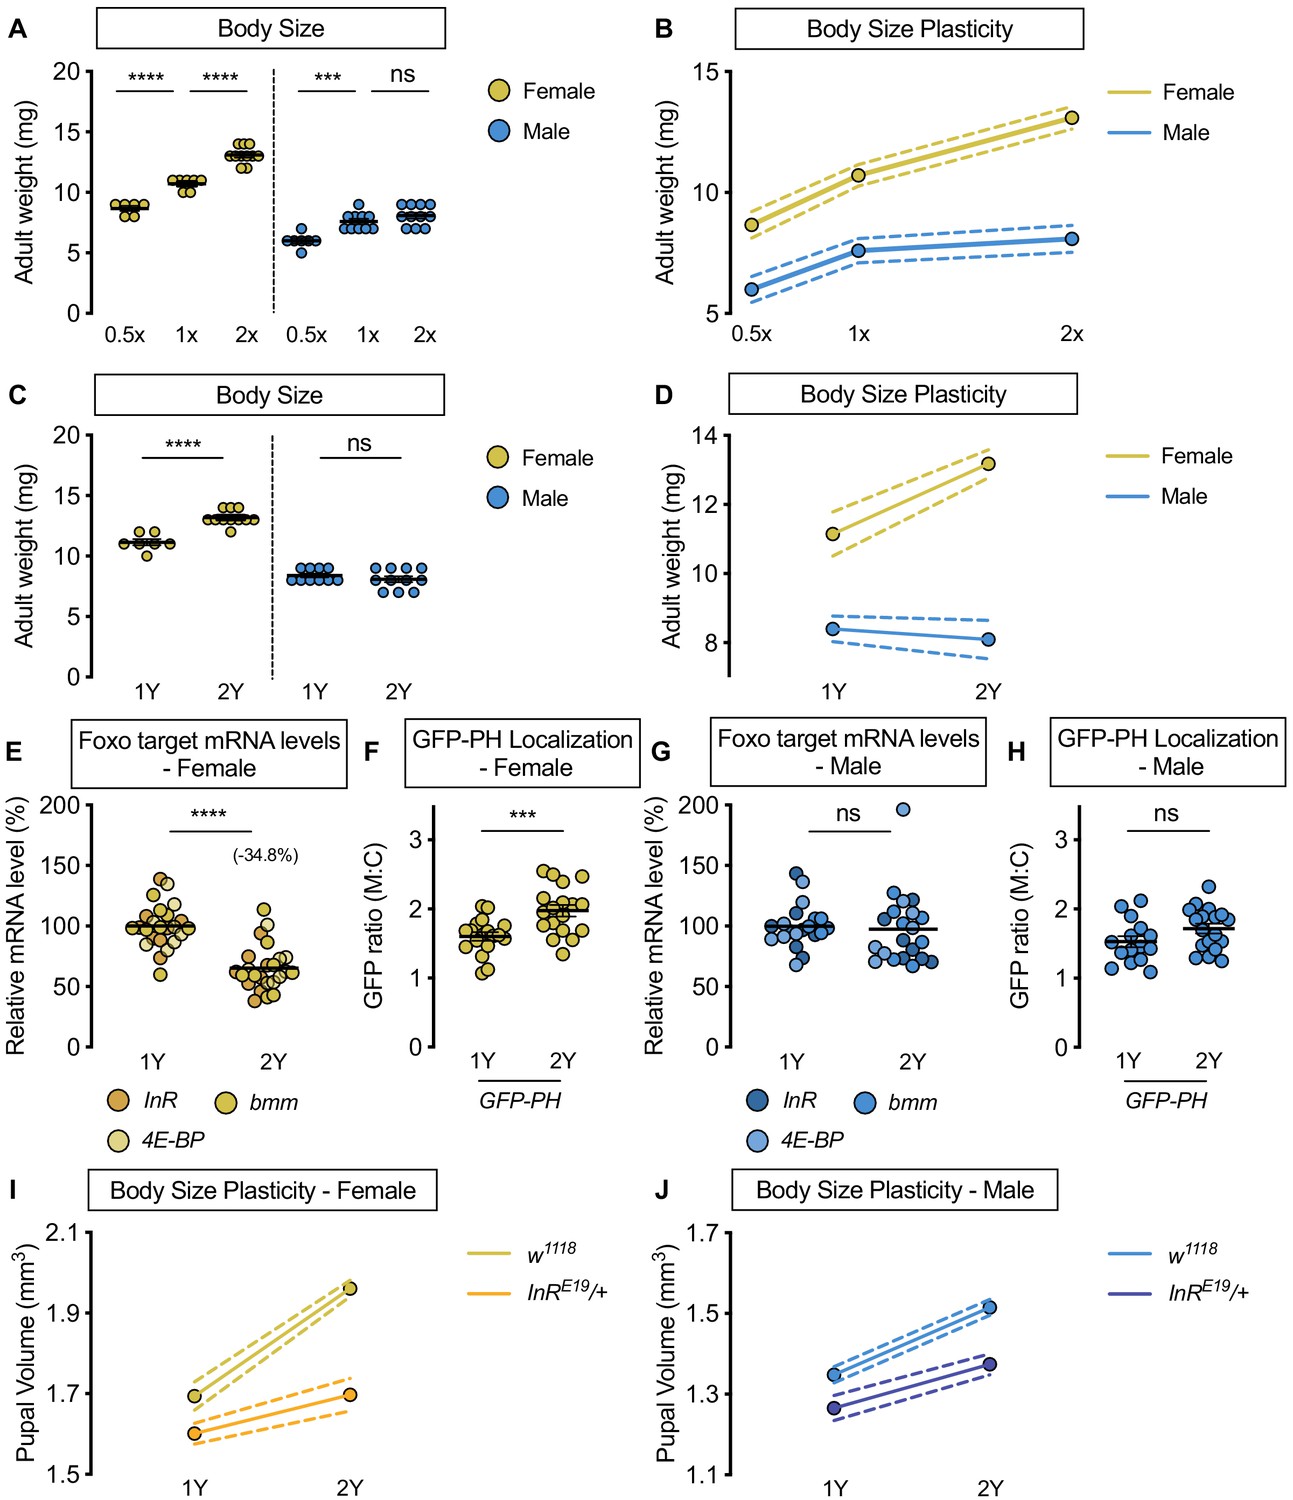
Upregulation of IIS activity is required for increased nutrient-dependent body size plasticity in females in a protein-rich diet.
(A) Adult weight was significantly higher in w1118 males and females cultured on 1X compared with flies raised on 0.5X (p<0.0001 for both sexes; two-way ANOVA followed by Tukey HSD test). The magnitude of this increase in adult weight was the same in both sexes (sex:diet interaction p=0.3197; two-way ANOVA followed by Tukey HSD test). Adult weight was significantly higher in w1118 females raised on 2X compared to flies cultured on 1X; however, male adult weight was not significantly increased (p<0.0001 and p=0.4015, respectively; two-way ANOVA followed by Tukey HSD test), where the diet-dependent increase in adult weight was higher in females (sex:diet interaction p=0.0003; two-way ANOVA followed by Tukey HSD test). (B) Reaction norms for adult weight in response to changes in nutrient quantity in w1118 females and males, plotted using the data presented in panel A. n = 6–11 groups of 10 flies. (C) Adult weight was significantly higher in females cultured on 2Y compared with flies raised on 1Y; however, male adult weight was not significantly higher in flies raised on 2Y compared with males cultured on 1Y (p<0.0001 and p=0.7199, respectively; two-way ANOVA followed by Tukey HSD test, sex:diet interaction p<0.0001). (D) Reaction norms for adult weight in w1118 females and males reared on either 1Y or 2Y, plotted using data from panel C. n = 7–11 groups of 10 flies. (E) In females, mRNA levels of Foxo targets (insulin receptor (InR), brummer (bmm), and eukaryotic initiation factor 4E-binding protein (4E-BP)), were significantly lower in larvae raised on a protein-rich diet (2Y) compared with larvae raised on a diet containing half the protein content (1Y) (p<0.0001; Student’s t test). n = 8 biological replicates. (F) Quantification of the ratio between cell surface membrane-associated green fluorescent protein (GFP) and cytoplasmic GFP (GFP ratio [M:C]) in a dissected fat body of female larvae from the GFP-PH strain. The ratio was significantly higher in female larvae cultured on 2Y compared with larvae raised on 1Y (p=0.001; Student’s t test). n = 18 biological replicates. (G) In males, there was no significant difference in mRNA levels of Foxo targets between larvae raised on 2Y compared with larvae cultured on 1Y (p=0.7323; Student’s t test). n = 6–7 biological replicates. (H) In males, the M:C ratio for GFP-PH was not significantly different between males cultured on 2Y compared with larvae raised on 1Y (p=0.0892; Student’s t test). n = 15–18 biological replicates. (I) Pupal volume was significantly higher in both w1118 females and InRE19/+ females reared on 2Y compared with genotype-matched females cultured on 1Y (p<0.0001 for both genotypes; two-way ANOVA followed by Tukey HSD test); however, the magnitude of the nutrient-dependent increase in pupal volume was lower in InRE19/+ females (genotype:diet interaction p<0.0001; two-way ANOVA followed by Tukey HSD test). n = 58–77 pupae. (J) Pupal volume was significantly higher in both w1118 males and InRE19/+ males reared on 2Y compared with genotype-matched males cultured on 1Y (p<0.0001 for both genotypes; two-way ANOVA followed by Tukey HSD test). While we observed a sex:diet interaction in the w1118 control genotype, there was no sex:diet interaction in the InRE19/+ genotype (p<0.0001 and p=0.7104, respectively; two-way ANOVA followed by Tukey HSD test). n = 47–76 pupae. For body size plasticity graphs, filled circles indicate mean body size, and dashed lines indicate 95% confidence interval. *** indicates p<0.001, **** indicates p<0.0001; ns indicates not significant; error bars indicate SEM.
Figure 1—figure supplement 1
Increased female body size plasticity in a protein-rich diet.
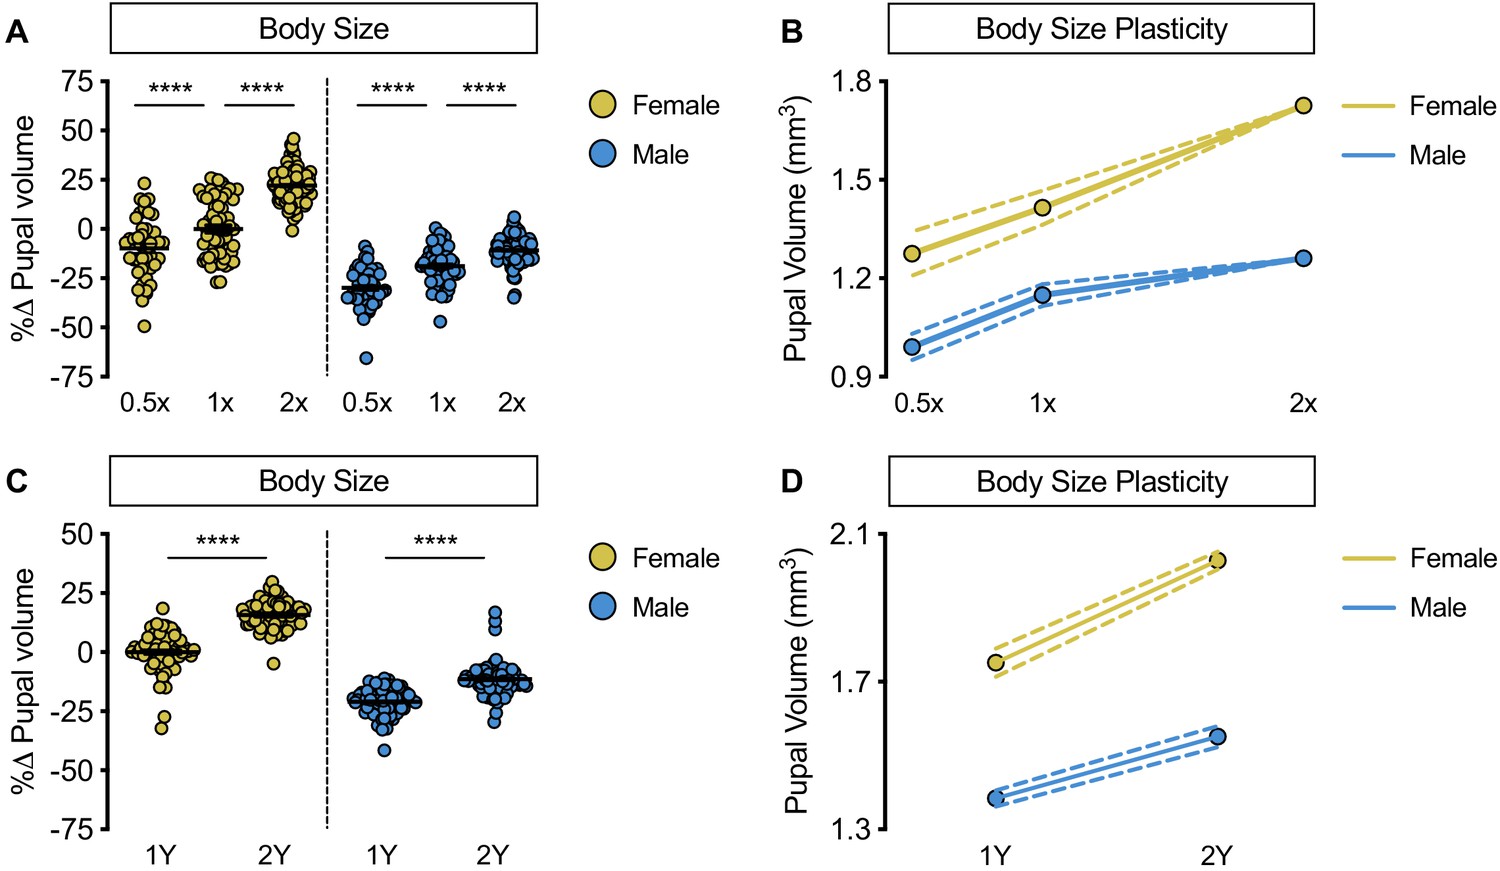
(A) Pupal volume was significantly higher in w1118 males and females cultured on a widely used diet (1X) compared with larvae raised on a reduced-nutrient diet (0.5X) (p<0.0001 and p=0.0006, respectively; two-way ANOVA followed by Tukey HSD test). The magnitude of this increase in pupal volume was the same in both sexes (sex:diet interaction p=0.7048; two-way ANOVA followed by Tukey HSD test). Pupal volume was significantly higher in w1118 males and females raised on a nutrient-rich diet (2X) compared with larvae cultured on 1X (p<0.0001 for both; two-way ANOVA followed by Tukey HSD test); however, the magnitude of the increase in body size was significantly larger in females than in males (sex:diet interaction p<0.0001; two-way ANOVA followed by Tukey HSD test). (B) Reaction norms for pupal volume in w1118 larvae raised on diets of varying quantity (0.5X, 1X, 2X), plotted using data presented in panel A. n = 43–100 pupae. (C) Pupal volume was significantly higher in both males and females cultured on a yeast-rich medium (2Y) compared with larvae raised on a diet containing half the quantity of yeast (1Y) (p<0.0001 for both sexes; two-way ANOVA followed by Tukey HSD test); however, the magnitude of the nutrient-dependent increase in pupal volume was larger in females than in males (sex:diet interaction p=0.0001; two-way ANOVA followed by Tukey HSD test). (D) Reaction norms for pupal volume in response to changes in dietary yeast in w1118 females and males, plotted using the data presented in panel C. n = 62–80 pupae. For body size plasticity graphs, filled circles indicate mean body size, and dashed lines indicate 95% confidence interval. **** indicates p<0.0001; error bars indicate SEM.
Figure 1—figure supplement 2
Increased nutrient-dependent body size plasticity in Canton-S females.
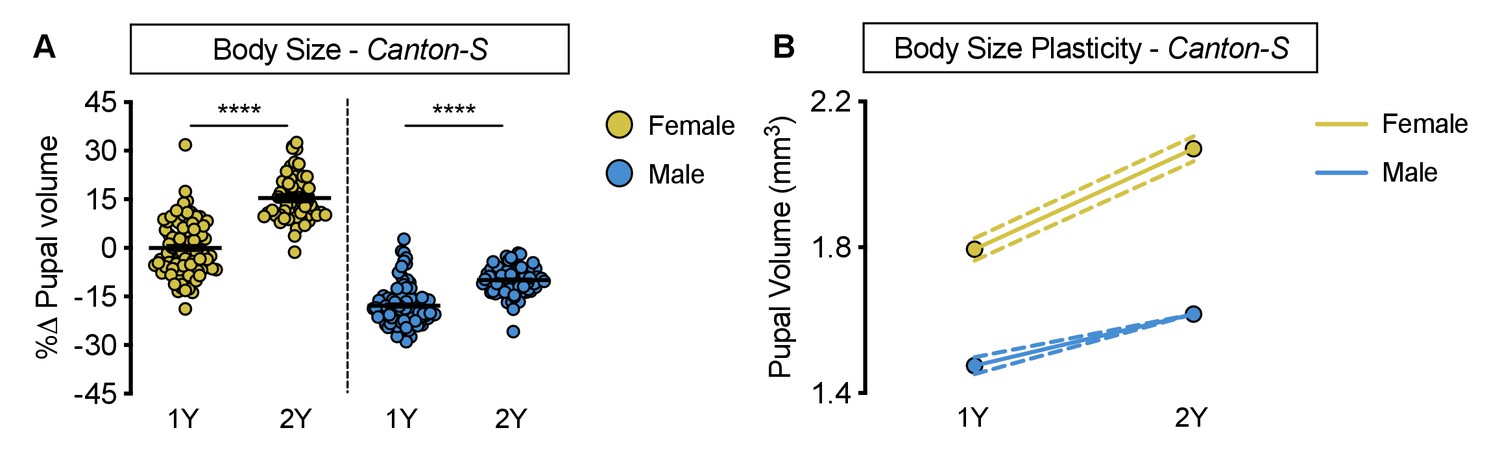
(A) Pupal volume was significantly higher in both Canton-S (CS) females and males reared on a protein-rich diet (2Y) compared with genotype-matched females and males cultured on a diet containing half the protein (1Y) (p<0.0001 for both sexes; two-way ANOVA followed by Tukey HSD test); however, the magnitude of the nutrient-dependent increase in pupal volume was higher in females (sex:diet interaction p<0.0001; two-way ANOVA followed by Tukey HSD test). (B) Reaction norms for pupal volume in response to changes in yeast quantity in CS females and males, plotted using the data in panel A. n = 57–95 pupae. For body size plasticity graphs, filled circles indicate mean pupal volume, and dashed lines indicate 95% confidence interval. **** indicates p<0.0001; error bars indicate SEM.
Figure 1—figure supplement 3
Increased nutrient-dependent plasticity in female wing size.
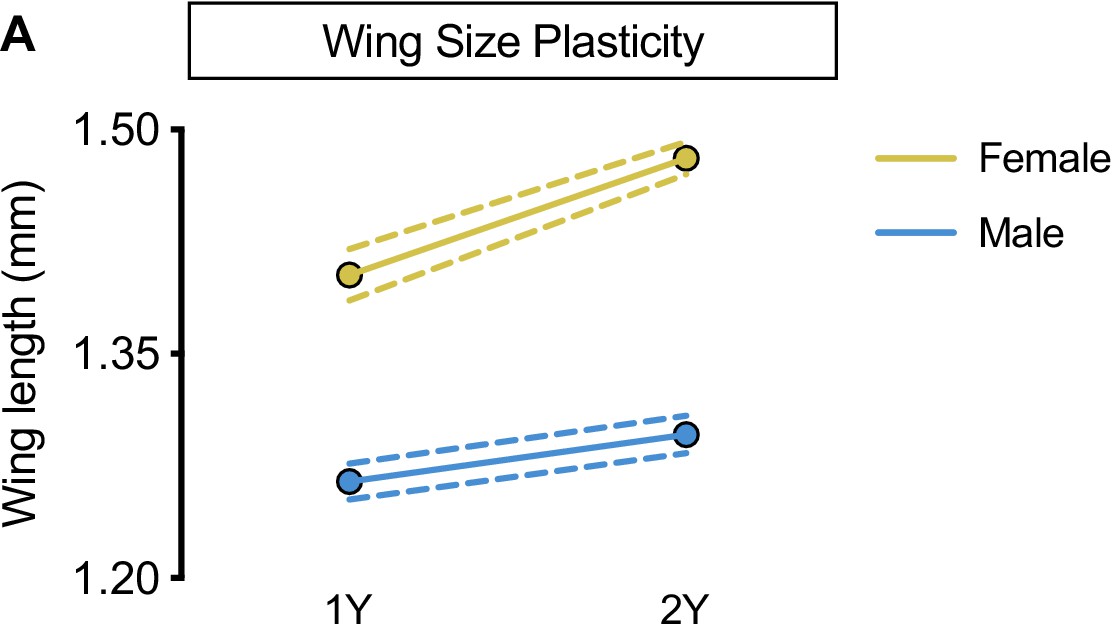
(A) Wing length was significantly higher in both w1118 females and males reared on a protein-rich diet (2Y) compared with genotype-matched females and males cultured on a diet containing half the protein (1Y) (p<0.0001 and p=0.0018, respectively; two-way ANOVA followed by Tukey HSD test). The magnitude of the nutrient-dependent increase in wing length was higher in females (sex:diet interaction p=0.0004; two-way ANOVA followed by Tukey HSD test). n = 16–28 wings. For wing size plasticity graphs, filled circles indicate mean wing length, and dashed lines indicate 95% confidence interval.
Figure 1—figure supplement 4
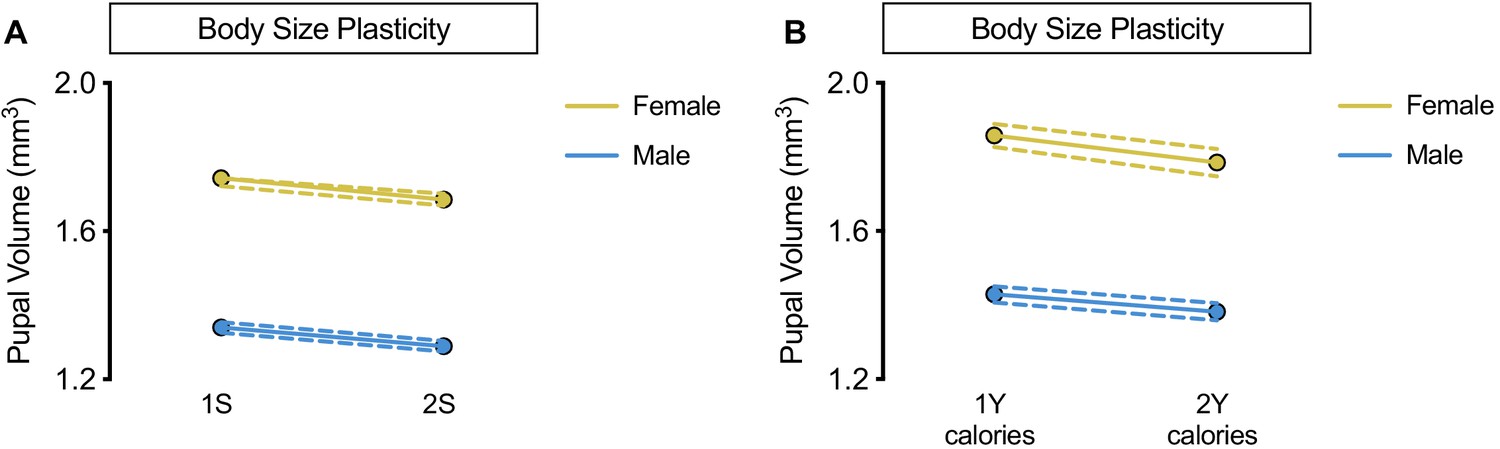
No sex-specific effect of altering dietary sugar concentration or calorie content.
(A) Pupal volume was significantly decreased in both w1118 females and males reared on a diet with twice the sugar (2S) compared with genotype-matched females and males cultured on a diet with the sugar content of our regular diet (1S) (p<0.0001 and p=0.0002, respectively; two-way ANOVA followed by Tukey HSD test). The magnitude of the nutrient-dependent decrease in pupal volume was not different between females and males (sex:diet interaction p=0.6536; two-way ANOVA followed by Tukey HSD test). n = 117–133 pupae. (B) While pupal volume was significantly decreased in w1118 females and not males reared on a 2Y calorie-matched diet compared with genotype-matched females and males cultured on a 1Y calorie-matched diet (p=0.0039 and p=0.0662 respectively; two-way ANOVA followed by Tukey HSD test), there was no sex:diet interaction indicating that one sex was not more affected than the other (sex:diet interaction p=0.3698; two-way ANOVA followed by Tukey HSD test). n = 44–74 pupae. For body size plasticity graphs, filled circles indicate mean pupal volume, and dashed lines indicate 95% confidence interval.
Figure 1—figure supplement 5

Pharmacological inhibition of protein breakdown has female-biased effects on body size.
(A) Pupal volume was significantly higher in both w1118 females and males reared on a protein-rich diet (2Y) compared with genotype-matched females and males cultured on 2Y containing a broad-spectrum protease inhibitor cocktail (PIC) (p<0.0001 and p=0.0185, respectively; two-way ANOVA followed by Tukey HSD test). Importantly, the magnitude of the effect of inhibiting protein breakdown on pupal volume was higher in females (sex:treatment interaction p=0.0029; two-way ANOVA followed by Tukey HSD test). n = 57–92 pupae. (B) Pupal volume was significantly higher in both w1118 females and males reared on 2Y compared with genotype-matched females and males cultured on 2Y containing a serine protease-specific inhibitor 4-(2-aminoethyl)benzenesulfonyl fluoride hydrochloride (AEBSF) (p<0.0001 for both sexes; two-way ANOVA followed by Tukey HSD test); however, the magnitude of the effect of inhibiting protein breakdown on pupal volume was higher in females (sex:treatment interaction p<0.0001; two-way ANOVA followed by Tukey HSD test). n = 28–66 pupae. * indicates p<0.05; **** indicates p<0.0001; error bars indicate SEM.
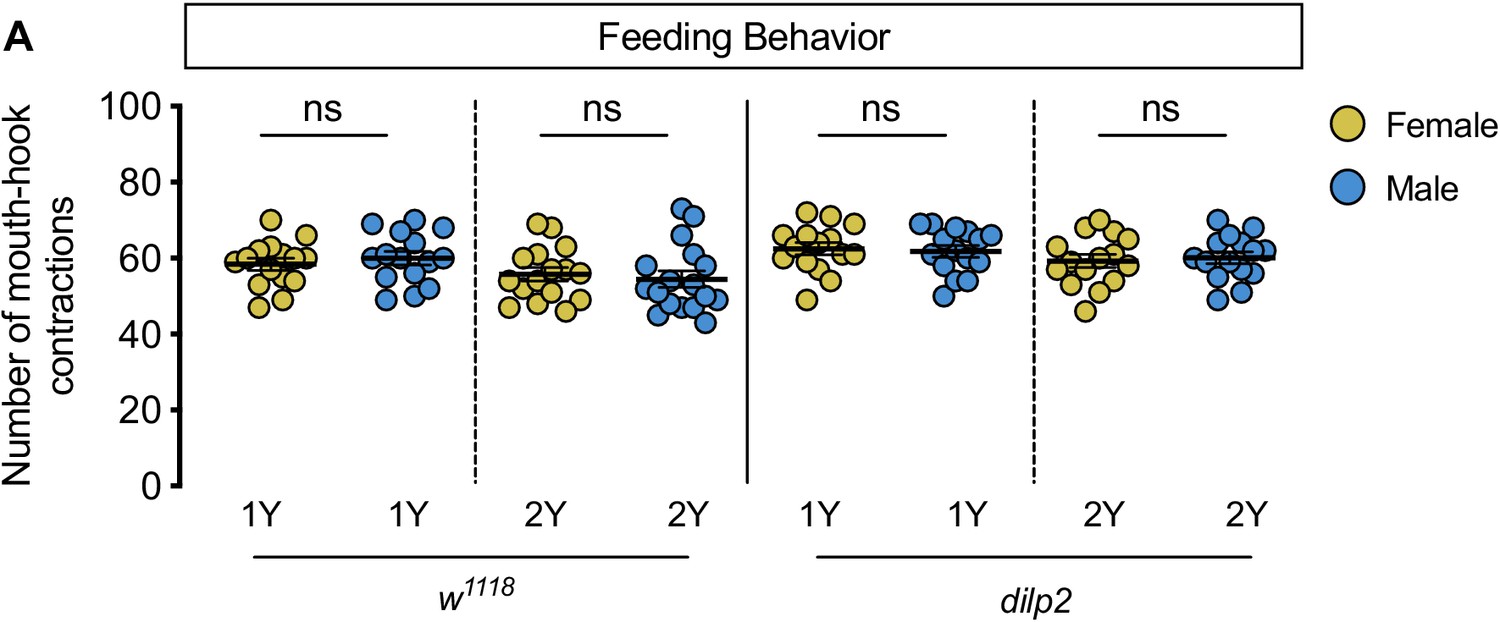
Figure 1—figure supplement 6

No sex difference in food intake or time to pupation.
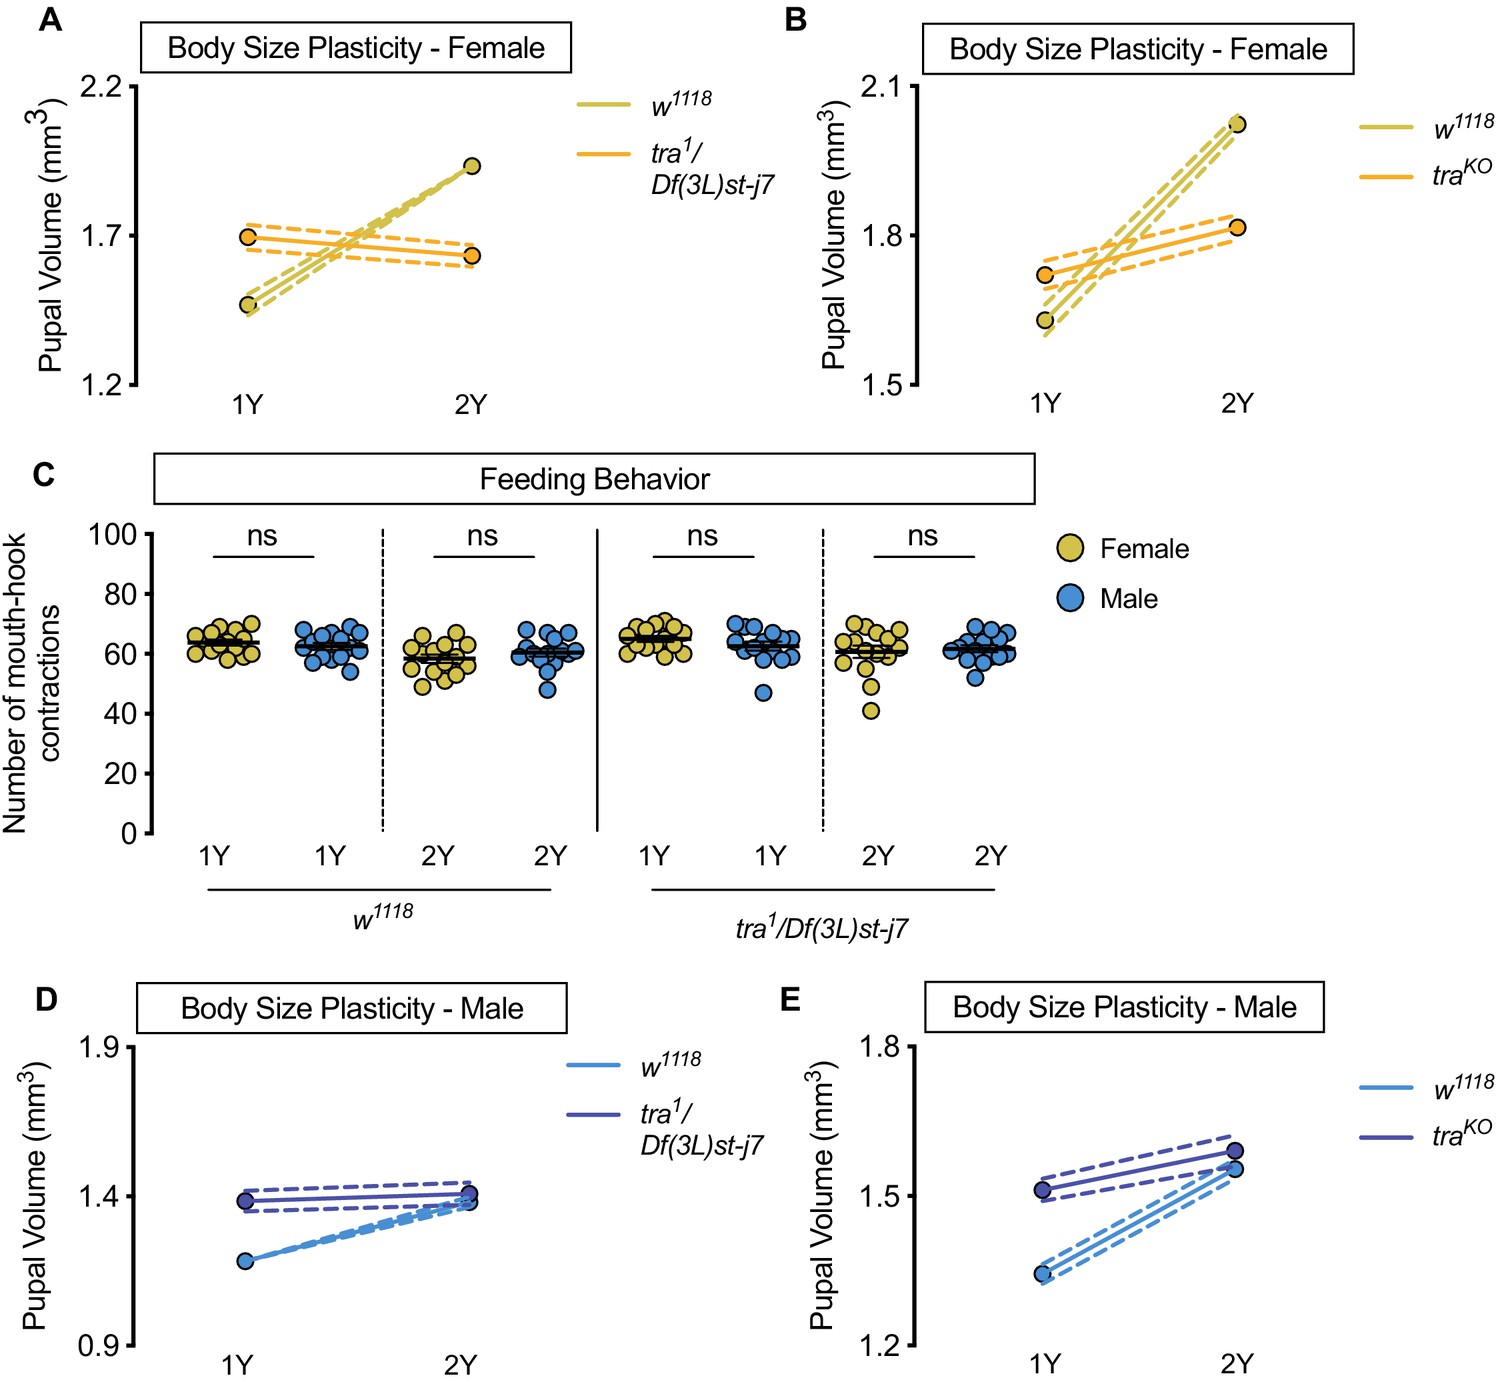
(A) There was no significant difference in mouth hook contractions between w1118 control male and female larvae raised on a diet containing a widely used protein content (1Y) (p=0.3965; Student’s t test), or a protein-rich diet (2Y) (p=0.5175; Student’s t test). n = 20 biological replicates. (B) There was no sex difference in the time to pupation between w1118 control male and female larvae when cultured on 1Y. n = 79–93 pupae. (C) There was no sex difference in the time to pupation between w1118 control male and female larvae when cultured on 2Y. n = 87–94 pupae. ns indicates not significant; error bars indicate SEM.
Figure 1—figure supplement 7
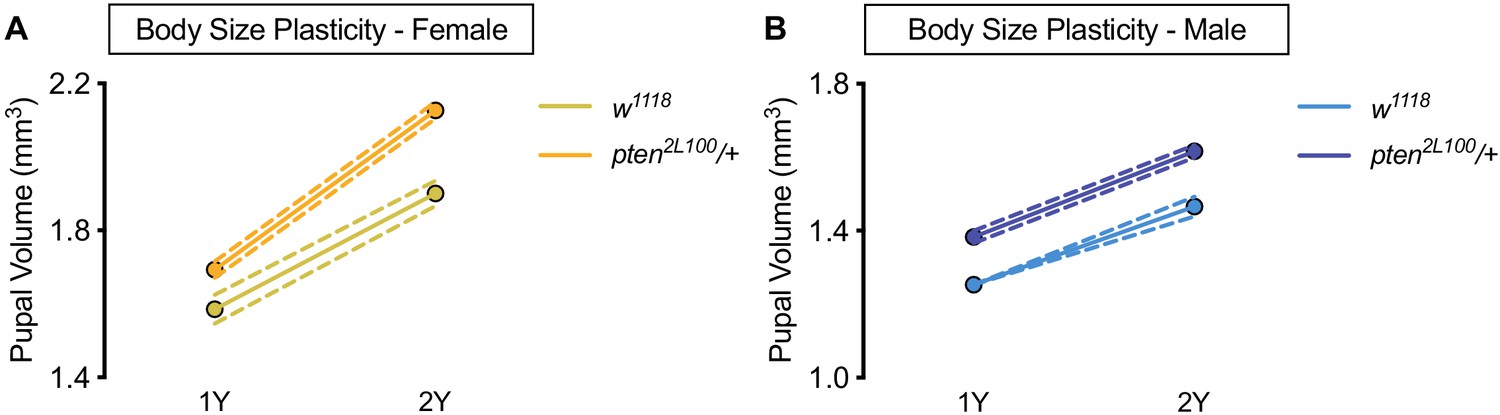
Larger body size does not confer increased body size plasticity.
(A) Pupal volume was significantly higher in both w1118 females and pten2L100/+ females reared on a protein-rich diet (2Y) compared with genotype-matched females cultured on a diet containing half the protein (1Y) (p<0.0001 for both genotypes; two-way ANOVA followed by Tukey HSD test). n = 60–89 pupae. (B) Pupal volume was significantly higher in both w1118 males and pten2L100/+ males reared on 2Y compared with genotype-matched males cultured on 1Y (p<0.0001 for both genotypes; two-way ANOVA followed by Tukey HSD test). Importantly, the magnitude of the nutrient-dependent increase in pupal volume was not different between w1118 males and pten2L100/+ males (genotype:diet interaction p=0.3557; two-way ANOVA followed by Tukey HSD test). n = 65–88 pupae. For body size plasticity graphs, filled circles indicate mean pupal volume, and dashed lines indicate 95% confidence interval.
Figure 2 with 4 supplements

Drosophila insulin-like peptide 2 is required for the nutrient-dependent upregulation of insulin pathway activity and increased female body size plasticity.
(A) In control w1118 females, mRNA levels of Foxo targets (insulin receptor (InR), brummer (bmm), and eukaryotic initiation factor 4E-binding protein (4E-BP)), were significantly lower in larvae cultured on a protein-rich diet (2Y) compared with larvae raised on a diet containing half the protein (1Y) (p<0.0001; Student’s t test). In dilp2 mutant females, there was no significant difference in mRNA levels of Foxo targets in larvae cultured on 2Y compared with larvae raised on 1Y (p=0.2231 Student’s t test). n = 8 biological replicates. (B) In control w1118 and dilp2 mutant males, mRNA levels of Foxo targets were significantly lower in larvae cultured on 2Y compared with larvae raised on 1Y (p=0.0066 and p=0.0023 respectively; Student’s t test). n = 7–8 biological replicates; however, the magnitude of the reduction in Foxo target gene expression in w1118 males was smaller than in genotype-matched females. (C) Adult weight was significantly higher in w1118 females raised on 2Y compared with flies cultured on 1Y (p<0.0001; two-way ANOVA followed by Tukey HSD test); however, adult weight was not significantly different between dilp2 mutant females reared on 2Y versus 1Y (p=0.1263; two-way ANOVA followed by Tukey HSD test). n = 7–11 groups of 10 flies. (D) Adult weight in control w1118 and dilp2 mutant males was not significantly higher in flies reared on 2Y compared with males raised on 1Y (p=0.8366 and p=0.8817, respectively; two-way ANOVA followed by Tukey HSD test). There was a significant sex:diet interaction in the control w1118 genotype (p<0.0001), but not in the dilp2 mutant genotype (p=0.0827; two-way ANOVA followed by Tukey HSD test). n = 10–12 groups of 10 flies. (E) Pupal volume was significantly higher in w1118 females but not in dilp2 mutant females reared on 2Y compared with genotype-matched females cultured on 1Y (p<0.0001 and p=0.6486 respectively; two-way ANOVA followed by Tukey HSD test). The magnitude of the nutrient-dependent increase in pupal volume was higher in w1118 females (genotype:diet interaction p<0.0001; two-way ANOVA followed by Tukey HSD test). n = 74–171 pupae. (F) Pupal volume was significantly higher in w1118 males and dilp2 mutant males reared on 2Y compared with genotype-matched males cultured on 1Y (p<0.0001 for both genotypes; two-way ANOVA followed by Tukey HSD test). The magnitude of the nutrient-dependent increase in pupal volume was not different between genotypes (genotype:diet interaction p=0.6891; two-way ANOVA followed by Tukey HSD test). n = 110–135 pupae. (G) Pupal volume was significantly reduced in females upon RNAi-mediated knockdown of dilp2 in 2Y when compared to both control genotypes (p<0.0001 [da>+], and p=0.002 [+>UAS-dilp2-RNAi], respectively; two-way ANOVA followed by Tukey HSD test), but not in males in 2Y (p<0.0001 [da>+], and 0.9634 [+>UAS-dilp2-RNAi], respectively; two-way ANOVA followed by Tukey HSD test). The magnitude of the effect of RNAi-mediated knockdown of dilp2 on pupal volume was higher in females (sex:genotype interaction p=0.003; two-way ANOVA followed by Tukey HSD test). n = 44–59 pupae. For all body size plasticity graphs, filled circles indicate mean body size, and dashed lines indicate 95% confidence interval. ** indicates p<0.01, **** indicates p<0.0001; ns indicates not significant; error bars indicate SEM.
Figure 2—figure supplement 1
No sex difference in food intake in dilp2 mutant larvae.
(A) There was no significant difference in mouth hook contractions between w1118 control male and female larvae raised on a diet containing a widely-used protein content (1Y) (p=0.5015; Student’s t test), or a protein-rich diet (2Y) (p=0.6514; Student’s t test). There was no significant difference in mouth hook contractions between dilp2 mutant male and female larvae raised in 1Y (p=0.7667; Student’s t test), or 2Y (p=0.7101; Student’s t test). n = 15–17 biological replicates. ns indicates not significant; error bars indicate SEM.
Figure 2—figure supplement 2
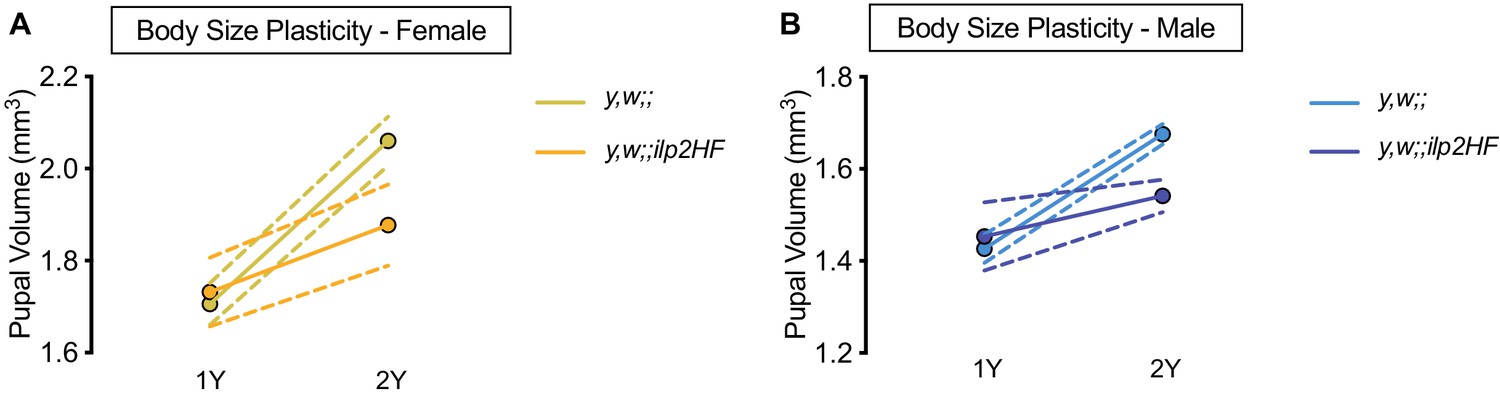
HA- and FLAG-tagged dilp2 transgenic flies exhibit impaired nutrient-dependent body size plasticity.
(A) Pupal volume was significantly higher in y,w females and y,w;;ilp2HF females reared on a protein-rich diet (2Y) compared with genotype-matched females cultured on a diet with half the protein (1Y) (p<0.0001 and p=0.0246 respectively; two-way ANOVA followed by Tukey HSD test). The magnitude of the nutrient-dependent increase in pupal volume was higher in y,w females (genotype:diet interaction p=0.001; two-way ANOVA followed by Tukey HSD test). n = 13–36 pupae. (B) Pupal volume was significantly higher in y,w males and y,w;;ilp2HF males reared on 2Y compared with genotype-matched females cultured on 1Y (p<0.0001 and p=0.0354 respectively; two-way ANOVA followed by Tukey HSD test). The magnitude of the nutrient-dependent increase in pupal volume was higher in y,w males (genotype:diet interaction p<0.0001; two-way ANOVA followed by Tukey HSD test). n = 12–46 pupae. For body size plasticity graphs, filled circles indicate mean pupal volume, and dashed lines indicate 95% confidence interval.
Figure 2—figure supplement 3
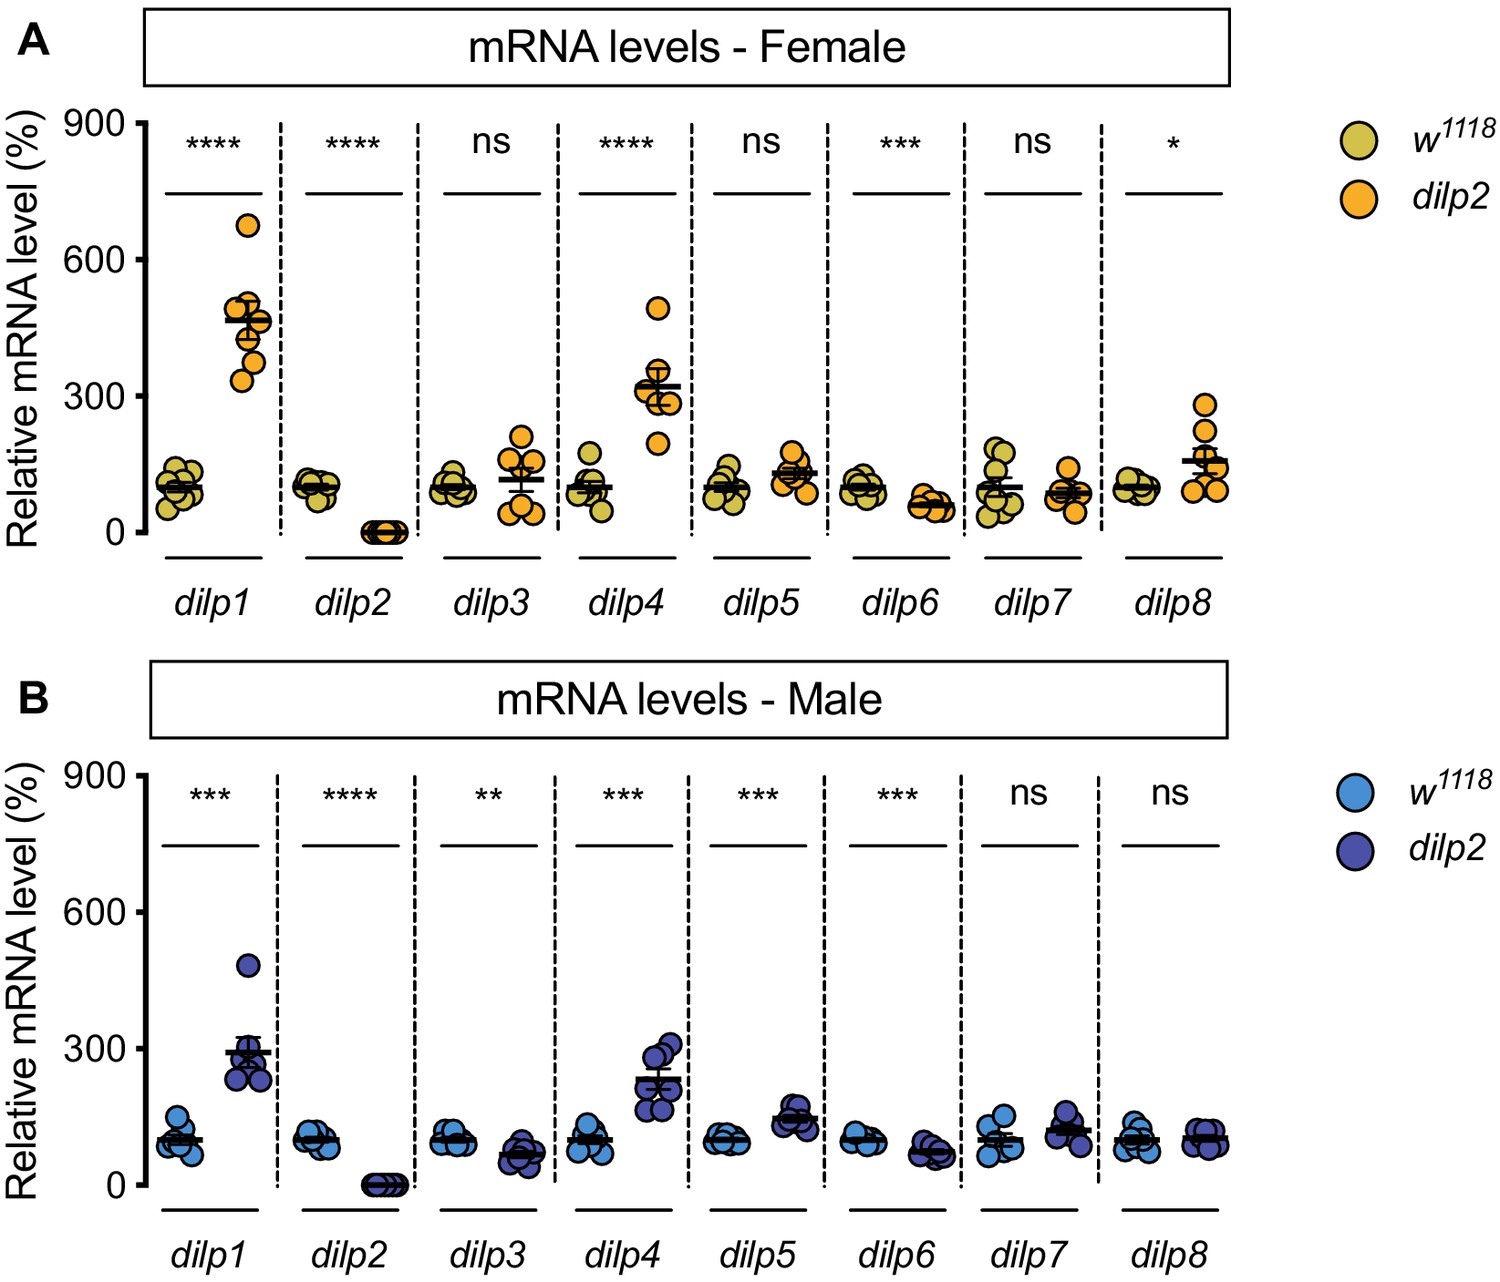
Genotype-dependent changes to dilp mRNA levels.
(A) In dilp2 mutant females, mRNA levels of dilp1, dilp2, dilp4, dilp6, and dilp8 were significantly different from w1118 control females (p<0.0001,<0.0001,<0.0001, 0.0003 and 0.0454, respectively; Student’s t test), but mRNA levels of dilp3, dilp5, and dilp7 were not significantly different (p=0.5142, 0.0574, and 0.605, respectively; Student’s t test). n = 6–8 biological replicates. (B) In dilp2 mutant males, mRNA levels of dilp1, dilp2, dilp3, dilp4, dilp5, and dilp6 were significantly different from w1118 control males (p=0.0001,<0.0001, 0.0034, 0.0001, 0.0001, and 0.0008, respectively; Student’s t test), but mRNA levels of dilp7 and dilp8 were not significantly different (p=0.2302, and 0.7809, respectively; Student’s t test). n = 6–7 biological replicates. * indicates p<0.05, ** indicates p<0.01, *** indicates p<0.001, **** indicates p<0.0001; ns indicates not significant; error bars indicate SEM.
Figure 2—figure supplement 4
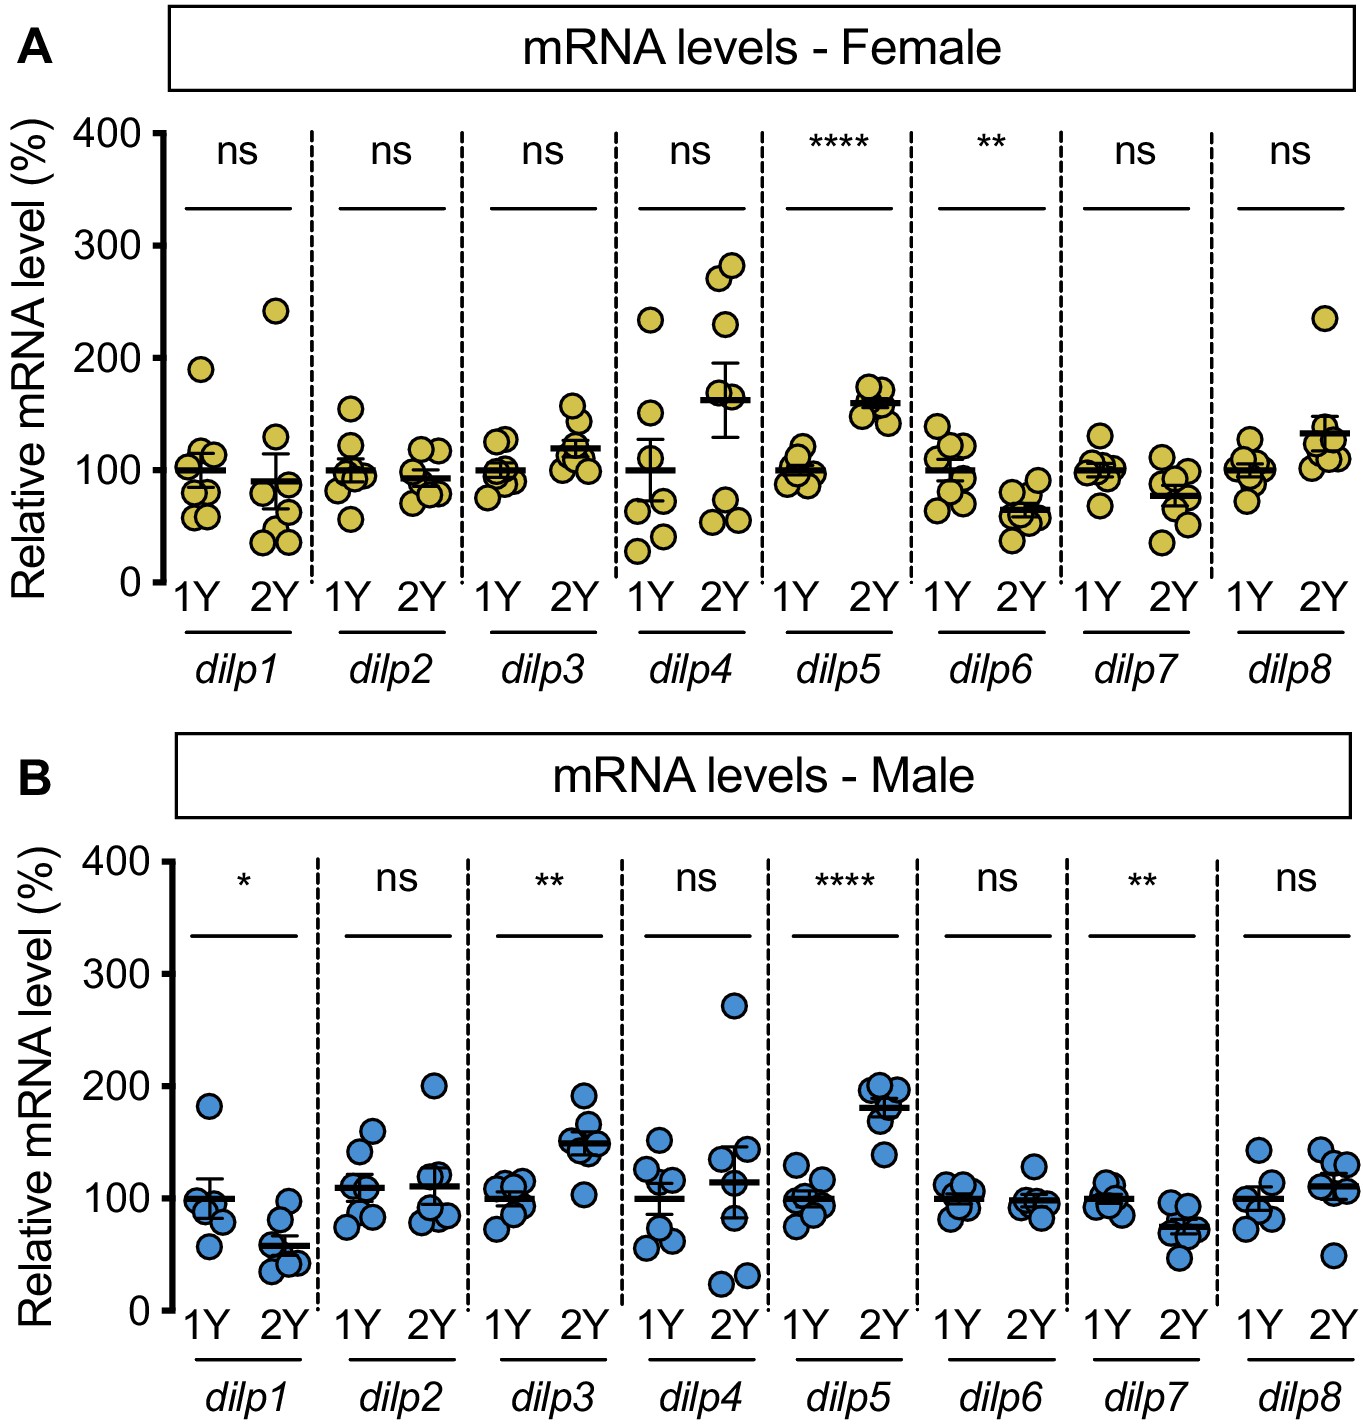
Diet-dependent changes to dilp mRNA levels.
(A) mRNA levels of dilp5 and dilp6 were significantly different between females raised on a protein-rich diet (2Y) compared with female larvae cultured on a diet with half the protein (1Y) (p<0.0001 and 0.0079, respectively; Student’s t test), but mRNA levels of dilp1, dilp2, dilp3, dilp4, dilp7, dilp8 were unchanged (p=0.7337, 0.5947, 0.0672, 0.1777, 0.0562 and 0.0643, respectively; Student’s t test). n = 7–8 biological replicates. (B) In males cultured in 1Y, mRNA levels of dilp1, dilp3, dilp5, dilp7 were significantly different from male larvae raised on 2Y (p=0.047, 0.0014,<0.0001, and 0.0068, respectively; Student’s t test); mRNA levels of dilp2, dilp4, dilp6, and dilp8 were unchanged (p=0.9388, 0.6812, 0.8157 and 0.5054, respectively; Student’s t test). n = 6–7 biological replicates. * indicates p<0.05, ** indicates p<0.01, **** indicates p<0.0001; ns indicates not significant; error bars indicate SEM.
Figure 3 with 8 supplements
stunted is required for the nutrient-dependent upregulation of insulin pathway activity and increased female body size plasticity.
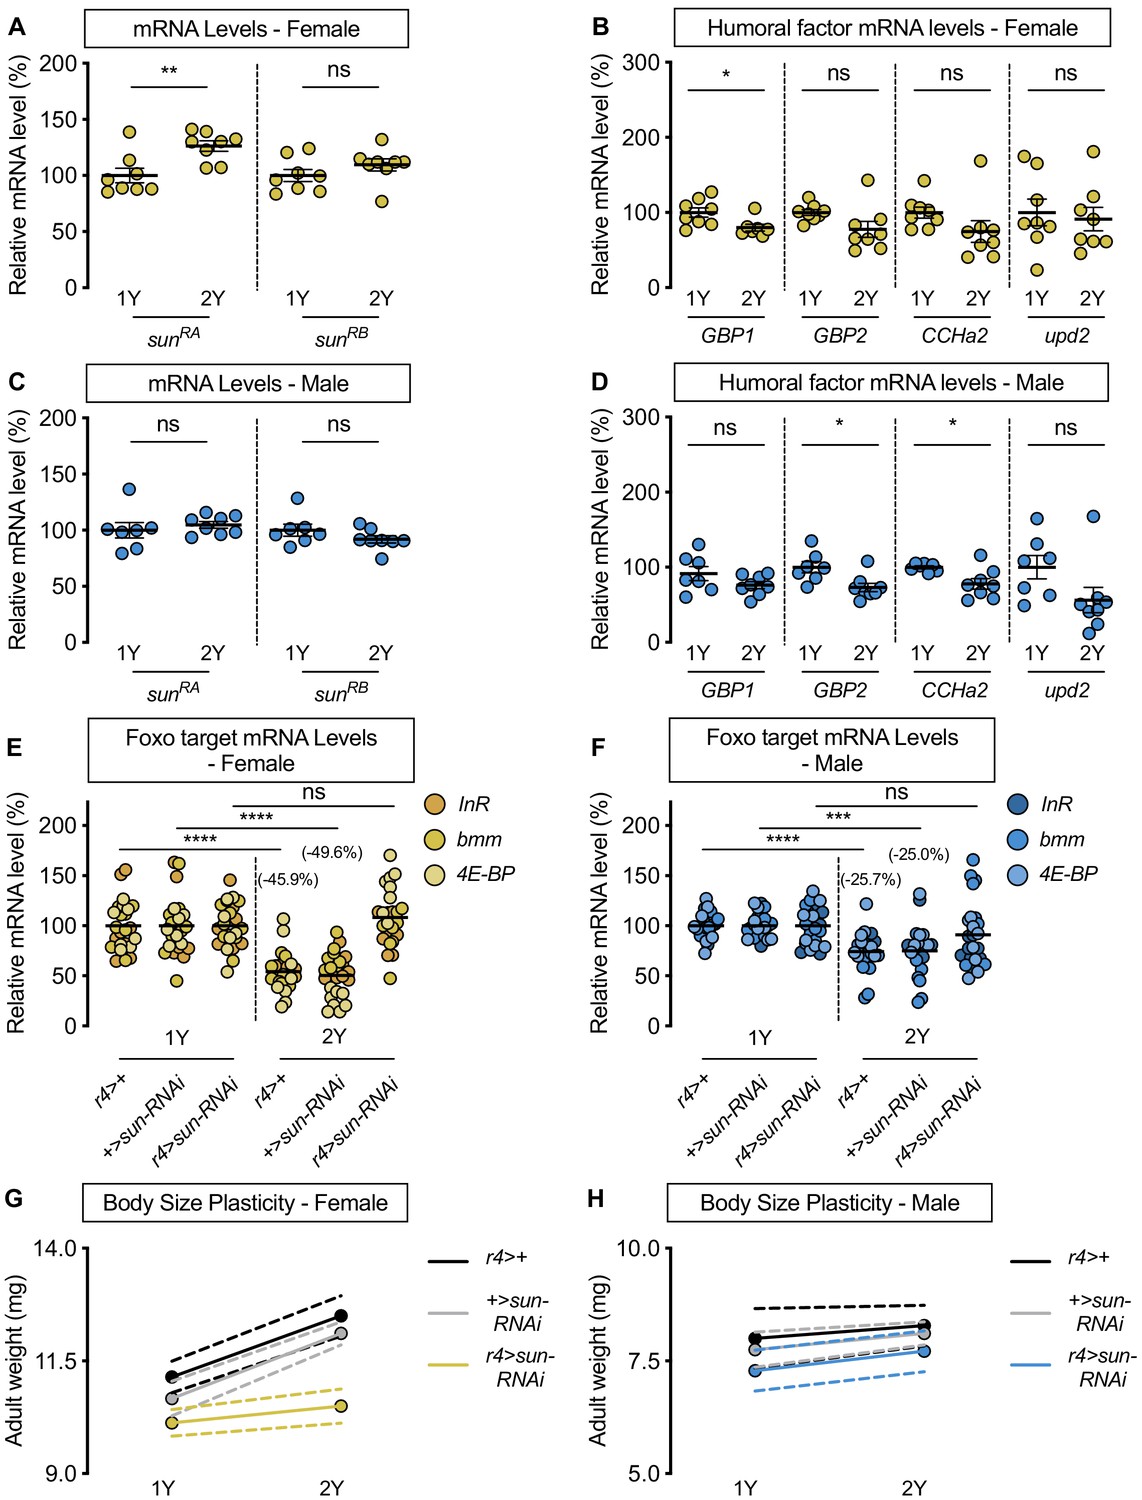
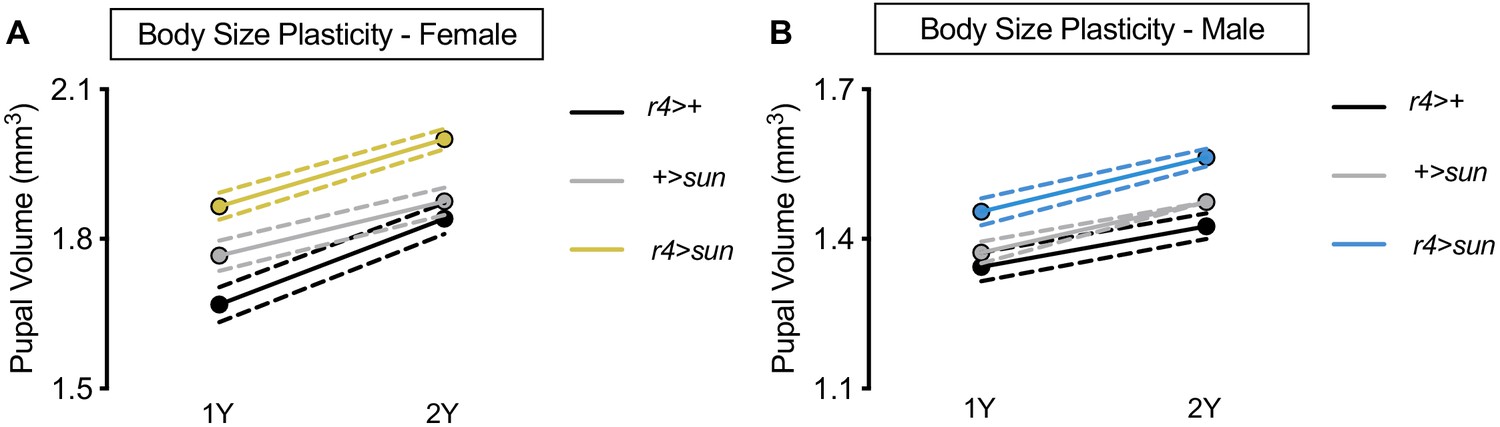
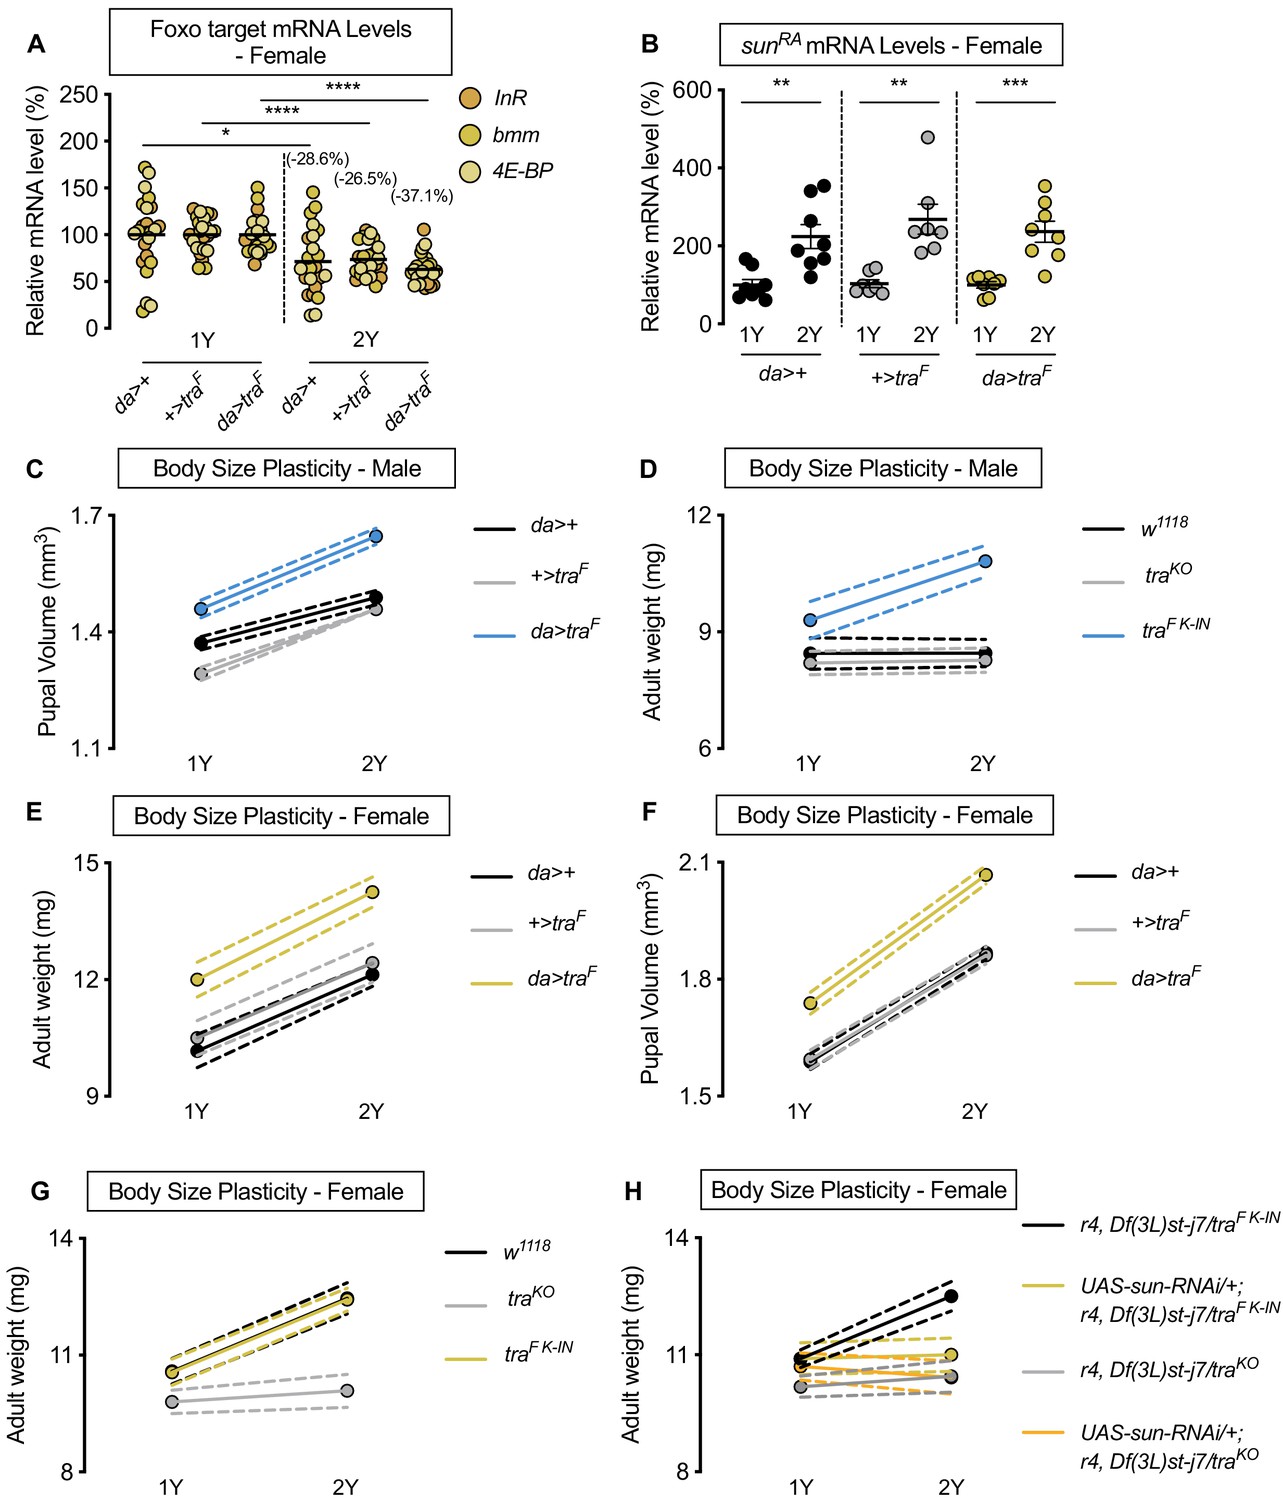
(A) In females, mRNA levels of stunted (sun)RA, but not sunRB, were significantly higher in larvae cultured on a protein-rich diet (2Y) compared with larvae raised on a diet containing half the protein (1Y) (p=0.0055 and p=0.2327, respectively; Student’s t test). n = 8 biological replicates. (B) mRNA levels of Growth-blocking peptide 1 (Gbp1) were significantly different in females cultured on 2Y compared with females raised in 1Y (p=0.0245; Student’s t test); however, mRNA levels of Growth-blocking peptide 2 (Gbp2), CCHamide-2 (CCHa2), and unpaired 2 (upd2) were not significantly different between female larvae raised on 1Y and 2Y (p=0.0662, 0.1416, and 0.7171, respectively; Student’s t test). n = 7–8 biological replicates. (C) In males, mRNA levels of sunRA and sunRB were not significantly different in larvae raised on 2Y compared with larvae raised on 1Y (p=0.5832 and p=0.2017, respectively; Student’s t test). n = 7–8 biological replicates. (D) Levels of Gbp1 and upd2 were not significantly different between male larvae raised on 2Y compared with larvae reared on 1Y (p=0.1487, and p=0.1686, respectively; Student’s t test); whereas levels of Gbp2 and CCHa2 were significantly different between males raised in 2Y and 1Y (p=0.0214, and p=0.0272, respectively; Student’s t test). n = 7–8 biological replicates. (E) In control r4>+, and +>sun-RNAi females, mRNA levels of Foxo targets (insulin receptor (InR), brummer (bmm), and eukaryotic initiation factor 4E-binding protein (4E-BP)), were significantly lower in larvae cultured on 2Y compared with larvae raised on 1Y (p<0.0001, for both comparisons; Student’s t test). However, in r4>sun-RNAi females, there was no significant difference in Foxo target mRNA levels (p=0.2792; Student’s t test). n = 8 biological replicates. (F) In control r4>+, and +>sun-RNAi males, mRNA levels of Foxo targets were significantly lower in larvae cultured on 2Y compared with larvae raised on 1Y (p<0.0001 and p=0.0001, respectively; Student’s t test). While r4>sun-RNAi males showed no significant difference in Foxo target mRNA levels (p=0.2469; Student’s t test), there was no genotype:diet interaction among males (p=0.1068), suggesting that genotype had no impact on Foxo target genes. Importantly, there was a significant sex:diet interaction for Foxo target mRNA levels in both the r4>+ control (p=0.0166; two-way ANOVA followed by Tukey HSD test) and +>sun-RNAi control (p=0.0119; two-way ANOVA followed by Tukey HSD test), but not in r4>sun-RNAi larvae (p=0.1121; two-way ANOVA followed by Tukey HSD test). n = 7–8 biological replicates. (G) Adult weight was significantly higher in female flies raised in 2Y compared with females raised in 1Y in r4>+ and +>UAS-sun-RNAi controls (p<0.0001 for both genotypes; two-way ANOVA followed by Tukey HSD test); however, adult weight was not significantly different between r4>UAS-sun-RNAi females reared on 2Y compared with genotype-matched females raised on 1Y (p=0.5035; two-way ANOVA followed by Tukey HSD test). n = 7–10 groups of 10 flies. (H) Adult weight was not significantly higher in male flies reared in 2Y compared with males cultured in 1Y for r4>+ and +>UAS-sun-RNAi controls or r4>UAS-sun-RNAi males (p=0.8883, 0.6317, and 0.554, respectively; two-way ANOVA followed by Tukey HSD test). There was a significant sex:diet interaction in the r4>+ and +>UAS-sun-RNAi control genotypes (p=0.011 and p=0.0005, respectively; two-way ANOVA followed by Tukey HSD test), but no sex:diet interaction in the r4>UAS-sun-RNAi genotype (p=0.8749; two-way ANOVA followed by Tukey HSD test). n = 6–9 groups of 10 flies. For all body size plasticity graphs, filled circles indicate mean body size, and dashed lines indicate 95% confidence interval. * indicates p<0.05, ** indicates p<0.01, *** indicates p<0.001 **** indicates p<0.0001; ns indicates not significant; error bars indicate SEM.
Figure 3—figure supplement 1
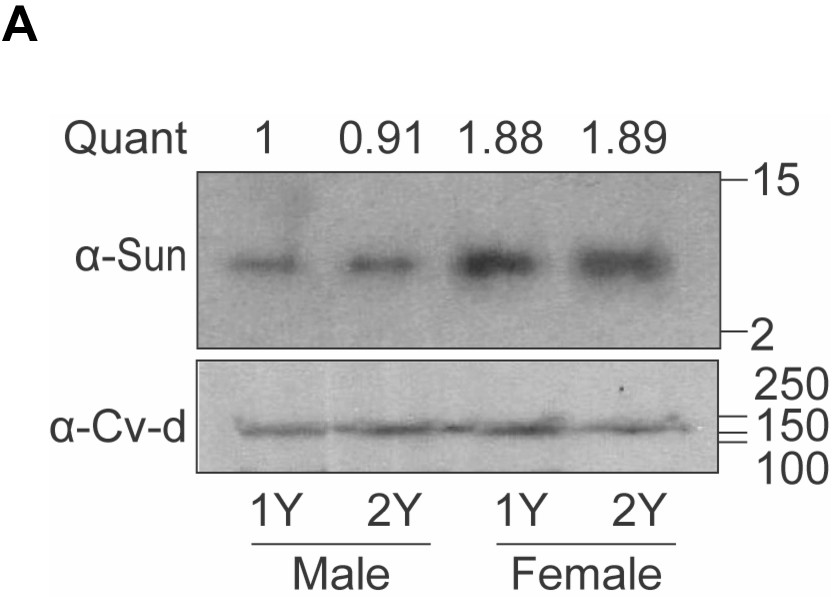
Increased circulating levels of Stunted (Sun) in females.
(A) Hemolymph levels of Sun in male and female larvae 108 hr after egg laying raised on a protein-rich diet (2Y) compared with male and female larvae cultured on a diet with half the protein (1Y). Quantification indicates ratio of Sun protein normalised to loading control Crossveinless-d (Cv-d), relative to male 1Y. n = 1 biological replicates.
Figure 3—figure supplement 2
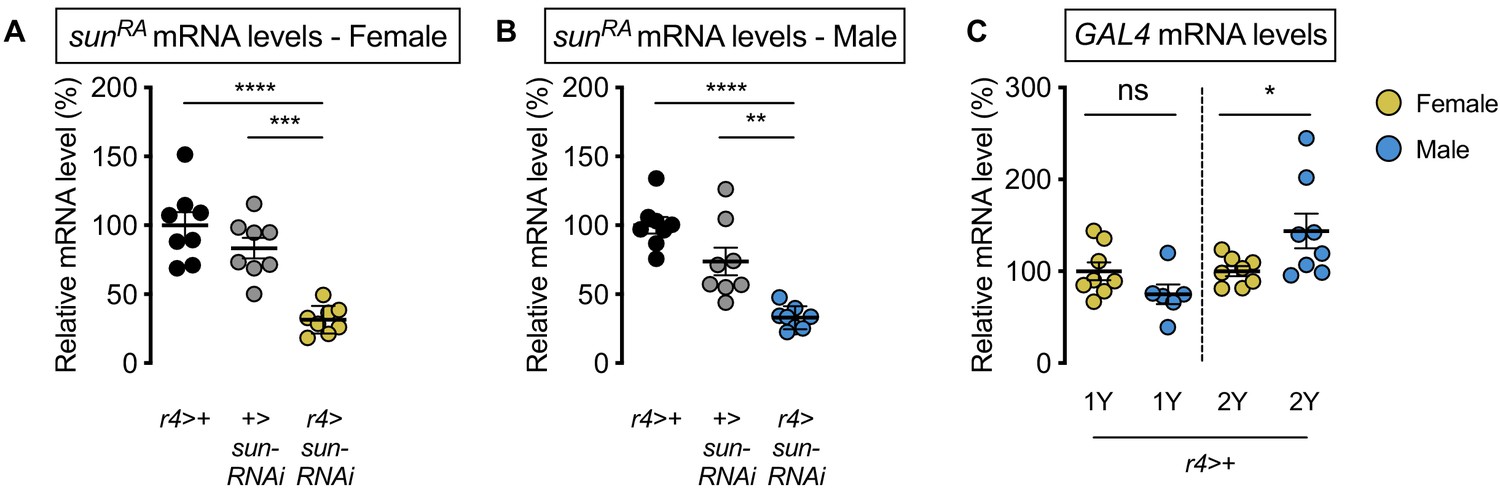
Validation of stunted (sun) knockdown.
(A) mRNA levels of stunted (sunRA) were significantly lower in r4-GAL4>UAS-sun-RNAi females compared with r4-GAL4>+ and +>UAS-sun-RNAi control females (p<0.0001 and p=0.0001, respectively; one-way ANOVA followed by Tukey HSD test). n = 8 biological replicates. (B) mRNA levels of stunted (sunRA) were significantly lower in r4-GAL4>UAS-sun-RNAi males compared with r4-GAL4>+ and +>UAS-sun-RNAi control males (p<0.0001 and p=0.0012, respectively; one-way ANOVA followed by Tukey HSD test). n = 8 biological replicates. (C) Levels of GAL4 mRNA were not significantly different between the sexes in larvae raised in 1Y (p=0.1105; Student’s t test), whereas GAL4 mRNA levels were significantly higher in males in 2Y (p=0.0428; Student’s t test). n = 6–8 biological replicates. * indicates p<0.05, ** indicates p<0.01, *** indicates p<0.001, **** indicates p<0.0001; ns indicates not significant; error bars indicate SEM.
Figure 3—figure supplement 3
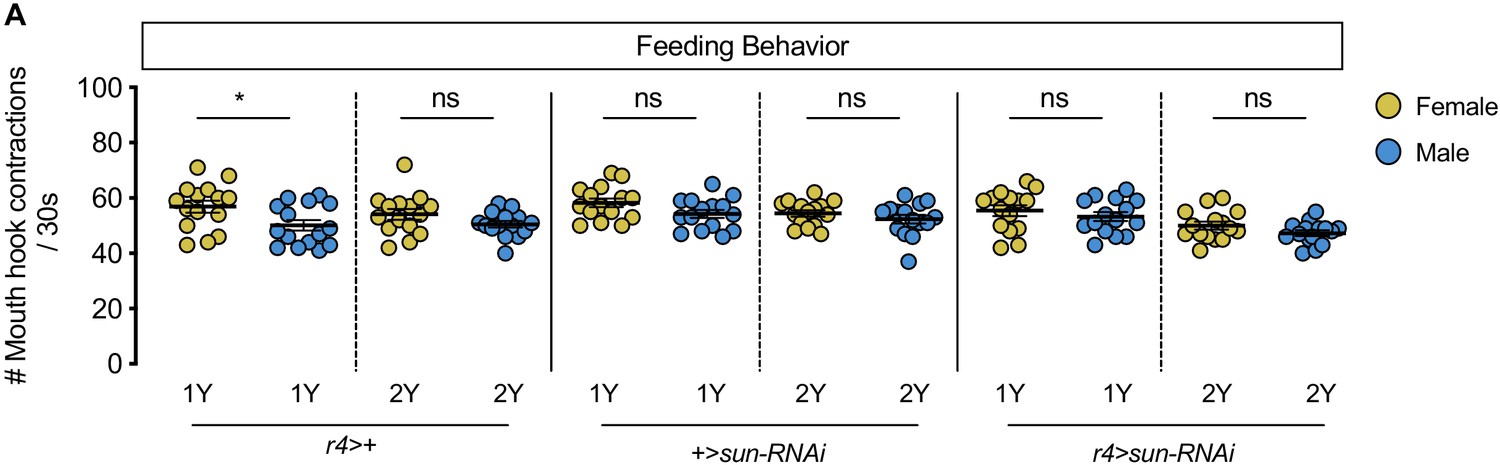
No sex difference in food intake in fat body stunted (sun) knockdown larvae.
(A) There was a significant difference in mouth hook contractions between r4 >+ control male and female larvae raised on a diet containing a widely used protein content (1Y) (p=0.025; Student’s t test), but not on a protein-rich diet (2Y) (p=0.1201; Student’s t test). There was no significant difference in mouth hook contractions between +>sun-RNAi control male and female larvae raised in 1Y (p=0.0725; Student’s t test), or 2Y (p=0.296; Student’s t test). There was no significant difference in mouth hook contractions between r4>sun-RNAi male and female larvae raised in 1Y (p=0.3997; Student’s t test), or 2Y (p=0.1249; Student’s t test). n = 15 biological replicates. * indicates p<0.05; ns indicates not significant; error bars indicate SEM.
Figure 3—figure supplement 4
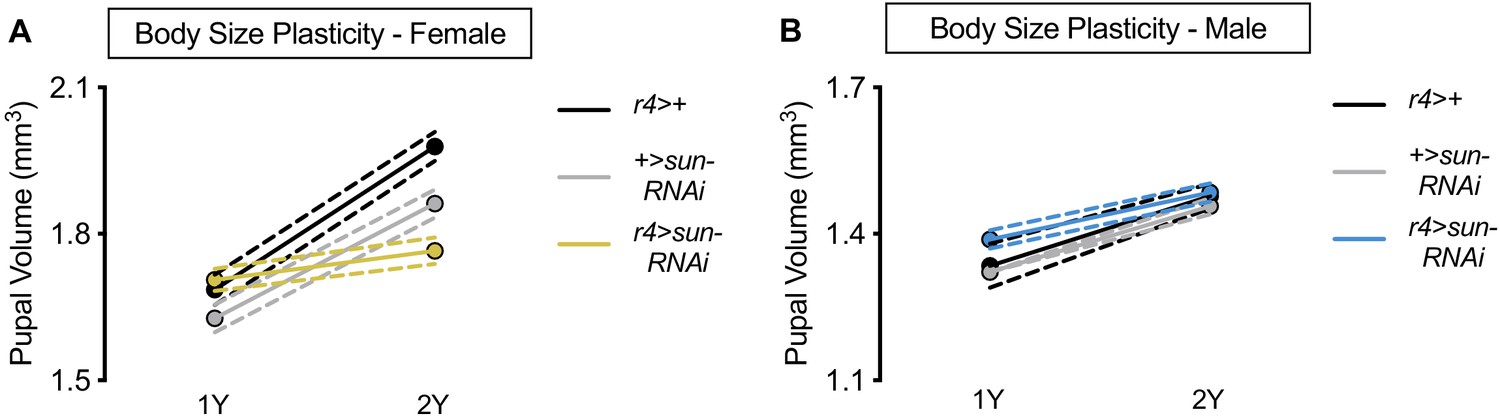
Nutrient-dependent increased female body size plasticity requires stunted (sun).
(A) Pupal volume was significantly higher in r4>+, +>UAS-sun-RNAi, and r4>UAS-sun-RNAi females reared on a protein-rich diet (2Y) compared with genotype-matched females cultured on a diet with half the protein (1Y) (p<0.0001 [r4>+ and +>UAS-sun-RNAi] and p=0.0367 [r4>UAS-sun-RNAi]; two-way ANOVA followed by Tukey HSD test). The magnitude of the nutrient-dependent increase in pupal volume was significantly lower in r4>UAS-sun-RNAi females (genotype:diet interaction p<0.0001; two-way ANOVA followed by Tukey HSD test). n = 69–80 pupae. (B) Pupal volume was significantly higher in r4>+, +>UAS-sun-RNAi, and r4>UAS-sun-RNAi males reared on 2Y compared with genotype-matched males cultured on 1Y (p<0.0001 for all genotypes; two-way ANOVA followed by Tukey HSD test). The magnitude of the nutrient-dependent increase in pupal volume was not significantly different between r4>UAS-sun-RNAi males and control males (genotype:diet interaction p=0.0784; two-way ANOVA followed by Tukey HSD test). n = 44–80 pupae. For body size plasticity graphs, filled circles indicate mean pupal volume, and dashed lines indicate 95% confidence interval.
Figure 3—figure supplement 5
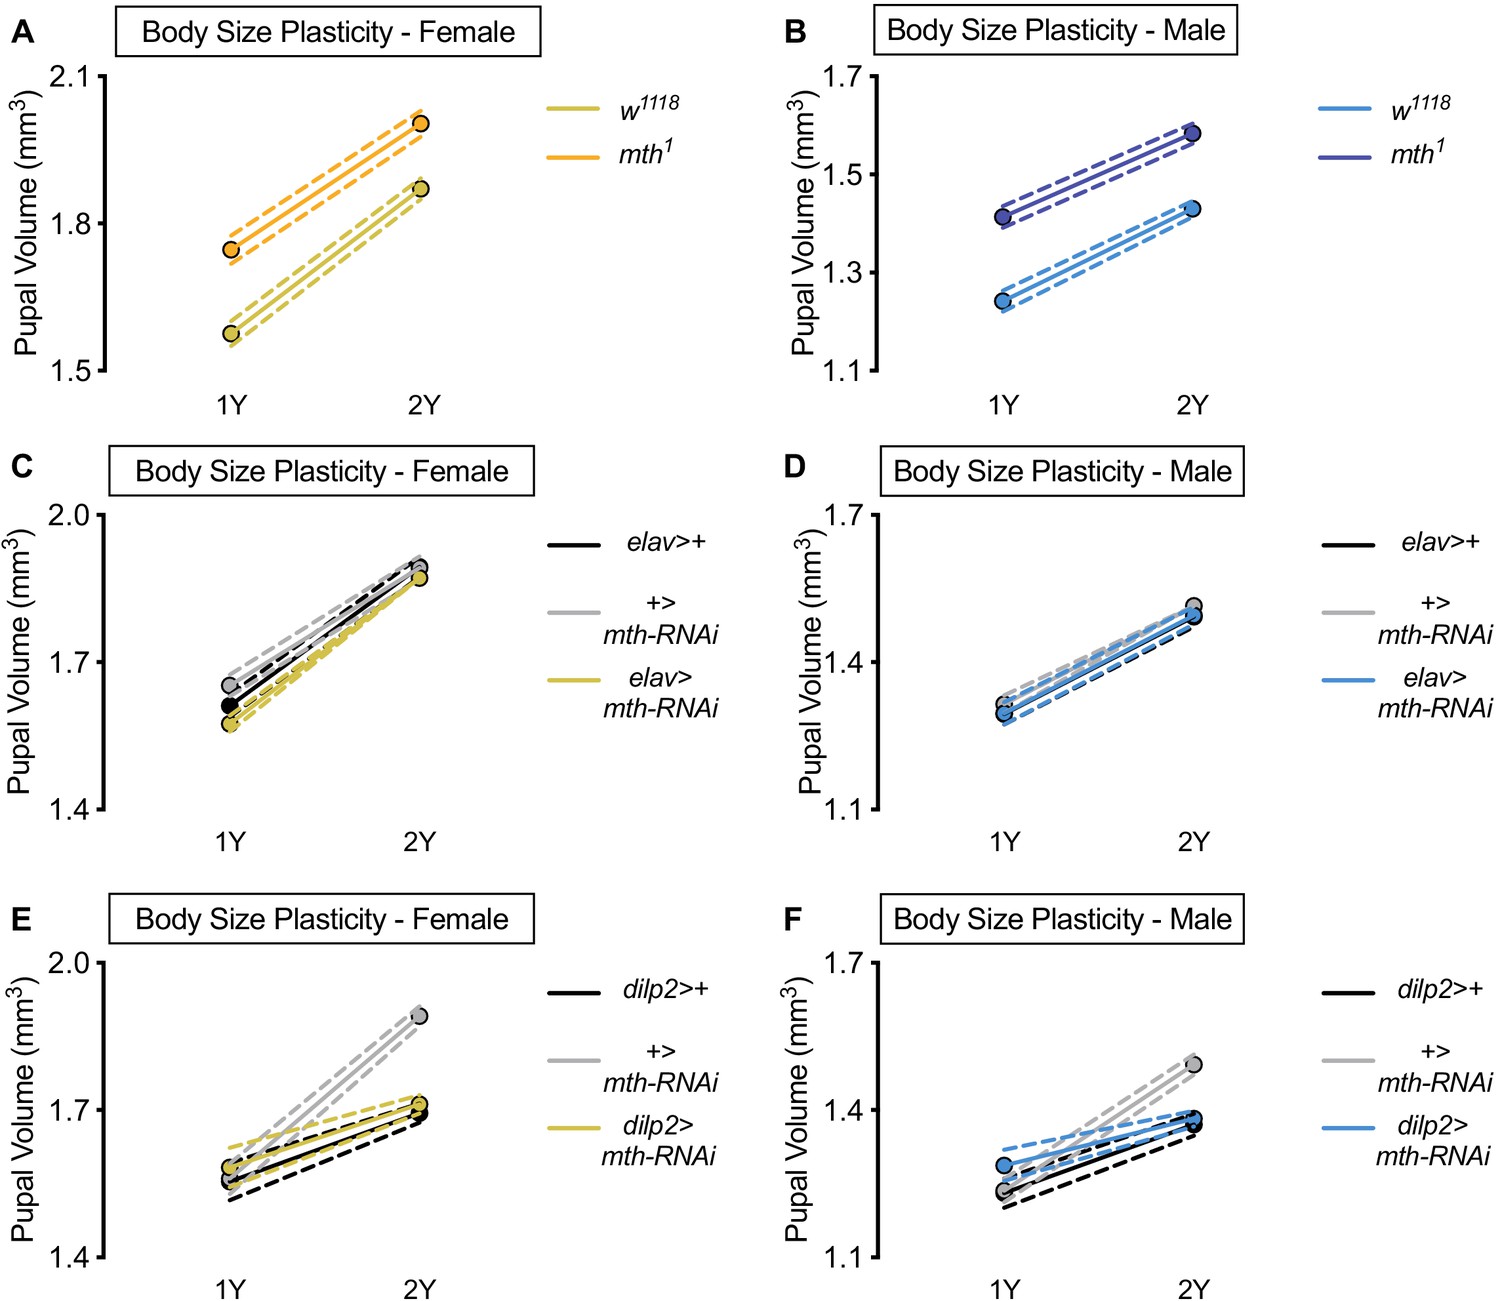
methuselah (mth) is dispensable for nutrient-dependent increased female body size plasticity.
(A) Pupal volume was significantly higher in w1118 females and mth1 mutant females reared on a protein-rich diet (2Y) compared with genotype-matched females cultured on a diet with half the protein (1Y) (p<0.0001 for both genotypes; two-way ANOVA followed by Tukey HSD test). The magnitude of the nutrient-dependent increase in pupal volume was not significantly different between the genotypes (genotype:diet interaction p=0.1383; two-way ANOVA followed by Tukey HSD test). n = 59–69 pupae. (B) Pupal volume was significantly higher in w1118 males and mth1 mutant males reared on 2Y compared with genotype-matched males cultured on 1Y (p<0.0001 for both genotypes; two-way ANOVA followed by Tukey HSD test). The magnitude of the nutrient-dependent increase in pupal volume was not significantly different between genotypes (genotype:diet interaction p=0.3697; two-way ANOVA followed by Tukey HSD test). n = 60–75 pupae. (C) Pupal volume was significantly higher in elav>+, +>UAS-mth-RNAi, and elav>UAS-mth-RNAi females reared on 2Y compared with genotype-matched females cultured on 1Y (p<0.0001 for all genotypes; two-way ANOVA followed by Tukey HSD test). The magnitude of the nutrient-dependent increase in pupal volume was not significantly larger in elav>UAS-mth-RNAi females, but was significantly different in +>UAS-mth-RNAi females (genotype:diet interaction p=0.0148; two-way ANOVA followed by Tukey HSD test). n = 53–77 pupae. (D) Pupal volume was significantly higher in elav>+, +>UAS-mth-RNAi, and elav>UAS-mth-RNAi males reared on 2Y compared with genotype-matched males cultured on 1Y (p<0.0001 for all genotypes; two-way ANOVA followed by Tukey HSD test). The magnitude of the nutrient-dependent increase in pupal volume was not significantly different (genotype:diet interaction p=0.9947; two-way ANOVA followed by Tukey HSD test). n = 57–86 pupae. (E) Pupal volume was significantly higher in dilp2>+, +>UAS-mth-RNAi, and dilp2>UAS-mth-RNAi females reared on 2Y compared with genotype-matched females cultured on 1Y (p<0.0001 for all genotypes; two-way ANOVA followed by Tukey HSD test). The magnitude of the nutrient-dependent increase in pupal volume was significantly blunted in both dilp2>+ and dilp2>UAS-mth-RNAi females (genotype:diet interaction p<0.0001; two-way ANOVA followed by Tukey HSD test). n = 36–64 pupae. (F) Pupal volume was significantly higher in dilp2>+, +>UAS-mth-RNAi, and dilp2>UAS-mth-RNAi males reared on 2Y compared with genotype-matched males cultured on 1Y (p<0.0001 for all genotypes; two-way ANOVA followed by Tukey HSD test). The magnitude of the nutrient-dependent increase in pupal volume was significantly blunted in dilp2>+ and dilp2>UAS-mth-RNAi males (genotype:diet interaction p<0.0001; two-way ANOVA followed by Tukey HSD test). n = 34–63 pupae. For body size plasticity graphs, filled circles indicate mean pupal volume, and dashed lines indicate 95% confidence interval.
Figure 3—figure supplement 6
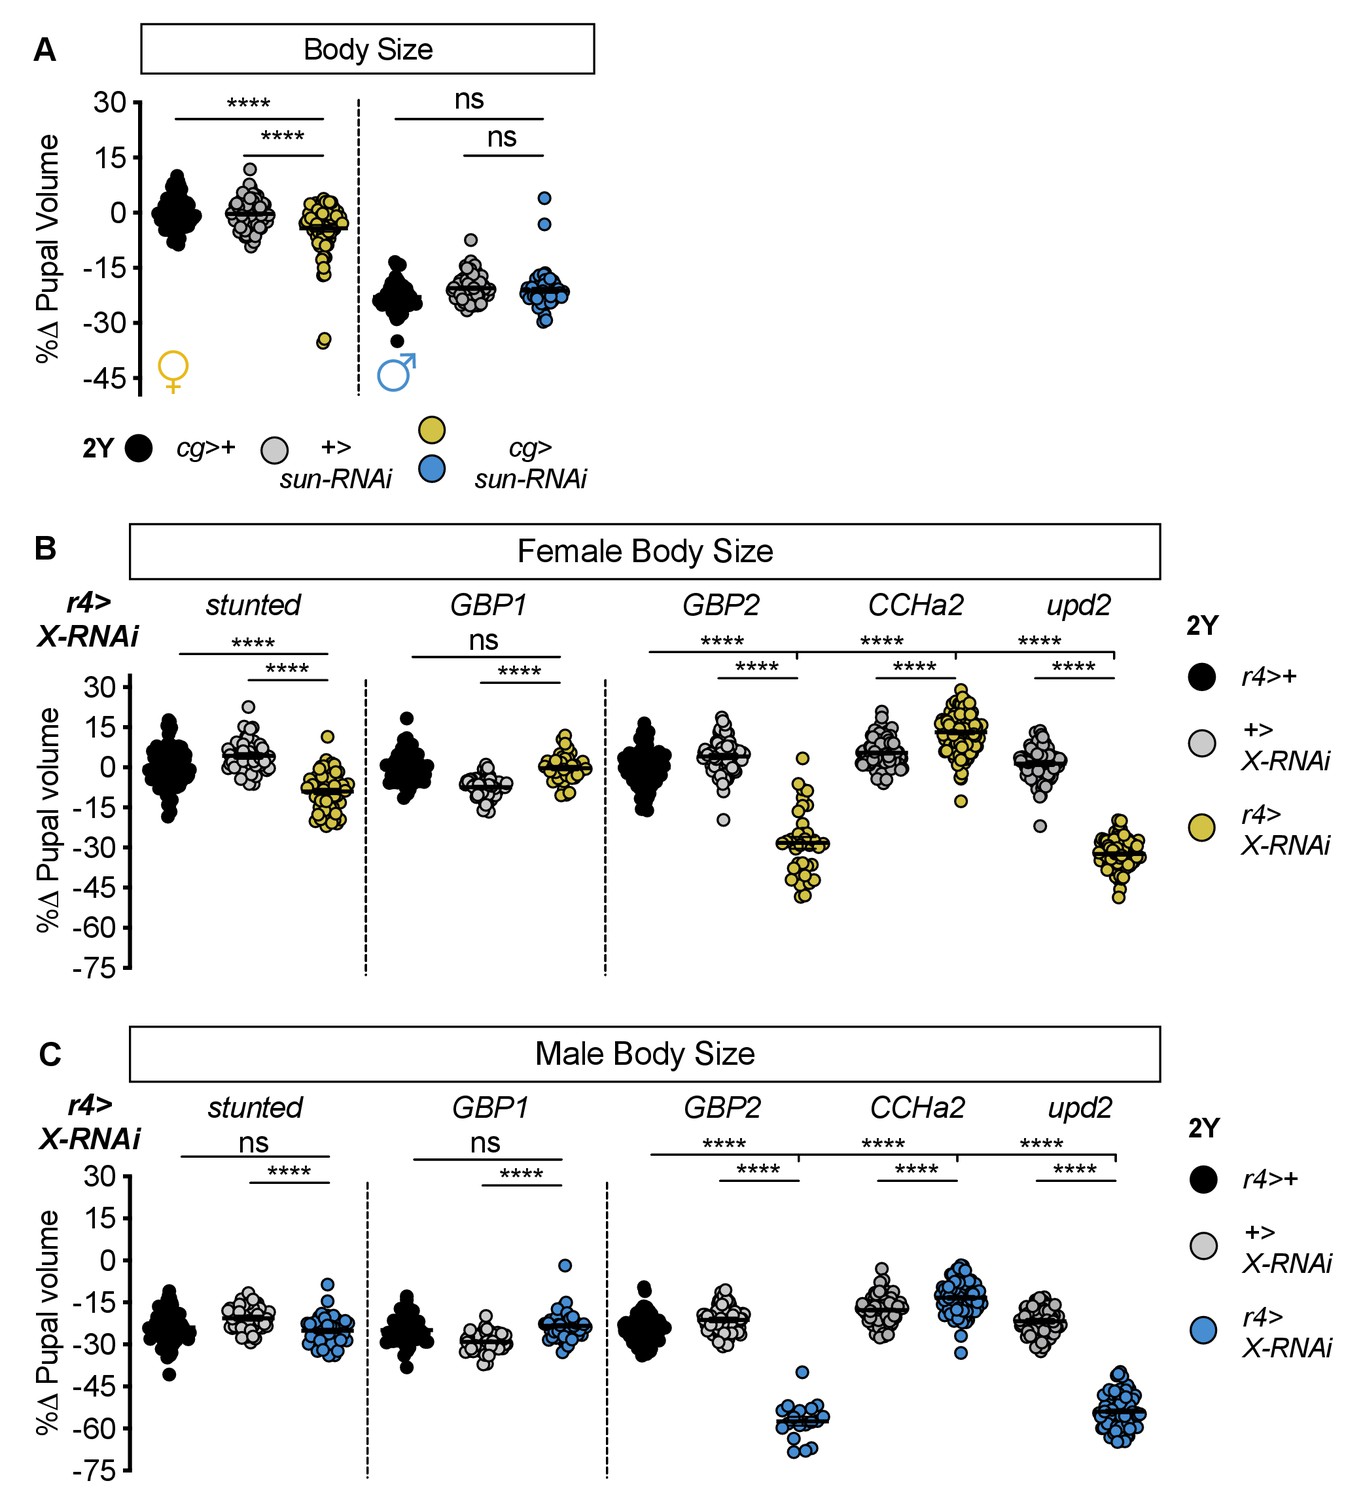
Most humoral factors have non-sex-specific effects on body size.
(A) Pupal volume was significantly smaller in females with fat body-specific expression of an RNAi transgene directed against stunted (sun). Pupal volume was significantly reduced in cg>UAS-sun-RNAi females compared with cg>+ and +>UAS-sun-RNAi control females (p<0.0001 for both comparisons; two-way ANOVA followed by Tukey HSD test). This decreased pupal volume was not reproduced in cg>UAS-sun-RNAi males compared with cg>+ and +>UAS-sun-RNAi control males (p=0.3657 and p=0.9852, respectively; two-way ANOVA followed by Tukey HSD test). RNAi-mediated knockdown of sun had larger effects on pupal volume in females than in males (sex:genotype interaction p<0.0001; two-way ANOVA followed by Tukey HSD test). n = 54–85 pupae. (B) Pupal volume was significantly different in females with fat body-specific expression of RNAi transgenes directed against sun, Growth-blocking peptide 2 (Gbp2), CCHamide-2 (CCHa2), unpaired 2 (upd2) compared with r4>+ and +>UAS-X-RNAi control females (p<0.0001 for both comparisons [sun], p<0.0001 for both comparisons [Gbp2], p<0.0001 for both comparisons [CCHa2], p<0.0001 for both comparisons [upd2]; one-way ANOVA followed by Tukey HSD test); but not upon RNAi-mediated knockdown of Growth-blocking peptide 1 (Gbp1) (p=0.9665 and p<0.0001 respectively; one-way ANOVA followed by Tukey HSD test). n = 35–114 pupae. (C) Pupal volume was significantly different in males with fat body-specific expression of RNAi transgenes directed against Gbp2, CCHa2, and upd2 compared with r4>+ and +>UAS-X-RNAi control males (p<0.0001 for both comparisons [Gbp2], p<0.0001 for both comparisons [CCHa2], p<0.0001 for both comparisons [upd2]; one-way ANOVA followed by Tukey HSD test); but not reduced in males carrying RNAi transgenes directed against sun and Gbp1 (p=0.3513 and p<0.0001, respectively [sun]; p=0.1274 and p<0.0001, respectively [Gbp1]; one-way ANOVA followed by Tukey HSD test). n = 18–100 pupae. For body size graphs, filled circles indicate pupal volume and error bars indicate SEM. **** indicates p<0.0001; ns indicates not significant.
Figure 3—figure supplement 7
stunted (sun) overexpression augments body size but does not confer increased body size plasticity in males.
(A) Pupal volume was significantly higher in r4>+, +>UAS-sun, and r4>UAS-sun females reared on a protein-rich diet (2Y) compared with genotype-matched females cultured on a diet containing half the protein concentration (1Y) (p<0.0001 for all genotypes; two-way ANOVA followed by Tukey HSD test). The magnitude of the nutrient-dependent increase in pupal volume was not significantly different between female genotypes (genotype:diet interaction p=0.0895; two-way ANOVA followed by Tukey HSD test). n = 43–65 pupae. (B) Pupal volume was significantly higher in r4>+, +>UAS-sun, and r4>UAS-sun males reared on 2Y compared with genotype-matched males cultured on 1Y (p<0.0001 for all genotypes; two-way ANOVA followed by Tukey HSD test), but the magnitude of the nutrient-dependent increase in pupal volume was not different between male genotypes (genotype:diet interaction p=0.4959; two-way ANOVA followed by Tukey HSD test). n = 44–67 pupae. For body size plasticity graphs, filled circles indicate mean pupal volume, and dashed lines indicate 95% confidence interval.
Figure 3—figure supplement 8
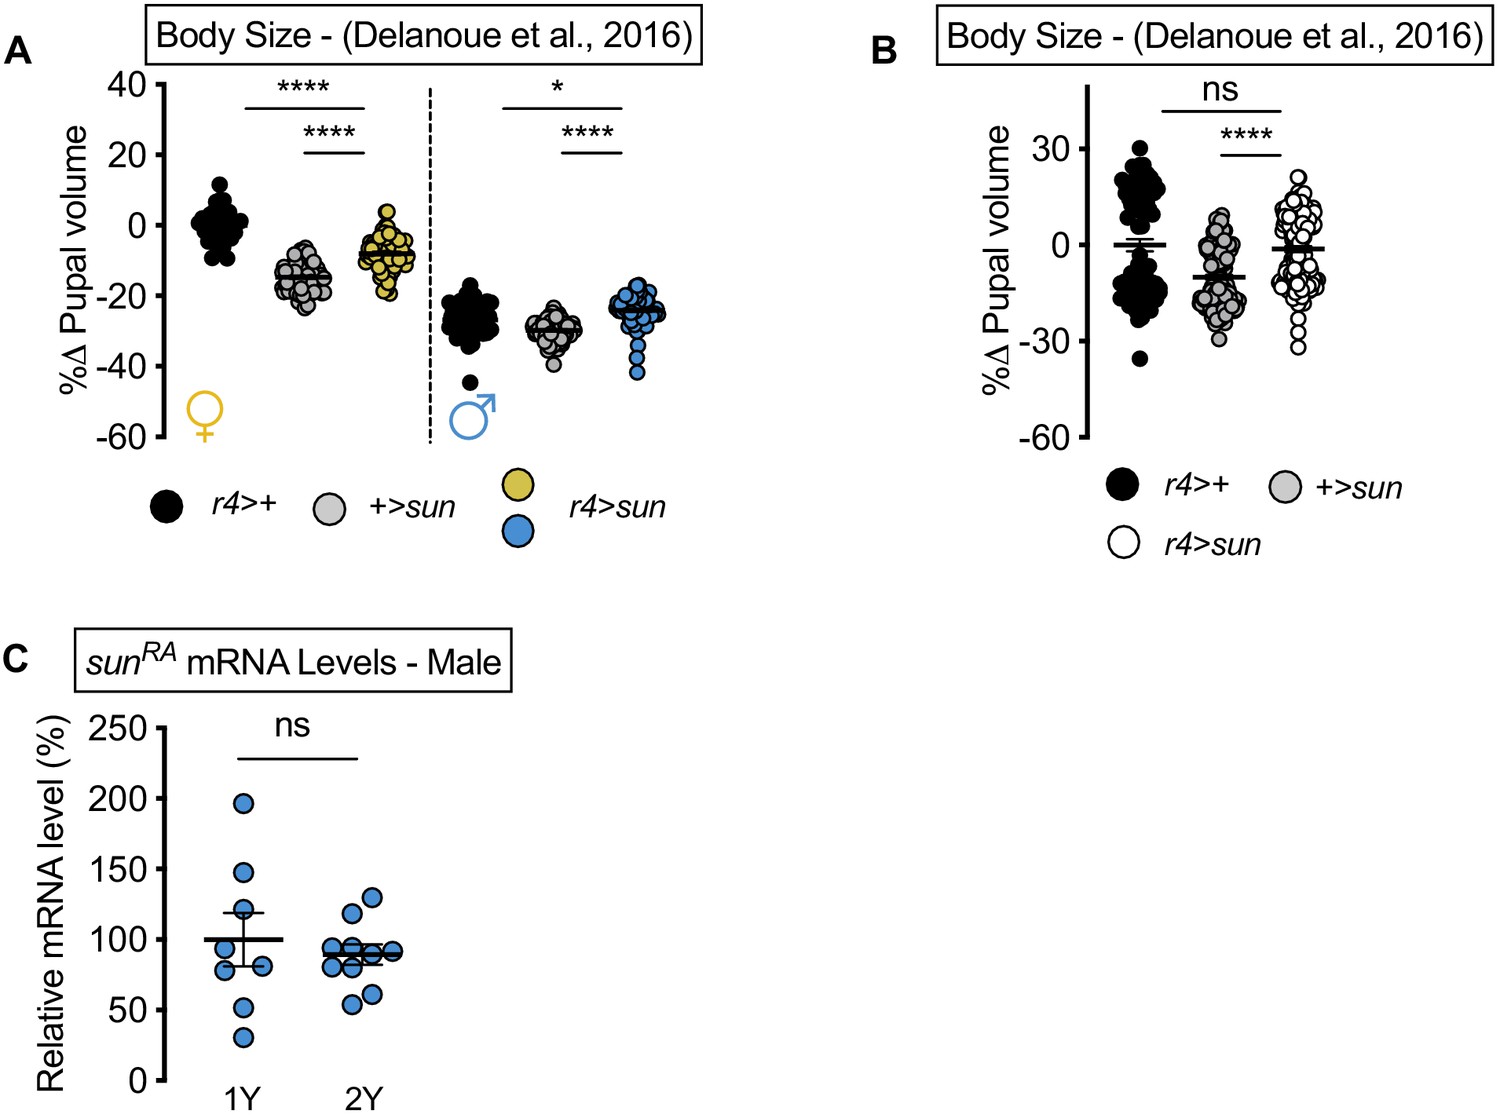
stunted (sun) overexpression augments body size in the diet used in Delanoue et al., 2016 in males.
(A) Pupal volume was not significantly larger in r4>UAS-sun females compared with r4>+ and +>UAS-sun control females cultured on the diet used in Delanoue et al., 2016 (p<0.0001 for both comparisons; two-way ANOVA followed by Tukey HSD test). Pupal volume was significantly larger in r4>UAS-sun males compared with r4>+ and +>UAS-sun control males cultured on the diet used in Delanoue et al., 2016 (p=0.0104 and p<0.0001, respectively; two-way ANOVA followed by Tukey HSD test). n = 36–95 pupae. (B) Pupal volume was not significantly different in pooled in r4>UAS-sun males and females compared with pooled r4>+ and +>UAS-sun control males and females cultured on the diet used in Delanoue et al., 2016 (p=0.7224 and p<0.0001, respectively; two-way ANOVA followed by Tukey HSD test). n = 77–174 pupae. (C) mRNA levels of sunRA were not significantly different in r4>UAS-sun males cultured on 1Y compared to genotype matched males cultured on 2Y (p=0.5763; Student’s t test). n = 8–10 biological replicates. For body size graphs, filled circles indicate pupal volume and error bars indicate SEM. * indicates p<0.05, **** indicates p<0.0001; ns indicates not significant.
Figure 4 with 3 supplements
Sex determination gene transformer (tra) regulates increased nutrient-dependent body size plasticity in females.
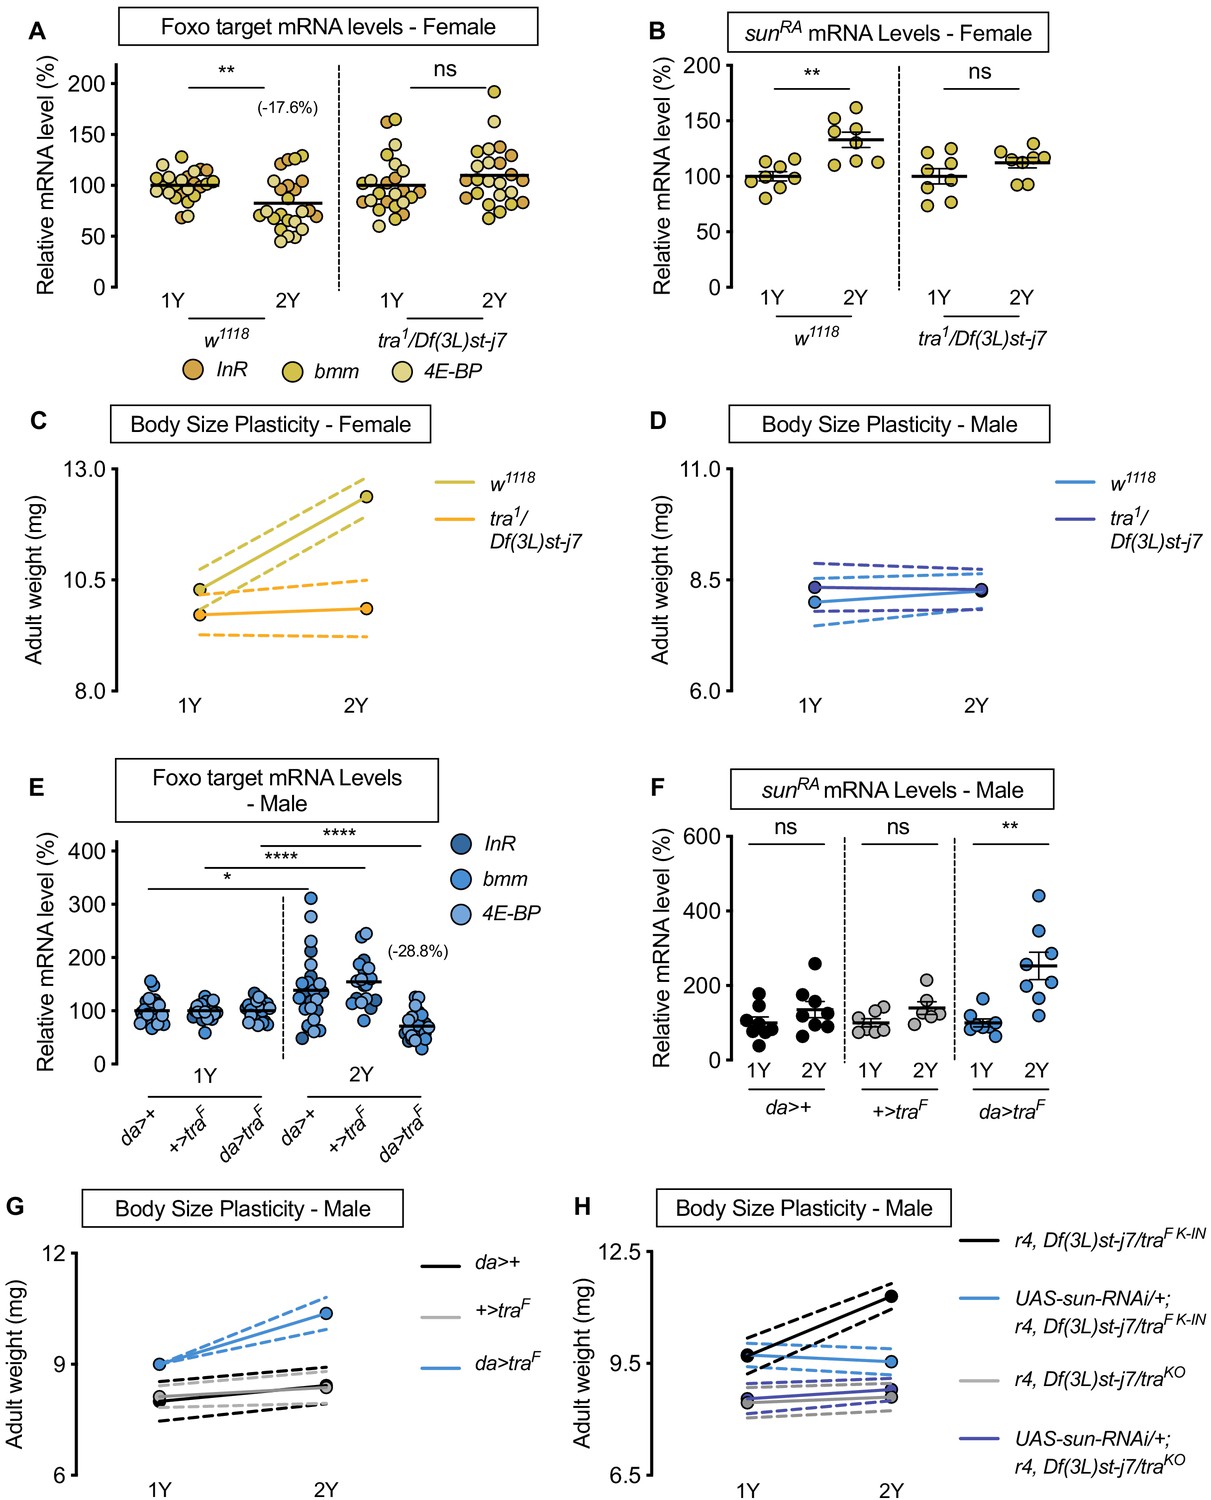
(A) In control w1118 females, mRNA levels of Foxo targets (insulin receptor (InR), brummer (bmm), and eukaryotic initiation factor 4E-binding protein (4E-BP)), were significantly lower in larvae cultured on a protein-rich diet (2Y) compared with larvae raised on a diet containing half the protein (1Y) (p=0.0057; Student’s t test). In tra mutant (tra1/Df(3L)st-j7) females, there was no significant difference in mRNA levels of Foxo targets in larvae cultured on 2Y compared with larvae raised on 1Y (p=0.2291 Student’s t test). n = 8 biological replicates. (B) In control females, mRNA levels of sunRA were significantly higher in larvae cultured on 2Y compared with larvae raised on 1Y (p=0.0011; Student’s t test); however, in tra1/Df(3L)st-j7 females there was no significant difference in sunRA mRNA levels between larvae cultured on 2Y compared with larvae raised on 1Y (p=0.1644; Student’s t test). n = 8 biological replicates. (C) Adult weight was significantly higher in w1118 females raised on 2Y compared with females reared on 1Y (p<0.0001; two-way ANOVA followed by Tukey HSD test); however, there was no significant difference in adult weight between tra1/Df(3L)st-j7 females cultured on 2Y compared with genotype-matched females raised on 1Y (p=0.9617; two-way ANOVA followed by Tukey HSD test). n = 7–8 groups of 10 flies. (D) Adult weight was not significantly higher in either w1118 control or tra1/Df(3L)st-j7 mutant males in flies raised on 2Y compared with males reared on 1Y (p=0.7808 and p=0.9983, respectively; two-way ANOVA followed by Tukey HSD test). There was a significant sex:diet interaction in the w1118 control genotype (p<0.0001; two-way ANOVA followed by Tukey HSD test); however, there was no sex:diet interaction in the tra1/Df(3L)st-j7 genotype (p=0.6598; two-way ANOVA followed by Tukey HSD test). n = 6–8 groups of 10 flies. (E) In control da>+, and +>traF males, mRNA levels of Foxo targets were significantly higher in larvae cultured on 2Y compared with larvae raised on 1Y a diet containing half the protein content (1Y) (p=0.0108 and p<0.0001, respectively; Student’s t test). However, in da>traF males, there was a significant decrease in Foxo target mRNA levels (p<0.0001; Student’s t test). n = 8 biological replicates. Importantly, there was a significant sex:diet interaction for Foxo target mRNA levels in both the da>+ control (p=0.0004; two-way ANOVA followed by Tukey HSD test) and +>traF control (p<0.0001; two-way ANOVA followed by Tukey HSD test), but not in da>traF larvae (p=0.3095; two-way ANOVA followed by Tukey HSD test). n = 7–8 biological replicates. (F) In control da>+ and +>UAS-traF males, mRNA levels of sunRA were not significantly different between larvae cultured on 2Y compared with larvae raised on 1Y (p=0.2064 and p=0.0711, respectively; Student’s t test). In contrast, da>UAS-traF males showed a significant increase in mRNA levels of sunRA in larvae cultured on 2Y compared with males raised on 1Y (p=0.0013; Student’s t test). n = 6–8 biological replicates. (G) Adult weight was not significantly higher in da>+ and +>UAS-traF control males reared on 2Y compared with genotype-matched males flies cultured on 1Y (p=0.5186 and p=0.8858, respectively; two-way ANOVA followed by Tukey HSD test); however, there was a significant increase in adult weight between da>UAS-traF males cultured on 2Y compared with genotype-matched flies raised on 1Y (p<0.0001; two-way ANOVA followed by Tukey HSD test). n = 7–8 groups of 10 flies. (H) Adult weight was significantly higher in r4-GAL4 control males with traF K-IN, which express physiological levels of a functional Tra protein, when reared on 2Y compared with 1Y ((p<0.0001 [r4,Df(3L)st-j7/traF K-IN]); two-way ANOVA followed by Tukey HSD test). In contrast, the nutrient-dependent increase in adult weight was abolished upon fat body knockdown of sun in a traF K-IN male ((p=0.9915 [UAS-sun-RNAi/+;r4,Df(3L)st-j7/traF K-IN]); two-way ANOVA followed by Tukey HSD test). Adult weight was not different in tra mutant r4-GAL4 males (r4,Df(3L)st-j7/traKO) reared on 2Y compared with genotype-matched males cultured on 1Y (p=0.9980; two-way ANOVA followed by Tukey HSD test). Adult weight was not reduced in 1Y with fat body knockdown of sun in a tra mutant male ((UAS-sun-RNAi/+;r4,Df(3L)st-j7/traKO) (p=0.9998 [UAS-sun-RNAi/+;r4,Df(3L)st-j7/traKO v r4,Df(3L)st-j7/traKO]); two-way ANOVA followed by Tukey HSD test). n = 9–11 groups of 10 flies. For all body size plasticity graphs, filled circles indicate mean body size, and dashed lines indicate 95% confidence interval. * indicates p<0.05, ** indicates p<0.01, **** indicates p<0.0001; ns indicates not significant; error bars indicate SEM.
Figure 4—figure supplement 1
Increased nutrient-dependent body size plasticity in females requires transformer.
(A) Pupal volume was significantly higher in w1118 females reared on a protein-rich diet (2Y) compared with w1118 females cultured on a diet containing half the protein concentration (1Y) (p<0.0001; two-way ANOVA followed by Tukey HSD test); however, this nutrient-dependent increase in pupal volume was not observed in transformer (tra) mutant females (tra1/Df(3L)st-j7) (p=0.1036; two-way ANOVA followed by Tukey HSD test). The magnitude of the nutrient-dependent increase in pupal volume was lower in tra1/Df(3L)st-j7 females (genotype:diet interaction p<0.0001). n = 39–69 pupae. (B) Pupal volume was significantly higher in w1118 females and tra mutant females (traKO) reared on 2Y compared with w1118 females and traKO females cultured on 1Y (p<0.0001, for both comparisons; two-way ANOVA followed by Tukey HSD test); however, the magnitude of the nutrient-dependent increase in pupal volume was lower in traKO females (genotype:diet interaction p<0.0001). n = 71–81 pupae. (C) There was no significant difference in mouth-hook contractions between w1118 control male and female larvae raised on 1Y (p=0.4103; Student’s t test), or 2Y (p=0.2961; Student’s t test). There was no significant difference in mouth hook contractions between tra mutant (tra1/Df(3L)st-j7) male and female larvae raised in 1Y (p=0.1961; Student’s t test), or 2Y (p=0.6732; Student’s t test). n = 15 biological replicates. (D) Pupal volume was significantly higher in w1118 males (p<0.0001; two-way ANOVA followed by Tukey HSD test), but not in tra1/Df(3L)st-j7 mutant males reared on 2Y compared with genotype-matched males cultured on 1Y (p=0.6643; two-way ANOVA followed by Tukey HSD test). n = 37–65 pupae. (E) Pupal volume was significantly higher in w1118 males and tra mutant males (traKO) reared on 2Y compared with genotype-matched males cultured on 1Y (p<0.0001, for both comparisons; two-way ANOVA followed by Tukey HSD test). n = 44–80 pupae. For body size plasticity graphs, filled circles indicate mean pupal volume, and dashed lines indicate 95% confidence interval. ns indicates not significant; error bars indicate SEM.
Figure 4—figure supplement 2
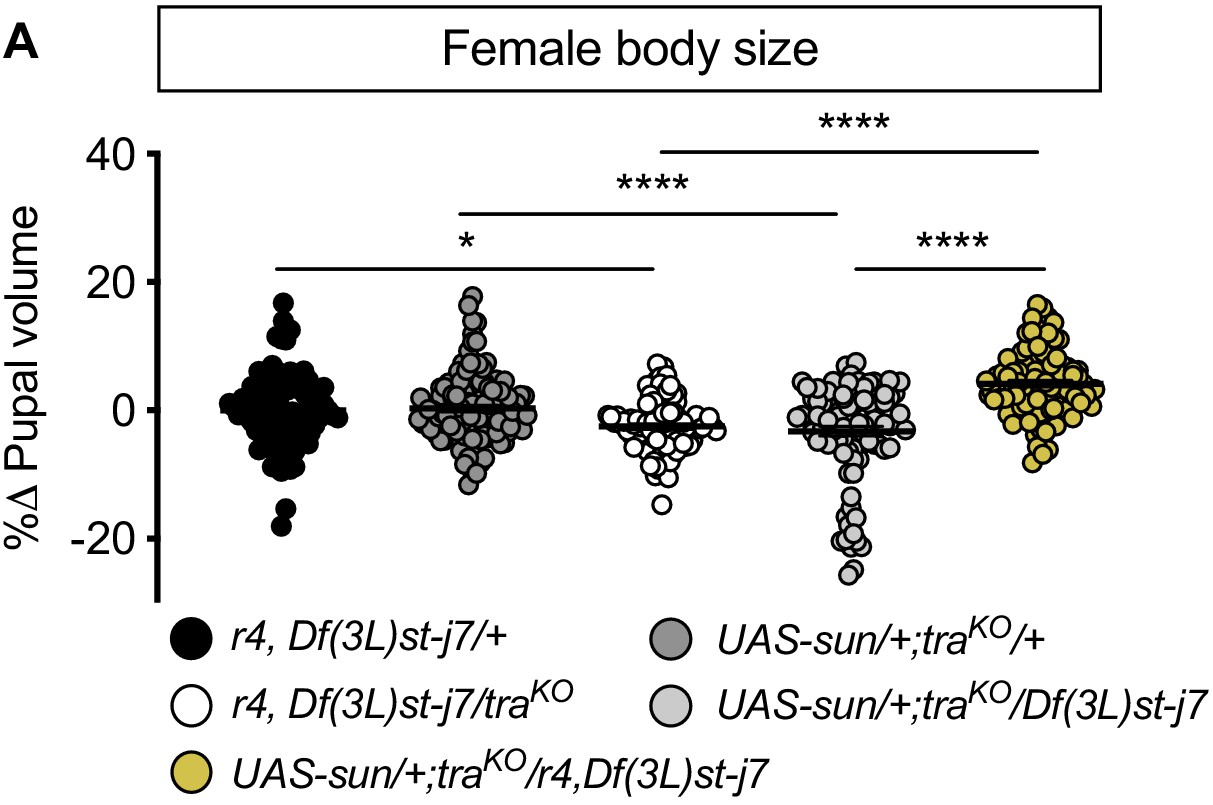
Fat body stunted (sun) overexpression is sufficient to rescue the reduced body size of transformer (tra) mutant females in a protein-rich (2Y) diet.
(A) In females, pupal volume was significantly smaller in tra mutant r4-GAL4 control females compared to r4-GAL4 control females with one copy of tra (p=0.0194 [r4,Df(3L)st-j7/+ v r4,Df(3L)st-j7/traKO]; one-way ANOVA followed by Tukey HSD test). Pupal volume was significantly smaller in tra mutant UAS-sun control females compared to UAS-sun control females with one copy of tra (p<0.0001 [UAS-sun/+; traKO/+ v UAS-sun/+; traKO/Df(3L)st-j7]; one-way ANOVA followed by Tukey HSD test). Pupal volume was significantly larger in tra mutant females with fat body overexpression of sun compared to tra mutant controls (p<0.0001, for both comparisons; one-way ANOVA followed by Tukey HSD test). n = 94–117 pupae. For body size graphs, filled circles indicate pupal volume and error bars indicate SEM. * indicates p<0.05, **** indicates p<0.0001; error bars indicate SEM.
Figure 4—figure supplement 3
Sex determination gene transformer (tra) regulates increased nutrient-dependent body size plasticity.
(A) In control da>+, +>UAS-traF and da>UAS-traF females, mRNA levels of Foxo targets (insulin receptor (InR), brummer (bmm), and eukaryotic initiation factor 4E-binding protein (4E-BP)), were significantly lower in larvae cultured on a protein-rich diet (2Y) compared with larvae raised on a diet containing half the protein content (1Y) (p=0.0124 [da>+], p<0.0001 [+>UAS-traF], and p<0.0001 [da>UAS-traF], respectively; Student’s t test). n = 8 biological replicates. (B) In control da>+ and +>UAS-traF, and da>UAS-traF females, mRNA levels of sunRA were significantly higher in larvae cultured on 2Y compared with larvae raised on 1Y (p=0.0024 [da>+], p=0.0013 [+>UAS-traF], and p=0.0003 [da>UAS-traF], respectively; Student’s t test). n = 8 biological replicates. (C) Pupal volume was significantly higher in da>+, +>UAS-traF, and da>UAS-traF males reared on 2Y compared with genotype-matched males cultured on 1Y (p<0.0001 for all genotypes; two-way ANOVA followed by Tukey HSD test). Importantly, the magnitude of the nutrient-dependent increase in pupal volume was higher in da>UAS-traF males (genotype:diet interaction p=0.0012; two-way ANOVA followed by Tukey HSD test). n = 70–91 pupae. (D) Adult weight was significantly higher in traF K-IN males, which express physiological levels of a functional Tra protein, when the males were reared on 2Y compared with genotype-matched males raised on 1Y (p<0.0001; two-way ANOVA followed by Tukey HSD test). In contrast, there was no significant increase in adult weight in w1118 and traKO male flies reared on 2Y compared with genotype-matched males raised on 1Y (p>0.9999 and p=0.9996, respectively; two-way ANOVA followed by Tukey HSD test). The magnitude of the nutrient-dependent increase in adult weight was significantly higher in traF K-IN males compared with w1118 and traKO male flies (genotype:diet interaction p<0.0001; two-way ANOVA followed by Tukey HSD test). n = 9–11 groups of 10 flies. (E) Adult weight was significantly higher in da>+, +>UAS-traF, and da>UAS-traF females reared on 2Y compared with genotype-matched females cultured on 1Y (p<0.0001 for all genotypes; two-way ANOVA followed by Tukey HSD test). The magnitude of the nutrient-dependent increase in adult weight was not significantly different between da>UAS-traF females and da>+ and +>UAS-traF controls (genotype:diet interaction p=0.5912; two-way ANOVA followed by Tukey HSD test). n = 6–8 groups of 10 flies. (F) Pupal volume was significantly higher in da>+, +>UAS-traF, and da>UAS-traF females reared on 2Y compared with genotype-matched females cultured on 1Y (p<0.0001 for all genotypes; two-way ANOVA followed by Tukey HSD test). n = 68–94 pupae. (G) Adult weight was significantly higher in both w1118 females, and in females with a knock-in transgene of the female isoform of tra (traF K-IN), when reared on 2Y compared with 1Y (p<0.0001 for both genotypes; two-way ANOVA followed by Tukey HSD test). In contrast, the nutrient-dependent increase in adult weight was abolished in tra mutant females (traKO) reared on 2Y compared with genotype-matched females cultured on 1Y (p=0.864; two-way ANOVA followed by Tukey HSD test). Importantly, the magnitude of the nutrient-dependent increase in adult weight was significantly lower in traKO females, which lack a functional Tra protein, than in w1118 and traF K-IN females (genotype:diet interaction p<0.0001; two-way ANOVA followed by Tukey HSD test). n = 10–16 groups of 10 flies. (H) Adult weight was significantly higher in r4-GAL4 control females with traF K-IN, when reared on 2Y compared with 1Y ((p<0.0001 [r4,Df(3L)st-j7/traF K-IN]); two-way ANOVA followed by Tukey HSD test). In contrast, the nutrient-dependent increase in adult weight was abolished upon fat body knockdown of sun in a traF K-IN female ((p=0.9999 [UAS-sun-RNAi/+;r4,Df(3L)st-j7/traF K-IN]); two-way ANOVA followed by Tukey HSD test). Adult weight was not different in tra mutant r4-GAL4 females (r4,Df(3L)st-j7/traKO) reared on 2Y compared with genotype-matched females cultured on 1Y (p=0.9550; two-way ANOVA followed by Tukey HSD test). Importantly, adult weight was not further reduced in 1Y with fat body knockdown of sun in a tra mutant female ((UAS-sun-RNAi/+;r4,Df(3L)st-j7/traKO) (p=0.99 [UAS-sun-RNAi/+;r4,Df(3L)st-j7/traF K-IN v UAS-sun-RNAi/+;r4,Df(3L)st-j7/traKO]); two-way ANOVA followed by Tukey HSD test). n = 9–12 groups of 10 flies. For body size plasticity graphs, filled circles indicate mean body size, and dashed lines indicate 95% confidence interval. * indicates p<0.05, ** indicates p<0.01, *** indicates p<0.001, **** indicates p<0.0001; error bars indicate SEM.
Figure 5 with 2 supplements
Sex determination gene transformer (tra) requires transcriptional coactivator spargel (srl) for increased nutrient-dependent body size plasticity in females.
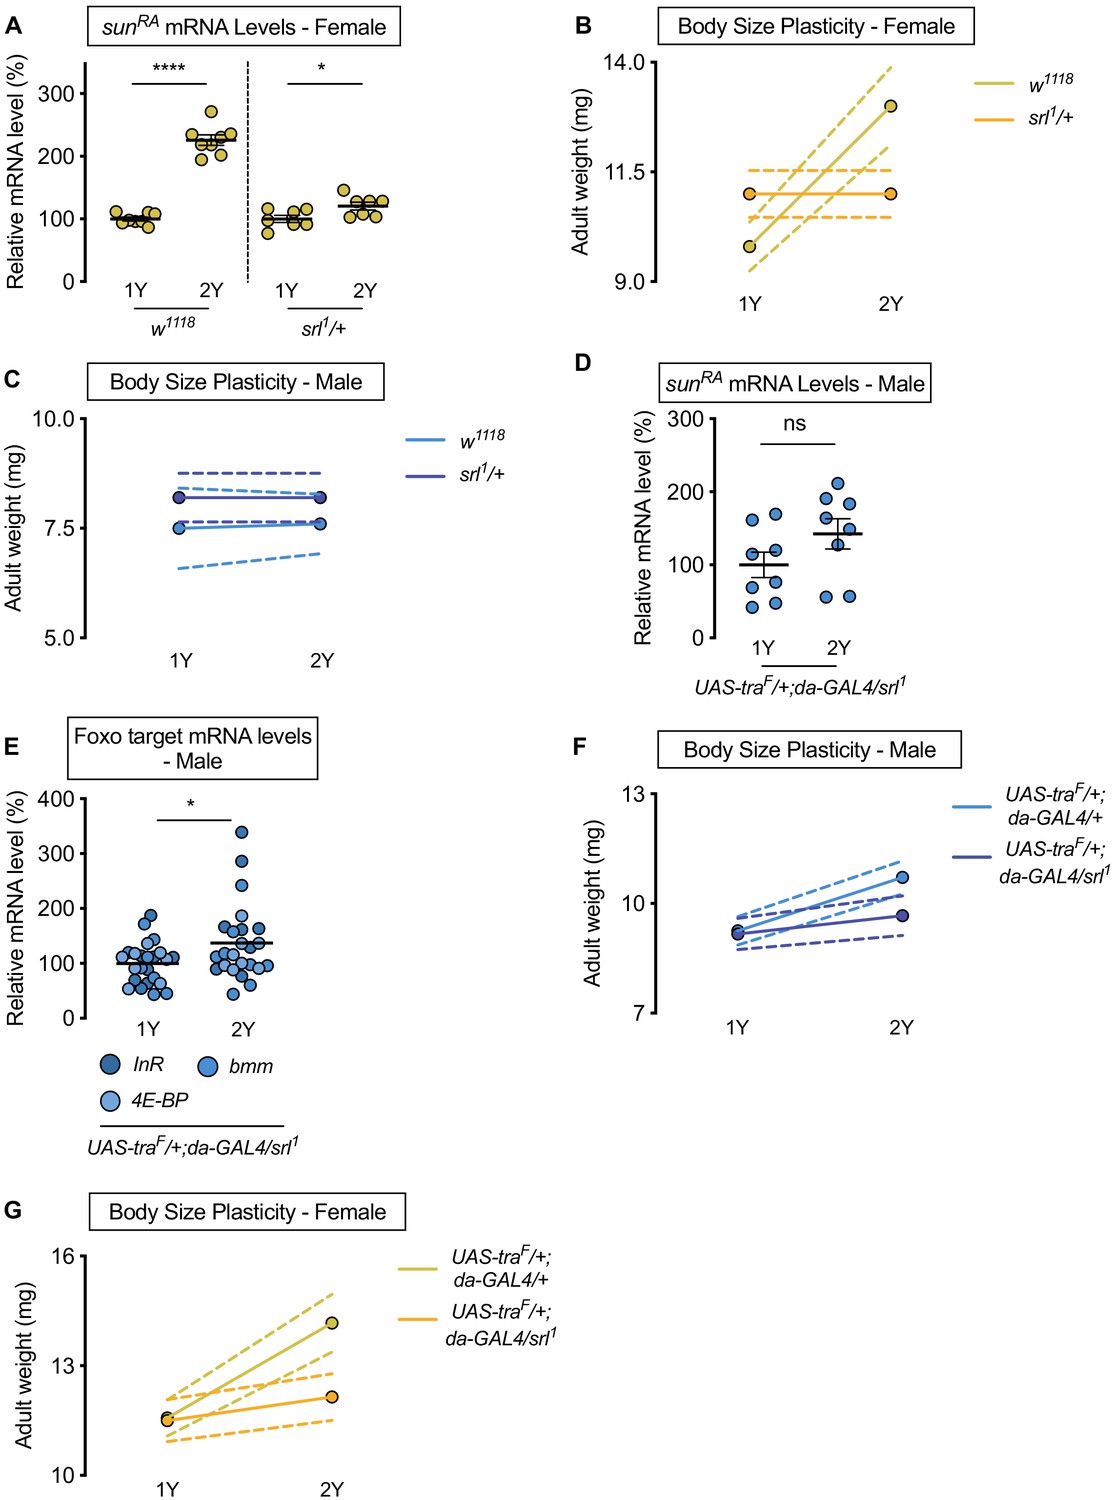
(A) In control w1118 females and females with heterozygous loss of srl (srl1/+), mRNA levels of sunRA were significantly higher in larvae cultured on a protein-rich diet (2Y) compared with larvae raised on a diet with half the protein (1Y) (p<0.0001 and p=0.0301; Student’s t test); however, there was a significant genotype:diet interaction indicating that the protein-dependent upregulation of sunRA was blunted in srl1/+ females (p<0.0001; two-way ANOVA followed by Tukey HSD test). n = 7–8 biological replicates. (B) Adult weight was significantly higher in w1118 females raised on 2Y compared with females reared on 1Y (p<0.0001; two-way ANOVA followed by Tukey HSD test); however, there was no significant difference in adult weight between srl1/+ females cultured on 2Y compared with genotype-matched females raised on 1Y (p>0.9999; two-way ANOVA followed by Tukey HSD test). n = 5–7 groups of 10 flies. (C) Adult weight was not significantly higher in either w1118 control or srl1/+ mutant males in flies raised on 2Y compared with males reared on 1Y (p=0.9906 and p>0.9999, respectively; two-way ANOVA followed by Tukey HSD test). n = 4–5 groups of 10 flies. (D) mRNA levels of sunRA were not significantly different in da>traF males with heterozygous loss of srl (UAS-traF/+;da-GAL4/srl1) cultured on 1Y compared to genotype matched males cultured on 2Y (p=0.1405; Student’s t test). n = 8 biological replicates. (E) In control da>traF males with heterozygous loss of srl, mRNA levels of Foxo targets (insulin receptor (InR), brummer (bmm), and eukaryotic initiation factor 4E-binding protein (4E-BP)), were significantly higher in larvae cultured on 2Y compared with larvae raised on 1Y (p=0.0266; Student’s t test). n = 8 biological replicates. (F) Adult weight was higher in da>UAS-traF males raised on 2Y compared with da>UAS-traF males reared on 1Y (p<0.0001; two-way ANOVA followed by Tukey HSD test). In contrast, the nutrient-dependent increase in adult weight was abolished in da>UAS-traF males heterozygous for srl1 (p=0.2811; two-way ANOVA followed by Tukey HSD test). n = 6–8 groups of 10 flies. (G) Adult weight was higher in da>UAS-traF females raised on 2Y compared with da>UAS-traF females reared on 1Y (p<0.0001; two-way ANOVA followed by Tukey HSD test). In contrast, the nutrient-dependent increase in adult weight was absent in da>UAS-traF females heterozygous for srl1 (p=0.2927; two-way ANOVA followed by Tukey HSD test). n = 6–7 groups of 10 flies. For all body size plasticity graphs, filled circles indicate mean body size, and dashed lines indicate 95% confidence interval. * indicates p<0.05, **** indicates p<0.0001; ns indicates not significant; error bars indicate SEM.
Figure 5—figure supplement 1
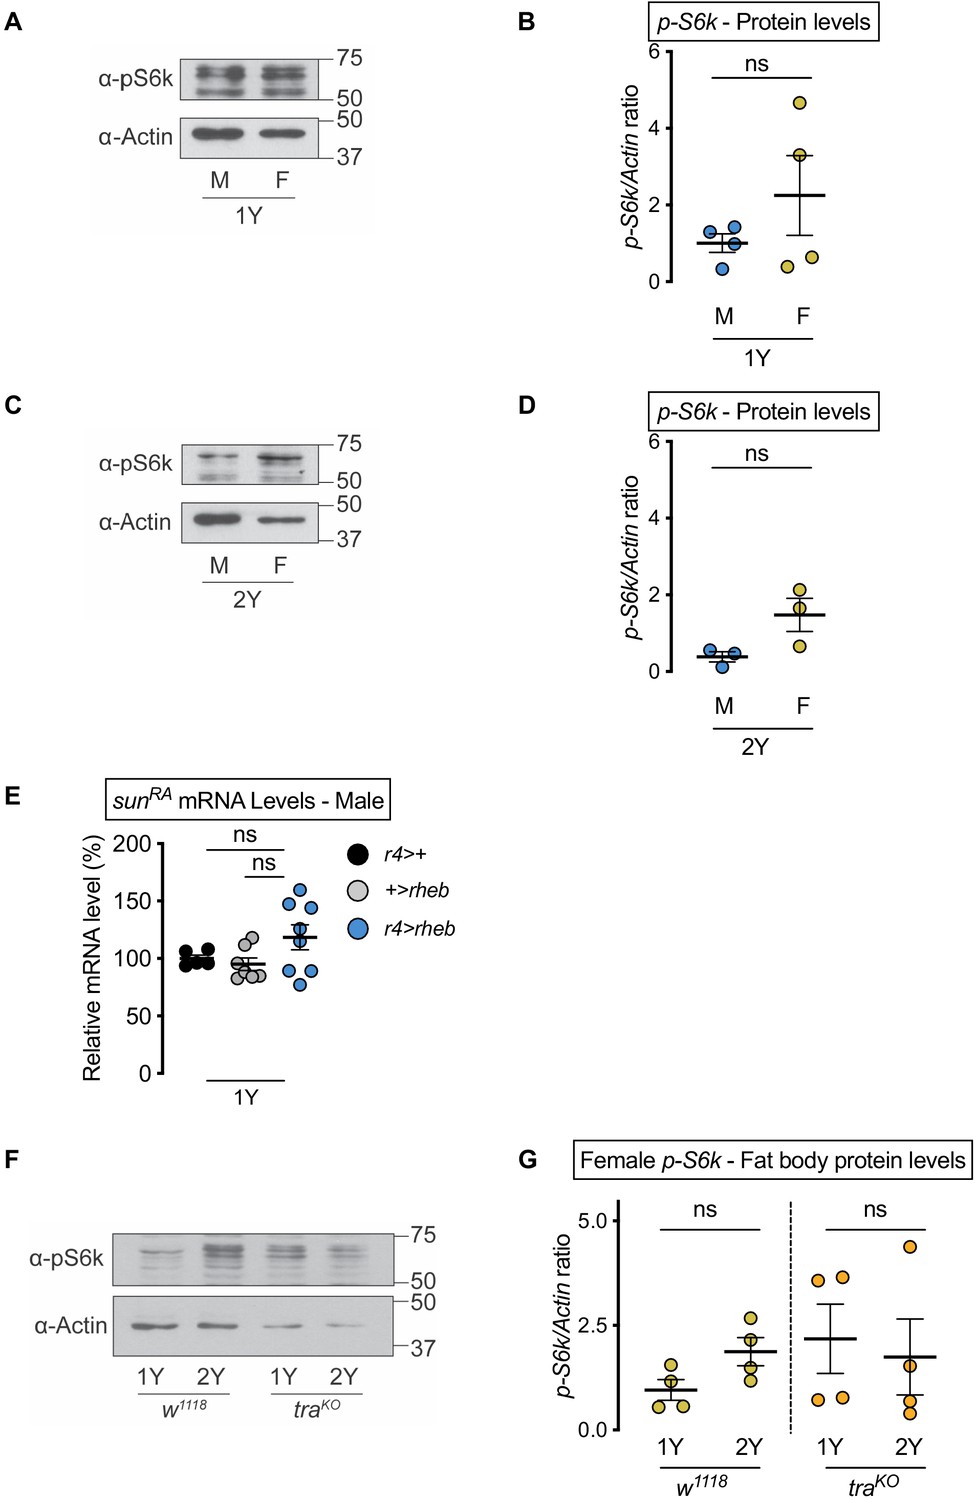
No nutrient- or transformer-dependent sex difference in fat body Target-of-rapamycin (TOR) signaling activity.
(A) Levels of phosphorylated S6 kinase (pS6k) were quantified in dissected fat bodies from w1118 male and female larvae cultured in 1Y. (B) pS6k levels were not different between males and females in 1Y (p=0.2896; Student’s t test). n = 4 biological replicates. (C) Levels of pS6k were quantified in dissected fat bodies from w1118 male and female larvae cultured in 2Y. (D) pS6k levels were not different between males and females in 2Y (p=0.0732; Student’s t test). n = 3 biological replicates. (E) mRNA levels of stunted (sunRA) were not significantly different in r4-GAL4>UAS-rheb males compared with r4-GAL4>+ and +>UAS-rheb control males (p=0.3229 and p=0.1252, respectively; one-way ANOVA followed by Tukey HSD test). n = 5–8 biological replicates. (F) Levels of pS6k were quantified in dissected fat bodies from female w1118 and female transformer (tra) mutant larvae cultured in 1Y and 2Y. (G) pS6k levels were not different between female w1118 and female traKO in either 1Y or 2Y (p=0.0702 and p=0.737, respectively; Student’s t test). n = 4 biological replicates. ns indicates not significant; error bars indicate SEM.
Figure 5—figure supplement 2
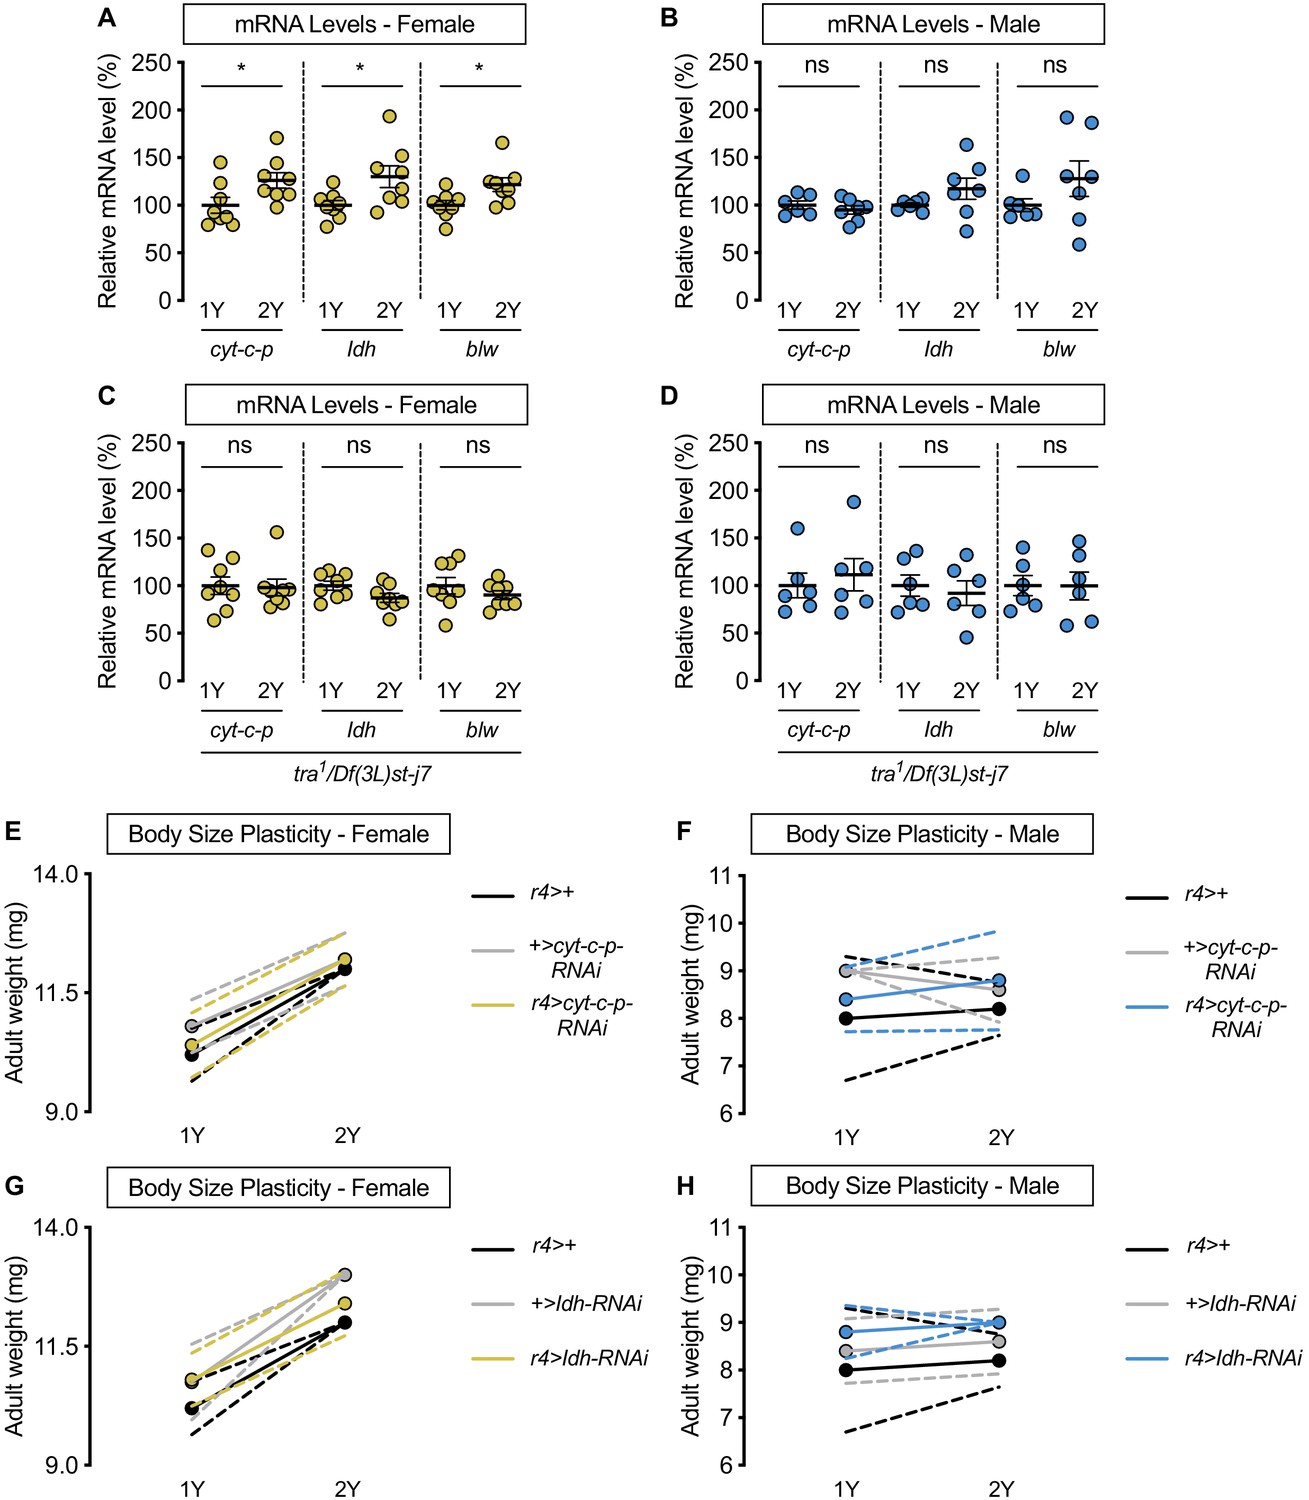
transformer (tra) is required for nutrient-dependent upregulation of spargel (srl) target expression in females, but not all srl targets are not required for increased female nutrient-dependent body size plasticity.
(A) In control w1118 females, mRNA levels of the srl targets Cytochrome c proximal (cyt-c-p), Isocitrate dehydrogenase (Idh), and bellwether (blw) were significantly higher in larvae raised on a protein-rich diet (2Y) compared with larvae raised on a diet containing half the protein (1Y) (p=0.0409, 0.0307, and 0.0274, respectively; Student’s t test). n = 8 biological replicates. (B) In control w1118 males, mRNA levels of cyt-c-p, Idh, and blw were not significantly different in larvae raised on 2Y compared with larvae raised on 1Y (p=0.4316, 0.1906, and 0.2146, respectively; Student’s t test). n = 6–7 biological replicates. (C) In tra mutant females, mRNA levels of cyt-c-p, Idh, and blw were not significantly different in larvae raised on 2Y compared with larvae raised on 1Y (p=0.8865, 0.0731, and 0.334, respectively; Student’s t test). n = 8 biological replicates. (D) In tra mutant males, mRNA levels of cyt-c-p, Idh, and blw were not significantly different in larvae raised on 2Y compared with larvae raised on 1Y (p=0.6078, 0.6453, and 0.9819, respectively; Student’s t test). n = 6 biological replicates. (E) Adult weight was significantly higher in r4>+, +>cyt-c-p-RNAi, and r4>cyt-c-p-RNAi females reared on 2Y compared with genotype-matched females cultured on 1Y (p<0.0001 [r4>+], p=0.0004 [+>cyt-c-p-RNAi], and p<0.0001 [r4>cyt-c-p-RNAi], respectively; two-way ANOVA followed by Tukey HSD test). The magnitude of the nutrient-dependent increase in adult weight was not significantly different (genotype:diet interaction p=0.4936; two-way ANOVA followed by Tukey HSD test). n = 5 groups of 10 flies. (F) Adult weight was not significantly different in r4>+, +>cyt-c-p-RNAi, and r4>cyt-c-p-RNAi males reared on 2Y compared with genotype-matched males cultured on 1Y (p=0.9954 [r4>+], p=0.8873 [+>cyt-c-p-RNAi], and p=0.8873 [r4>cyt-c-p-RNAi], respectively; two-way ANOVA followed by Tukey HSD test). n = 4–5 groups of 10 flies. (G) Adult weight was significantly higher in r4>+, +>Idh-RNAi, and r4>Idh-RNAi females reared on 2Y compared with genotype-matched females cultured on 1Y (p<0.0001 for all comparisons; two-way ANOVA followed by Tukey HSD test). The magnitude of the nutrient-dependent increase in adult weight was not significantly different (genotype:diet interaction p=0.2104; two-way ANOVA followed by Tukey HSD test). n = 4–5 groups of 10 flies. (H) Adult weight was not significantly different in r4>+, +>Idh-RNAi, and r4>Idh-RNAi males reared on 2Y compared with genotype-matched males cultured on 1Y (p=0.9912 [r4>+], p=0.9885 [+>Idh-RNAi], and p=0.9885 [r4>Idh-RNAi], respectively; two-way ANOVA followed by Tukey HSD test). n = 4–5 groups of 10 flies. For body size plasticity graphs, filled circles indicate mean adult weight, and dashed lines indicate 95% confidence interval. * indicates p<0.05; ns indicates not significant; error bars indicate SEM.
Figure 6
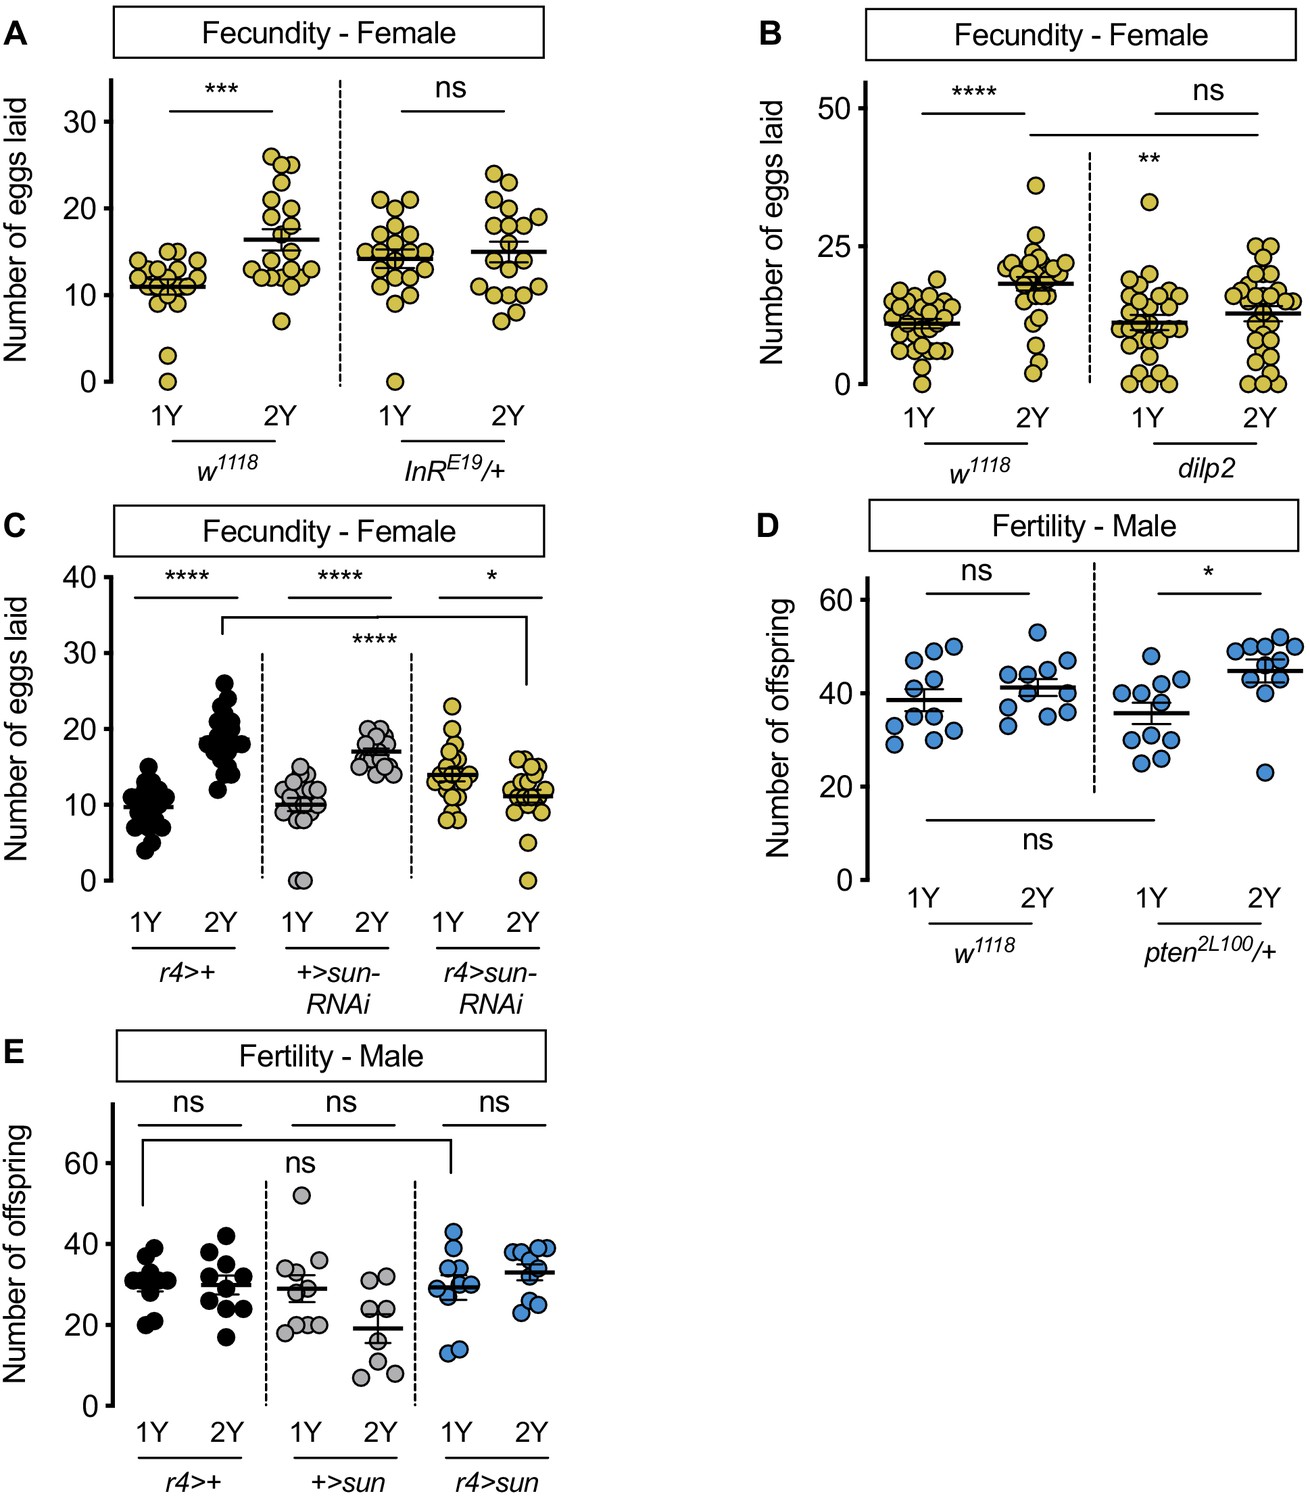
Increased nutrient-dependent body size plasticity in females promotes fertility.
(A) In control w1118 females, there was a significant increase in the number of eggs laid by females raised on a protein-rich diet (2Y) compared with females reared on a diet with half the protein (1Y) (p=0.0009; Student’s t test); however, there was no significant difference in the number of eggs laid between InRE19/+ females cultured on 2Y compared with genotype-matched females raised on 1Y (p=0.617; Student’s t test). n = 19–20 biological replicates. (B) In control w1118 females, there was a significant increase in the number of eggs laid by females raised on 2Y compared with females cultured on 1Y (p<0.0001; Student’s t test); however, there was no significant difference in the number of eggs laid between dilp2 mutant females cultured on 2Y compared with females raised on 1Y (p=0.4105; Student’s t test). n = 28–30 biological replicates. (C) In control r4>+ and +>UAS-sun-RNAi females, there was a significant increase in the number of eggs laid by females raised on 2Y compared with control females cultured on 1Y (p<0.0001 for both genotypes; Student’s t test). In r4>UAS-sun-RNAi females, the number of eggs laid by females cultured on 2Y was lower than females raised on 1Y (p=0.0243; Student’s t test). n = 20 biological replicates. (D) In control w1118 males, there was no significant difference in the number of offspring produced between a 1Y and 2Y diet (p=0.3662; Student’s t test). There was also no significant difference in the number of offspring produced between control w1118 males and males heterozygous for a loss-of-function allele of phosphatase and tensin homolog (pten; genotype pten2L100/+) raised on 1Y (p=0.4003; Student’s t test). Unlike control males, pten2L100/+ males reared on 2Y produced significantly more offspring than genotype-matched males raised on 1Y (p=0.0137; Student’s t test). n = 11 biological replicates. (E) In control r4>+ and +>UAS-sun and r4>UAS-sun males, there was no significant effect on the number of offspring produced between a 1Y and 2Y diet (p=0.9222, 0.0595, and 0.32 respectively; Student’s t test). There was also no significant difference in the number of offspring produced between control r4>+, +>UAS-sun males and r4>UAS-sun males raised on 1Y (p=0.9723 and p=0.9969 respectively; one-way ANOVA followed by Tukey HSD test). n = 8–10 groups of 10 flies. * indicates p<0.05, ** indicates p<0.01, *** indicates p<0.001, **** indicates p<0.0001; ns indicates not significant; error bars indicate SEM.
Tables
Key resources table
| Reagent type (species) or resource | Designation | Source or reference | Identifiers | Additional information |
|---|---|---|---|---|
| Genetic reagent (Drosophila melanogaster) | Canton-S | Bloomington Drosophila stock center | BDSC: 64349 | |
| Genetic reagent (Drosophila melanogaster) | w1118 | Bloomington Drosophila stock center | BDSC: 3605 | |
| Genetic reagent (Drosophila melanogaster) | tra1 | Bloomington Drosophila stock center | BDSC: 675 | |
| Genetic reagent (Drosophila melanogaster) | Df(3L)st-j7 | Bloomington Drosophila stock center | BDSC: 5416 | |
| Genetic reagent (Drosophila melanogaster) | srl1 | Bloomington Drosophila stock center | BDSC: 14965 | |
| Genetic reagent (Drosophila melanogaster) | InRE19 | Bloomington Drosophila stock center | BDSC: 9646 | |
| Genetic reagent (Drosophila melanogaster) | TRiP Control | Bloomington Drosophila stock center | BDSC: 36303 | |
| Genetic reagent (Drosophila melanogaster) | UAS-dilp2-RNAi | Bloomington Drosophila stock center | BDSC: 32475 | |
| Genetic reagent (Drosophila melanogaster) | UAS-upd2-RNAi | Bloomington Drosophila stock center | BDSC: 33949 | |
| Genetic reagent (Drosophila melanogaster) | UAS-traF | Bloomington Drosophila stock center | BDSC: 4590 | |
| Genetic reagent (Drosophila melanogaster) | UAS-rheb | Bloomington Drosophila stock center | BDSC: 9688 | |
| Genetic reagent (Drosophila melanogaster) | UAS-cyt-c-p-RNAi | Bloomington Drosophila stock center | BDSC: 64898 | |
| Genetic reagent (Drosophila melanogaster) | UAS-Idh-RNAi | Bloomington Drosophila stock center | BDSC: 41708 | |
| Genetic reagent (Drosophila melanogaster) | mth1 | Bloomington Drosophila stock center | BDSC: 27896 | |
| Genetic reagent (Drosophila melanogaster) | y1,w1 | Bloomington Drosophila stock center | BDSC: 1495 | |
| Genetic reagent (Drosophila melanogaster) | UAS-sun-RNAi | Vienna Drosophila resource center | VDRC: GD23685 | |
| Genetic reagent (Drosophila melanogaster) | UAS-Gbp1-RNAi | Vienna Drosophila resource center | VDRC: KK108755 | |
| Genetic reagent (Drosophila melanogaster) | UAS-Gbp2-RNAi | Vienna Drosophila resource center | VDRC: GD16696 | |
| Genetic reagent (Drosophila melanogaster) | UAS-CCHa2-RNAi | Vienna Drosophila resource center | VDRC: KK102257 | |
| Genetic reagent (Drosophila melanogaster) | UAS-mth-RNAi | Vienna Drosophila resource center | VDRC: KK106399 | |
| Genetic reagent (Drosophila melanogaster) | dilp2 | Grönke et al., 2010 | ||
| Genetic reagent (Drosophila melanogaster) | pten2L100 | Oldham et al., 2002 | ||
| Genetic reagent (Drosophila melanogaster) | UAS-sun | Delanoue et al., 2016 | ||
| Genetic reagent (Drosophila melanogaster) | traKO | Hudry et al., 2016 | ||
| Genetic reagent (Drosophila melanogaster) | traF K-IN | Hudry et al., 2019 | ||
| Genetic reagent (Drosophila melanogaster) | y,w;;ilp2HF | Park et al., 2014 | ||
| Genetic reagent (Drosophila melanogaster) | tGPH (GFP-PH) | Britton et al., 2002 | ||
| Genetic reagent (Drosophila melanogaster) | da-GAL4 | Bloomington Drosophila stock center | BDSC: 55849 | Note. Discontinued stock, equivalent stocks available |
| Genetic reagent (Drosophila melanogaster) | r4-GAL4 | Bloomington Drosophila stock center | BDSC: 33832 | |
| Genetic reagent (Drosophila melanogaster) | cg-GAL4 | Bloomington Drosophila stock center | BDSC: 7011 | |
| Genetic reagent (Drosophila melanogaster) | elav-GAL4 | Bloomington Drosophila stock center | BDSC: 458 | |
| Genetic reagent (Drosophila melanogaster) | dilp2-GAL4 | Rulifson et al., 2002 | ||
| Antibody | Anti-sun guinea pig polyclonal | Delanoue et al., 2016 | (1:50) | |
| Antibody | Anti-Cv-d guinea pig polyclonal | Palm et al., 2012 | (1:1000) | |
| Antibody | Anti-pS6k rabbit polyclonal | Cell Signaling: 9209 | (1:1000) | |
| Antibody | Anti-Actin mouse monoclonal | Santa Cruz: 8432 | (1:1000) |
Additional files
-
Supplementary file 1
Complete list of p-values for all experiments in this study.
- https://cdn.elifesciences.org/articles/58341/elife-58341-supp1-v2.xlsx
-
Supplementary file 2
Raw data values for all experiments in this study.
- https://cdn.elifesciences.org/articles/58341/elife-58341-supp2-v2.xlsx
-
Supplementary file 3
Details of 1S and 2Y calorie diets used in this study.
- https://cdn.elifesciences.org/articles/58341/elife-58341-supp3-v2.xlsx
-
Supplementary file 4
Complete list of Drosophila melanogaster genotypes used in this study.
- https://cdn.elifesciences.org/articles/58341/elife-58341-supp4-v2.xlsx
-
Supplementary file 5
Complete list of primers used in this study.
- https://cdn.elifesciences.org/articles/58341/elife-58341-supp5-v2.xlsx
-
Transparent reporting form
- https://cdn.elifesciences.org/articles/58341/elife-58341-transrepform-v2.docx
Download links
A two-part list of links to download the article, or parts of the article, in various formats.
Downloads (link to download the article as PDF)
Open citations (links to open the citations from this article in various online reference manager services)
Cite this article (links to download the citations from this article in formats compatible with various reference manager tools)
Female-biased upregulation of insulin pathway activity mediates the sex difference in Drosophila body size plasticity
eLife 10:e58341.
https://doi.org/10.7554/eLife.58341


