Synaptotagmin-1 is the Ca2+ sensor for fast striatal dopamine release
- Department of Neurobiology, Harvard Medical School, United States
Figures
Figure 1 with 4 supplements
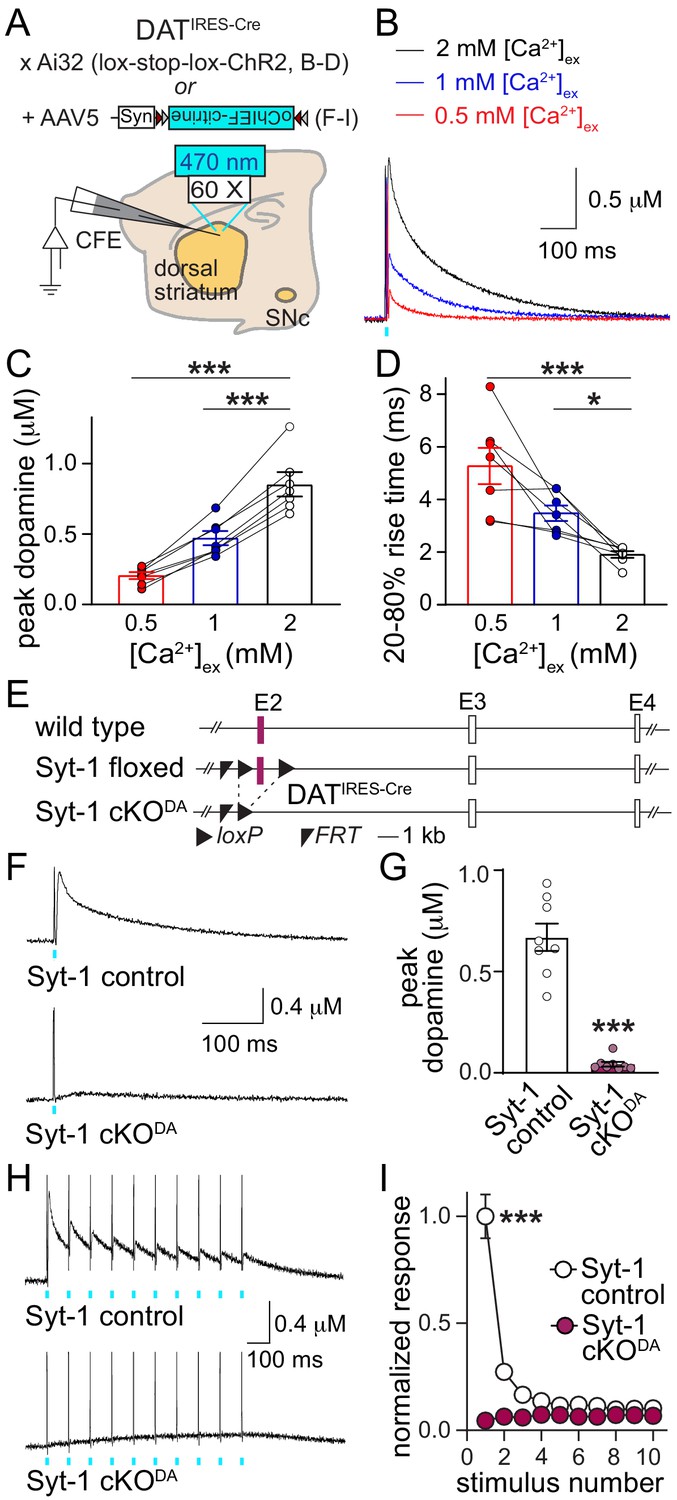
Synaptotagmin-1 is required for synchronous dopamine release.
(A) Schematic of the experimental setup for Cre-dependent expression of channelrhodopsin variants using mutant mice (B–D) and AAVs (F–I). (B–D) Sample traces (B, average of four sweeps), and quantification of peak amplitudes (C) and 20–80% rise times (D) of dopamine release evoked by optogenetic activation (1 ms light pulse at 470 nm) at different [Ca2+]ex, n = 7 slices/4 mice at each [Ca2+]ex. (E) Schematic of the generation of dopamine neuron specific Synaptotagmin-1 knockout (Syt1-cKODA) mice. (F, G) Sample traces (F, average of four sweeps) and quantification of peak amplitudes (G) of dopamine release evoked by a 1 ms light pulse, Syt-1 control n = 8 slices/4 mice, Syt-1 cKODAn = 8/4. (H, I) Sample traces (H, average of four sweeps) and quantification (I) of dopamine release evoked by ten 1 ms light pulses at 10 Hz. Amplitudes are normalized to the average first amplitude in Syt-1 control, Syt-1 control n = 8/4, Syt-1 cKODA n = 8/4. All data are shown as mean ± SEM, *p<0.05, ***p<0.001. Recordings are performed in 2 mM [Ca2+]ex unless noted otherwise, statistical significance was determined by one-way ANOVA followed by Dunnett’s multiple comparisons test in C and D, by Mann-Whitney test in G, and by two-way ANOVA followed by Sidak’s multiple comparisons test in I (*** for genotype, stimulus number and interaction, post-tests: *** for stimuli 1 and 2, ** for stimulus three and p>0.05 for stimuli 4–10).
Figure 1—figure supplement 1

Carbon fiber recordings.
(A) Sample traces and summary plot of the calibration of a carbon fiber electrode (CFE) with different concentrations of dopamine applied to the electrode by a puff pipette. The standard curve generated by linear regression confirms a linear relationship. Calibrations were done for each electrode, each electrode was only used for one day, and on each day of recording a control and test littermate animal were compared with the same electrode. (B) Sample traces of CFE currents in response to 20 µM dopamine puffs at different [Ca2+]ex. The sensitivity of the CFE is not dependent on changes in [Ca2+]ex. (C, D) Sample traces (average of four sweeps) and quantification of peak dopamine release evoked by optogenetic stimulation performed as in Figure 1A–D, but at 2 mM vs. 4 mM [Ca2+]ex, n = 7 slices/3 mice. The modest enhancement of peak dopamine detected in response to increasing [Ca2+]ex from 2 mM to 4 mM is likely due to the high initial release probability of dopamine secretion at 2 mM [Ca2+]ex, which we described before (Liu et al., 2018). Data in D are shown as mean ± SEM, *p<0.05, statistical significance was determined by paired Student’s t-test in D.
Figure 1—figure supplement 2
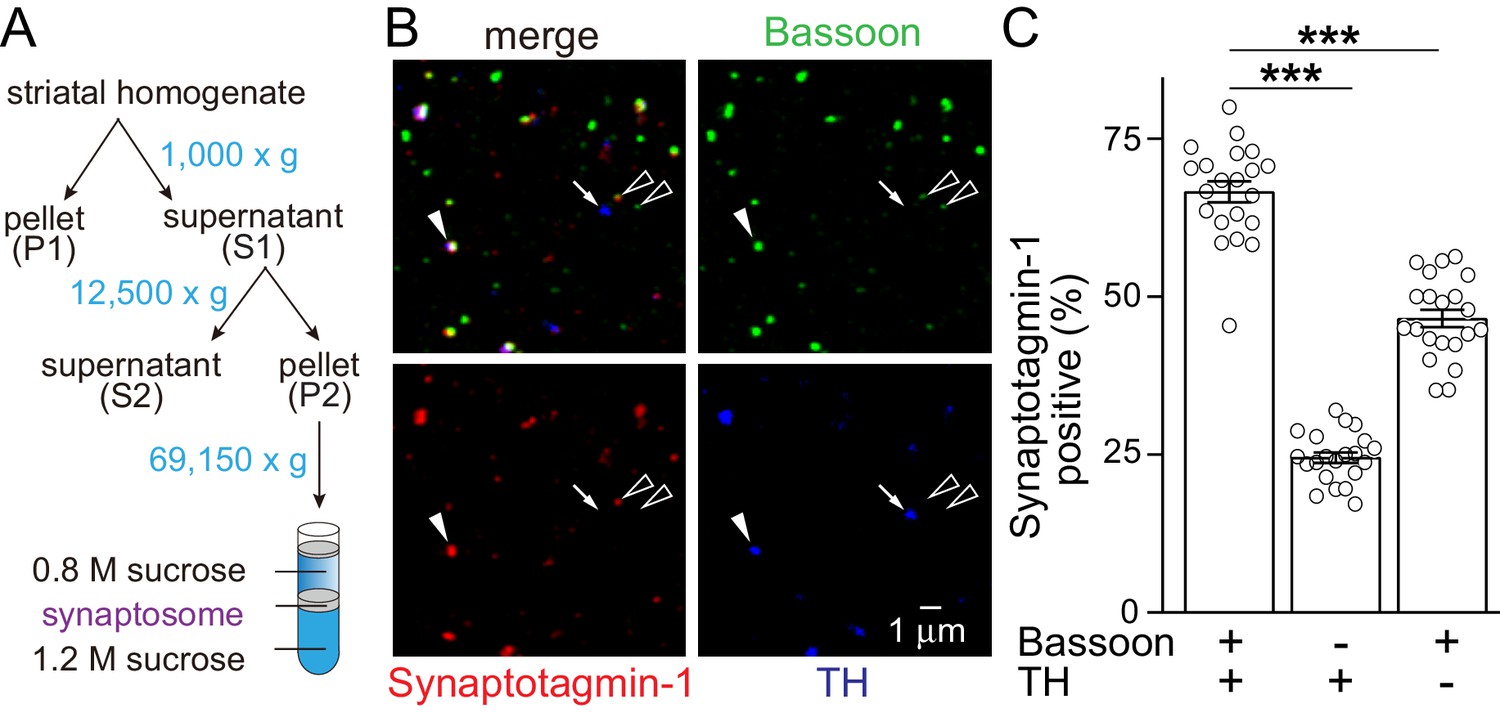
Synaptotagmin-1 is present in TH-positive striatal synaptosomes.
(A) Schematic of the striatal synaptosome preparation. (B, C) Sample confocal images (B) and quantification (C) of striatal synaptosomes stained for Synaptotagmin-1, the release site marker Bassoon and the dopamine neuron marker TH. Consistent with experiments from cultured midbrain neurons (Mendez et al., 2011), Syt-1 is often present in synaptosomes that are positive for Bassoon and TH (solid arrowhead). It is infrequently present in TH-positive particles that do not contain Bassoon (arrow) and is sometimes present in TH negative synaptosomes that contain Bassoon and are from non-dopaminergic axons (hollow arrowheads, striatal synapses rely in part on Syt-9 instead of Syt-1 [Xu et al., 2007]), n = 21 images/2 mice, each circle represents the average result of an image containing 300–600 synaptosomes. Data are mean ± SEM, ***p<0.001, statistical significance was determined by one-way ANOVA followed by Dunnett’s multiple comparisons test.
Figure 1—figure supplement 3

Action potential firing of dopamine axons persists upon Synaptotagmin-1 knockout.
(A) Schematic of the extracellular recording. Dopamine axonal firing was induced optogenetically in the dorsal striatum and field potentials were recorded with an extracellular recording pipette filled with ACSF. Recordings were performed as described in the Materials and methods, and it was previously established that these potentials reflect action potential firing of dopamine axons (Liu et al., 2018). (B–E) Sample traces (B, C, average of 100 sweeps) and analyses (D, E) of extracellular potentials recorded during a 10 Hz train in Syt-1 control and Syt-1 cKODA slices. The response to the 1st stimulus in B is magnified in C and shown as before (black) and after (grey) application of the sodium channel blocker TTX (1 µM). Quantification of the amplitude before and after TTX is shown in D, quantification of all responses in the 10 stimulus 10 Hz train normalized to the average first amplitude in Syt-1 control is shown in E, Syt-1 control n = 6 slices/3 mice, Syt-1 cKODA n = 6/3 in D and E. (F, G) Same experiment as in B and E but at a stimulation frequency of 40 Hz, the first 10 of a total of 40 stimuli are shown. The higher stimulation frequency leads to action potential failures and depression of the normalized amplitudes after the first stimulus, Syt-1 control n = 5/4, Syt-1 cKODA n = 4/4. Data are mean ± SEM, **p<0.01, statistical significance was determined by one-way ANOVA followed by Sidak’s multiple comparisons test in D, and two-way ANOVA followed by Sidak’s multiple comparisons test in E (ns, p>0.05 for genotype, stimulus number and interaction) and G (***p<0.001 for stimulus number, p>0.05 for genotype and interaction).
Figure 1—figure supplement 4
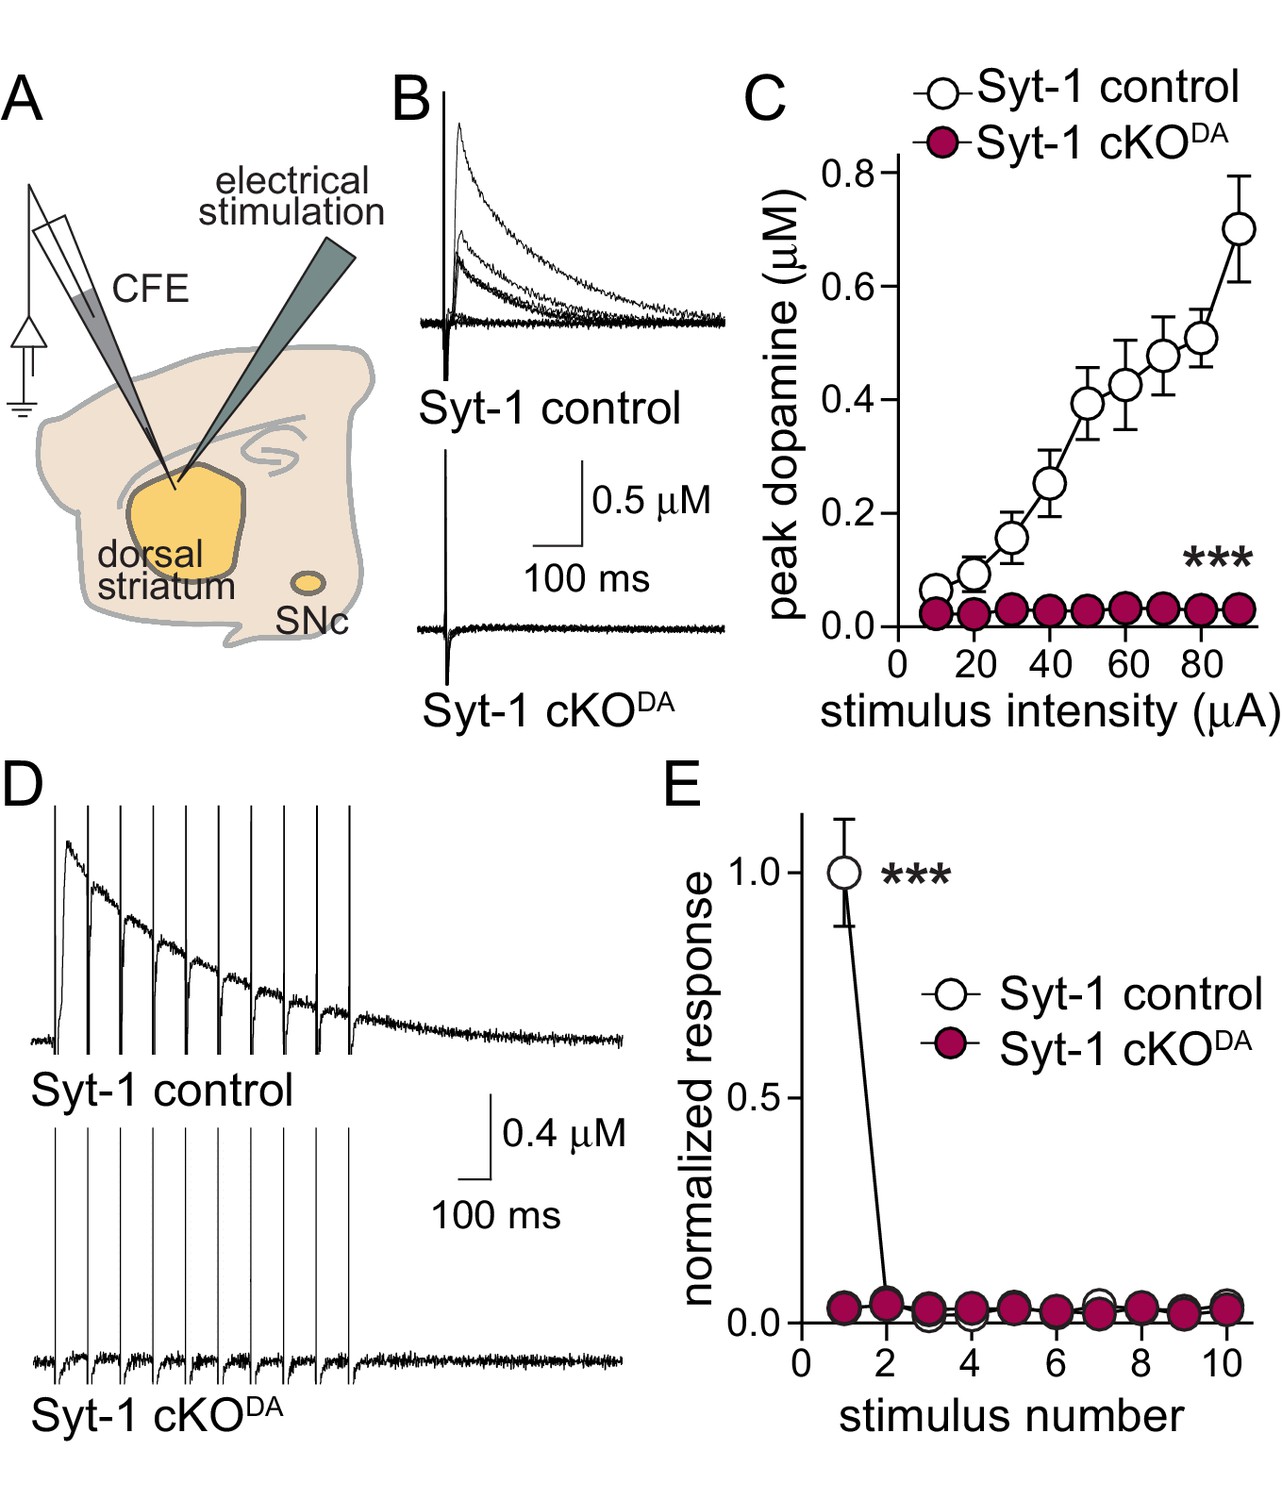
Release evoked by electrical stimulation is abolished upon Synaptotagmin-1 knockout.
(A) Schematic of the experiment. Electrical stimulation activates dopamine fibers and cholinergic interneurons, and cholinergic innervation of dopamine axons accounts for as much as ~90% of the extracellular dopamine detected upon electrical stimulation and leads to enhanced depression of dopamine release during stimulus trains (Liu et al., 2018; Threlfell et al., 2012; Zhou et al., 2001). (B) Sample traces (single sweep) and (C) quantification of peak dopamine release in Syt-1 control and Syt-1 cKODAslices evoked by single electrical stimuli at increasing intensities (10–90 µA), Syt-1 control n = 7 slices/3 mice, Syt-1 cKODA n = 7/3. (D, E) Sample traces (D, average of four sweeps) and (E) all responses normalized to the average first amplitude in Syt-1 control, evoked by 10 Hz 10-stimulus train using electrical stimulation. Syt-1 control n = 3/3 mice, Syt-1 cKODA n = 5/3. Data are mean ± SEM, ***p<0.001, statistical significance in C and E were determined by two-way ANOVA (C, E: *** for genotype, stimulus number and interaction) followed by Sidak’s multiple comparisons test (C: *** each for 40–90 μA; E: *** for first stimulus).
Figure 2
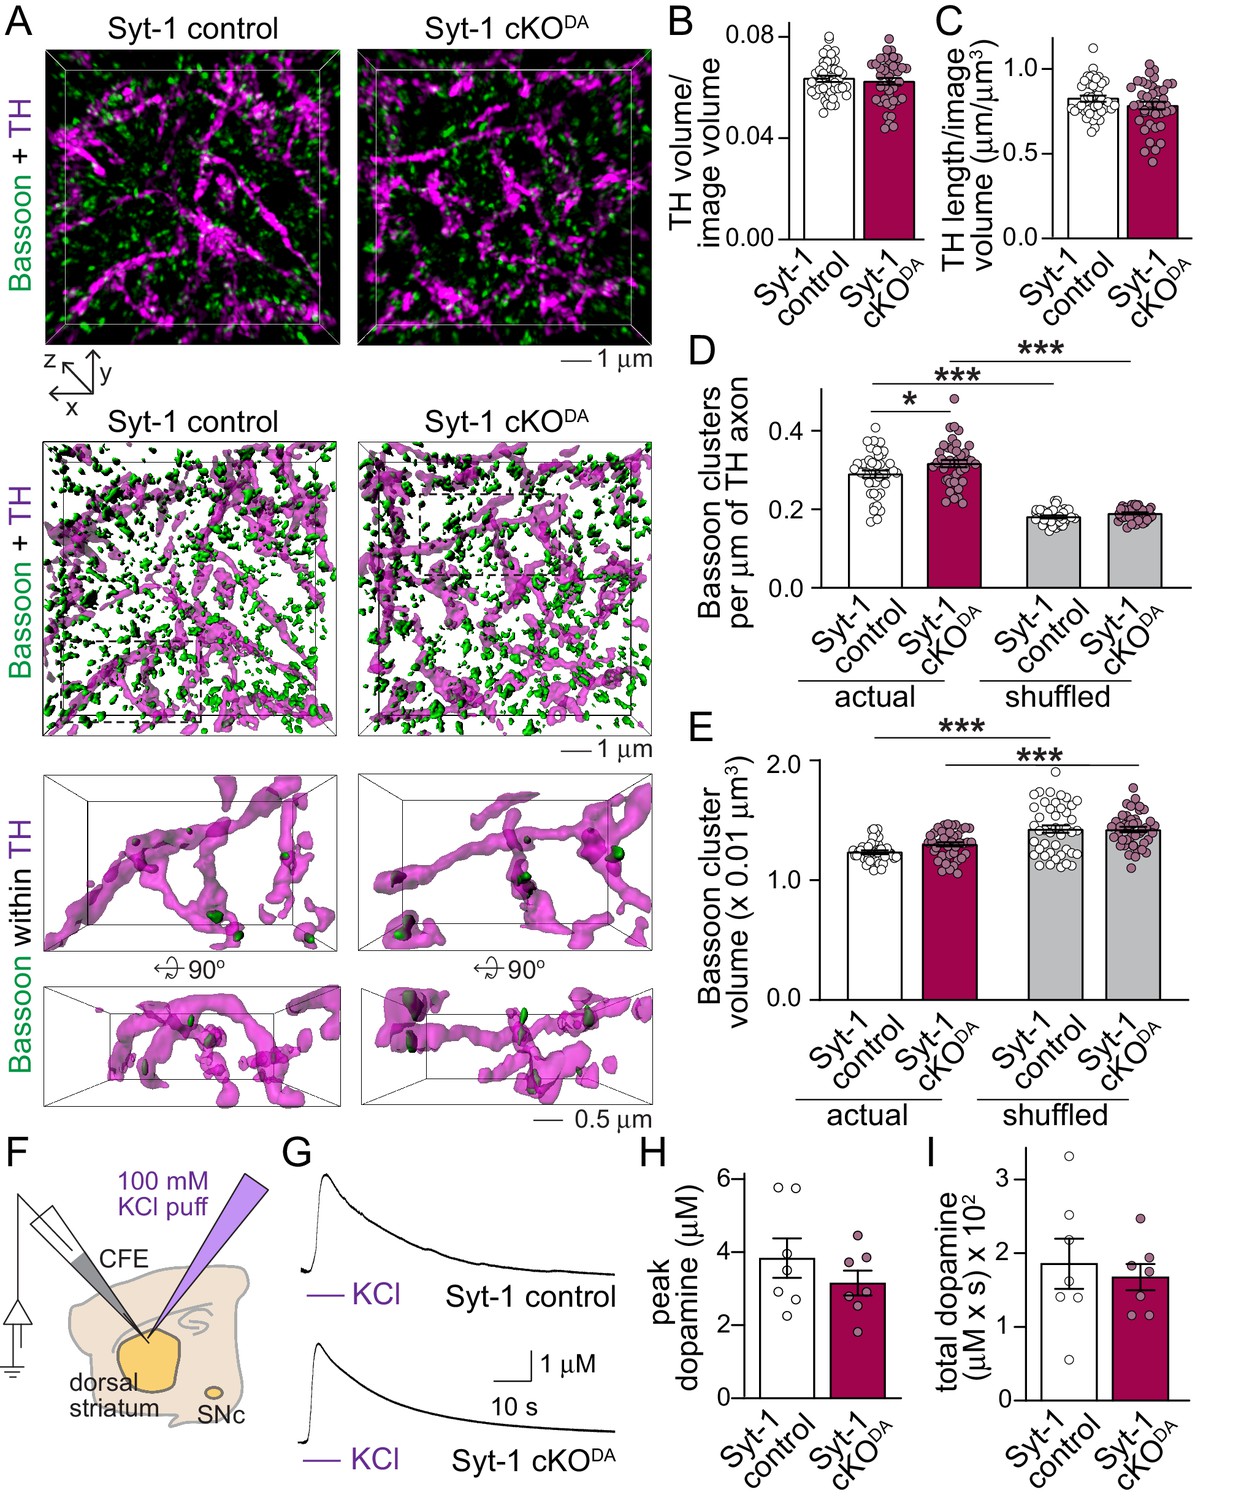
Dopamine axon structure and depolarization induced dopamine release are intact after ablation of Synaptotagmin-1.
(A) Sample 3D-SIM images of striatal brain sections of Syt-1 control and Syt-1 cKODA mice stained for the dopamine axon marker TH and the release site marker Bassoon. Volume rendered reconstructions (10 × 10 × 2 µm3, top, all Bassoon is shown), surface rendering of the same volumes (middle, all Bassoon is shown), and zoomed-in volumes (bottom, 5 × 3 × 2 µm3 in front view and rotated by +90° along the x-axis, only including Bassoon clusters with >40% volume overlap with TH) are shown. (B–E) Quantification of the fraction of the image volume covered by TH (B), TH axon length (C), Bassoon cluster densities (D) and Bassoon cluster volumes (E). For the shuffled controls in D and E, each Bassoon object was randomly relocated 1000 times within a volume of 1 × 1 × 1 µm3, and the actual Bassoon densities and volumes were compared to the average of the shuffled controls. Syt-1 control: n = 43 images/5 slices/3 mice, Syt-1 cKODA n = 41/5/3. (F–I) Schematic of the experiment (F), sample traces (G) and analyses of peak amplitudes (H) and total dopamine (I, quantified as area under the curve) of dopamine release measured in response to puffing of 100 mM KCl onto the recording area. Syt-1 control: n = 7 slices/3 mice, Syt-1 cKODA n = 7/3. All data are shown as mean ± SEM, *p<0.05, ***p<0.001, statistical significance was determined by unpaired t tests in B and C, one-way ANOVA followed by Sidak’s multiple comparisons test in D and E, and Mann-Whitney tests in H and I .
Figure 3
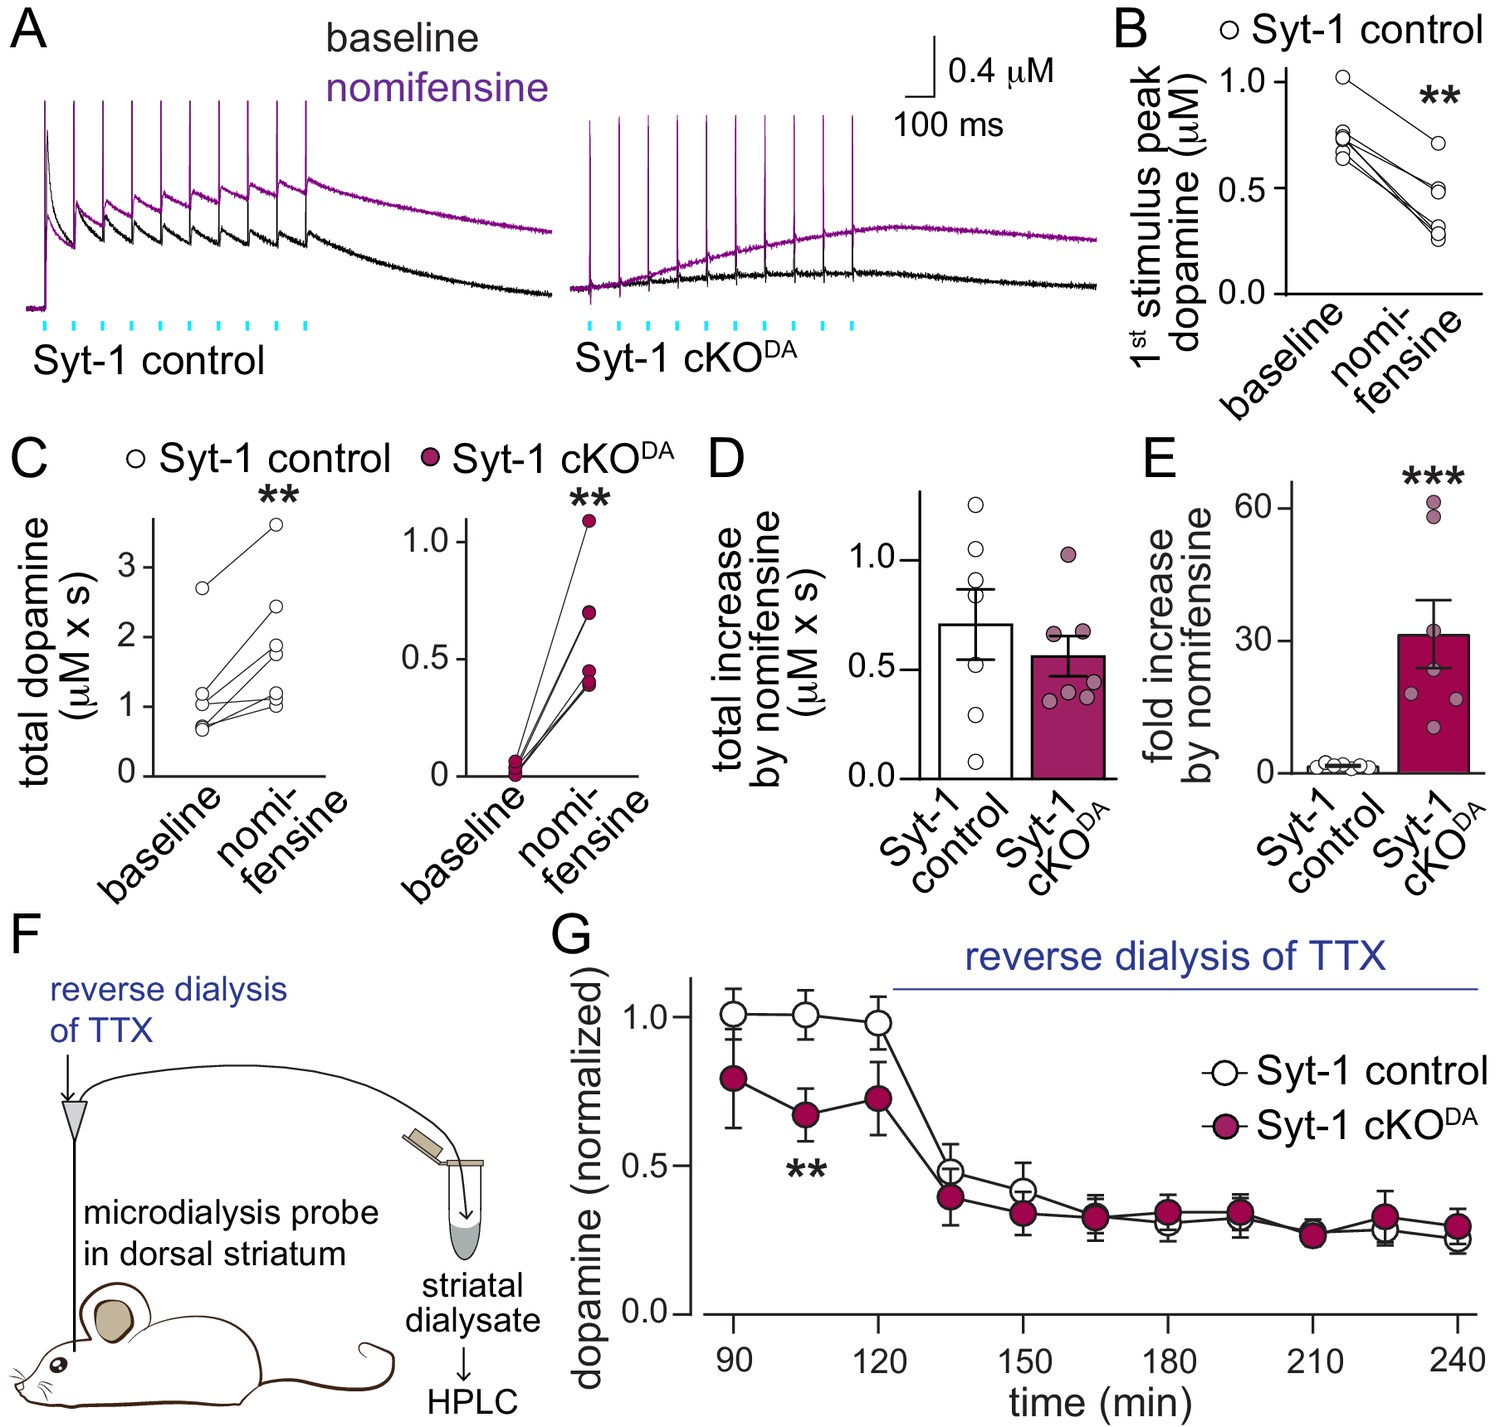
Asynchronous dopamine release sustains extracellular dopamine in vivo after ablation of Synaptotagmin-1.
(A–E) Sample traces (A, average of four sweeps) and quantification of dopamine release (B–E) evoked by a 10 Hz stimulus train induced as described in Figure 1H before (black traces) and after addition of the DAT blocker nomifensine (10 µM, purple traces) in Syt-1 control and Syt-1 cKODA slices. Amplitudes of the first response (B, Syt-1 control only), total dopamine (area under the curve for 2.935 s after the 1st stimulus) before and after nomifensine (C), subtracted area (D) and fold increase after nomifensine (E) are shown, Syt-1 control n = 7 slices/5 mice, Syt-1 cKODA n = 7/5. (F, G) Schematic of the experiment (F) and summary plot (G) of in vivo dopamine measurements using microdialysis in the dorsal striatum (microdialysates were collected over periods of 15 min and values measured in these microdialysates at the end of each period are plotted) of Syt-1 control and Syt-1 cKODA mice. The quantification in G shows dopamine levels normalized to the average concentration from the 76th - 120th min in Syt-1 control, and reverse dialysis of 10 µM TTX to block action potential firing started at 121 min, Syt-1 control n = 5 mice, Syt-1 cKODA n = 5 mice. All data are shown as mean ± SEM, **p<0.01, ***p<0.001, statistical significance was determined by Wilcoxon matched pairs signed rank tests in B and C, Mann Whitney tests in D and E, and by two-way ANOVA followed by Sidak’s multiple comparisons test in G. In G, the data followed a lognormal distribution and statistical testing was done after the data were converted to a loge scale, *** for time and ** for interaction, post-tests for genotypes are shown.
Tables
Key resources table
| Reagent type (species) or resource | Designation | Source or reference | Identifiers | Additional information |
|---|---|---|---|---|
| Genetic reagent (M. musculus) | B6.SJL-Slc6a3tm1.1(cre)Bkmm/J; DATIRES-Cre | Bäckman et al., 2006 | JAX 006660, RRID:IMSR_JAX:006660 | |
| Genetic reagent (M. musculus) | B6.129S-Gt(ROSA)26Sortm32(CAG-COP4*H134R/EYFP)Hze; Ai32 | Madisen et al., 2012 | JAX 012569, RRID:IMSR_JAX:012569 | |
| Genetic reagent (M. musculus) | C57BL/6NTac-Syt1tm1a(EUCOMM)Wtsi/WtsiCnrm; Syt-1 floxed; Syt1lox/lox | Skarnes et al., 2011; Zhou et al., 2015; obtained from Dr. T.C. Südhof | EUCOMM (EM:06829), RRID:IMSR_EM:06829 | Conditional Synaptotagmin-1 floxed mice |
| Cell line (H. sapiens) | HEK293T | ATCC | Cat#: CRL-3216, RRID:CVCL_0063 | |
| Recombinant DNA reagent | AAV-flex-oChIEF-citrine | Addgene; Lin et al., 2009 | Plasmid# 50973, RRID:Addgene_50973 | |
| Chemical compound, drug | Nomifensine | Tocris | Cat. No. 1992 | |
| Chemical compound, drug | Tetrodotoxin | Tocris | Cat. No. 1078 | |
| Antibody | Mouse monoclonal IgG2a anti-Bassoon SAP7F407 (A85) | Enzo Life Sciences | Cat# ADI-VAM-PS003-F, RRID:AB_11181058 | IHC (1:500) |
| Antibody | Guinea pig polyclonal anti-Tyrosine hydroxylase (A111) | Synaptic Systems | Cat# 213 104, RRID:AB_2619897 | IHC (1:1000) |
| Antibody | Rabbit polyclonal anti-Synaptotagmin-1 antiserum (A24) | gift from Dr. T.C. Südhof | V216 | ICC (1:1000) |
| Other | Microdialysis probe | Harvard Apparatus | Item# CMA8309581 | |
| Other | Carbon fiber filaments | Goodfellow | Item# C 005722 | |
| Software, algorithm | Fiji | Schindelin et al., 2012 | RRID:SCR_002285, https://imagej.net/Fiji/Downloads | Used for confocal synaptosome and 3D-SIM slice experiments |
| Software, algorithm | SoftWoRX | GE Healthcare | http://incelldownload.gehealthcare.com/bin/download_data/SoftWoRx/7.0.0/SoftWoRx.htm | Used for 3D reconstruction |
| Software, algorithm | Custom MATLAB code | Liu et al., 2018 | https://github.com/hmslcl/3D_SIM_analysis_HMS_Kaeser-lab_CL (Liu, 2017) | Used for analysis of 3D-SIM and synaptosome images |
| Software, algorithm | Prism8 | GraphPad | RRID:SCR_002798, https://www.graphpad.com/scientific-software/prism | Used for statistical analysis |
Additional files
Download links
A two-part list of links to download the article, or parts of the article, in various formats.
Downloads (link to download the article as PDF)
Open citations (links to open the citations from this article in various online reference manager services)
Cite this article (links to download the citations from this article in formats compatible with various reference manager tools)
Synaptotagmin-1 is the Ca2+ sensor for fast striatal dopamine release
eLife 9:e58359.
https://doi.org/10.7554/eLife.58359


