Repeated outbreaks drive the evolution of bacteriophage communication
- Theoretical Biology, Department of Biology, Utrecht University, Netherlands
- Laboratory of Genetics, Department of Plant Sciences, Wageningen University, Netherlands
Figures
Figure 1
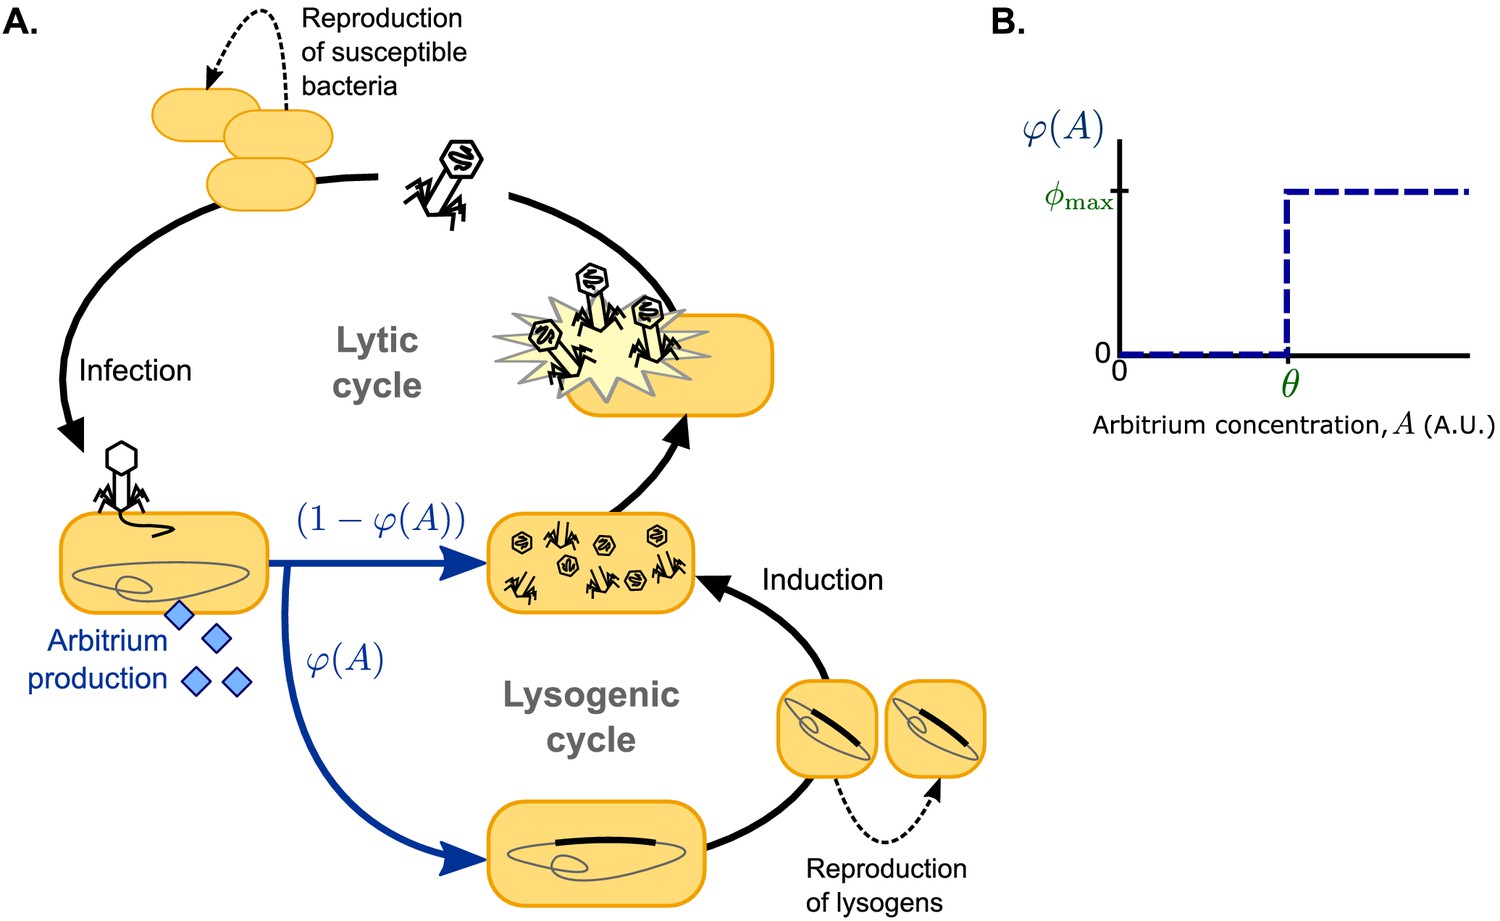
Model overview.
(A) Free phages infect susceptible bacteria, at which point a fixed amount of arbitrium is produced. This arbitrium is taken up and degraded by susceptible cells and lysogens. Upon infection, a cell enters the lysogenic cycle with propensity , or the lytic cycle with propensity ; the lysogeny propensity depends on the current arbitrium concentration. The lytic cycle leads to immediate lysis of the host cell and release of a burst of new virions. In the lysogenic cycle, the phage remains dormant in the lysogen population, which grows logistically with the same rate as the susceptible cell population. Lysogens are spontaneously induced at a low rate, at which point they re-enter the lytic cycle. (B) In communicating phages, the lysogeny propensity is modelled by a step-function characterised by two phage characteristics: θ, the arbitrium concentration above which the phage increases its lysogeny propensity, and , the lysogeny propensity of the phage at high arbitrium concentration.
Figure 2 with 2 supplements
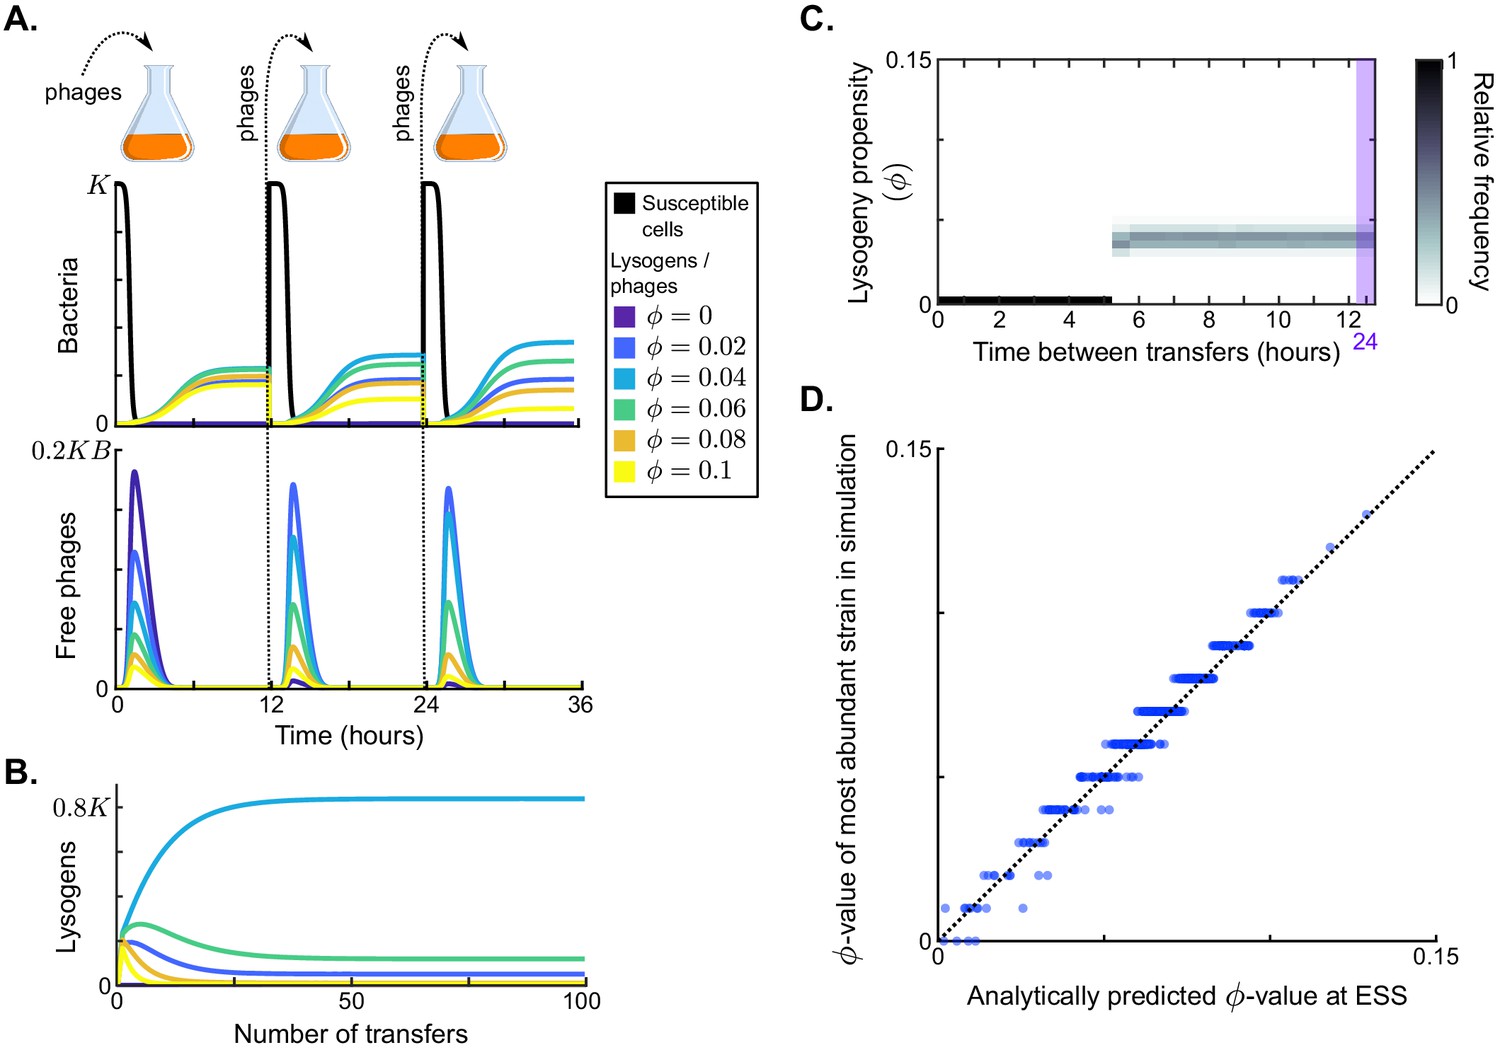
Results in the absence of phage communication.
(A) Short-term model dynamics under default parameter conditions (Table 1) and a passaging episode duration of h. The model was initialised with a susceptible bacterial population at carrying capacity () and a low frequency of phages (), and upon passaging the phages were diluted 100-fold. Phage variants differ in their lysogeny propensity . Dynamics within a single passaging episode are further illustrated in Figure 2—figure supplement 1. (B) Long-term model dynamics for default parameter settings and h. Over many passages, a single phage variant () is selected. (C) Distribution of phage variants at evolutionarily steady state as a function of the time between passages, T. A total number of 101 phage variants was included, with lysogeny propensities varying between and . When the interval between passages is short, the susceptible cells are not depleted during the rounds of infection and a fully lytic strategy () is selected. For larger values of T, however, a bet-hedging strategy with small but non-zero -value is selected (). Almost identical results are obtained if the serial passaging set-up is altered to simulate serial passaging of a full sample (phages, susceptible bacteria, and lysogens) instead of phages only (Figure 2—figure supplement 2). (D) Parameter sweep results. The model was run with 500 sets of randomly sampled parameters, and for each run the most abundant -value in the population at evolutionarily steady state was plotted against the analytically predicted evolutionarily stable strategy (ESS; see Appendix A3 and Box 1). The dotted line is the identity line. The analytically derived ESS is a good predictor of the simulation outcome.
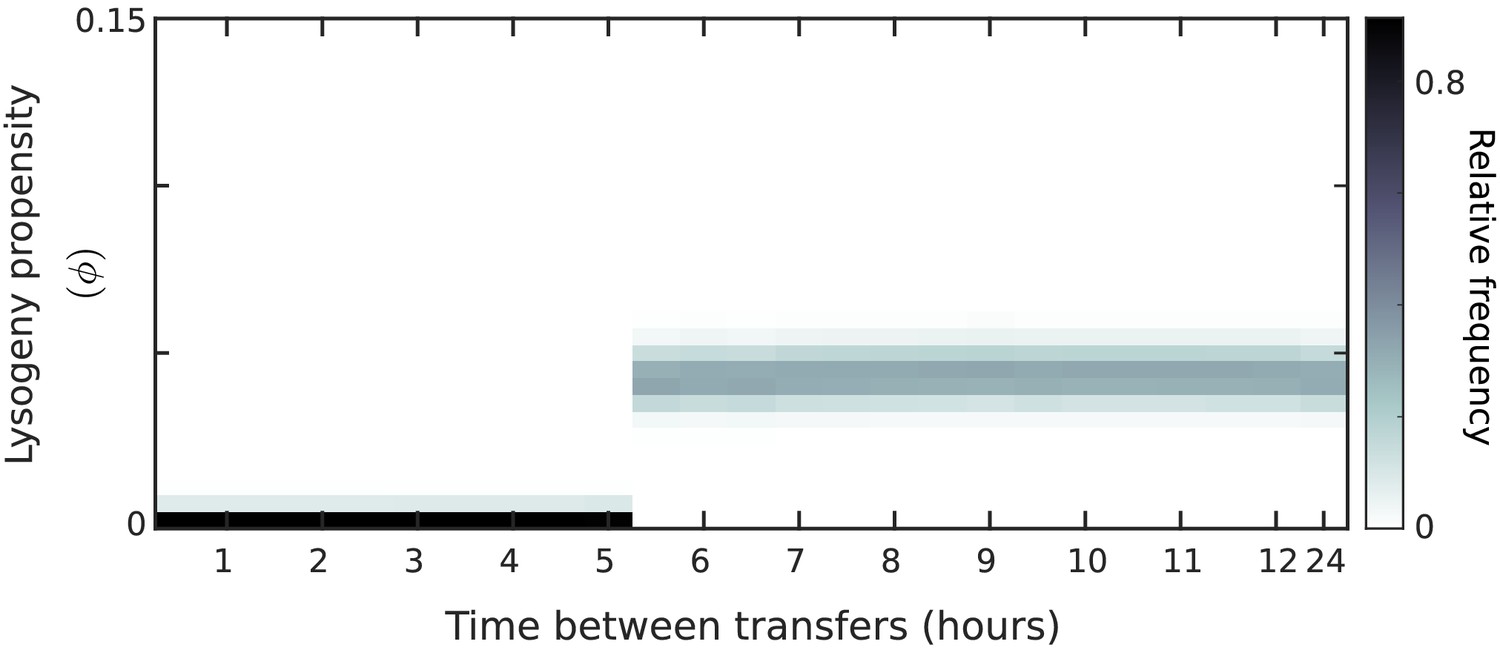
Figure 2—figure supplement 1

Model dynamics during a single passaging episode for default parameter values and constant lysogeny propensities (no communication).
Absolute frequencies of susceptible cells and lysogens (panel A) and phages (panel B) are plotted as a function of time, as well as the relative frequency of the different phage variants in the lysogen population (panel C) and the free phage population (panel D). The dynamics can be divided into three distinct phases: (1) Epidemic: Susceptible cells are still present () but are being depleted by infection. Phage and lysogen densities increase depending on their lysogeny propensity . The relative frequencies in the lysogen population are established. (2) Transition phase: Infections no longer take place because the susceptible cell population has been depleted (). The lysogen population grows until it reaches its carrying capacity. Free phage densities decline because of natural decay and adsorption to lysogens. The influx of free phages by reactivation of lysogens differs per phage variant because the density of their corresponding lysogens differs, and the relative frequencies in the free phage pool change to reflect this. (3) Equilibrium phase: The total lysogen population is at carrying capacity, and the relative frequencies of the phage variants in the (eventually passaged) free phage pool reflect the relative frequencies of phage variants in the lysogen population.
Figure 2—figure supplement 2
Distribution of phage variants at evolutionarily steady state as a function of the time between passages, T, for constant lysogeny propensities (no communication) under a serial-passaging regime in which full samples (susceptible bacteria, lysogens, and phages) are passaged.
Box 1—figure 1
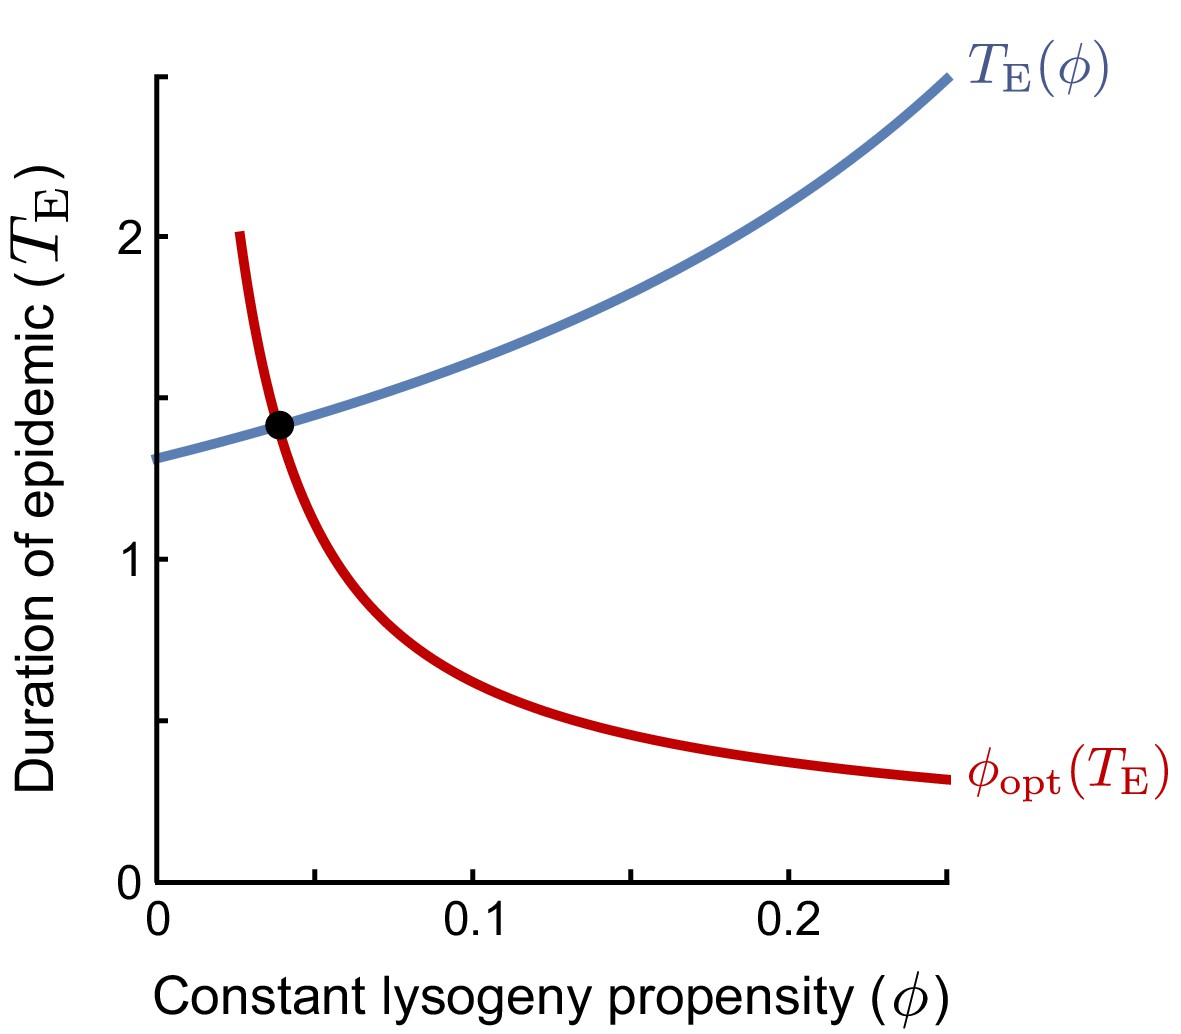
The ESS is found as the intersection of the curves of (i) the duration of the epidemic as a function of the lysogeny propensity of the resident (blue line), and (ii) the optimal lysogeny propensity of the invader given a fixed duration of the epidemic (red line).
Figure 3 with 2 supplements

Model dynamics if phage communication is included in the model.
(A) Short-term dynamics for default parameter conditions (Table 1) and the same serial-passaging regime as in Figure 2. This example shows the competition between three phage variants, all with but with varying response thresholds θ. (B) Distribution of phage variants at evolutionary steady state for varying passaging episode durations T. In total 441 phage variants were included in this analysis, covering all combinations of between 0 and 1 and θ between 0 and with step sizes 0.05 and , respectively. When the interval between passages is very short, again a fully lytic strategy () is selected. For longer times between passages, however, we consistently see that a strategy with and dominates the population. The results shown for h are representative for values of h, while the results shown for h represent results obtained for h (see Figure 3—figure supplement 1 for distributions for a large range of T-values). Almost identical results are obtained if instead of only phages a full sample (susceptible cells, lysogens, phages, and arbitrium) is passaged (Figure 3—figure supplement 2). (C) Rapid invasion by 'optimally' communicating phages into a population of phages with the 'optimal' bet-hedging strategy. The bet-hedging phages have (see Figure 2C), while the communicating phages are characterised by and (see panel C). The communicating phage is initialised at a frequency of 1% of the bet-hedging phage.
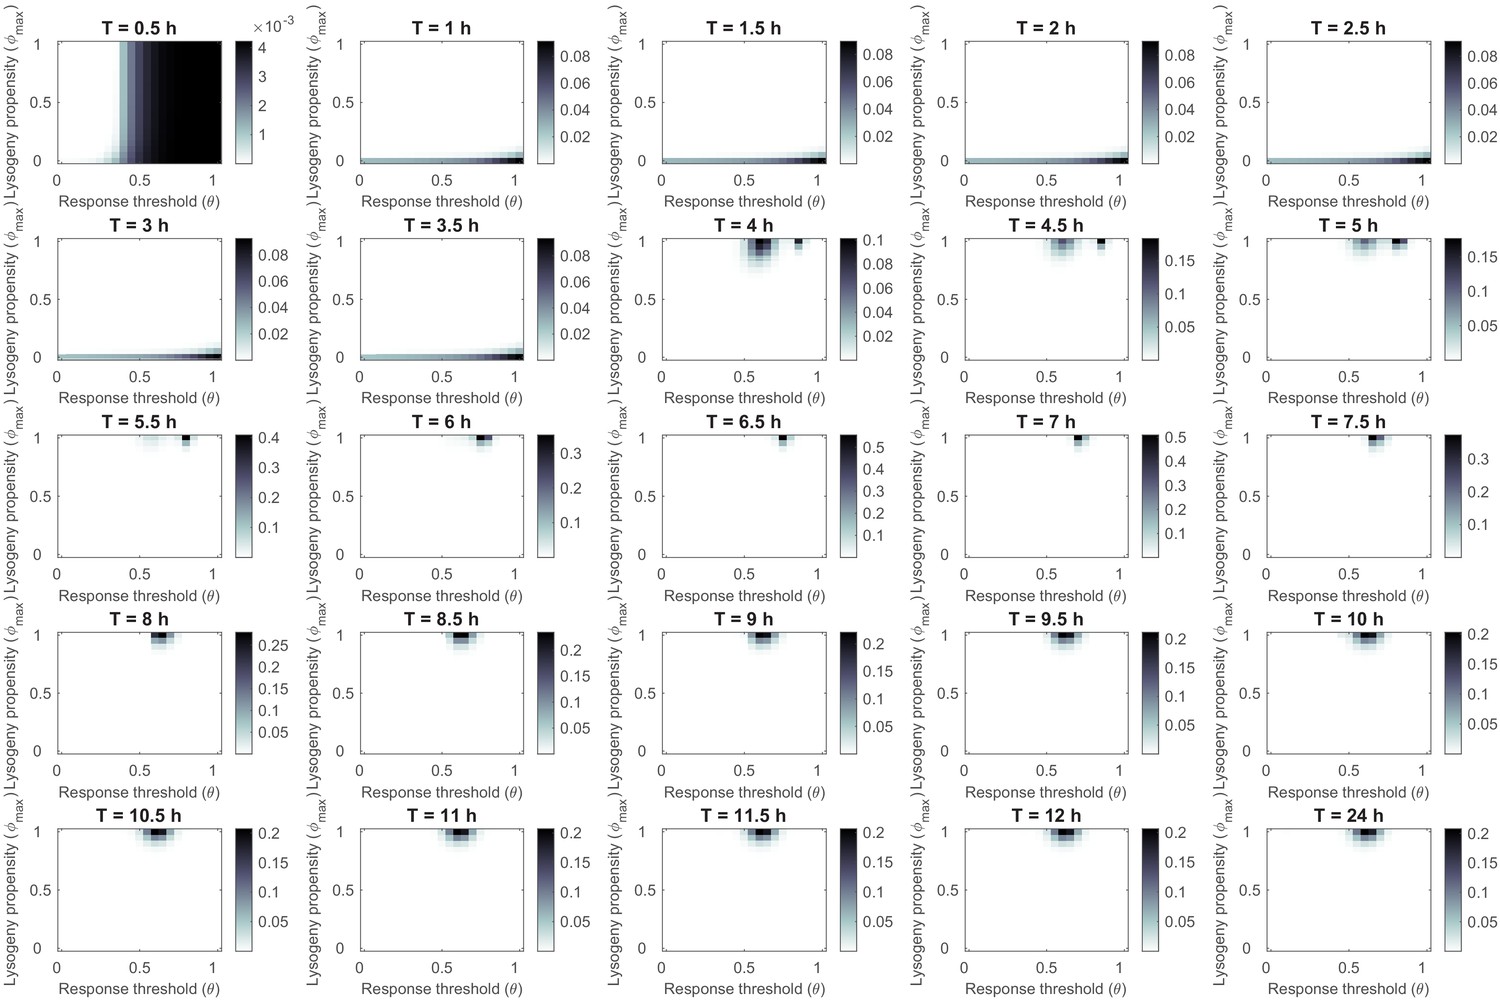
Figure 3—figure supplement 1

Phage variant distribution at evolutionary steady state for various lengths of the time interval between passages T.
Default parameter settings (Table 1). In each run, 441 variants were included: all combinations of and . Simulations were run for 1000 passaging episodes to reach evolutionary steady state, after which the phage variant distribution was plotted. For h phages with a fully lytic strategy () are selected. For h, phage variants with a sufficiently high response threshold () also occur. Under such short times between passages, the arbitrium concentration never reaches values during an epidemic, and phages with sufficiently high response threshold values hence display a lytic strategy only. For h phages are selected that switch from a fully lytic strategy at low arbitrium concentration to a fully lysogenic strategy () at high arbitrium concentration. For h, the selected response threshold value slowly decreases until it settles at approximately . This result is probably due to a residual presence of free phage particles that were produced during the early active epidemic phase. Since phage variants with a higher response threshold value switch to a lysogenic strategy later in the epidemic, they initially produce more free phage particles than phage variants that switch to a lysogenic strategy earlier. These additional phages disappear over time due to spontaneous degradation and adsorption to lysogens. If, however, some of these phages are still present when the population is passaged, this provides a small advantage to the phage variants that produced more of these early phages (i.e. the phages with a higher response threshold).
Figure 3—figure supplement 2
Phage variant distribution at evolutionary steady state for various lengths of the time interval between passages T under serial passaging of full samples (susceptible cells, lysogens, phages, and arbitrium).
Simulations were identical to Figure 3—figure supplement 1, with the exception that at every passage a sample of the full system was passaged, instead of phages only. Results are almost identical to those under the original set-up (Figure 3 and its supplements), indicating that the evolution of communication and its specifics are highly robust to alterations in serial-passaging set-up.
Figure 4

Parameter dependance of the selected values of and θ.
(A) Parameter sweep results. A total of 500 simulations were run with randomly sampled parameters (Table 1) and a long time between passages ( h). In each simulation, 121 phage variants were included, covering all combinations of to and to with step sizes 0.1 and , respectively. The size of the circles corresponds to the number of simulations that yielded that particular phage variant as most abundant at evolutionary steady state. (B) Analytically predicted θ-value as a function of the effective burst size per adsorption to a susceptible cell, , and most abundant phage variant found in a simulation with varying but otherwise default parameter values, h, and . The range on the x-axis is equal to the range sampled in the parameter sweep. The analytically derived evolutionarily stable is a good prediction for the response threshold selected in the simulations, especially for phages with high effective burst size.
Figure 5 with 1 supplement
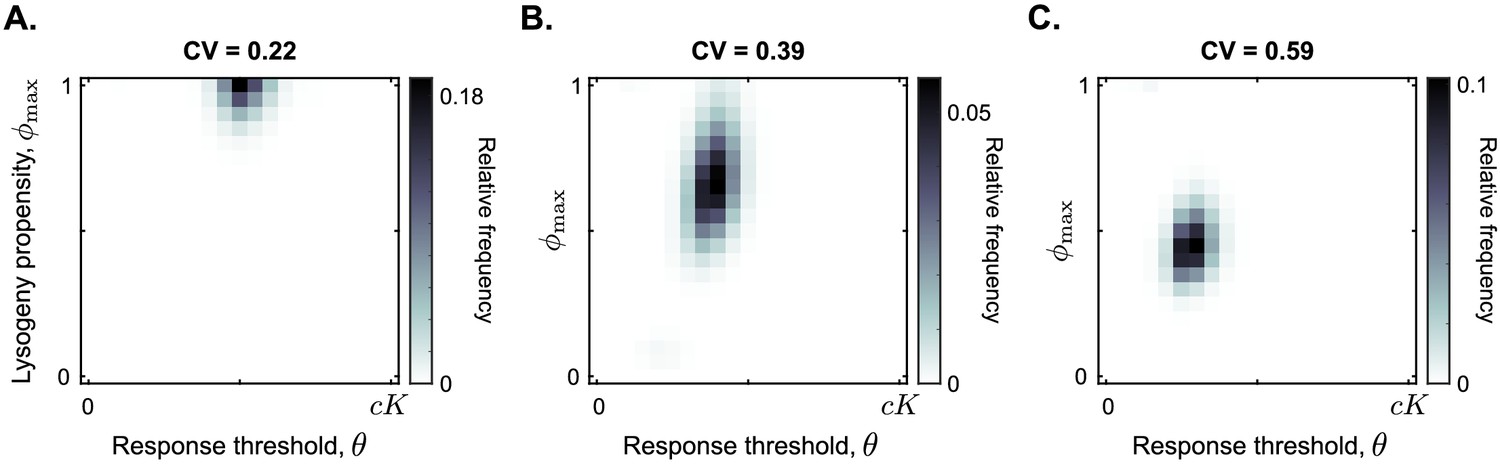
Distribution of phage variants at evolutionary steady state for increasing variation in the bacterial carrying capacity.
Each simulation included a total of 441 phage variants that covered all combinations of between 0 and 1 and θ between 0 and with step sizes 0.05 and , respectively. In each simulation, 1000 passaging episodes were simulated, with a long time between passages ( h). Parameter were set to default values (Table 1), except that at the start of each passaging episode the value of the bacterial carrying capacity was drawn from a gamma distribution with mean K. The coefficient of variation (CV = standard deviation / mean) was varied between simulations. Results are shown here for (A) CV = 0.22, (B) CV = 0.39, (C) CV = 0.59. The results in panel (A) are representative for CV ≤ 0.35, and the results in panel (C) are representative for CV ≥ 0.5 (Figure 5—figure supplement 1).
Figure 5—figure supplement 1
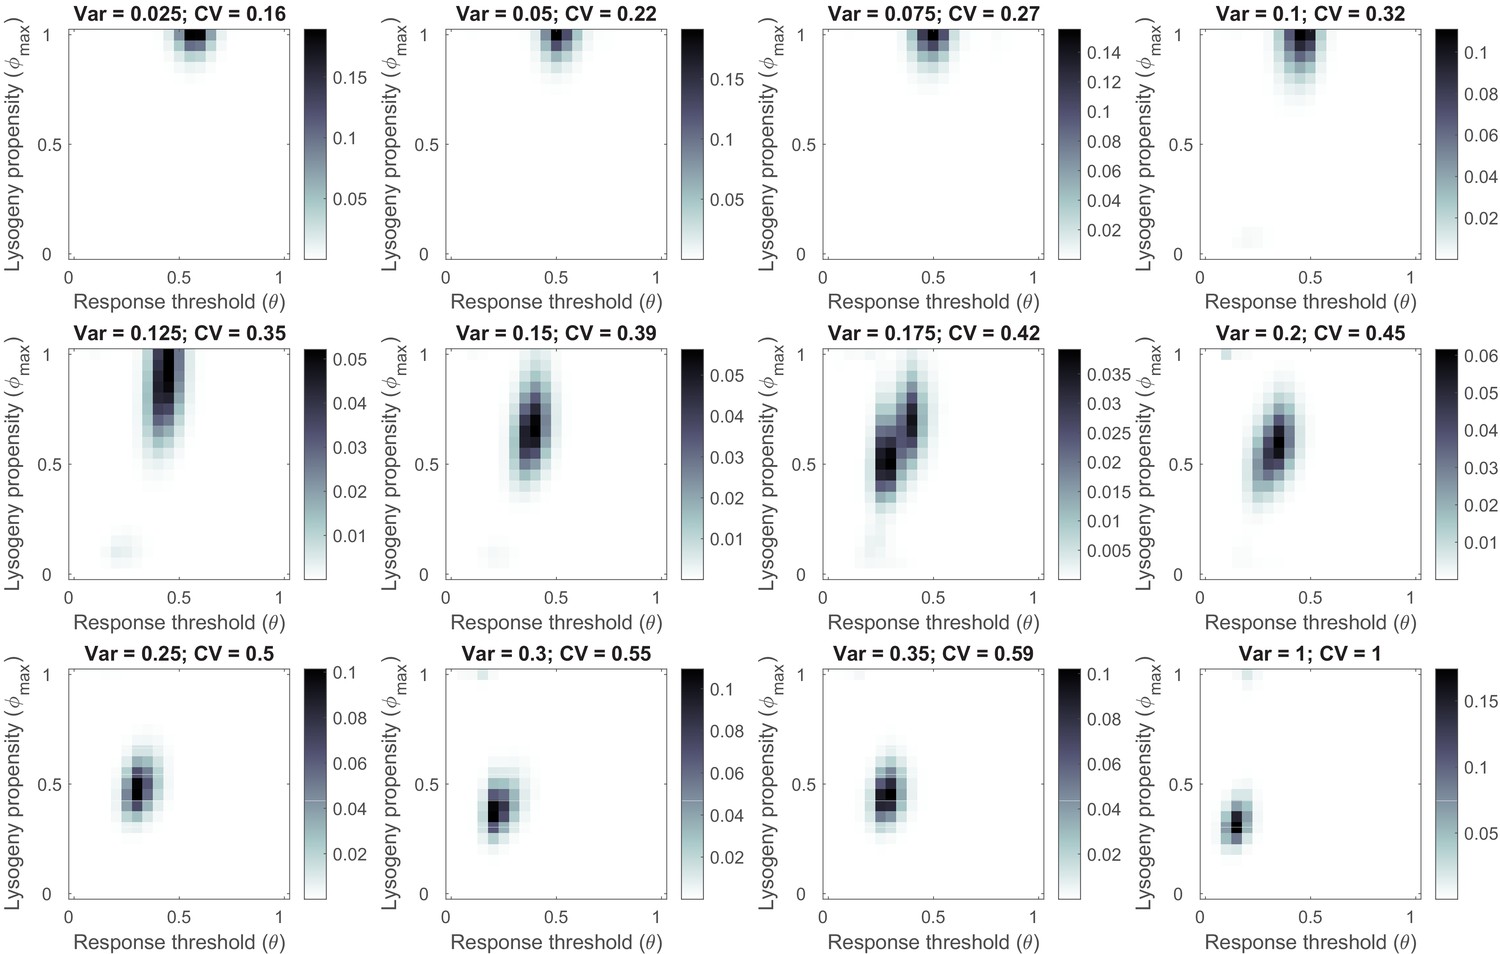
Phage variant distribution at evolutionary steady state for a sufficiently long time between passages ( h) and increasing variability in the bacterial carrying capacity between passaging episodes.
Default parameter settings (Table 1), but at the start of each passaging episode the value of the scaled bacterial carrying capacity was drawn from a gamma distribution with mean 1. The coefficient of variation (CV = standard deviation / mean) was varied between simulations. For each CV-value, 1000 passaging episodes were simulated. The phage variant distribution was calculated as a mean over the last 100 passaging episodes.
Author response image 1
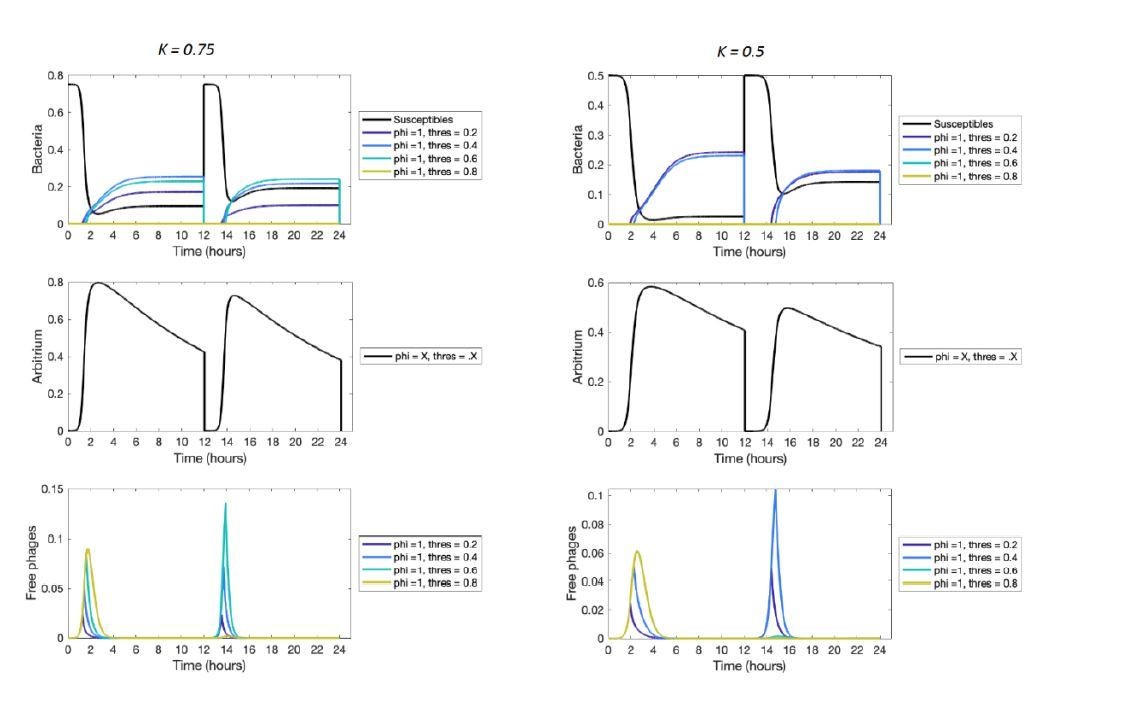
Short-term dynamics for lower values of the bacterial carrying capacity K.
Tables
Table 1
Model parameters.
| Original parameters | |||
|---|---|---|---|
| Parameter | Description (dimension) | Literature estimates | References |
| Net replication rate of bacteria (hour−1) | 1.0 | Berngruber et al., 2013 | |
| Carrying capacity of bacteria (cells mL−1) | 109 | Berngruber et al., 2013 | |
| Adsorption rate of phages to bacteria (hour−1 (cells per mL)−1) | 10-9—10-7 | De Paepe and Taddei, 2006; Shao and Wang, 2008 | |
| Proportion of adsorptions of a phage to a susceptible cell that leads to infection (cells phage−1) | set at 10-2, not measured | Berngruber et al., 2013 | |
| Burst size (phages) | 10—3.5· 103 | De Paepe and Taddei, 2006; Wang, 2006 | |
| Rate of spontaneous lysogen induction (hour−1) | 10-4—10-3 | Little et al., 1999; Zong et al., 2010; Berngruber et al., 2013 | |
| Spontaneous decay rate of free phages (hour−1) | 10-3—2·10-2 | De Paepe and Taddei, 2006 | |
| Uptake rate of arbitrium by cells (arbitrium mL−1 (cells per mL)−1) | no estimates known | - | |
| Scaled dimensionless parameters used in parameter sweeps | |||
| Parameter | Description | Default value | Parameter sweep range |
| Effective burst size | 2 | 1—103 | |
| Scaled adsorption rate of phages to cells | 10 | 1—100 | |
| Scaled decay rate of phage particles | 0.01 | 10-3—0.1 | |
| Scaled spontaneous phage induction rate | 10-3 | 10-4—10-2 | |
| Scaled rate of arbitrium uptake and degradation by cells | 0.1 | 10-3—1 | |
| Dilution factor of phages at serial passages | 0.01 | 10-3—0.1 | |
Additional files
Download links
A two-part list of links to download the article, or parts of the article, in various formats.
Downloads (link to download the article as PDF)
Open citations (links to open the citations from this article in various online reference manager services)
Cite this article (links to download the citations from this article in formats compatible with various reference manager tools)
Repeated outbreaks drive the evolution of bacteriophage communication
eLife 10:e58410.
https://doi.org/10.7554/eLife.58410


