Electron tomography visualization of HIV-1 fusion with target cells using fusion inhibitors to trap the pre-hairpin intermediate
- Division of Biology and Biological Engineering, California Institute of Technology, United States
- Department of Biochemistry, University of Utah School of Medicine, United States
Figures
Figure 1 with 1 supplement
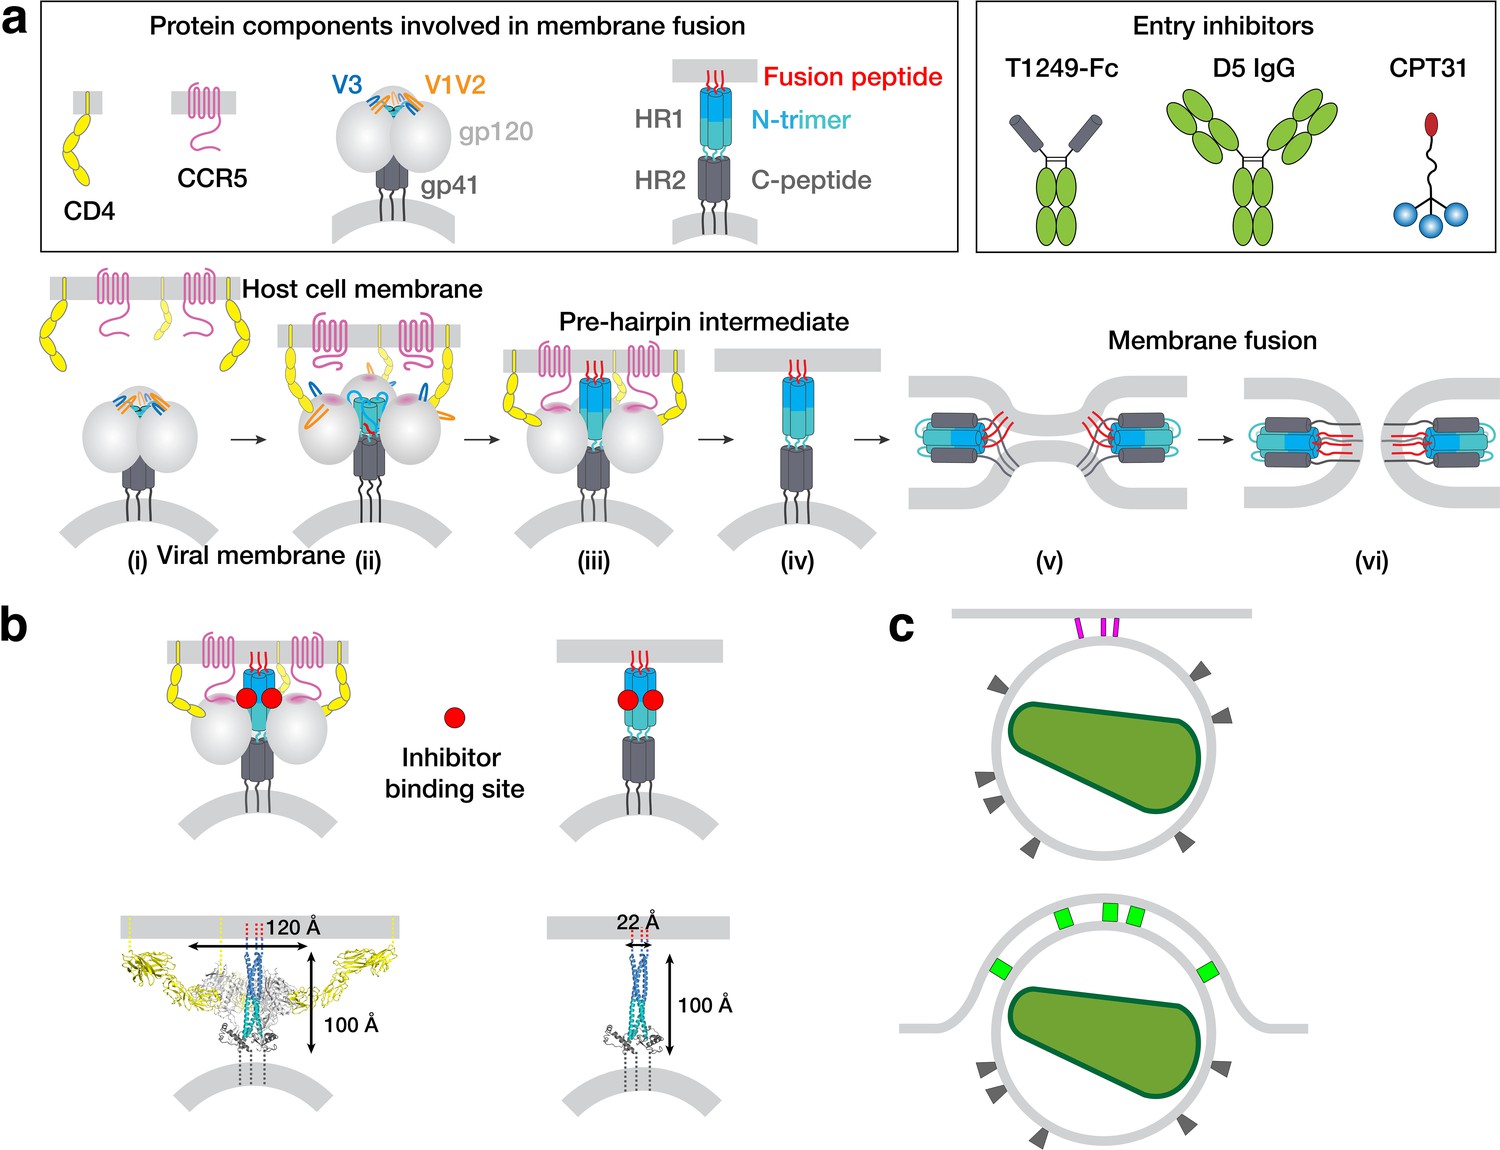
HIV-1 Env-mediated fusion between viral and host cell membranes.
(a) Top: Schematics of host receptors, HIV-1 Env trimer, pre-hairpin intermediate, and fusion inhibitors. Bottom: steps in fusion: (i) Closed, prefusion structure of HIV-1 Env trimer in which the V1V2 loops (orange) occlude the coreceptor-binding site on V3 (blue) (e.g., PDB code 5CEZ). The Env trimer is embedded in the viral membrane, while the host receptor (CD4) and coreceptor (CCR5) are embedded in the target cell membrane. (ii) CD4-bound open HIV-1 Env trimer in which V1V2 loops have been displaced to expose the coreceptor-binding site on V3 (e.g. PDB 6U0L). (iii) Hypothetical CD4- and CCR5-bound open Env trimer with rearrangements of gp41 N-trimer/HR1 to form a pre-hairpin intermediate structure that is linked to the target cell membrane by the gp41 fusion peptide (red). (iv) Hypothetical pre-hairpin intermediate formed by gp41 trimer after shedding of gp120s. (v–vi) Formation of the post-fusion gp41 six-helical bundle (e.g. PDB 1GZL) that juxtaposes the host cell and viral membranes (step v) for subsequent membrane fusion (step vi). (b) Approximate binding sites (red circles) for fusion inhibitors shown on schematics of steps iii and iv (panel a). Entry inhibitor binding sites might be partially sterically occluded for binding to the T1249-Fc or D5 fusion inhibitors. Schematics shown above as models are from PDB codes 6U0L and 1AIK with approximate dimensions indicated. (c) Schematic illustrating why fewer HIV-1 Envs might be involved in attaching to a target cell when the attachment site is flat versus a concave surface. Top: attachment site (described here) formed during a 37°C incubation of virions, target cells, and a fusion inhibitor. Bottom: attachment site (described in Sougrat et al., 2007) formed in the absence of a fusion inhibitor when virions and target cells were incubated in a temperature jump protocol (4 °C incubation followed by warming to 37°C).
Figure 1—figure supplement 1
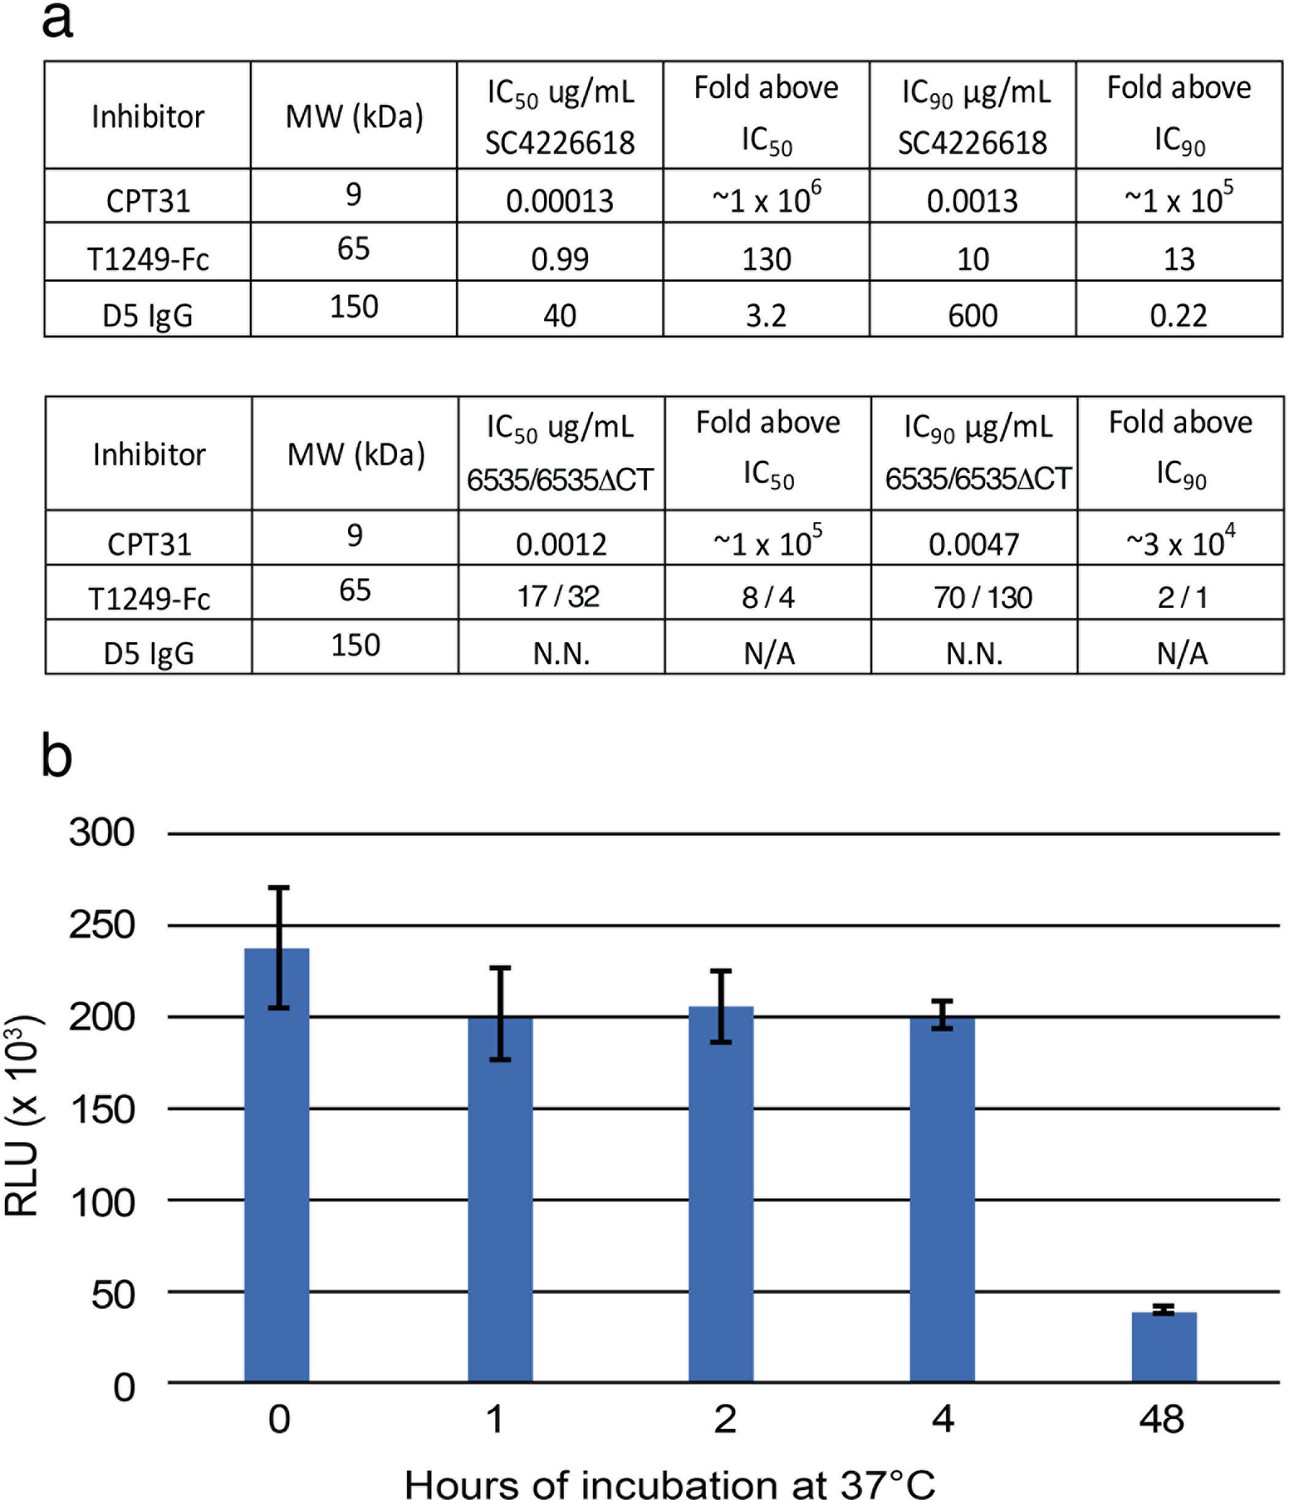
Characterization of fusion inhibitors and viral infectivity.
(a) Entry inhibitors are listed with their molecular weights, IC50 and IC90 values for neutralization potencies against SC4226618 and 6535 (and for T1249-Fc, also against 6535-ΔCT), and the fold above these values that they were used for fusion inhibitor imaging experiments in which the inhibitors were incubated at 130 µg/mL. N.N. = non neutralizing. N/A = not applicable. (b) Infectivity of SC4226618 pseudovirus after incubation with TZM-bl target cells for the indicated times at 37°C. Luciferase activity (measured in relative luminescence units, RLUs) of supernatants transferred to fresh TZM-bl cells after the following incubation times is presented as the mean and standard deviation for eight replicate measurements. ~ 20% of the input pseudovirus remained infectious after 48 hr at 37 °C. To address whether infectious pseudovirus was still present after a 48 hr incubation at 37 °C with T1249-Fc inhibitor and TZM-bl cells, we calculated how many molecules of T1249-Fc were added (1015 molecules) in the inhibition experiments, how many TZM-bl cells were cultured (~50,000 cells in each well, which contained one or two sapphire disks (3 mm each)), and how many SC4226618 pseudoviruses were added at the start of the incubation (2500 TCID50 = ~107 particles). Thus, there were ~2×10⁶ infectious viruses, ~1015 molecules of T1249-Fc, and ~50,000 TZM-bl cells that were available for formation of spoke structures that could be captured by HPF and visualized by ET after the 48 hr incubation at 37°C.
Figure 2 with 1 supplement
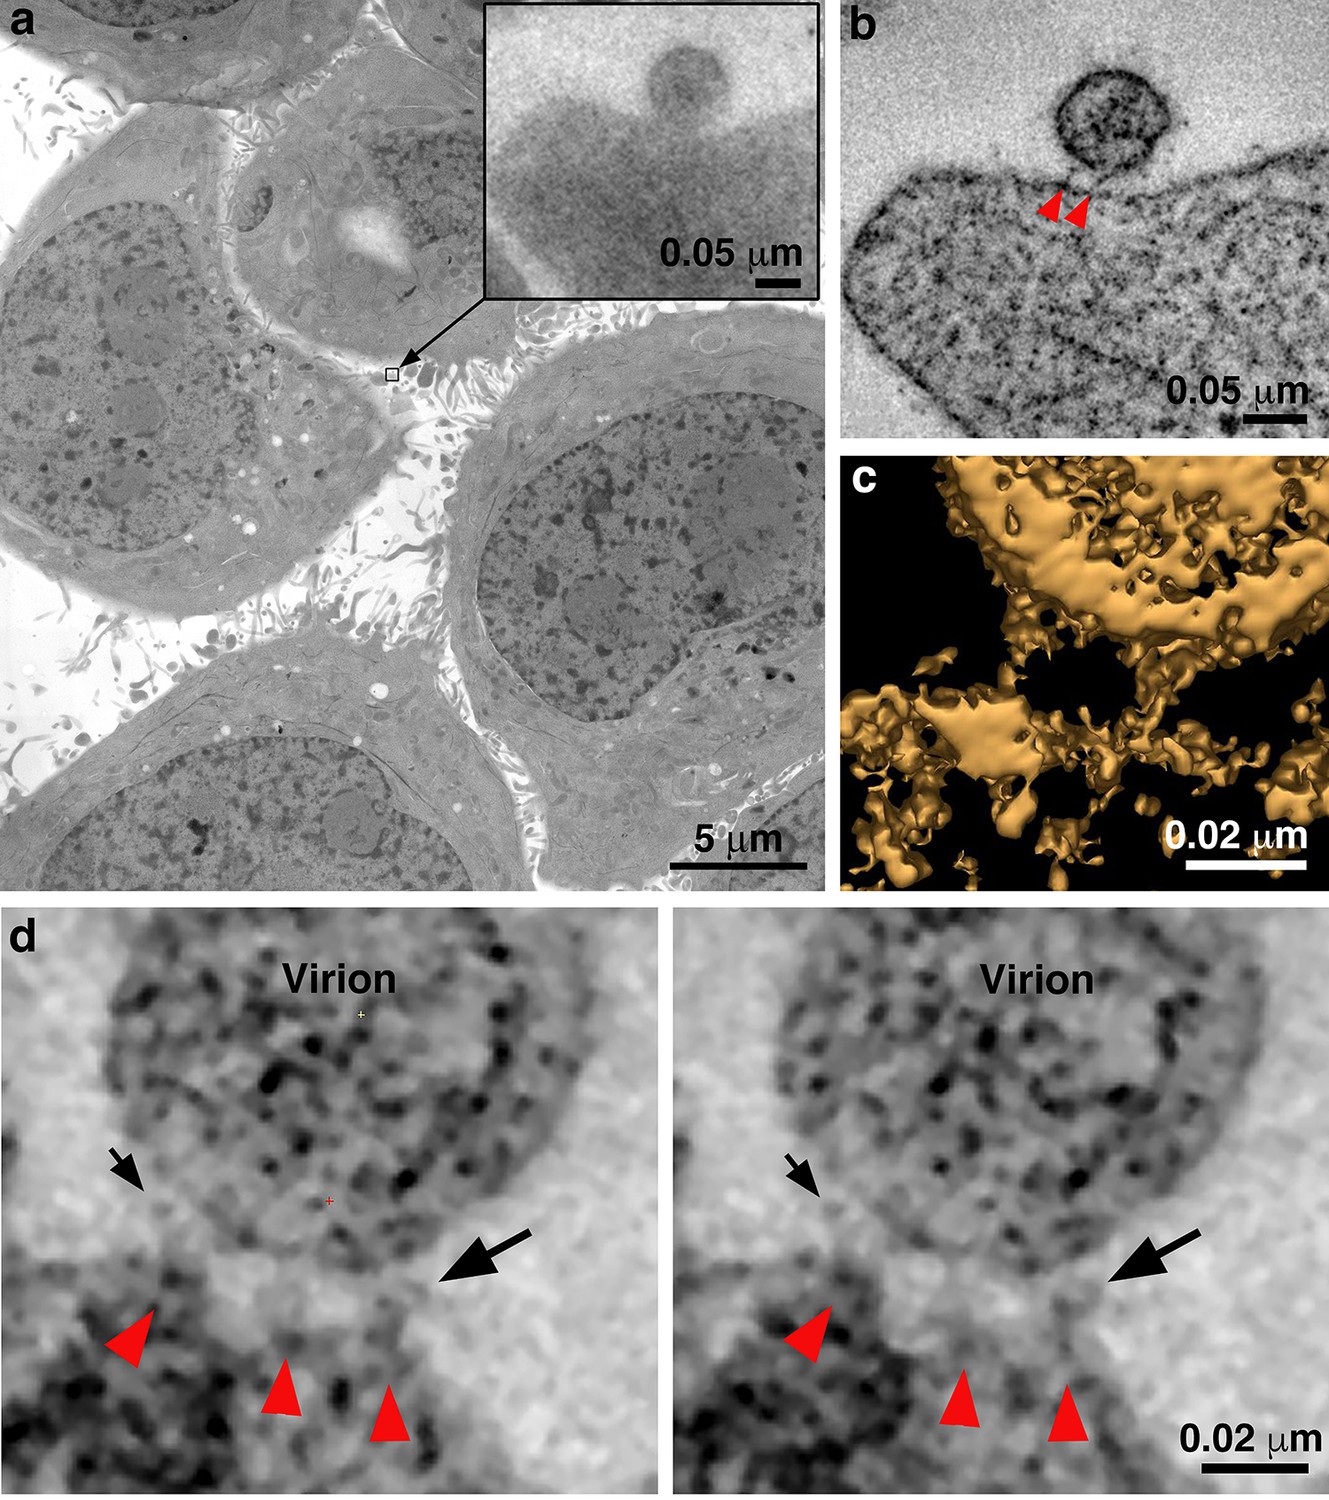
Identification of attached HIV-1 virions.
(a) Montaged projection overview of a field of cultured TZM-bl cells from a 400 nm section. Note extensive blebbing and surface projections that are typical of the cell type. Inset: Projection detail of a HIV-1 virion adjacent to TZM-bl cell surface. (b) Slice (5.6 nm) from a tomographic reconstruction of the virion shown in the inset of panel a (from a dataset collected with the T1249-Fc inhibitor). The bullet-shaped core identifies the particle as mature HIV-1 (see also Figure 3—figure supplement 1). Two pre-hairpin intermediate ‘spokes’ (red arrowheads) attach the virion to the cell surface. (c) 3-D isosurface rendering of the spokes shown in panel b. (d) Examples of extra densities observed in some data sets collected using the D5 IgG inhibitor. These appear as ‘hook-like’ structures projecting from the sides of spokes, adjacent to the virion surface, which are visible in two sequential tomographic slices (small and large black arrows). Extra densities may represent portions of D5 IgGs attached to the prehairpin intermediate. Similar densities were not seen in experiments with the T1249-Fc or CPT31 inhibitors.
Figure 2—figure supplement 1

Confirmation of pseudovirions in tomograms and experimental controls.
(a) Identification of free pseudovirions in tomographic reconstructions. Virions were identified by visualizing a cone-shaped core structure in mature virions (upper left) and a C-shaped core structure in immature virions (lower left) and Env spikes on virion surfaces. Modeled contours highlight the core (blue) and Envs (black) in the mature virion (upper right) and in the immature virion (lower right). (b) TZM-bl cells are contaminated with ecotropic murine leukemia virus. Two examples of nascent MLV particles emerging from the cell surface (top) and a cellular projection (bottom). Left panels show overviews of the cell with the locations of MLV budding events indicated by black rectangles. Right panels show tomographic details of the MLV budding profiles. (c) Locating and identifying attached virions prior to electron tomography. Left: Overview of a TZM-bl cell in a 400 nm section. To find virions, the peripheries of cells are scanned at low magnification (2600x – 5600x) to identify structures that appear spherical, ~100 nm in diameter and proximal to the cell’s plasma membrane. Two candidate objects are indicated by the square. Upper middle and upper right: Tilted projection views of candidate objects. Once candidates are located, they are observed at high magnification (12,000x – 15,000x) first at 0° (view perpendicular to the electron beam) and then at +/- 35°. Virions maintain a spherical appearance at both tilted views, while non-viral objects (e.g. blebs and other cellular extensions) appear tubular or oblong in the high tilted view. Lower middle: Projection image of a candidate virion at −5 µm defocus. Candidate objects are further examined at high magnification through a defocus series in order to distinguish core structures (a cone-shaped core in mature virions or a C-shaped core in immature virions). Objects with a distinguishable core (arrowhead) were classified as virions and imaged by dual-axis tomography. Lower right: 5.5 nm slice from a tomographic reconstruction of the virion in the lower middle panel. (d) Control experiments showed no attached virions. No virions were found attached to cell surfaces when TZM-bl cells and pseudoviruses were incubated at 37°C with either no inhibitor, with an irrelevant Fc-containing protein (Z004, an anti-Zika virus IgG [Robbiani et al., 2017)], or with the T1249-Fc inhibitor at a concentration equivalent to 0.01x of its neutralization potency (i.e., its IC50 value). Very few free virions were present in the samples with fewer still in proximity to cells (<1 particle per ~10 cells per section). In the typical example shown from a control experiment, a single free virion was found near a TZM-bl cell in a 400 nm section. Tomography (inset) revealed the virion to be too distant from the cell for attachment to occur and no structures resembling spokes on either the virion or the cell surface.
Figure 3 with 1 supplement

Characteristics of virions attached to target cells in the presence of a fusion inhibitor.
(a) 2-D projection image of TZM-bl cell incubated with SC4226618 pseudovirions in the presence of the T1249-Fc fusion inhibitor for 2 hr at 37°C. Inset shows a tomographic slice of the attached virion indicated by a box with attachment spokes indicated by magenta arrowheads. (b) 3-D model from tomogram of attachment site shown in panel a inset. (c) Tomographic slice of attached virion from panel b with approximate measurements of spoke length, width, and inter-spoke distances. (d) Summary of mean, standard deviation, and number of observations for spokes at attachment sites under different experimental conditions. See also Figure 3—source data 1.
-
Figure 3—source data 1
Quantification of prehairpin intermediate spokes.
- https://cdn.elifesciences.org/articles/58411/elife-58411-fig3-data1-v2.xlsx
Figure 3—figure supplement 1
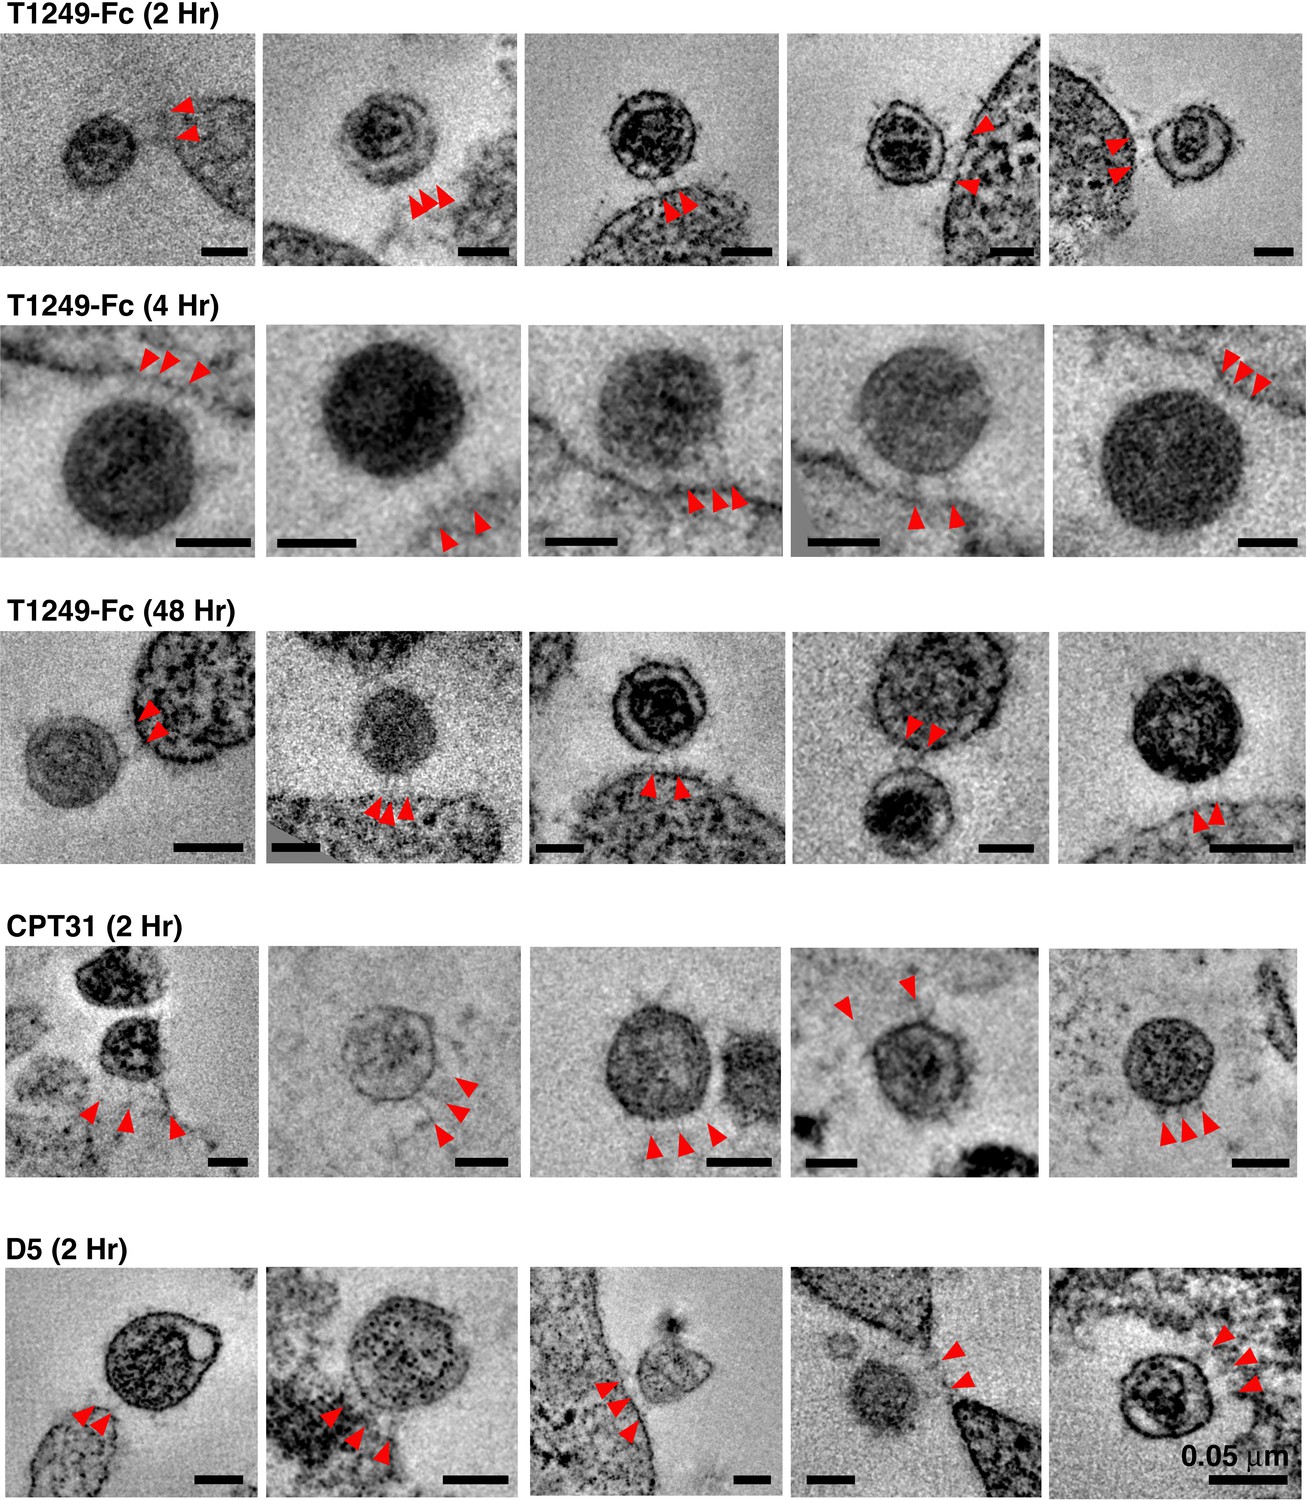
Gallery of attachment sites formed using different fusion inhibitors and different incubation times.
In examples shown here, attachments consisted of either two or three spokes (red arrowheads) linking virions to cell surfaces. All scale bars = 0.05 μm. See also Figure 3—source data 1.
Figure 4
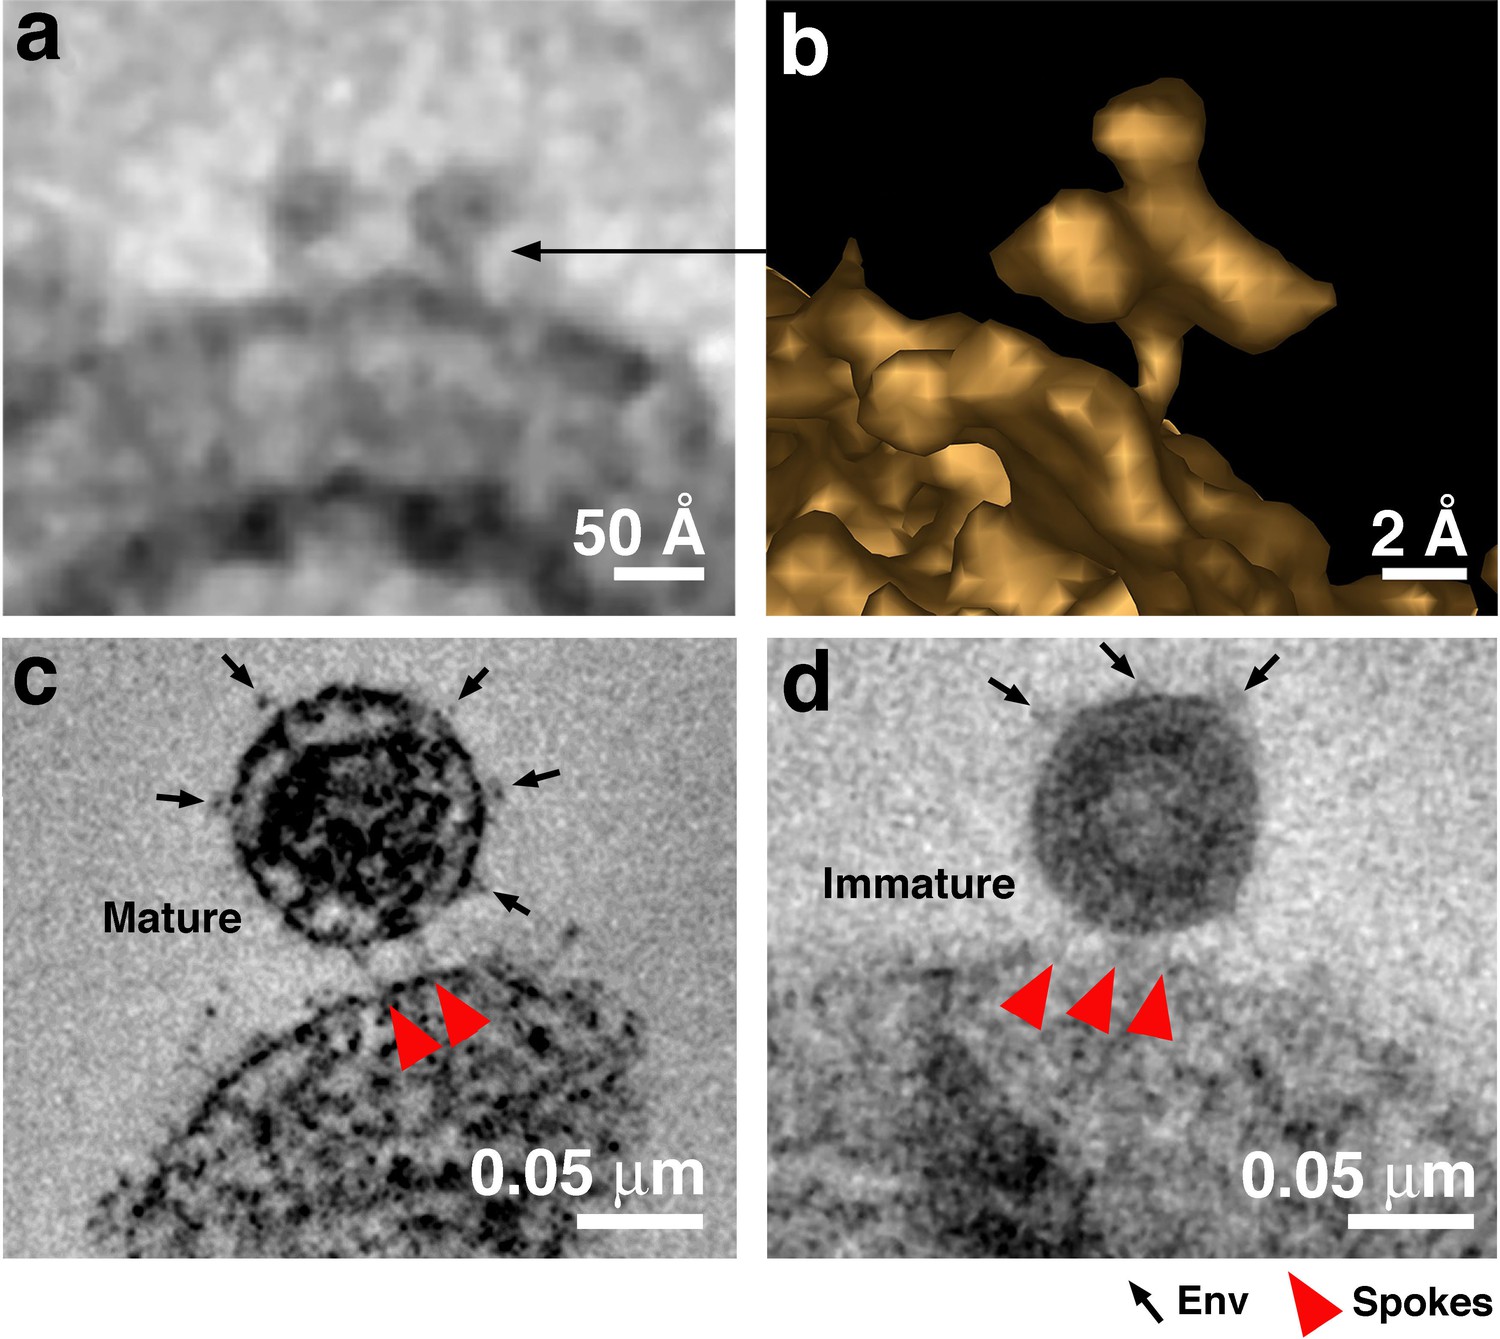
Free Env trimers can be visualized on attached virions.
(a) Example of densities observed for free HIV-1 Env trimers in a tomographic slice. (b) 3-D isosurface rendering of an individual free Env trimer. (c–d) Examples of attached mature (panel c) and immature (panel d) virions with free Env spikes distant from the attachment site indicated by arrows. Note that free Env trimer densities and spokes at an attachment site were only rarely optimally visualized in a single tomographic slice, thus Env trimers and spokes were identified from 3-D tomograms rather than 2-D tomographic slices.
Figure 5
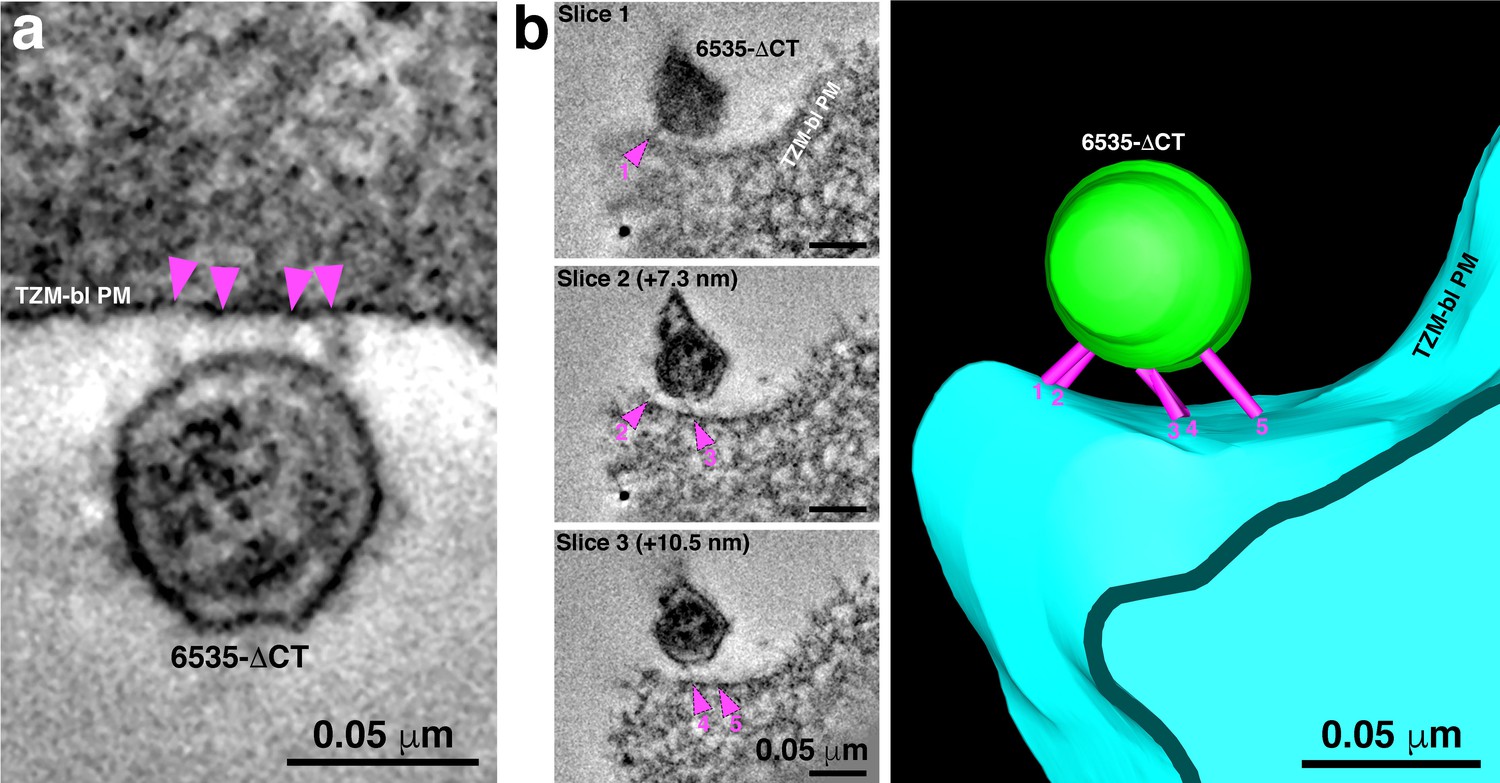
6535ΔCT pseudoviruses are often attached to target cells with more than 2–3 spokes.
(A) An example of a 6535ΔCT virion attached to the plasma membrane of a TZM-bl cell (cell and virus were treated with the T1249-Fc fusion inhibitor for 2 hr) by four distinct spokes (arrowheads). (B) An example shows a 6535ΔCT virion attached to the plasma membrane of a TZM-bl cell (cell and virus were treated with the T1249-Fc fusion inhibitor for 2 hr). Viewing the tomogram in a series of slices through the reconstruction (left panels) reveals five distinct spokes (magenta arrowheads) at different positions on the virus’ surface. 3-D model of the reconstruction (right) displays the five spokes (magenta) attaching the virion (green) to the TZM-bl plasma membrane (PM) (blue).
Videos
Video 1
Tomographic reconstruction of a mature HIV-1 pseudovirus attached to a TZM-bl cell surface by two narrow spokes.
In this experiment, the T1249-Fc inhibitor was incubated with cells and SC4226618 virus at 37 °C for 2 hr. The movie presents the full volume of a 3-D reconstruction, advances at 1-pixel (0.5 nm) increments, and then pauses briefly to indicate the spokes (red arrowheads). The cone-shaped viral core is distinguished within the virion, as are Env trimers on the virion surface. Scale bar = 0.05 μm.
Additional files
Download links
A two-part list of links to download the article, or parts of the article, in various formats.
Downloads (link to download the article as PDF)
Open citations (links to open the citations from this article in various online reference manager services)
Cite this article (links to download the citations from this article in formats compatible with various reference manager tools)
Electron tomography visualization of HIV-1 fusion with target cells using fusion inhibitors to trap the pre-hairpin intermediate
eLife 9:e58411.
https://doi.org/10.7554/eLife.58411


