circZNF827 nucleates a transcription inhibitory complex to balance neuronal differentiation
- Department of Molecular Biology and Genetics, Aarhus University, Denmark
- European Bioinformatics Institute (EMBL-EBI), European Molecular Biology Laboratory, Wellcome Genome Campus, Hinxton, United Kingdom
- Bioinformatics Research Centre, Aarhus University, Denmark
- Department of Clinical Medicine, Research Unit for Molecular Medicine, Aarhus University, Denmark
Figures
Figure 1 with 1 supplement
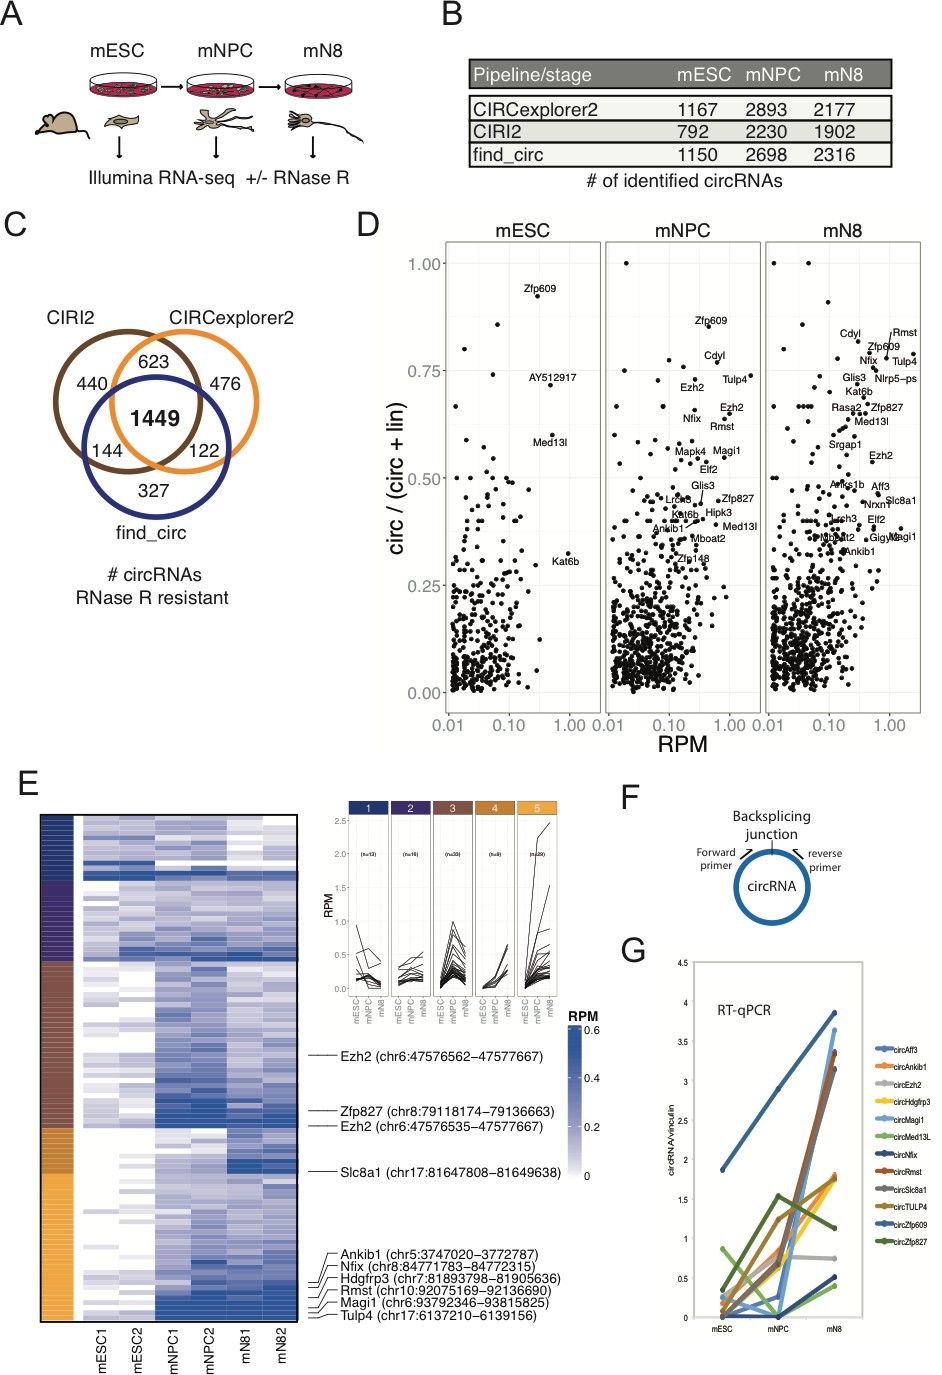
Determining the circRNA inventories of mESC, NPC and differentiated glutamatergic neurons and their differential regulation.
(A) Schematic illustration of workflow for differentiation and RNA-seq. (B) Number of circRNAs detected by indicated circRNA prediction algorithm in different stages. (C) Venn-diagram showing 1449 common circRNAs of a total of 3581 circRNAs predicted by the different algorithms (as indicated next to the diagram) that are either constant or enriched upon RNase R treatment. (D) circRNA/circRNA+linear precursor ratios as a function of expression level (RPM) at the three sequenced stages. (E) Left: Heatmap showing differential expression of top-100 expressed circRNAs (RPM scale to the right), with selected examples of circRNAs as indicated along with genomic coordinates (mm10). Top: K-means analysis displaying five different expression profiles during differentiation (same color code given to the left of the heatmap). (F) circRNA RT-qPCR strategy spanning the backsplicing junction. (G) RT-qPCR validaton of selected circRNAs. Data are depicted as mean ± SD (two biological replicates).
Figure 1—figure supplement 1

Mouse neuronal cell morphology, expression pattern of select markers and characteristics of circRNA inventory.
(A) Brightfield image of mESCs subjected to neuronal differention (neuron days 1, 3, and 8). (B) RT-qPCR on pluripotency and neuronal markers (Nanog, Nestin, Ntrk2, Tubb3, and Map2) at different stages in differentiation. (C) Quantification of RNase R resistant circRNAs. Fraction of either depleted, unaffected or enriched of total number of circRNAs upon RNase R treatment as a result of using indicated circRNA prediction algorithm. The red numbers in each column indicate the percentage of depleted ones. (D) Expression levels of depleted, unaffected or enriched circRNAs (RPM). (E) Distribution of length (nucleotides) of circRNA-flanking introns and introns found in host pre-mRNAs. (F) Frequency of inclusion of 5′ proximal exons in circRNAs. (G) Venn-diagram comparing previously identified mouse and human homologue circRNAs, isolated from mouse brain regions or cell lines of either murine or human origin, with circRNAs idenfied in the present study. Data are depicted as mean ± SD (two biological replicates).
Figure 2 with 3 supplements
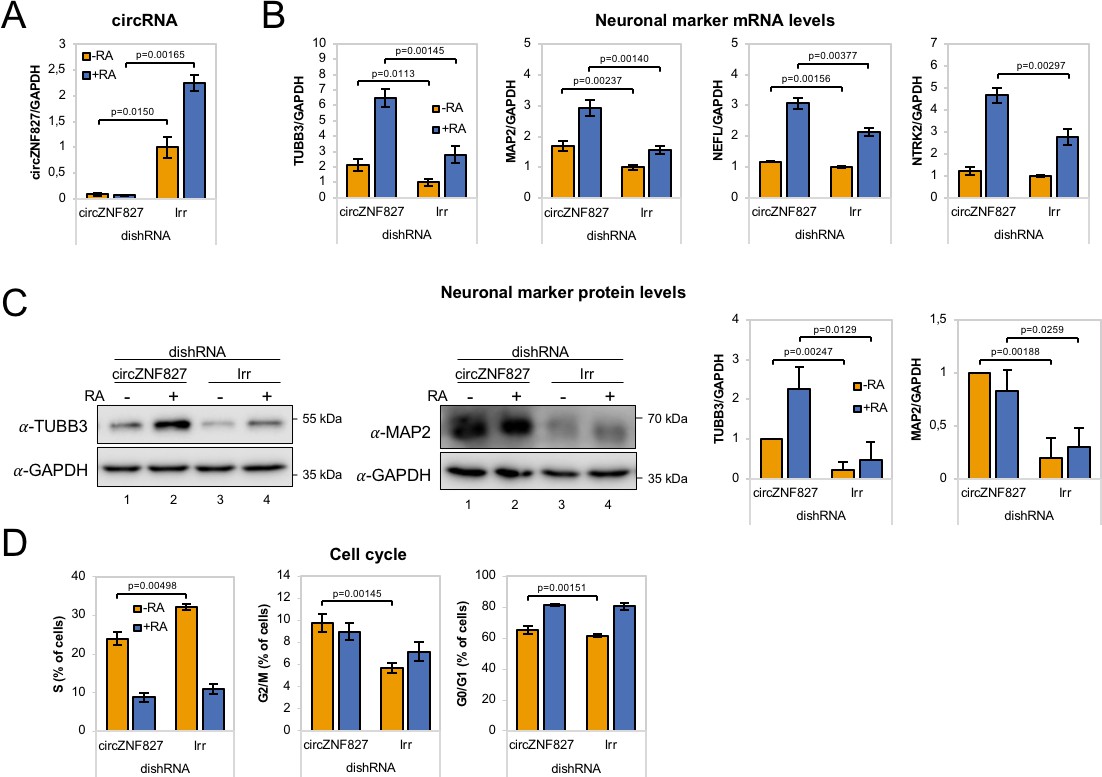
circZNF827 regulates neuronal marker expression levels.
(A) RT-qPCR analysis evaluating knockdown of circZNF827 with dicer-independent short hairpin RNAs (dishRNAs) in the neuroblastoma cell line L-AN-5. (B) Relative mRNA levels of the neuronal markers TUBB3, MAP2, NEFL, and NTRK2 evaluated by RT-qPCR upon knockdown of circZNF827. The mRNA expression levels were evaluated by RT-qPCR after 4 days of RA-mediated neuronal differentiation. (C) Western blotting (left panels) of TUBB3 and MAP2 upon circZNF827 knockdown. GAPDH was used as loading control. The results of quantification of band intensities from western blots are shown the right panels. One representative western blot and the quantification of three is shown. (D) Cell cycle assay based on flow cytometric measurements of EdU incorporation into newly synthesized DNA in L-AN-5 cells upon circZNF827 knockdown. +RA: differentiated L-AN-5 cells. -RA: undifferentiated L-AN-5 cells. Irr: Irrelevant dishRNA. In all panels, data are depicted as mean ± SD (three biological replicates). p-Values were determined by a two-tailed Student’s t test.
Figure 2—figure supplement 1

Evaluation of circZfp827/circZNF827 knockdown in different cell types and its impact on select neuronal marker expression.
(A) Evaluation of dishRNA-mediated knockdown efficiencies of circZfp827/circZNF827 in mESCs, P19 cells and SHSY-5Y cells by RT-qPCR. (B) Evaluation of mRNA expression levels of the neuronal markers TUBB3, MAP2, NEFL, and NTRK2 upon RA-mediated neuronal differentiation of SHSY-5Y cells by RT-qPCR. (C) Knockdown efficiencies of the circRNAs circSLC8A1, circHDGFRP3, circCDYL, circZNF609, circCAMSAP1, circUNC79, circANKIB1, and circTULP4 in L-AN-5 cells measured by RT-qPCR using circRNA-specific primers. +RA: differentiated L-AN-5 cells. -RA: undifferentiated L-AN-5 cells. Irr: Irrelevant dishRNA. Data are depicted as mean ± SD (three biological replicates).
Figure 2—figure supplement 2

mRNA levels of neuronal markers upon circRNA knockdown.
(A) mRNA expression levels of the neuronal markers TUBB3, MAP2, NTRK2, and NEFL upon circRNA knockdown in L-AN-5 cells evaluated by RT-qPCR. (B) Validation of linear ZNF827 (linZNF827) mRNA levels upon knockdown of circZNF827 in L-AN-5 cells. +RA: differentiated L-AN-5 cells. -RA: undifferentiated L-AN-5 cells. Irr: Irrelevant dishRNA. Data are depicted as mean ± SD (three biological replicates).
Figure 2—figure supplement 3

Flow cytometric gating strategy and raw data from cell cycle assay.
Figure 3 with 1 supplement
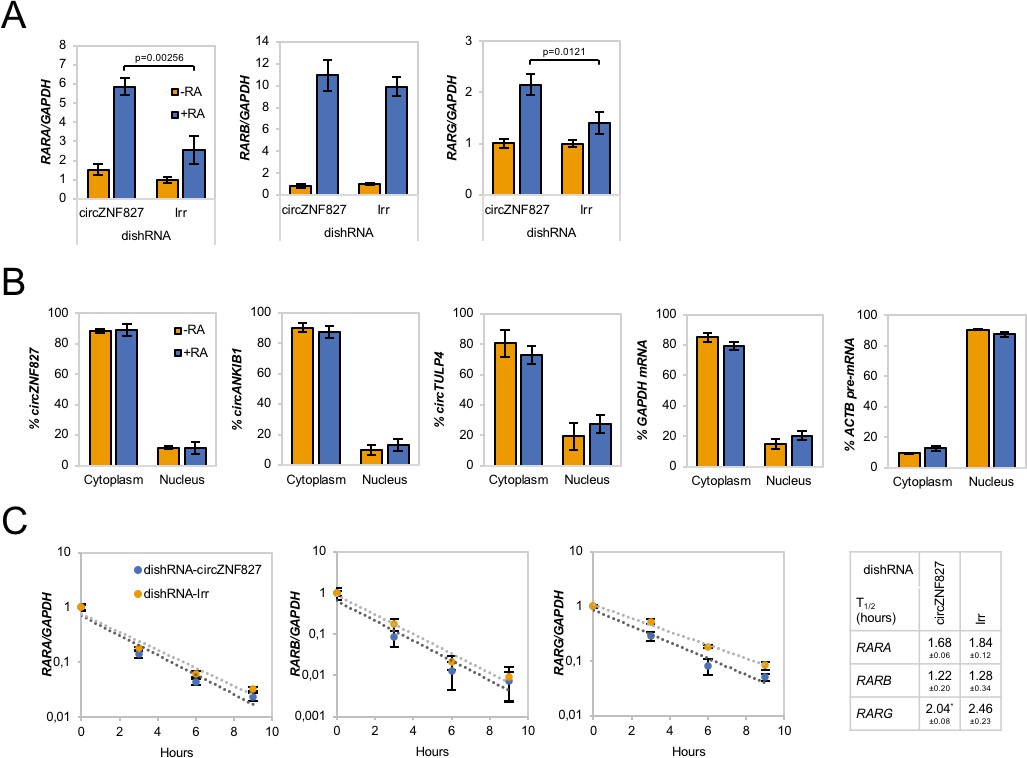
Increased RAR expression upon circZNF827 knockdown.
(A) mRNA expression levels of the RAR receptors RARA, RARB, and RARG in L-AN-5 cells upon circZNF827 knockdown evaluated by RT-qPCR. (B) Subcellular localization of the circRNAs circZNF827, circANKIB1, and circTULP4 examined by RT-qPCR after fractionation of differentiated L-AN-5 cells into cytoplasmic and nuclear fractions. GAPDH mRNA and ACTB pre-mRNA levels was used for validation of the purity of the cytoplasmic and nuclear fractions. (C) BrU pulse-chase mRNA decay assay evaluating decay rates of RAR mRNAs upon circZNF827 knockdown. The RAR mRNA expression levels were evaluated by RT-qPCR. In right panel, half-lives of the RARs obtained in the experiment are indicated. +RA: differentiated L-AN-5 cells. -RA: undifferentiated L-AN-5 cells. Irr: Irrelevant dishRNA. In all panels data are depicted as mean ± SD (three biological replicates). p-Values were determined by a two-tailed Student’s t test.
Figure 3—figure supplement 1

RAR mRNA transcription rates estimated after BrU-labeling of newly synthesized RNA in differentiated L-AN-5 cells by RT-qPCR.
Irr: Irrelevant dishRNA. Data are depicted as mean ± SD (three biological replicates). p-Values were determined by a two-tailed Student’s t test.
Figure 4 with 1 supplement
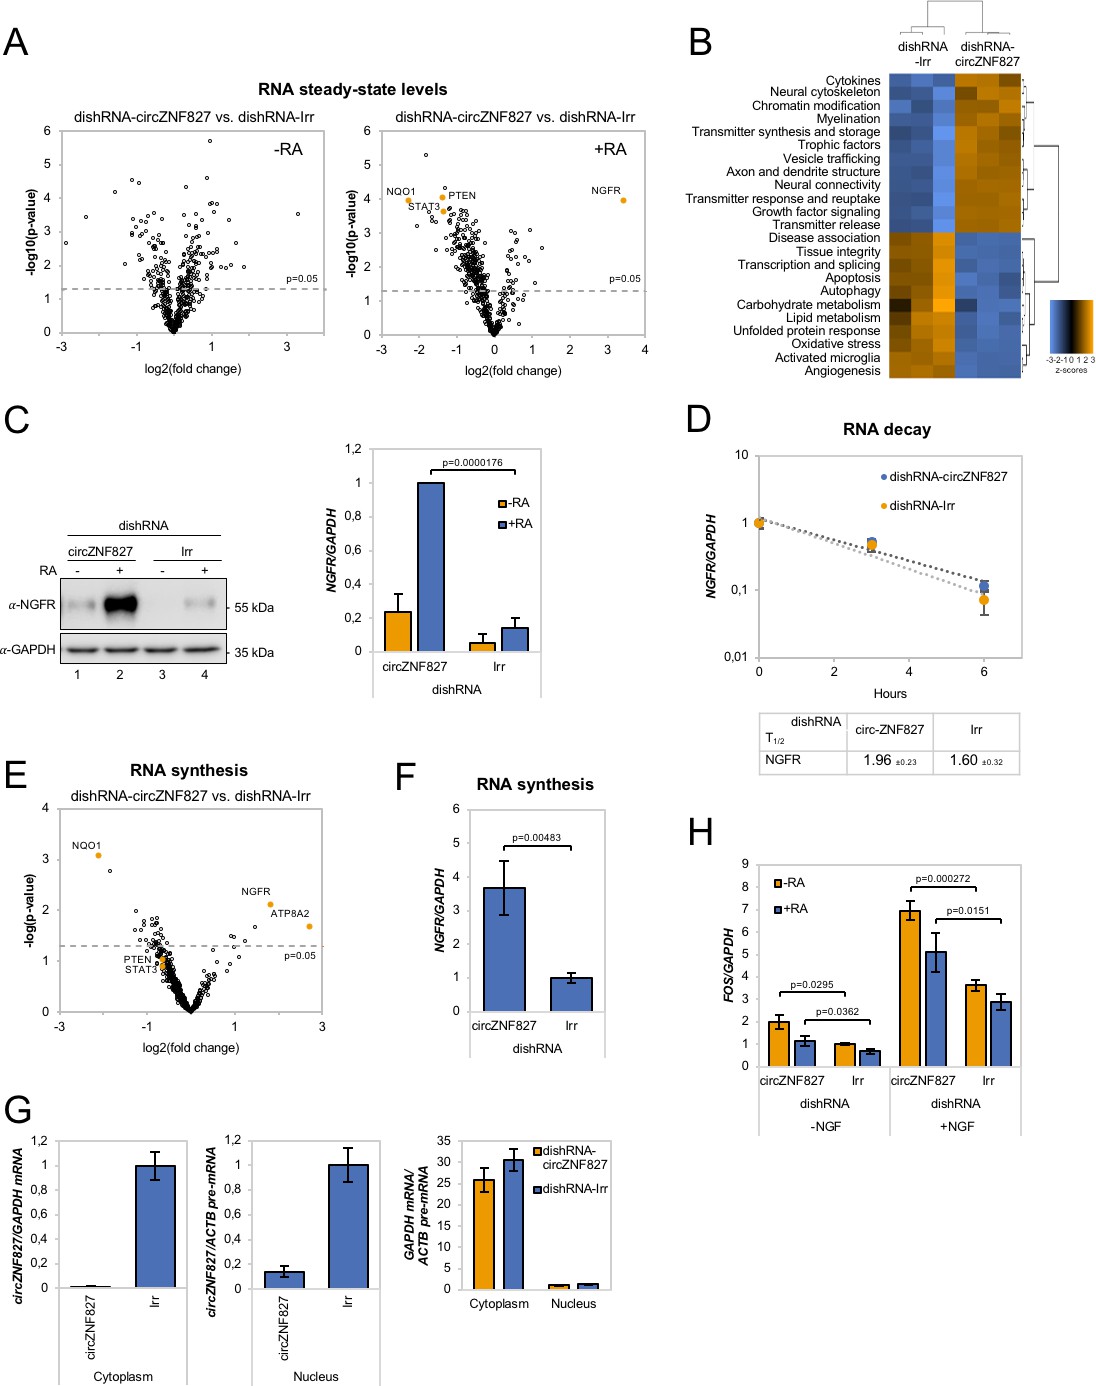
circZNF827 regulates NGFR expression.
(A) Volcano plot based on a Nanostring analysis of the expression of ~800 neuropathology-related genes upon circZNF827 knockdown in L-AN-5 cells vs control without RA treatment (left panel) or with RA treatment (right panel). (B) GO-term analysis based on genes found differentially expressed by the Nanostring analysis upon circZNF827 knockdown in differentiated L-AN-5 cells. (C) Western blotting (left panel) of NGFR upon circZNF827 knockdown in L-AN-5 cells. GAPDH was used as loading control. The result of quantification of band intensities from the western blots is shown in the right panel. One representative western blot and the quantification of three is shown. (D) BrU pulse-chase mRNA decay assay evaluating decay rates of NGFR mRNAs upon circZNF827 knockdown. In the bottom panel, the half-lives of NGFR obtained in the experiment are indicated. (E) Volcano plot showing mRNAs with changed synthesis rates estimated after BrU-labeling of newly synthesized RNA by Nanostring analysis using the neuropathology panel. (F) RT-qPCR-based validation of the Nanostring analysis shown in (E). (G) Evaluation of circZNF827 knockdown in L-AN-5 cells after subcellular fractionation into nuclear and cytoplasmic RNA fractions by RT-qPCR. GAPDH mRNA and ACTB pre-mRNA levels was used for validation of the purity of the cytoplasmic and nuclear fractions. (H) FOS mRNA levels evaluated by RT-qPCR after circZNF827 knockdown and NGF stimulation of L-AN-5 cells. +RA: differentiated L-AN-5 cells. -RA: undifferentiated L-AN-5 cells. Irr: Irrelevant dishRNA. Data are depicted as mean ± SD (three biological replicates). (D–F) One representative western blot is shown. p-Values were determined by a two-tailed Student’s t test.
Figure 4—figure supplement 1
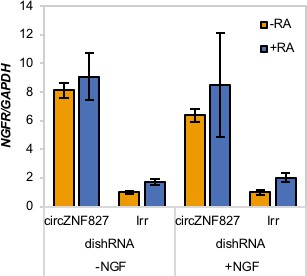
NGFR mRNA expression upon circZNF827 knockdown in NGF-stimulated L-AN-5 cells.
-RA: undifferentiated L-AN-5 cells. Irr: Irrelevant dishRNA. RT-qPCR data are depicted as mean ± SD (three biological replicates).
Figure 5 with 1 supplement
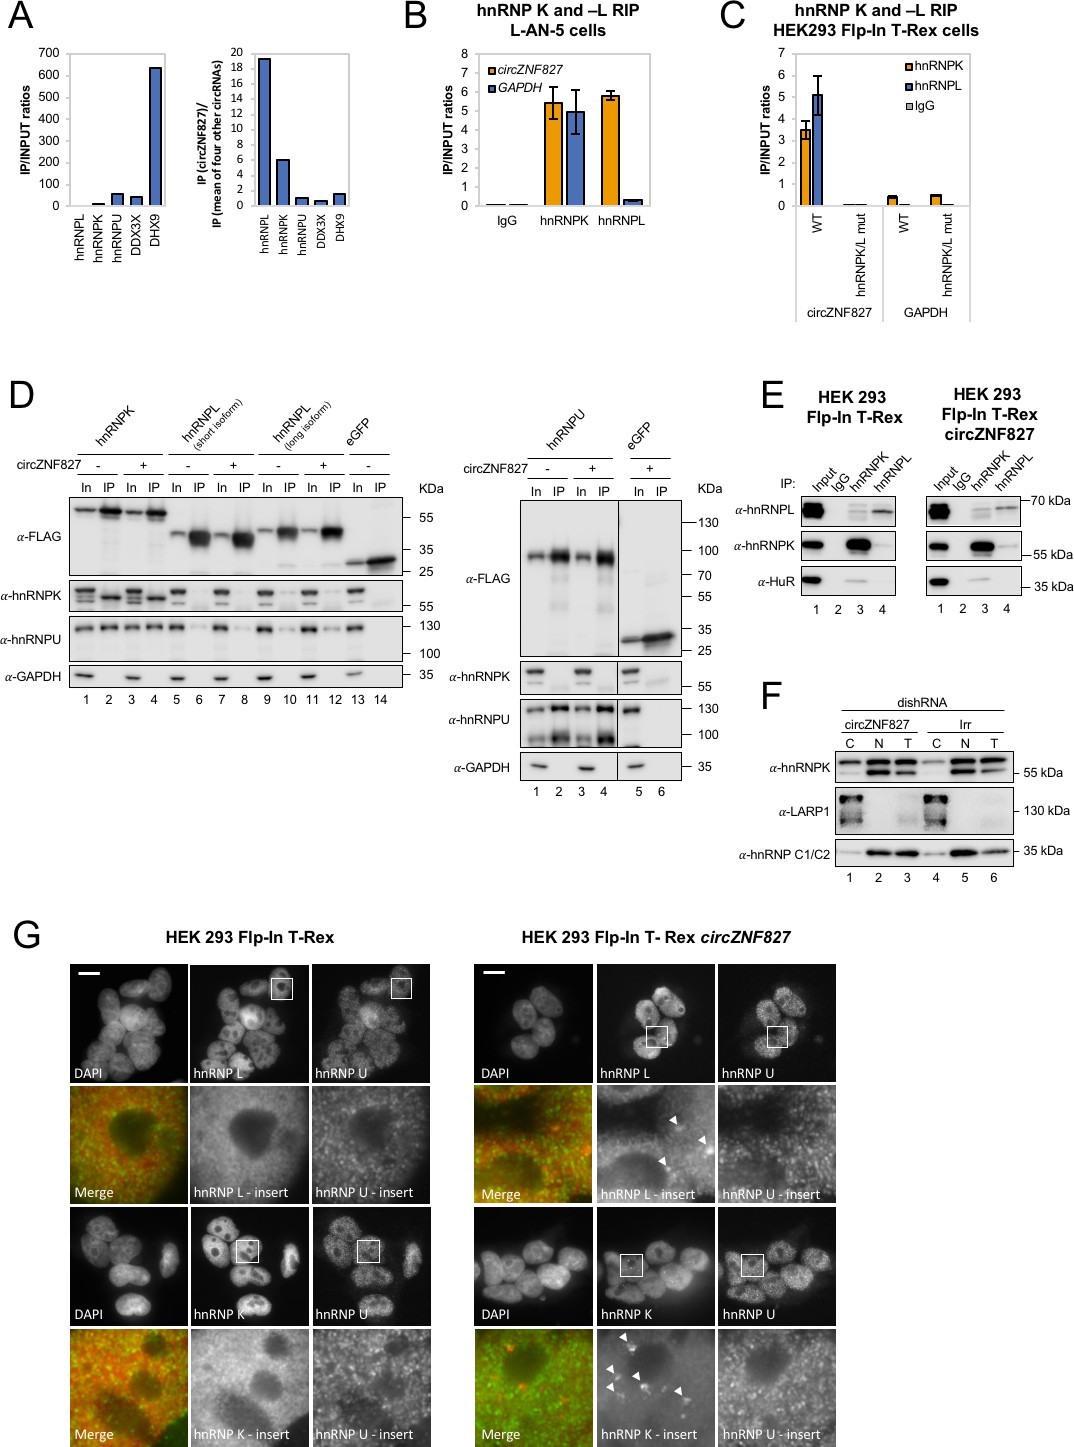
circZNF827 interacts with and regulates the subcellular localization of hnRNP K and -L.
(A) circRNA-RBP complex isolation from differentiated L-AN-5 cells followed by protein identification using mass spectrometry (LC-MS/MS). IP/Input ratios (based on IBAQ values) for selected RBPs (hnRNP L, hnRNP L, hnRNP U, DDX3X and DHX9) pulled down by circZNF827 are shown in left panel. In the right panel IP ratios of selected RBPs pulled down by circZNF827 relative to IP ratios for four other circRNAs (circTULP4, circHDGFRP3, circSLC8A1, and circZNF609) are shown. (B) RIP experiment evaluating interaction between circZNF827 and hnRNP K and -L in differentiated L-AN-5 cells. (C) RIP experiment evaluating interaction between both wildtype circZNF827 (WT) and circZNF827 with a deletion of predicted hnRNPK/L binding sites (hnRNPK/L mut) and hnRNP K and -L in the HEK293 Flp-In T-rex circZNF827 cell lines. Co-immunoprecipitation (co-IP) of both exogenously FLAG-tagged (D) and endogenously (E) expressed hnRNP K, -L and -U in HEK293 Flp-In T-rex cells with and without circZNF827 expression. GAPDH and HuR were used as loading controls in (D) and (E) respectively. (F) Western blot evaluating subcellular localization of hnRNP K in differentiated L-AN-5 cells upon circZNF827 knockdown. LARP1 and hnRNP C1/C2 were used for validation of the purity of the cytoplasmic and nuclear fractions. (G) Co-immunofluorescence (co-IF) of hnRNP K, -L and -U in HEK293 Flp-In T-rex cells upon circZNF827 overexpression. Arrows are pointing to hnRNP K- and hnRNP L-containing nuclear foci. Nuclei were visualized by DAPI staining. The scale bar indicates 10 μm. Irr: Irrelevant dishRNA. C: cytoplasmic fraction, N: nuclear fraction, T: total cell lysate. Data are depicted as mean ± SD (three biological replicates). (B), (E), and (H) One representative western blot is shown. Data shown in (A) and (C) are based on two and one replicates, respectively.
Figure 5—figure supplement 1

Mapping hnRNP K and hnRNP L binding sites within circZNF827.
(A) Silver stain of circRNA-pull down samples analyzed by LC-MS/MS. The negative controls included are circRNA templates transcribed without biotin-CTP (circTULP4 neg and circZNF827 neg). The CTC is a lincRNA with a known binding profile included as reference. (B–C) Prediction of hnRNP K and -L binding sites in the most 3′ part of the circZNF827-encoding sequence by RBPmap. (D) MFold prediction of the secondary structure of circZNF827 shown with the predicted hnRNP K- and -L-binding sites. Dark gray letters in (C) and dark gray dotted line in (D) indicates the deleted sequence in the circZNF827 hnRNPK/L mutant. (E) Schematic drawing of the stable HEK293 Flp-In T-rex cell-line for Laccase2 vector-based expression of circZNF827 from a tetracycline-inducible promoter (CMV tet-on). (F) Northern blot showing induction profile for circZNF827, circZNF27 hnRNPK/L mut, and circZNF827 2xMS2 expression in the stable HEK293 Flp-In T-rex circZNF827 cell lines. Notably, all circZNF827 variants are shown to be RNase R resistant, whereas the linear loading control (ACTB mRNA) is RNase R sensitive. SS: splice site, BSJ: back splice junction.
Figure 6 with 1 supplement
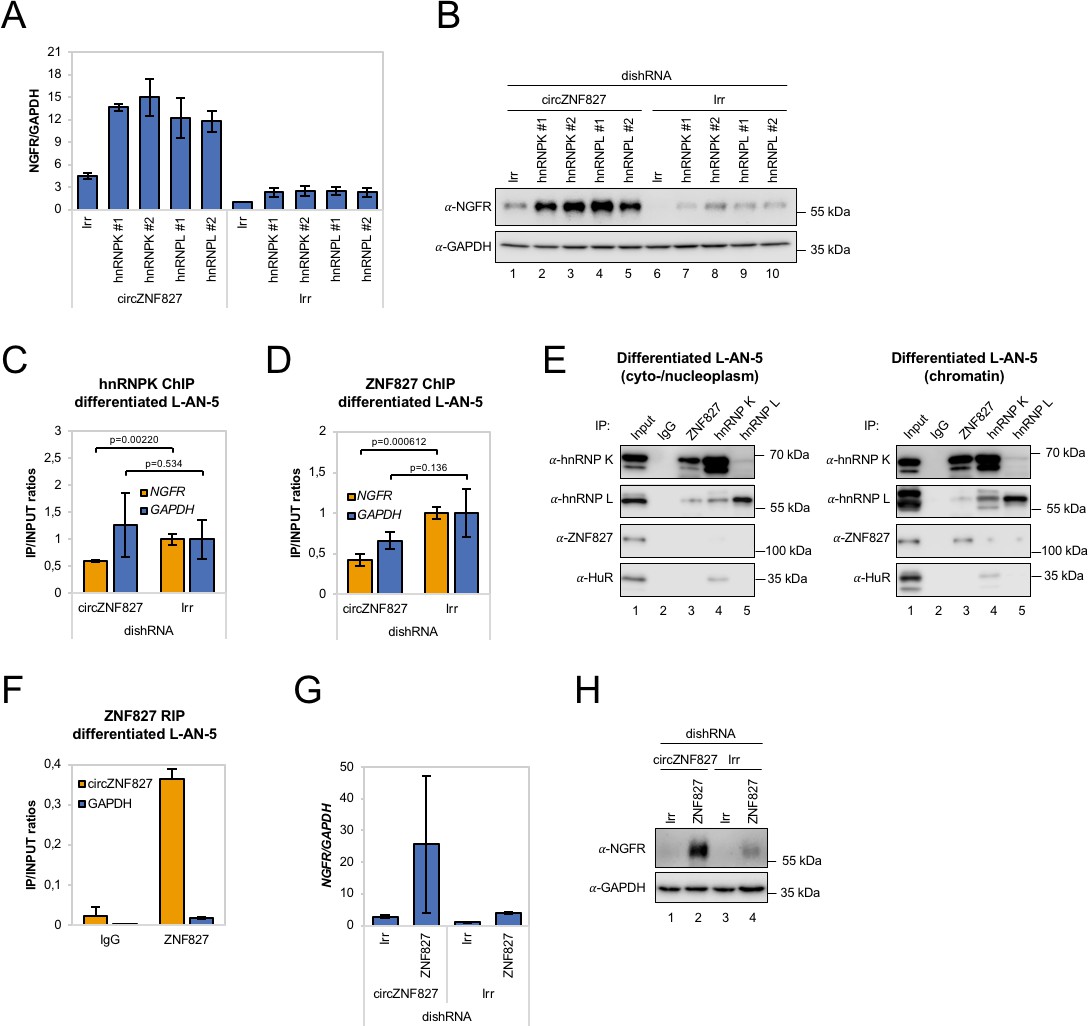
circZNF827 regulates hnRNP K and ZNF827 activity in L-AN-5 cells.
RT-qPCR (A) and western blotting (B) evaluating NGFR expression upon co-knockdown of circZNF827 and either hnRNP K or -L in differentiated L-AN-5 cells. GAPDH was used as loading control for the western blots. #1 and #2: two different dishRNAs targeting the same RBP. ChIP experiment assessing association between the NGFR gene and hnRNP K (C) and ZNF827 (D) upon circZNF827 knockdown in differentiated L-AN-5 cells. (E) Co-immunoprecipitation (co-IP) of ZNF827, hnRNP K, -L and ZNF827 in cyto-/nucleoplasm (left) or chromatin fractions (right; sonicated pellets from cleared lysates) of differentiated L-AN-5 cells. IgG was used as IP control. HuR was used as negative control. (F) RNA-immunoprecipitation of circZNF827 by ZNF827 in differentiated L-AN-5 cells. RT-qPCR (G) and western blotting (H) evaluating NGFR expression upon co-knockdown of circZNF827 and ZNF827 in differentiated L-AN-5 cells. GAPDH was used as loading control for the western blots. Irr: Irrelevant dishRNA. Data are depicted as mean ± SD (three biological replicates). p-Values were determined by a two-tailed Student’s t test.
Figure 6—figure supplement 1

Knockdown and ChIP analyses of ZNF827 and hnRNP K/-L associated with results shown in Figure 6A–B.
(A) Quantification of circZNF827 levels by RT-qPCR. Protein levels are evaluated by Western blotting in (B). GAPDH was used as loading control for the western blots. Representative Western blot is shown. #1 and #2: two different dishRNAs targeting the same RBP. (C) ChIP-seq data (ENCODE consortium) in K562 and HepG2 cells showing interaction between hnRNP K and the NGFR promoter. Y-axis displays enrichment (fold change (FC)) over control. (D) ChIP experiment assessing association between the RARA gene and hnRNP K (left) and ZNF827 (right) upon circZNF827 knockdown in differentiated L-AN-5 cells. (E) Validation of circZNF827 (left) and ZNF827 (right) knockdown associated with results shown in Figure 6G–H by RT-qPCR. Irr: Irrelevant dishRNA. Data are depicted as mean ± SD (three biological replicates). p-Values were determined by a two-tailed Student’s t test.
Figure 7 with 1 supplement
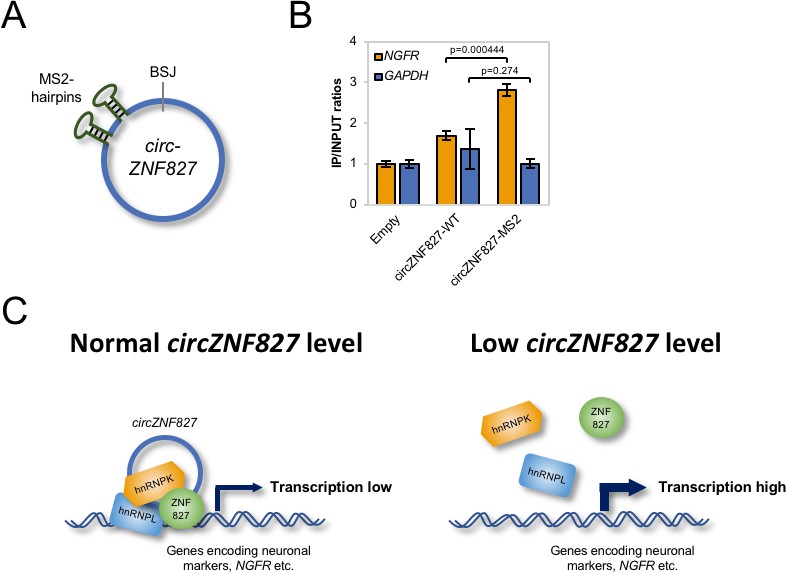
circZNF827 is associated with the NGFR promoter region.
(A) Schematic representation of circZNF827 tagged with two MS2 hairpins. (B) ChIP experiment assessing association between the NGFR gene and circZNF827 in HEK293 Flp-In T-rex cell lines expressing etiher wildtype circZNF827 (circZNF827-WT) or MS2-tagged circZNF827 (circZNF827-MS2). (C) Model illustrating how circZNF827, hnRNP K/- L and ZNF827 regulates target gene expression. Target genes, e.g. NGFR is bound by a transcription repressive complex consisting of circZNF827, hnRNP K, hnRNP L and ZNF827. High levels of circZNF827, induced by neuronal differentiation keeps further differentiation markers in check (left panel), while knockdown of circZNF827 (or hnRNP K/L or ZNF827) allows for higher transcription rates of target neuronal marker genes including NGFR. Data in (C) are depicted as mean ± SD (three biological replicates).
Figure 7—figure supplement 1
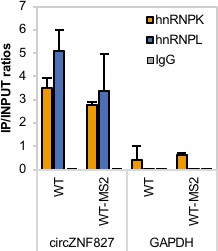
hnRNP K and - L interact with both wildtype and MS2-hairpin-modifed circZNF827.
RIP experiment evaluating interaction between both wildtype circZNF827 (WT) and MS2-tagged circZNF827 with a (WT-MS2) and hnRNP K and -L in the HEK293 Flp-In T-rex circZNF827 cell lines. IgG was used as IP control. Data are depicted as mean ± SD (three biological replicates).
Additional files
-
Supplementary file 1
Table of high-confidence circRNAs identified in the stages mESC, NPC and N8 neurons.
Genomic coordinates and overlapping gene symbols are given along with expression level (RPM) at the indicated stage.
- https://cdn.elifesciences.org/articles/58478/elife-58478-supp1-v1.xlsx
-
Supplementary file 2
Lists of candidate circRNAs, differentially regulated genes upon circZNF827 knockdown, oligonucleotides and antibodies used in the study.
(a) List of circRNA candidates selected for knockdown in L-AN-5 cells and their respective mouse homologues. (b) List of differentially regulated genes (>2 fold change, p<0.05) assessed by nanoString hybridization (+/- BrU labeling), when comparing control (Irr) vs. circZNF827 knockdown (+/- RA). (c-e) List of oligonucleotides used in the study. (f) List of antibodies used in the study.
- https://cdn.elifesciences.org/articles/58478/elife-58478-supp2-v1.xlsx
-
Transparent reporting form
- https://cdn.elifesciences.org/articles/58478/elife-58478-transrepform-v1.pdf
Download links
A two-part list of links to download the article, or parts of the article, in various formats.
Downloads (link to download the article as PDF)
Open citations (links to open the citations from this article in various online reference manager services)
Cite this article (links to download the citations from this article in formats compatible with various reference manager tools)
circZNF827 nucleates a transcription inhibitory complex to balance neuronal differentiation
eLife 9:e58478.
https://doi.org/10.7554/eLife.58478


