Phagocytic glia are obligatory intermediates in transmission of mutant huntingtin aggregates across neuronal synapses
- Department of Biological Sciences, University of the Sciences, United States
- Program in Neuroscience, University of the Sciences, United States
- Department of Biology, Stanford University, United States
- Howard Hughes Medical Institute, Stanford University, United States
Figures
Figure 1 with 4 supplements
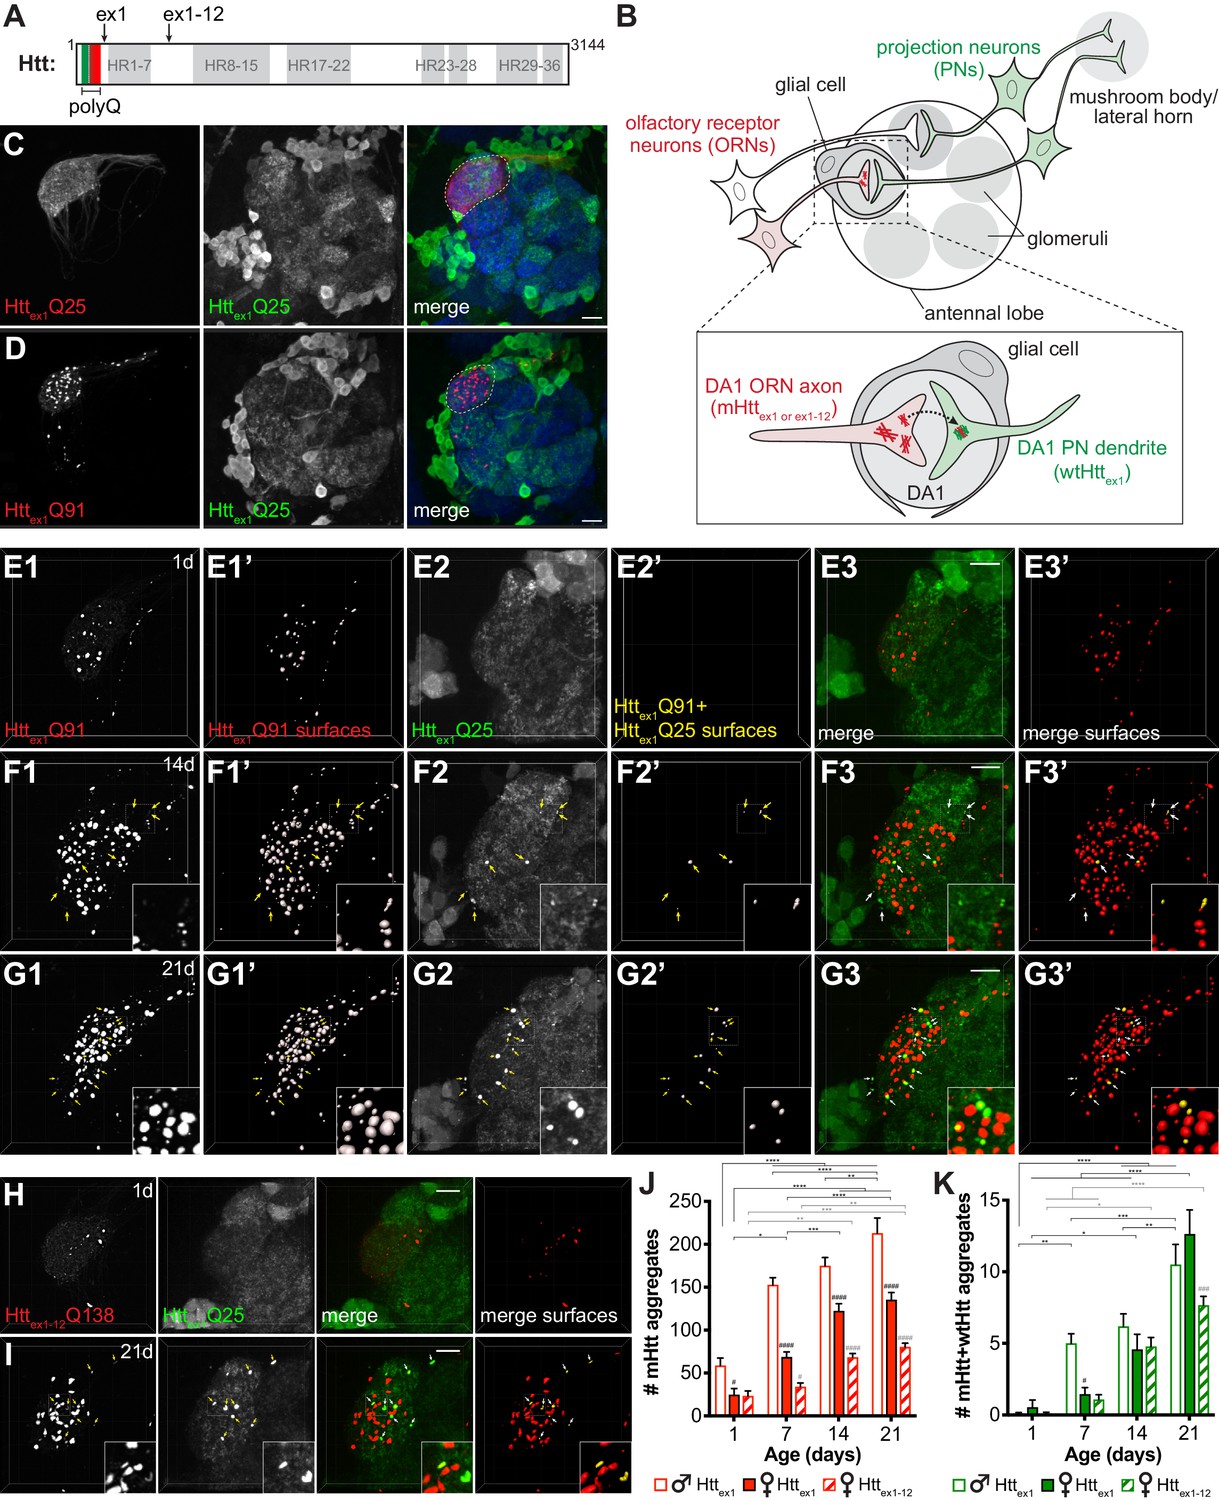
mHttex1 or mHttex1-12 aggregates formed in presynaptic ORNs induce the aggregation of wtHttex1 expressed in postsynaptic PNs.
(A) Primary structure of full-length human Htt (3144 amino acids), including HEAT repeats (HR, gray regions) and the N-terminal variable-length polyQ region (green/red box), with the pathogenic threshold (~Q37) indicated by a white dotted line. C-termini of two N-terminal mHtt fragments used in this study (Httex1 and Httex1-12) are indicated. (B) Overall experimental approach. In the fly olfactory system, ORNs synapse with PNs in discrete regions of the antennal lobe known as glomeruli (gray circles). PNs send axons into higher brain centers (i.e., mushroom body and/or lateral horn). Draper-expressing glial cells project processes in the antennal lobe, where they ensheath individual glomeruli. To monitor spreading of mHtt aggregates between synaptically-connected ORNs and PNs, we generated transgenic flies that express mHttex1 or mHttex1-12 fragments in DA1 ORNs and wtHttex1 in DA1 PNs. Inset: Transfer of mHttex1 or mHttex1-12 aggregates between ORNs and PNs was assessed by monitoring the solubility and colocalization of mHtt and wtHtt fluorescent signals. (C and D) Maximum intensity z-projections of antennal lobes from 7 day-old adult males expressing either Httex1Q25-mCherry (C) or Httex1Q91-mCherry (D) in DA1 ORNs using Or67d-QF and Httex1Q25-GFP in GH146+ PNs using GH146-Gal4. Raw data are shown in grayscale for individual channels and pseudocolored in merged images. Merged images include Bruchpilot immunofluorescence in blue to mark neuropil, which was used to approximate the boundaries of the DA1 glomerulus (white dotted lines). Scale bars = 20 μm. (E–G) High-magnification confocal z-stacks of DA1 glomeruli from 1 day-old (E), 14 day-old (F), and 21 day-old (G) adult males expressing Httex1Q91-mCherry in DA1 ORNs and Httex1Q25-GFP in GH146+ PNs. Boxed regions in (F and G) are shown at higher magnification in insets. Raw data are shown in grayscale in individual channels (Httex1Q91: E1, F1, G1; Httex1Q25: E2, F2, G2) and pseudocolored in merged images (E3, F3, G3). mCherry+ ‘Httex1Q91 surfaces’ (E1’, F1’, G1’) and ‘Httex1Q91+Httex1Q25 surfaces’ (E2’, F2’, G2’) identified by semi-automated image segmentation are shown adjacent to raw data and pseudocolored red and yellow, respectively, in the ‘merged surfaces’ images (E3’, F3’, G3’). Arrows (yellow on grayscale images, white on merged images) indicate Httex1Q91+Httex1Q25 surfaces. Scale bars = 10 μm. (H and I) Confocal z-stacks from 1 day-old (H) and 21 day-old (I) adult females expressing RFP-Httex1-12Q138 in DA1 ORNs and Httex1Q25-GFP in GH146+ PNs. Boxed region in (I) is shown at higher magnification in insets. RFP+ surfaces identified by semi-automated image segmentation are shown in the last column, with Httex1-12Q138-only surfaces in red and Httex1-12Q138+Httex1Q25 surfaces in yellow. Scale bars = 10 μm. (J and K) Numbers of Httex1Q91 or Httex1-12Q138 (‘mHtt’) surfaces (J) and Httex1Q91+Httex1Q25 or Httex1-12Q138+Httex1Q25 (‘mHtt+wtHtt’) surfaces (K) identified in adult males (open bars) or females (solid bars) expressing Httex1Q91-mCherry in DA1 ORNs or adult females expressing RFP-Httex1-12Q138 in DA1 ORNs (striped bars) at the indicated ages. Data are shown as mean ± SEM; *p<0.05, **p<0.01, ***p<0.001, or ****p<0.0001 by two-way ANOVA followed by Tukey’s multiple comparisons tests. ‘*’s indicate statistical significance comparing flies of the same genotype and sex at different ages (black ‘*’s compare males or females expressing Httex1Q91, and gray ‘*’s compare females expressing Httex1-12Q138 over time). ‘#’s indicate statistical significance comparing different genotypes at the same age (black ‘#’s compare males vs females expressing Httex1Q91, and gray ‘#’s compare females expressing Httex1Q91 vs females expressing Httex1-12Q138).
Figure 1—figure supplement 1
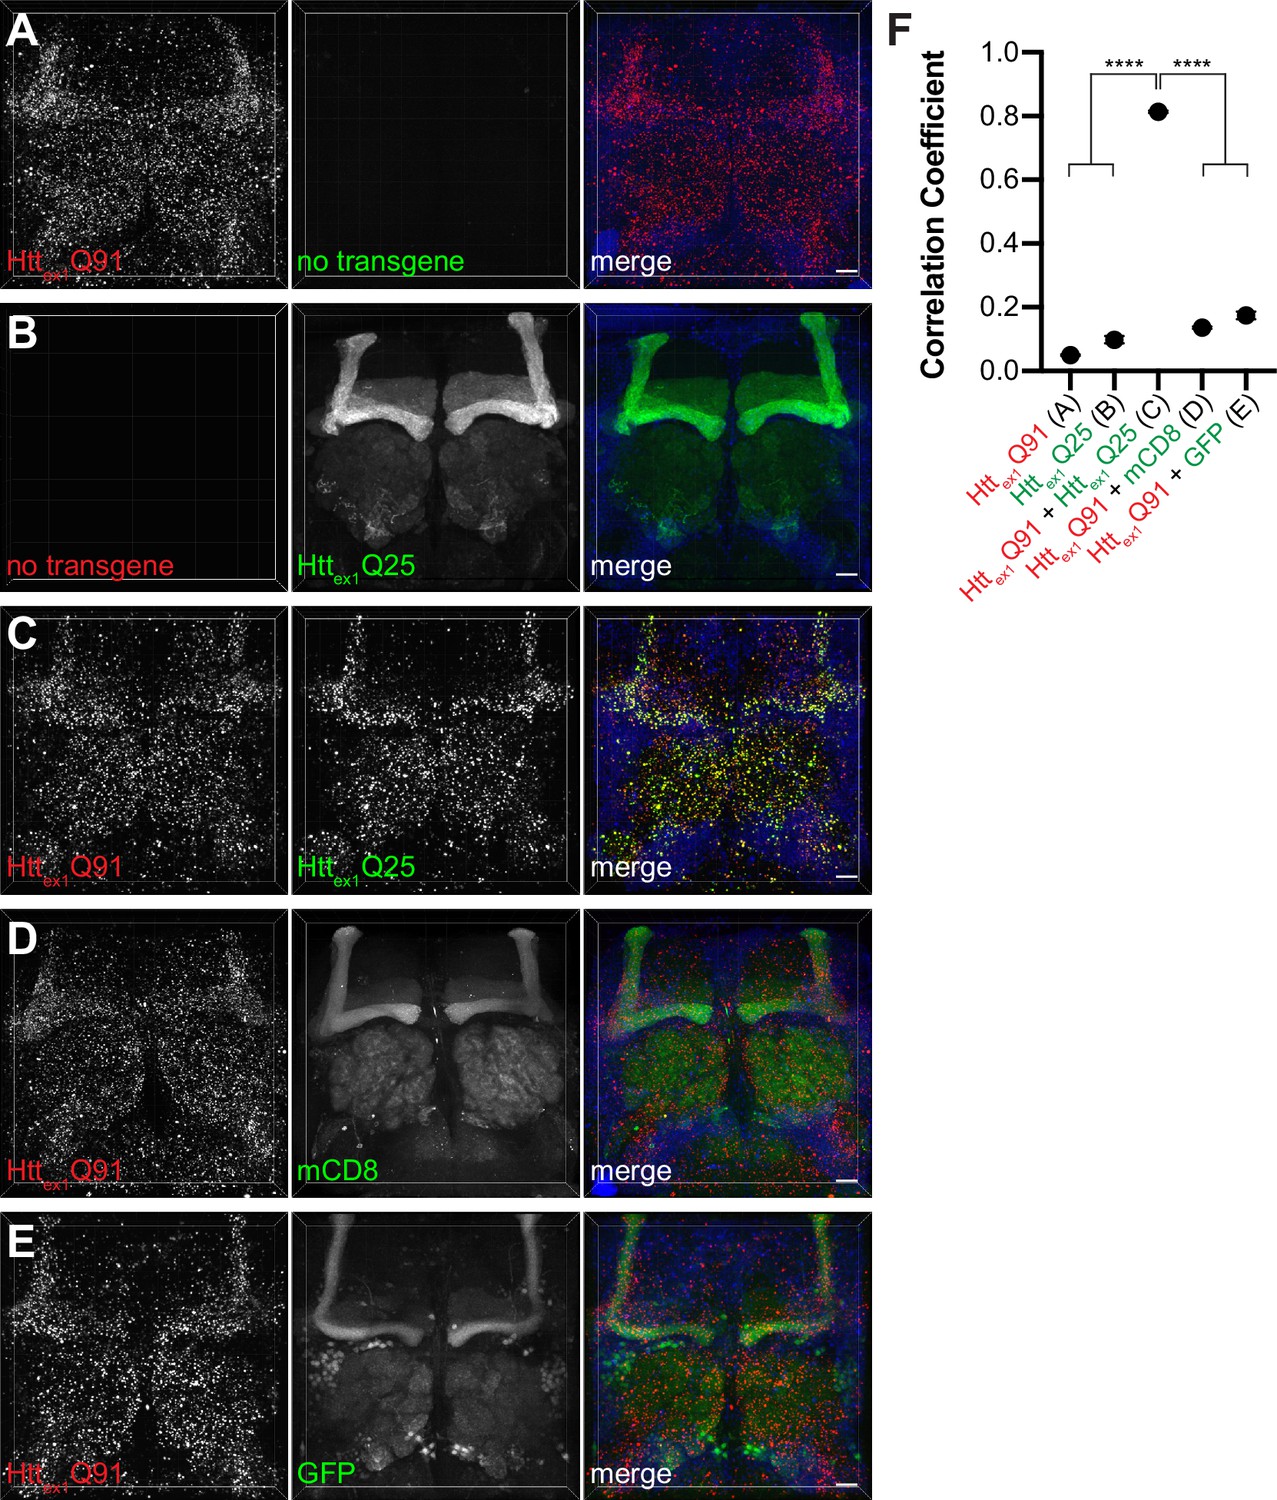
mHttex1 nucleates prion-like conversion of wtHttex1 in fly neurons.
(A–E) Confocal z-stacks of 14 day-old adult female brains expressing (A) Httex1Q91-mCherry or (B) Httex1Q25-GFP alone, or co-expressing Httex1Q91-mCherry with (C) Httex1Q25-GFP, (D) membrane-targeted mCD8-GFP, or (E) soluble GFP in all neurons using elav[C155]-Gal4. Dimensions of each confocal stack are 250 × 250 x~60 (xyz) μm. Merged images include DAPI signal (blue) to label nuclei. Scale bars = 20 μm. (F) Colocalization of mCherry and GFP fluorescent signals calculated as Pearson’s correlation coefficients for genotypes shown in (A–E). Data are shown as mean ± SEM; ****p<0.0001 by one-way ANOVA with Tukey’s multiple comparisons test.
Figure 1—figure supplement 2

Semi-automatic quantification of seeded wtHttex1 aggregates.
(A and B) Semi-automatic image processing workflow for high-magnification confocal z-stacks of DA1 glomeruli from 14 day-old adult males expressing Httex1Q91-mCherry in DA1 ORNs and either (A1,2) Httex1Q25-GFP or (B1,2) mCD8-GFP in GH146+ PNs. Raw data were preprocessed by deconvolution to reduce noise (top panels), segmented in the mCherry (A1 and B1) or GFP (A2 and B2) channels (middle panels), and filtered for co-localizing fluorescence signal in the other channel (bottom panels). Arrows in (A1 and A2) indicate seven Httex1Q91+Httex1Q25 puncta identified by this method. Scale bars = 10 μm. (C1-7) Selected single 0.35 μm z-slices from the same confocal stack shown in (A1 and A2). Slice number is indicated at the top right of each image. Individual Httex1Q91+Httex1Q25 puncta identified by semi-automated image segmentation in (A) are indicated with arrows (yellow in individual channels, white on merged images) in each slice. Two additional co-localized Httex1Q91+Httex1Q25 puncta identified by manual counting are indicated with asterisks in (C2). Scale bars = 10 μm. Insets show Httex1Q91+Httex1Q25 puncta at higher zoom (inset dimensions = 9.12 μm x 9.12 μm). Httex1Q91-mCherry (red) and Httex1Q25-GFP (green) fluorescence intensity profiles for lines indicated in merged insets are shown below images. Lines were scanned from leftmost to rightmost point. (D) Comparison of manual quantification (C) vs semi-automated segmentation approaches (A1 and A2) for 14 day-old males with the same genotype in (A and C). Data are shown as mean ± SEM; 'n.s.' = not significant by one-way ANOVA followed by Tukey’s multiple comparisons test.
Figure 1—figure supplement 3
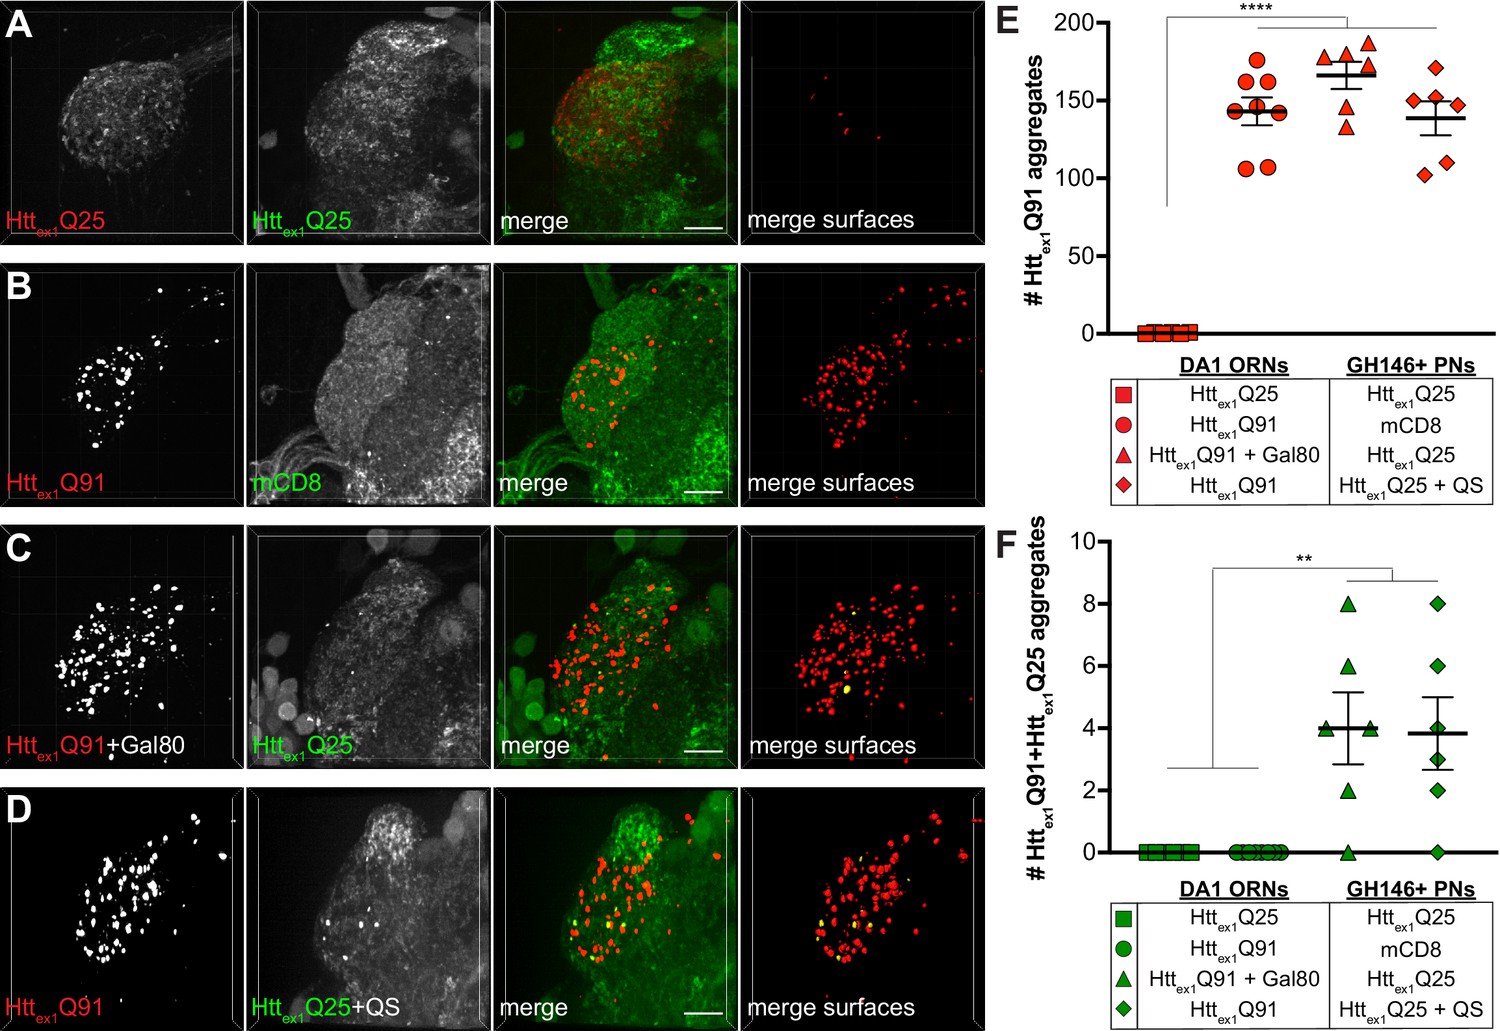
Controls for prion-like transmission of mHttex1 aggregates from presynaptic DA1 ORNs to postsynaptic PNs.
(A–D) Confocal z-stacks of DA1 glomeruli from 10 day-old adults expressing (A) Httex1Q25-mCherry in DA1 ORNs and Httex1Q25-GFP in GH146+ PNs, (B) Httex1Q91-mCherry in DA1 ORNs and mCD8-GFP in GH146+ PNs, (C) Httex1Q91-mCherry together with Gal80 in DA1 ORNs and Httex1Q25-GFP in GH146+ PNs, and (D) Httex1Q91-mCherry in DA1 ORNs and Httex1Q25-GFP together with QS in GH146+ PNs. mCherry+ surfaces identified by semi-automated image segmentation are shown in the last panels, with Httex1Q91-only surfaces in red and Httex1Q91+Httex1Q25 surfaces in yellow. Scale bars = 10 μm. (E and F) Quantification of (E) Httex1Q91 and (F) Httex1Q91+Httex1Q25 aggregates in the DA1 glomeruli of flies with genotypes shown in (A–D). Data are shown as mean ± SEM. *p<0.05, ****p<0.0001 by one-way ANOVA with Tukey’s multiple comparisons test.
Figure 1—figure supplement 4
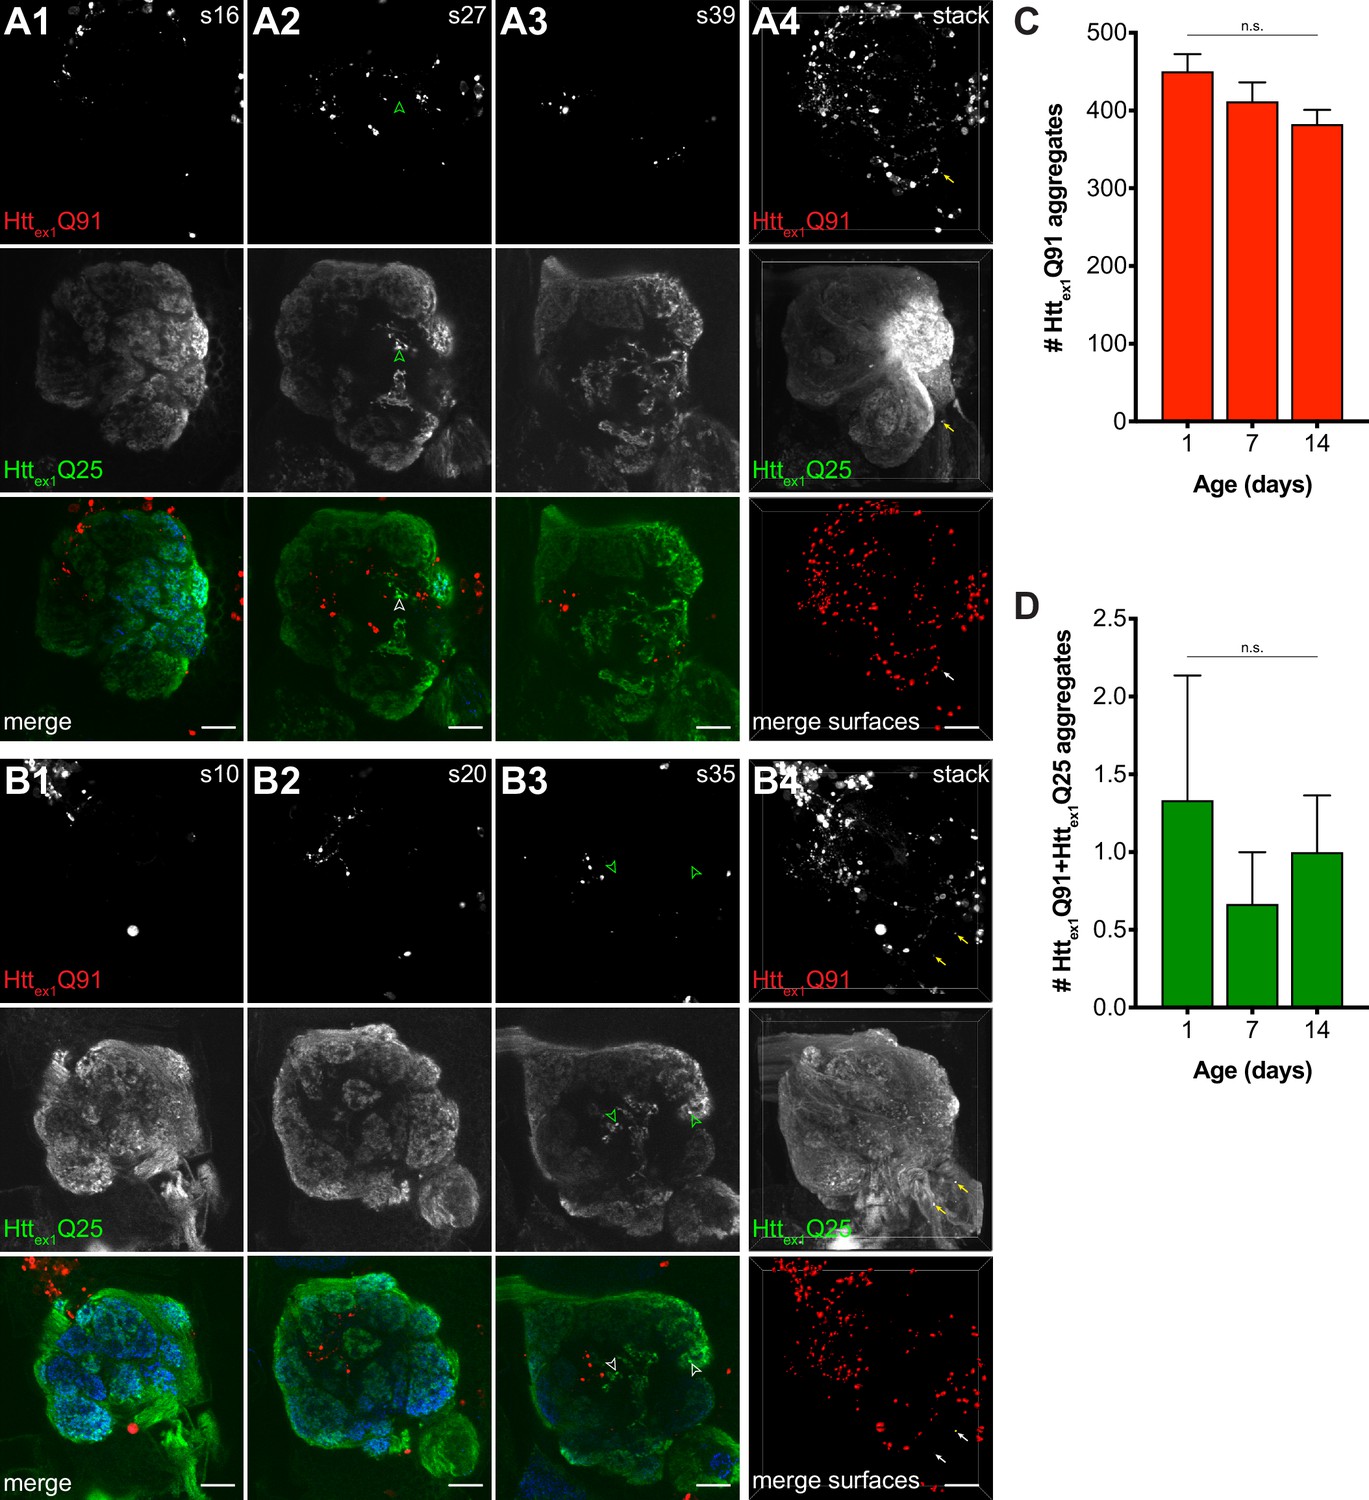
mHttex1 aggregates do not transfer retrogradely from PN dendrites to ORN axons.
Single z-slices (A1-3 and B1-3) and confocal z-stacks (A4 and B4) of the antennal lobe from 7 (A) and 14 (B) day-old adult females expressing Httex1Q91-mCherry in ~60% of PNs using GH146-QF and Httex1Q25-GFP in all ORNs using pebbled-Gal4. Dissected brains were immunostained with antibodies against mCherry (red), GFP (green), and the neuropil marker Bruchpilot (blue, shown in merged images). GFP+ puncta identified in single slices are indicated by open arrowheads; none of these were found to be mCherry+. Semi-automated segmentation of the Httex1Q91-mCherry fluorescent signal (‘merge surfaces’ in A4 and B4) identified numerous Httex1Q91 aggregates (graphed in C) throughout the antennal lobe neuropil and surrounding region. A small number of Httex1Q91+Httex1Q25 surfaces (graphed in D) were identified in these brains (arrows in A4 and B4); however, none of these were located within the boundaries of the antennal lobe. Scale bars = 10 μm; slice numbers are indicated at the top right in (A1-3 and B1-3). Quantified data in (C and D) are shown as mean ± SEM; 'n.s.' = not significant by one-way ANOVA with Tukey’s multiple comparisons test.
Figure 2
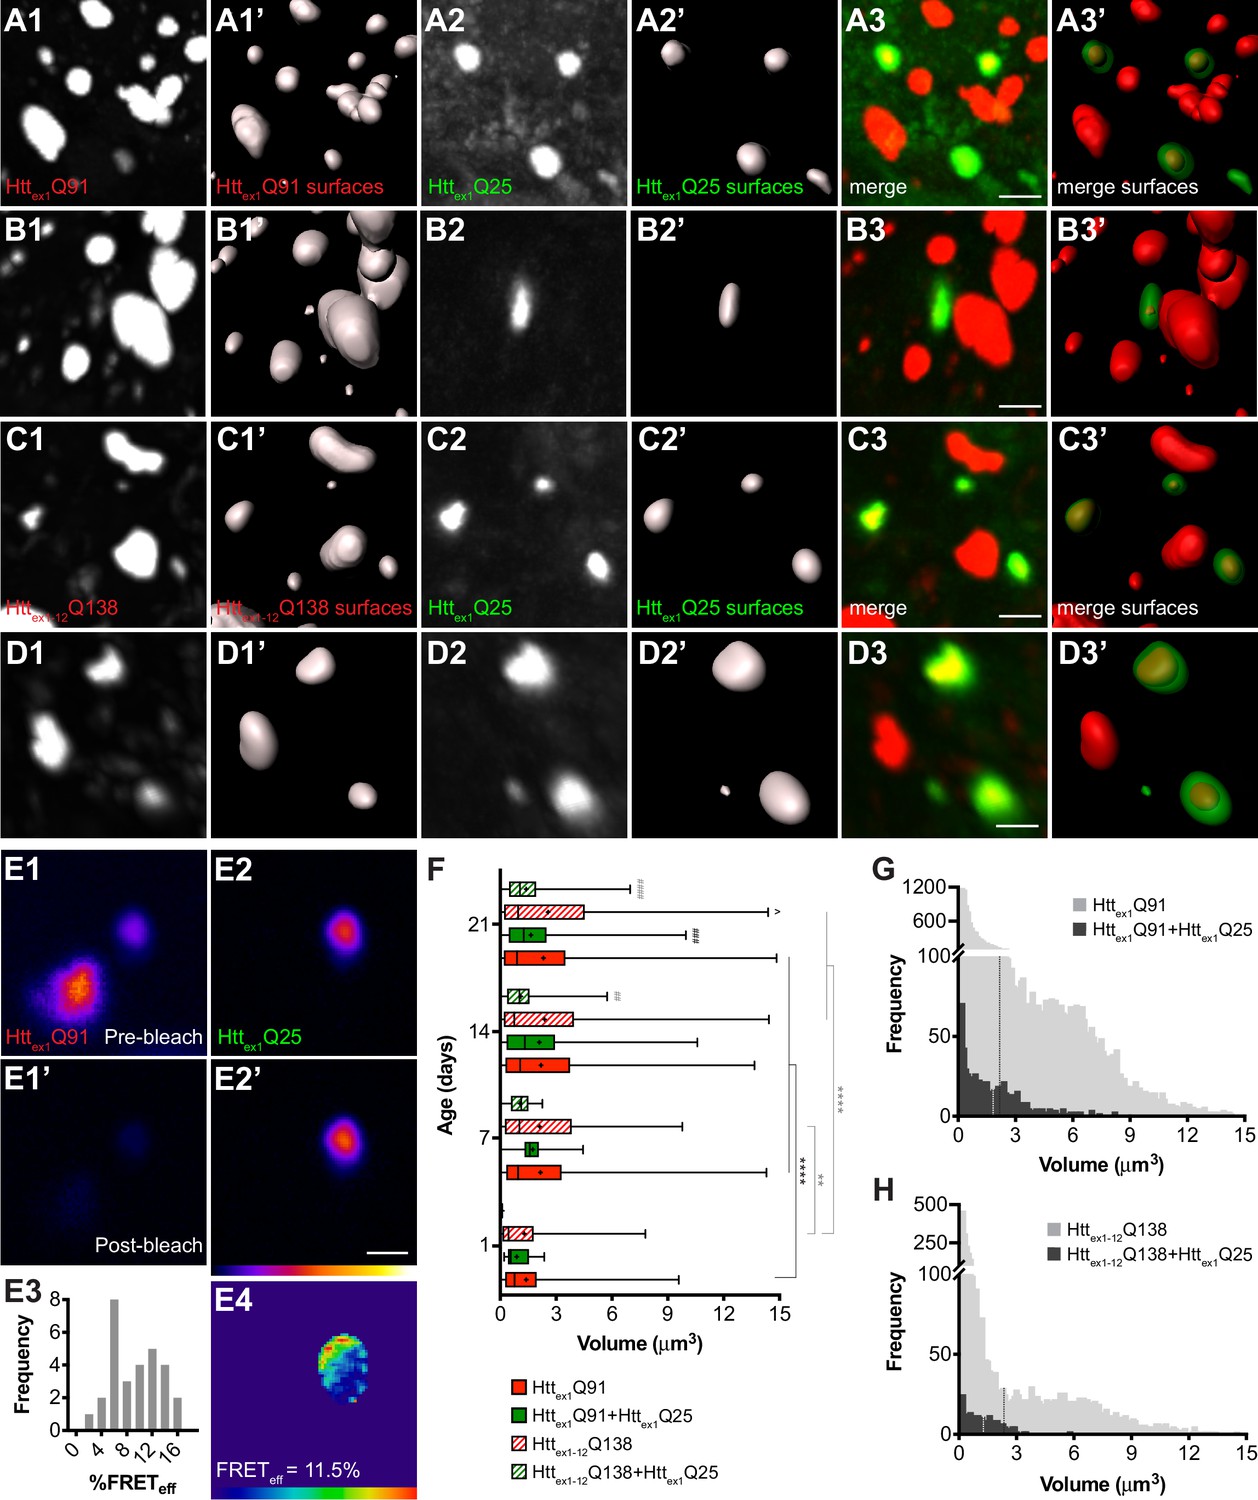
wtHttex1 aggregates in postsynaptic PNs are nucleated by mHttex1 or mHttex1-12 aggregates from presynaptic ORNs.
(A–D) High-magnification confocal z-stacks of DA1 glomeruli from adult flies expressing Httex1Q91-mCherry (A and B) or RFP-Httex1-12Q138 (C and D) in DA1 ORNs and Httex1Q25-GFP in GH146+ PNs. Raw data (A1-3, B1-3, C1-3, D1-3) are shown adjacent to surfaces identified by 3D segmentation of the red (A1’, B1’, C1’, D1’) or green (A2’, B2’, C2’, D2’) channels. Httex1Q25-GFP surfaces are shown at 50% transparency in ‘merged surfaces’ images (A3’, B3’, C3’, D3’) for visibility of co-localized Httex1Q91-mCherry or RFP-Httex1-12Q138 surfaces. Scale bars = 1 μm. (E1-4) A single confocal slice through the center of a Httex1Q91+Httex1Q25 aggregate before (E1, E2) and after (E1’, E2’) mCherry acceptor photobleaching. Data are shown as a heat map to highlight changes in fluorescence intensities after photobleaching. Scale bar = 1 μm. FRET efficiency (FRETeff) for this aggregate is shown in (E4), and average FRETeff values for all Httex1Q91+Httex1Q25 aggregates tested are shown in (E3). (F) Volumes of Httex1Q91 (solid red boxes), Httex1Q91+Httex1Q25 (solid green boxes), Httex1-12Q138 (striped red boxes), and Httex1-12Q138+Httex1Q25 (striped green boxes) aggregates identified in the DA1 glomerulus at the indicated ages. Box widths indicate interquartile ranges, vertical lines inside each box indicate medians, whiskers indicate minimums/maximums, and ‘+’s indicate means for each data set. *p<0.05, **p<0.01, ***p<0.001, ****p<0.0001 by one-way ANOVA followed by Tukey’s multiple comparisons test. Statistical significance is indicated by ‘*’s when comparing the same aggregate sub-population at different ages (Httex1Q91 surfaces in black and Httex1-12Q138 surfaces in gray), by ‘#’s when comparing Httex1Q91 vs Httex1Q91+Httex1Q25 (black) or Httex1-12Q138 vs Httex1-12Q138+Httex1Q25 (gray) aggregates at the same ages, and by ‘ ^’s when comparing Httex1Q91 vs Httex1-12Q138 aggregates at the same ages. (G and H) Distribution of volumes for (G) Httex1Q91 (light gray bars) and Httex1Q91+Httex1Q25 (dark gray bars) or (H) Httex1-12Q138 (light gray bars) and Httex1-12Q138+Httex1Q25 (dark gray bars) aggregates, combined from 7, 14, and 21 day-old flies. Mean volume of Httex1Q91 or Httex1-12Q138 aggregates and Httex1Q91+Httex1Q25 or Httex1-12Q138+Httex1Q25 aggregates are indicated by black and white dotted lines, respectively, on each histogram.
Figure 3
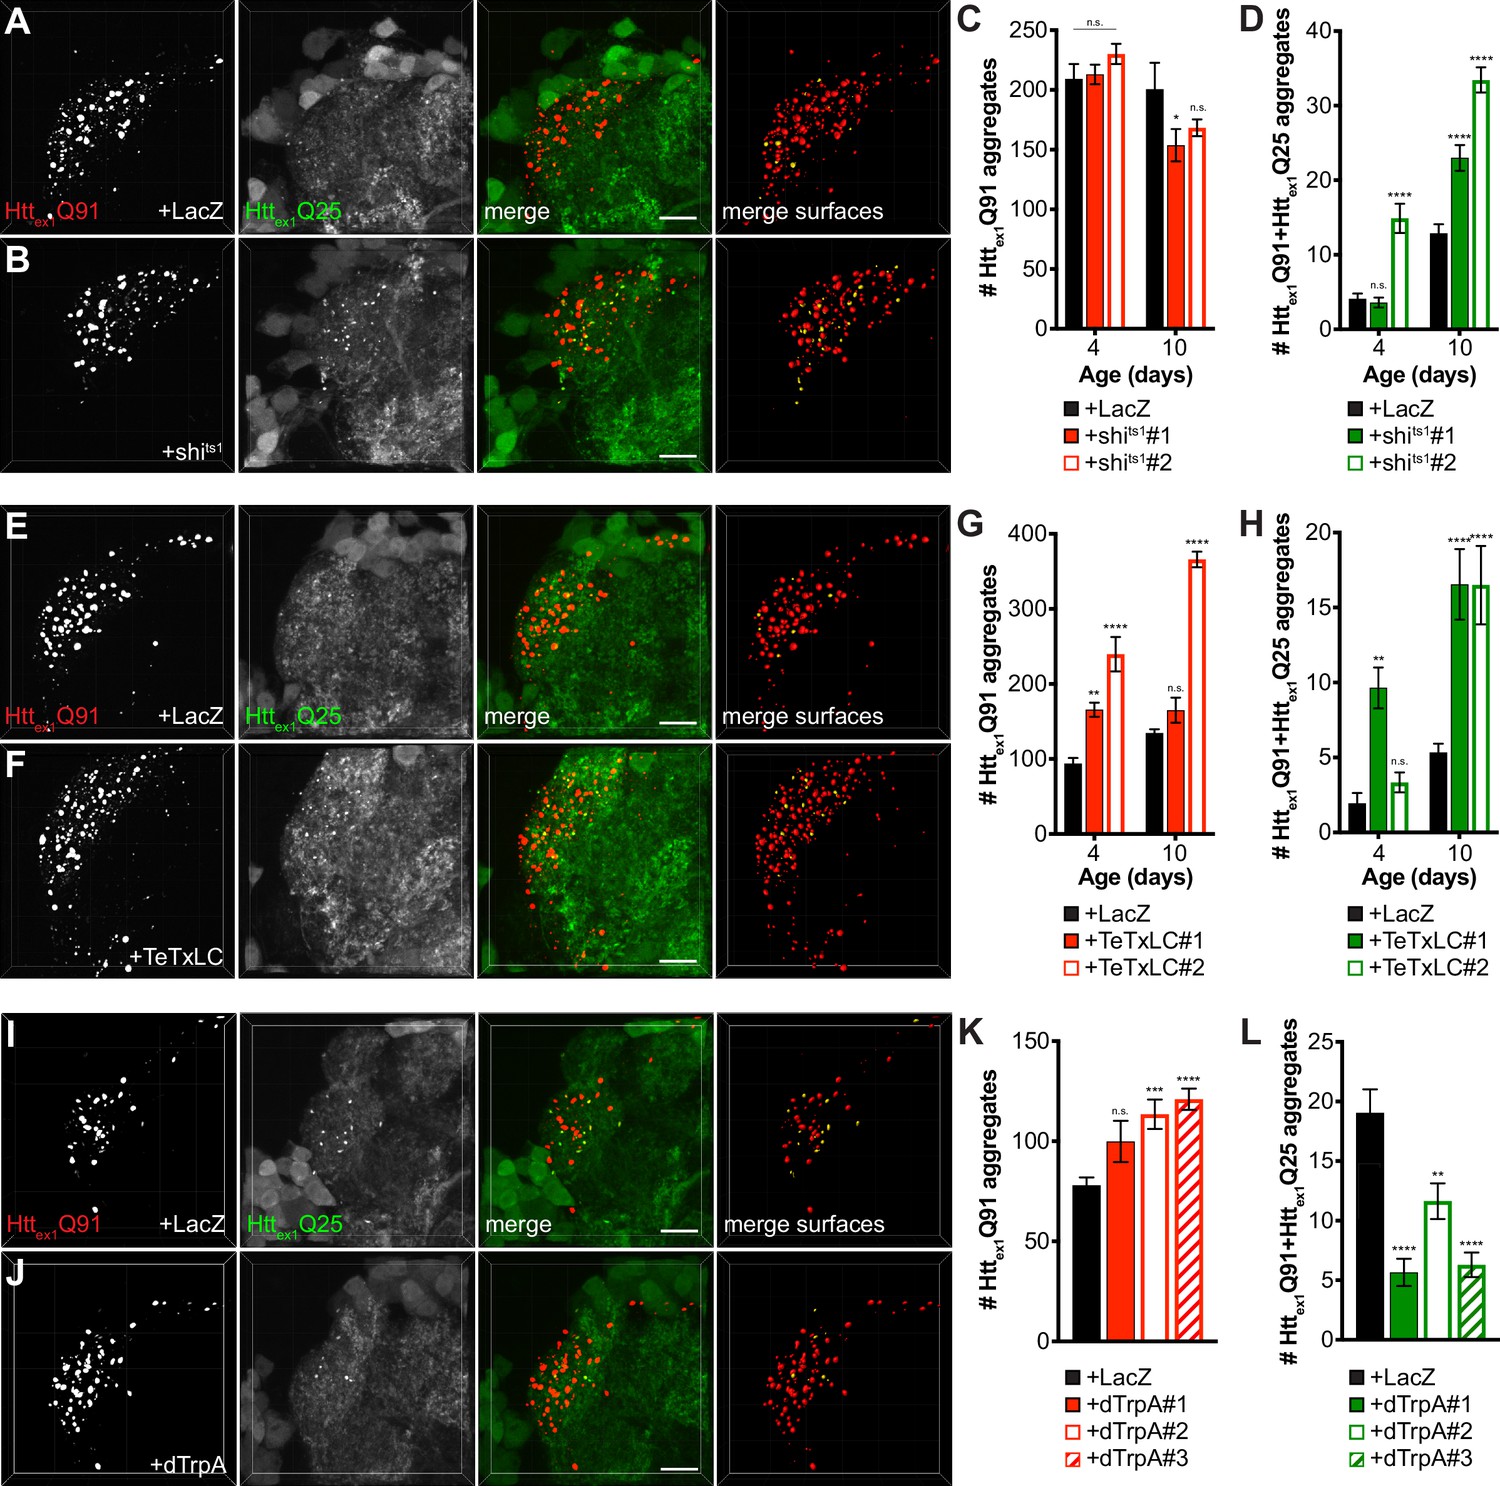
mHttex1 aggregate transfer from ORNs to synaptically-connected PNs is inversely correlated with presynaptic activity.
(A, B, E, F, I, and J) Confocal z-stacks of DA1 glomeruli from 10 day-old males (A-B, and E-F) or 7 day-old females (I-J) co-expressing Httex1Q91-mCherry with either LacZ (A, E, and I), shits1 (B), TeTxLC (F), or dTrpA (J) in DA1 ORNs and Httex1Q25-GFP in GH146+ PNs. In (A–B), flies were raised at the permissive temperature (18°C) and shifted to the restrictive temperature (31°C) upon eclosion, and in (I–J), flies were raised at room temperature (~21°C) and shifted to 31°C upon eclosion. mCherry+ surfaces identified by semi-automated image segmentation are shown in the last panels, with Httex1Q91-only surfaces in red and Httex1Q91+Httex1Q25 surfaces in yellow. Scale bars = 10 μm. (C-D, G-H, and K-L) Quantification of Httex1Q91 (C, G, and K) and Httex1Q91+Httex1Q25 (D, H, and L) aggregates identified in DA1 glomeruli from adult males of the indicated ages co-expressing Httex1Q91-mCherry with LacZ or shits1 using two independent QUAS-shits1 lines in DA1 ORNs and Httex1Q25-GFP in GH146+ PNs (C-D), adult males of the indicated ages co-expressing Httex1Q91-mCherry with LacZ or TeTxLC using two independent QUAS-TeTxLC lines in DA1 ORNs and Httex1Q25-GFP in GH146+ PNs (G-H), and 7 day-old females expressing Httex1Q91-mCherry with either LacZ or dTrpA using three independent QUAS-dTrpA lines in DA1 ORNs and Httex1Q25-GFP in GH146+ PNs (K-L). Data are shown as mean ± SEM; *p<0.05, **p<0.01, ***p<0.001, ****p<0.0001, 'n.s.' = not significant by one- or two-way ANOVA with Tukey’s multiple comparisons test comparing shits1-, TeTxLC-, or dTrpA-expressing flies to their respective controls expressing LacZ.
Figure 4
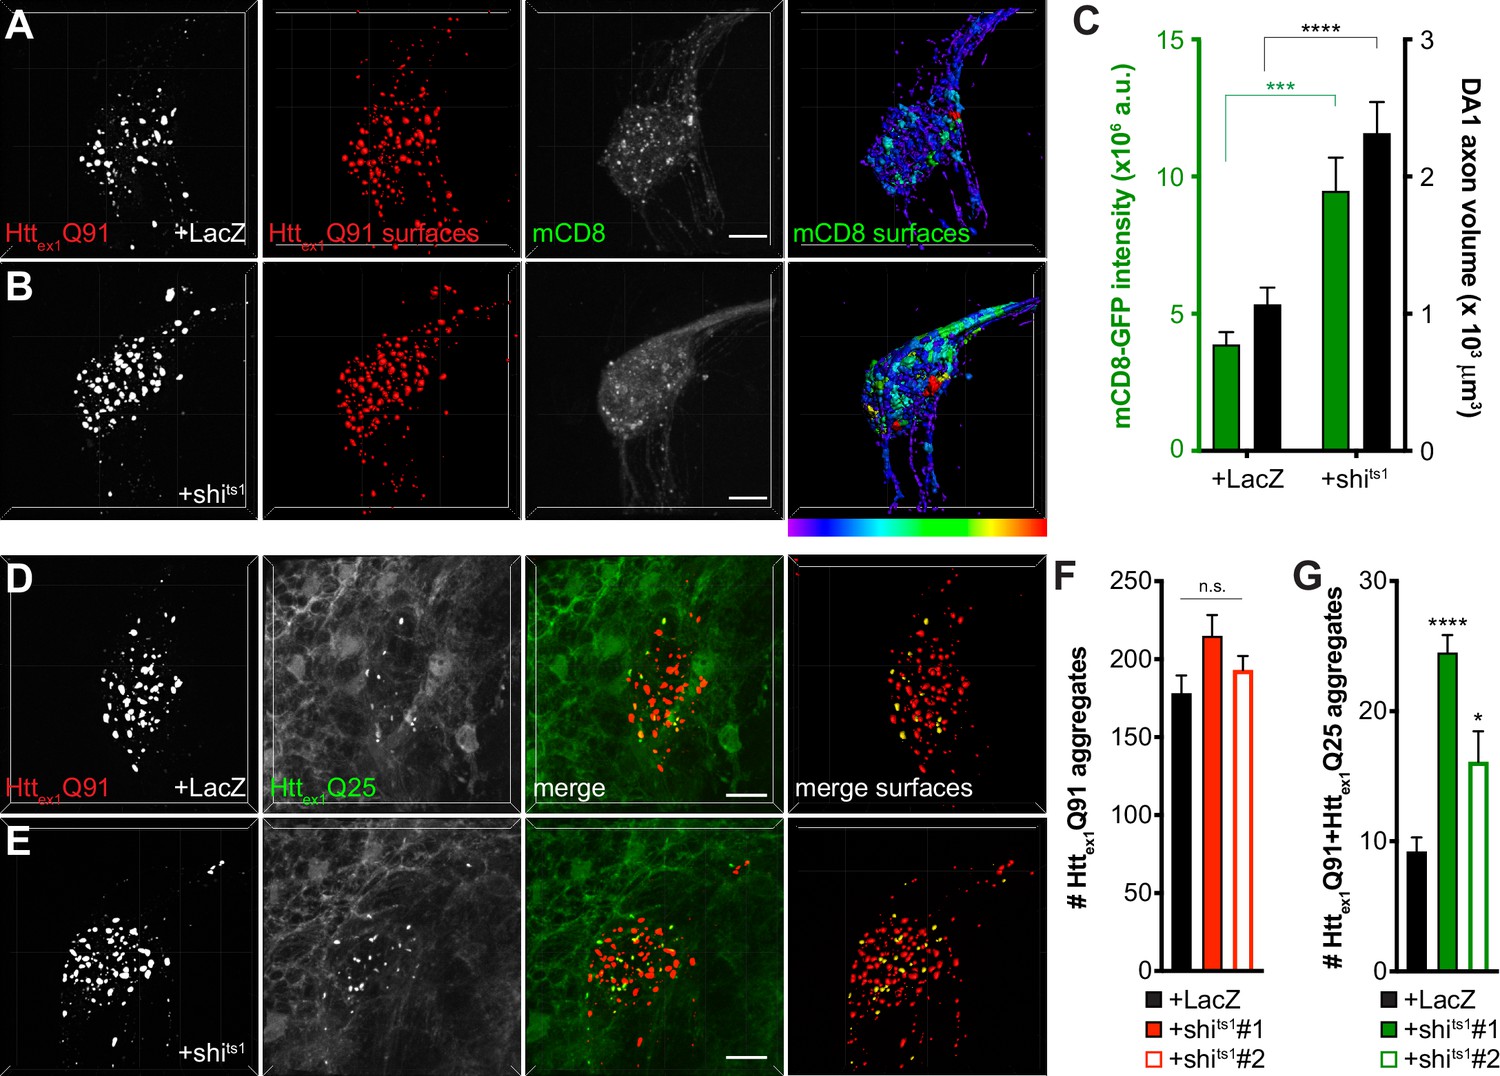
Inhibiting Shibire-mediated endocytosis increases mHttex1-expressing ORN axon volume and enhances transfer of mHttex1 aggregates from DA1 ORN axons to glia.
(A and B) Confocal z-stacks of DA1 glomeruli from 10 day-old females co-expressing Httex1Q91-mCherry, mCD8-GFP, and either LacZ (A) or shits1 (B) in DA1 ORNs. Flies were shifted from the permissive temperature (18°C) to the restrictive temperature (31°C) upon eclosion. Raw data are shown in grayscale, and 3D segmented surfaces are shown in red for Httex1Q91 and as a heat map for mCD8-GFP to highlight differences in intensity between the genotypes. Scale bars = 10 μm. (C) Quantification of mCD8-GFP intensity (left y-axis, green) and volume (right y-axis, black) of DA1 glomeruli from 10 day-old adult females co-expressing LacZ or shits1 with Httex1Q91-mCherry and mCD8-GFP in DA1 ORNs. a.u. = arbitrary units. Data are shown as mean ± SEM; ****p<0.0001 by Student’s t-test. (D and E) Confocal z-stacks of DA1 glomeruli from 5 to 6 day-old males expressing Httex1Q91-mCherry with either LacZ (D) or shits1 (E) in DA1 ORNs and Httex1Q25-YFP in repo+ glia. Adult flies were shifted from 18°C to 31°C upon eclosion. mCherry+ surfaces identified by semi-automated image segmentation are shown in the last panels, with Httex1Q91-only surfaces in red and Httex1Q91+Httex1Q25 surfaces in yellow. Scale bars = 10 μm. (F and G) Quantification of Httex1Q91 (F) and Httex1Q91+Httex1Q25 (G) aggregates in DA1 glomeruli of 5–6 day-old males expressing LacZ or shits1 using two independent QUAS-shits1 lines. Data are shown as mean ± SEM; *p<0.05, ****p<0.0001 by one-way ANOVA with Tukey’s multiple comparisons test comparing shits1-expressing flies to control flies expressing LacZ.
Figure 5 with 3 supplements
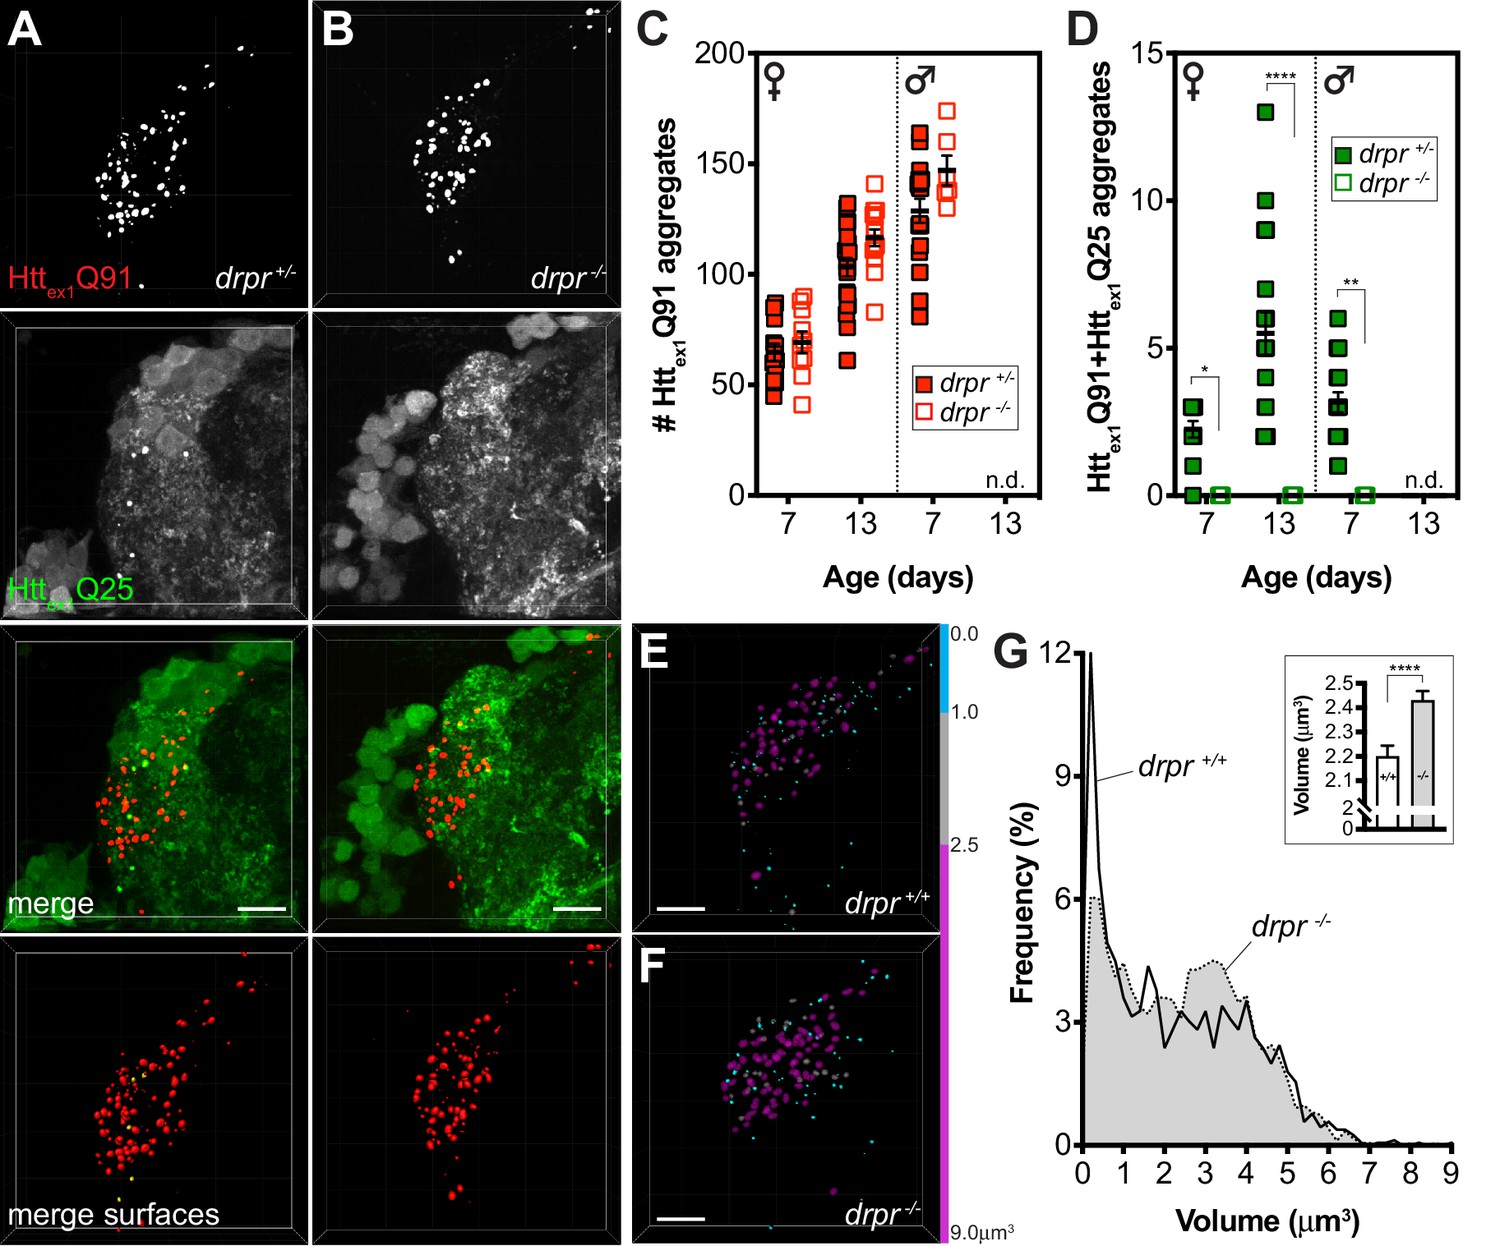
Draper mediates mHttex1 aggregate transfer from presynaptic DA1 ORNs to postsynaptic PNs and regulates neuronal mHttex1 aggregate size.
(A and B) Confocal z-stacks of DA1 glomeruli from 13 day-old adult females expressing Httex1Q91-mCherry in DA1 ORNs and Httex1Q25-GFP in GH146+ PNs, either heterozygous (A; drpr +/-) or homozygous (B; drpr -/-) for the drprΔ5 null allele. mCherry+ surfaces identified by semi-automated image segmentation are shown in the last row, with Httex1Q91-only surfaces in red and Httex1Q91+Httex1Q25 surfaces in yellow. Scale bars = 10 μm. (C and D) Quantification of Httex1Q91 (C) and Httex1Q91+Httex1Q25 (D) aggregates in DA1 glomeruli from female or male drpr +/- or drpr -/- flies at the indicated ages. Data are shown as mean ± SEM; *p<0.05, **p<0.01, ****p<0.0001 by two-way ANOVA with Tukey’s multiple comparisons test for drpr +/- vs drpr -/- flies at the same ages. ‘n.d.’=not determined; 13 day-old drpr -/- males were not viable. (E and F) Httex1Q91 surfaces identified in DA1 glomeruli from 7 day-old drpr +/- or drpr -/- females expressing Httex1Q91-mCherry in DA1 ORNs. mCherry+ surfaces are color-coded according to the following volume ranges: cyan = 0–1.0 μm3; gray = 1.01–2.49 μm3; magenta = 2.5–9.0 μm3. Gray and magenta surfaces were set to 70% transparency to improve visibility of smaller cyan surfaces. Scale bars = 10 μm. (G) Relative frequency of volumes for all Httex1Q91 aggregates identified in 7 day-old drpr +/+ (solid line) or drpr -/- (dotted line; gray shading) males and females. The inset graph shows mean Httex1Q91 aggregate volume ± SEM for the two genotypes. ****p<0.0001 by unpaired Student’s t-test.
Figure 5—figure supplement 1
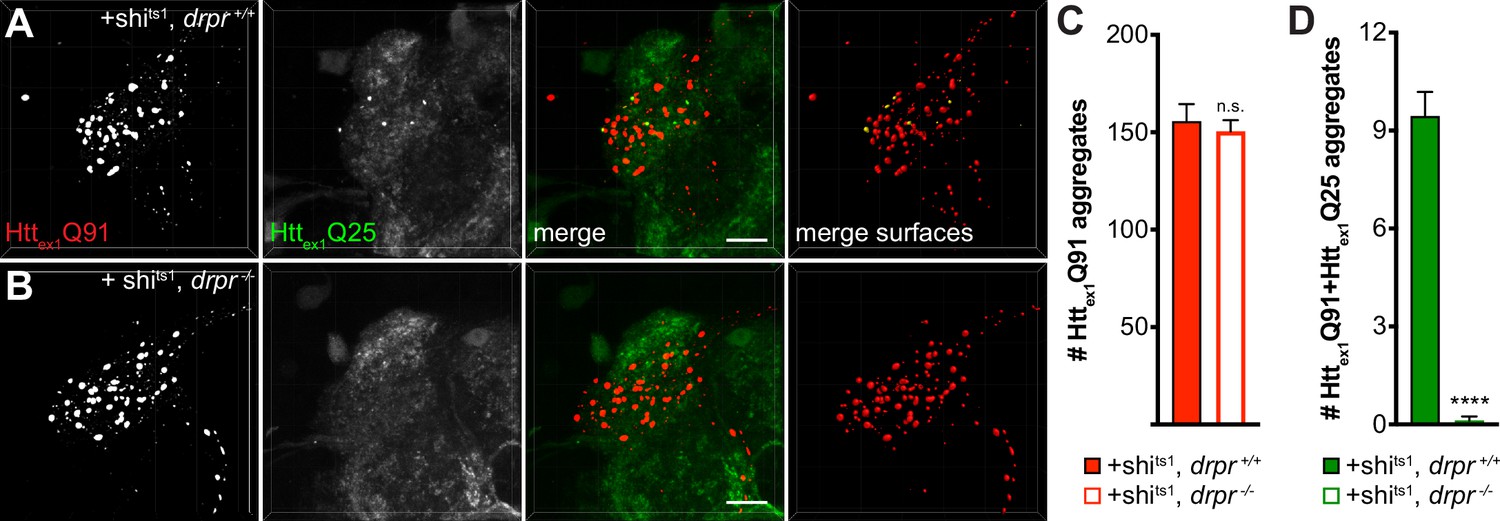
Draper is required for enhanced transfer of mHttex1 from shits1-expressing DA1 ORNs to GH146+ PNs.
(A and B) Confocal stacks of DA1 glomeruli from 7 day-old drpr +/+ (A) or drpr -/- (B) adult females co-expressing Httex1Q91-mCherry with shits1 in DA1 ORNs and Httex1Q25-GFP in GH146+ PNs. Adult flies were shifted from 18°C to 31°C upon eclosion. mCherry+ surfaces identified by semi-automated image segmentation are shown in the last panels, with Httex1Q91-only surfaces in red and Httex1Q91+Httex1Q25 surfaces in yellow. Scale bars = 10 μm. (C and D) Quantification of Httex1Q91 (C) and Httex1Q91+Httex1Q25 (D) aggregates for the same genotypes shown in (A and B). Data are shown as mean ± SEM; ****p<0.0001 by Student’s t-test comparing drpr +/+ vs drpr -/- flies.
Figure 5—figure supplement 2
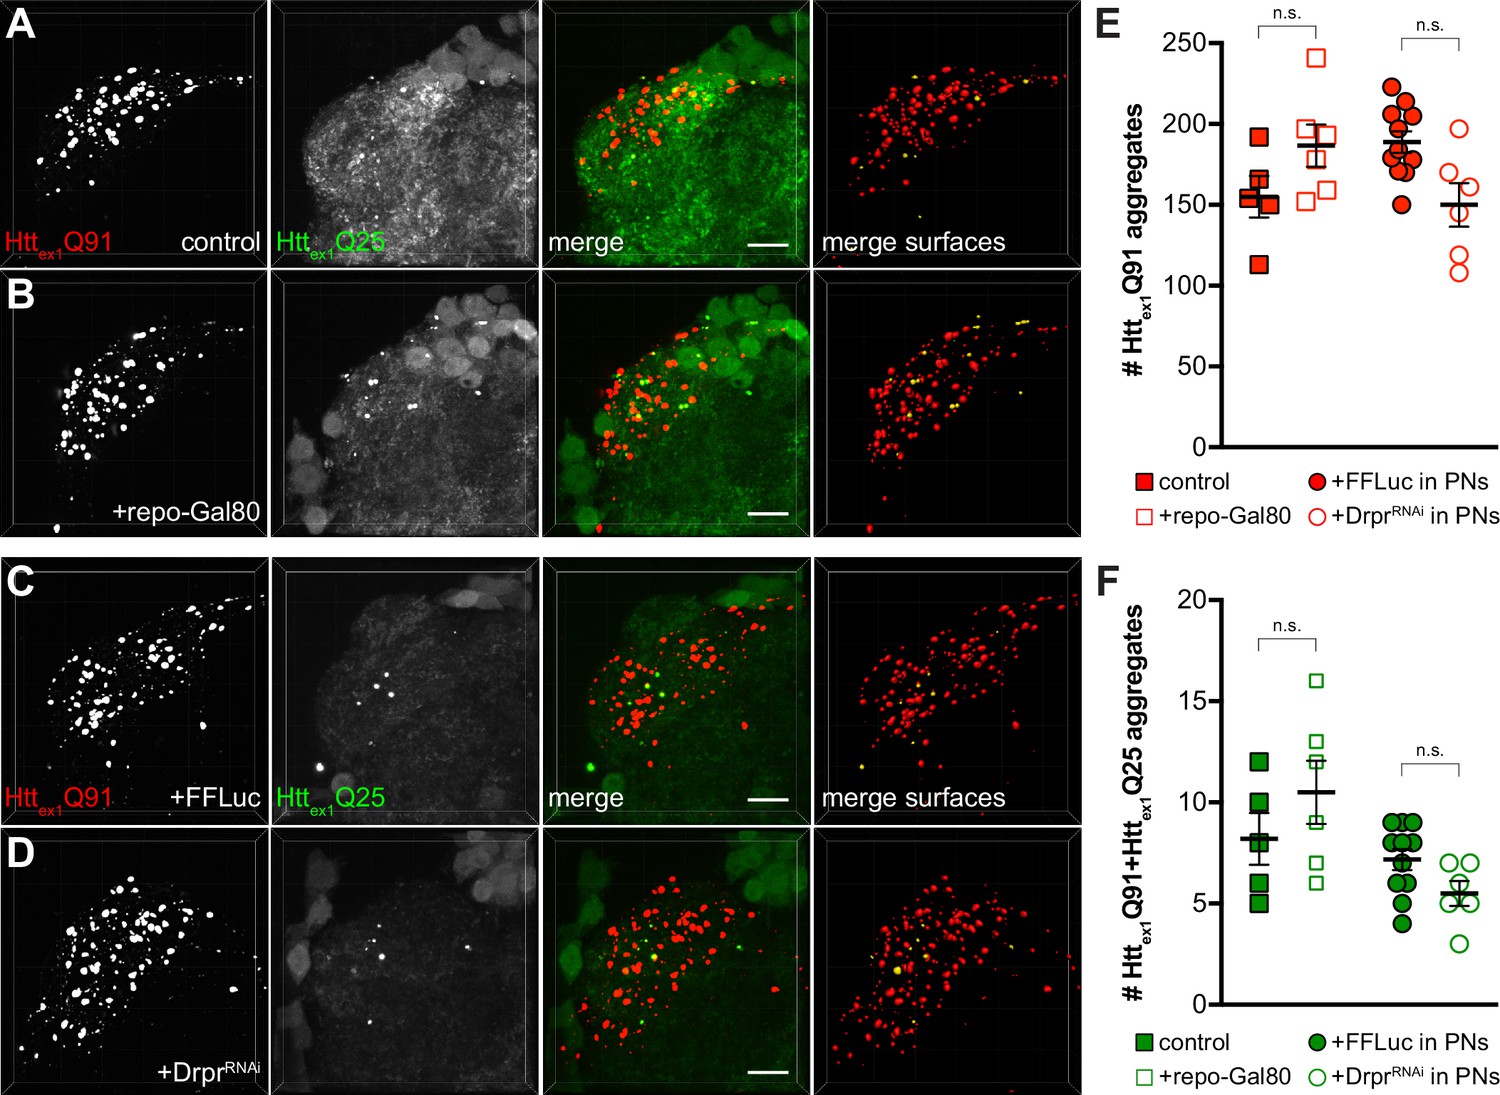
Gal80-mediated repression of Gal4 in glia or RNAi knockdown of drpr in PNs do not alter ORN-to-PN prion-like transfer of mHttex1 aggregates.
(A and B) Confocal stacks of DA1 glomeruli from 10 to 14 day-old adult males expressing Httex1Q91-mCherry in DA1 ORNs and Httex1Q25-GFP in GH146+ PNs with (A) no additional transgenes (‘control’) or (B) repo-Gal80 to inhibit Gal4-mediated expression of Httex1Q25-GFP in glia. (C and D) Confocal z-stacks of DA1 glomeruli from 14 day-old adult males expressing Httex1Q91-mCherry in DA1 ORNs and co-expressing Httex1Q25-GFP together with firefly luciferase (‘FFLuc’; C) or dsRNA targeting draper (‘DrprRNAi’; D) in GH146+ PNs. In (A–D), mCherry+ surfaces identified by semi-automated image segmentation are shown in the last panels, with Httex1Q91-only surfaces in red and Httex1Q91+Httex1Q25 surfaces in yellow. Scale bars = 10 μm. (E and F) Quantification of Httex1Q91 (E) and Httex1Q91+Httex1Q25 (F) aggregates for genotypes shown in (A–D). Data are shown as mean ± SEM; 'n.s.' = not significant by one-way ANOVA with Tukey’s multiple comparisons tests.
Figure 5—figure supplement 3
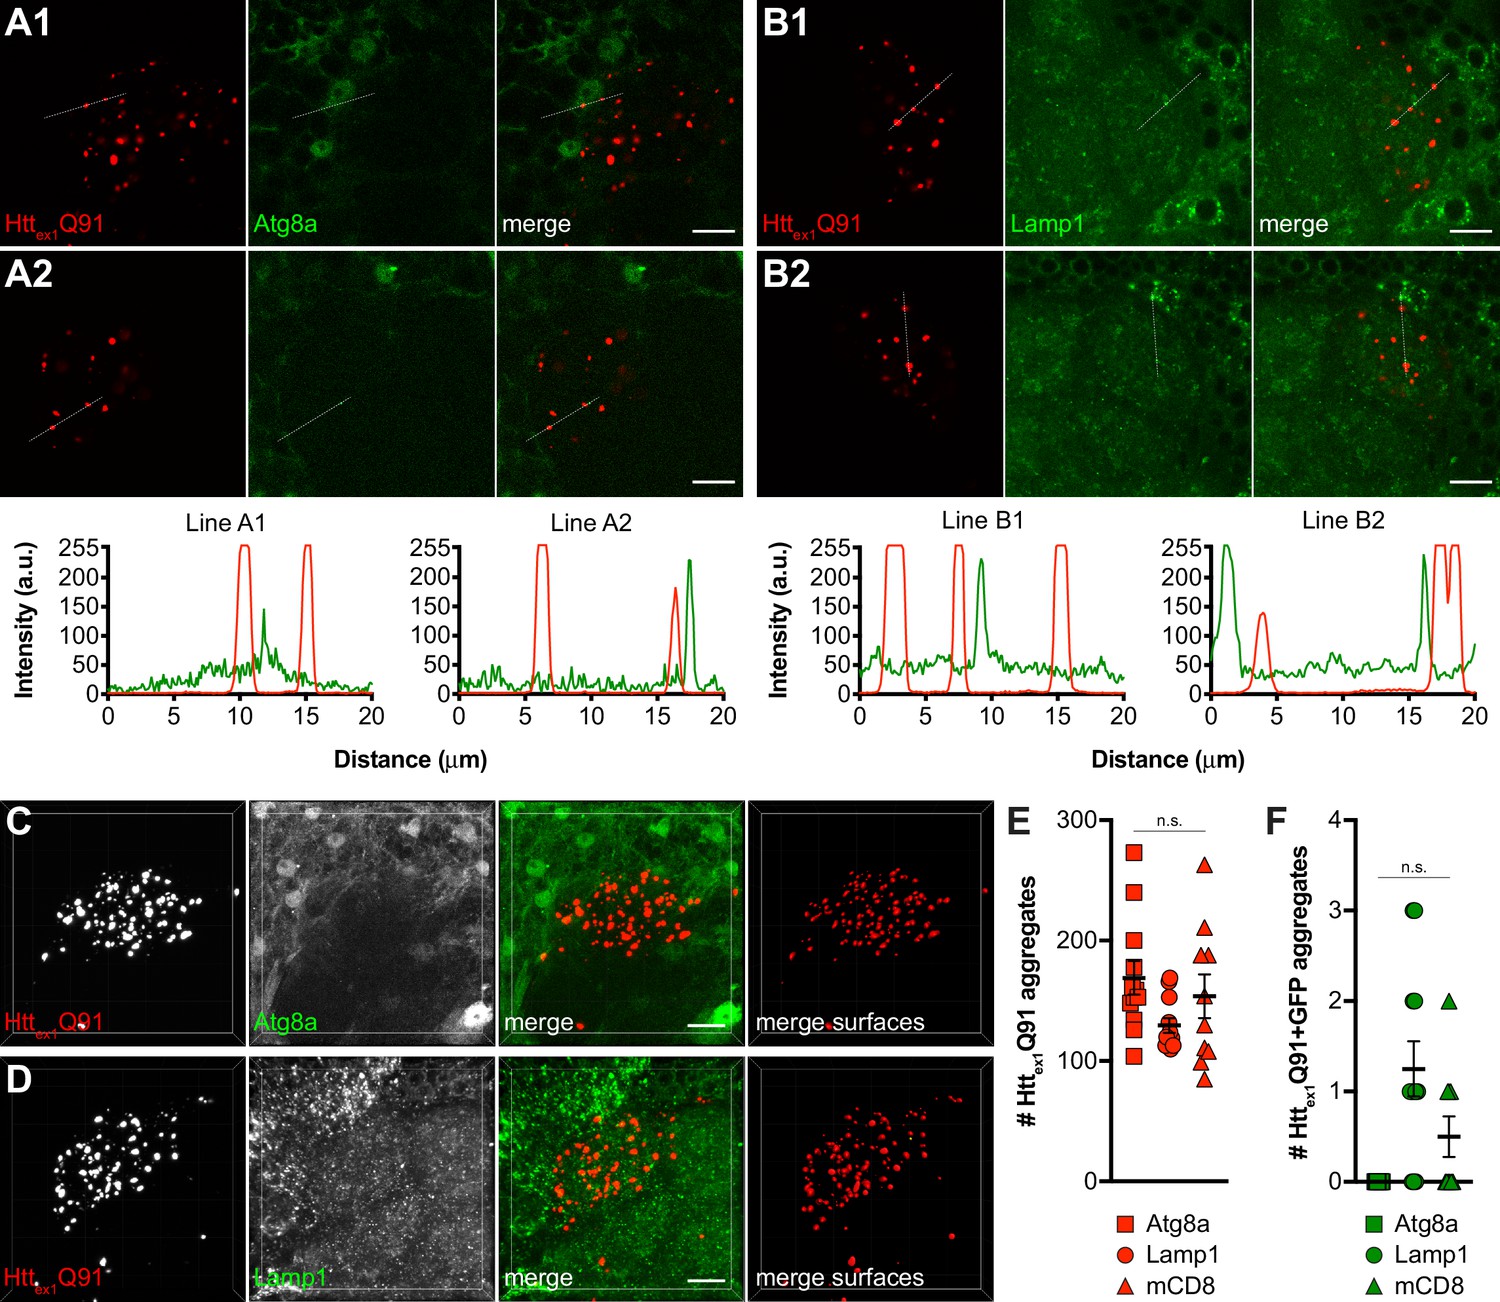
mHttex1 aggregates generated in ORNs do not co-localize with markers of lysosomes or autophagosomes in glia.
(A1-2 and B1-2) Single confocal slices from DA1 glomeruli of 4–5 day-old adult males expressing Httex1Q91-mCherry in DA1 ORNs and either the autophagosomal marker Atg8a-GFP (A1 and A2) or the lysosomal marker GFP-Lamp1 (B1 and B2) in repo+ glia. Scale bars = 10 μm. Httex1Q91-mCherry (red) and Atg8a- or Lamp1-GFP (green) fluorescence intensity profiles for lines indicated in (A1-2 and B1-2) are shown below images; a.u. = arbitrary units. Lines were scanned from leftmost to rightmost point. (C and D) Confocal stacks of DA1 glomeruli from 4 to 5 day-old adult males expressing Httex1Q91-mCherry in DA1 ORNs and either Atg8a-GFP (C) or GFP-Lamp1 (D) in repo+ glia. mCherry+ surfaces identified by semi-automated image segmentation are shown in the last panels, with Httex1Q91-only surfaces in red and Httex1Q91+GFP surfaces in yellow. Scale bars = 10 μm. (E and F) Quantification of Httex1Q91 (E) and Httex1Q91+GFP (F) surfaces for the same genotypes as in (C and D) and for control animals expressing mCD8-GFP in glia. Data are shown as mean ± SEM; 'n.s.' = not significant by one-way ANOVA with Tukey’s multiple comparisons test.
Figure 6
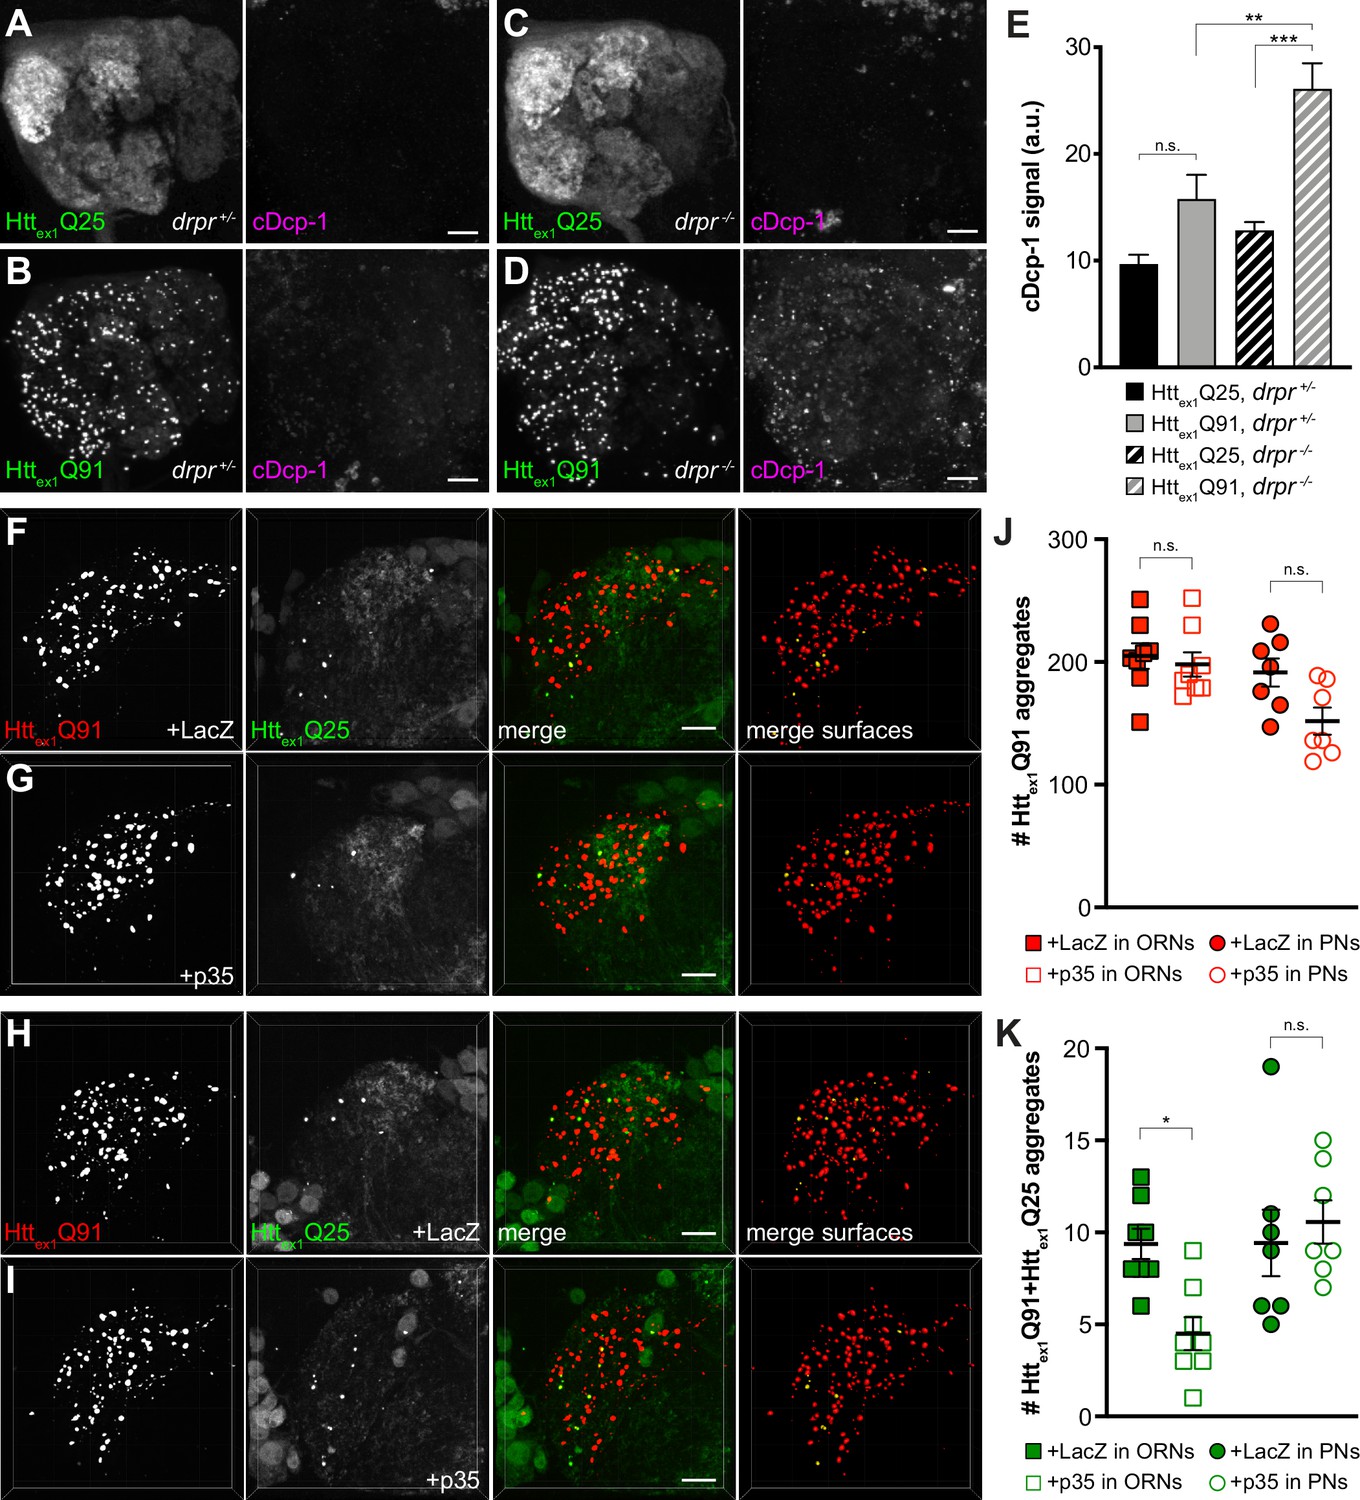
Caspase activation in ORNs mediates mHttex1 aggregate transfer from ORNs to PNs.
(A–D) Maximum-intensity projections of antennal lobes from 8 day-old adult males expressing Httex1Q25-GFP (A and C) or Httex1Q91-GFP (B and D) in most ORNs using Or83b-Gal4 in drprΔ5 heterozygotes (drpr +/-; A and B) or homozygotes (drpr -/-; C and D). Brains were immunostained for GFP (left panels) or cleaved Dcp-1 (right panels). Scale bars = 20 μm. (E) Quantification of cDcp-1 immunofluorescence from 8 day-old adult males with the same genotypes as in (A–D). Data are shown as mean ± SEM; **p<0.01, ***p<0.001, 'n.s.' = not significant by one-way ANOVA with Tukey’s multiple comparisons test. (F–I) Confocal z-stacks of DA1 glomeruli from 14 day-old males expressing Httex1Q91-mCherry with LacZ (F) or p35 (G) in DA1 ORNs and Httex1Q25-GFP in GH146+ PNs, or Httex1Q91-mCherry in DA1 ORNs and Httex1Q25-GFP with LacZ (H) or p35 (I) in GH146+ PNs. mCherry+ surfaces identified by 3D segmentation are shown in the last panels, with Httex1Q91-only surfaces in red and Httex1Q91+Httex1Q25 surfaces in yellow. Scale bars = 10 μm. (J and K) Quantification of Httex1Q91 (J) or Httex1Q91+Httex1Q25 (K) aggregates in DA1 glomeruli of flies with the same genotypes in (F and G) (squares) or (H and I) (circles). Numbers of aggregates in flies expressing LacZ or p35 are indicated by solid or open shapes, respectively. Data are shown as mean ± SEM; *p<0.05, 'n.s.' = not significant by one-way ANOVA with Tukey’s multiple comparisons test.
Figure 7 with 1 supplement
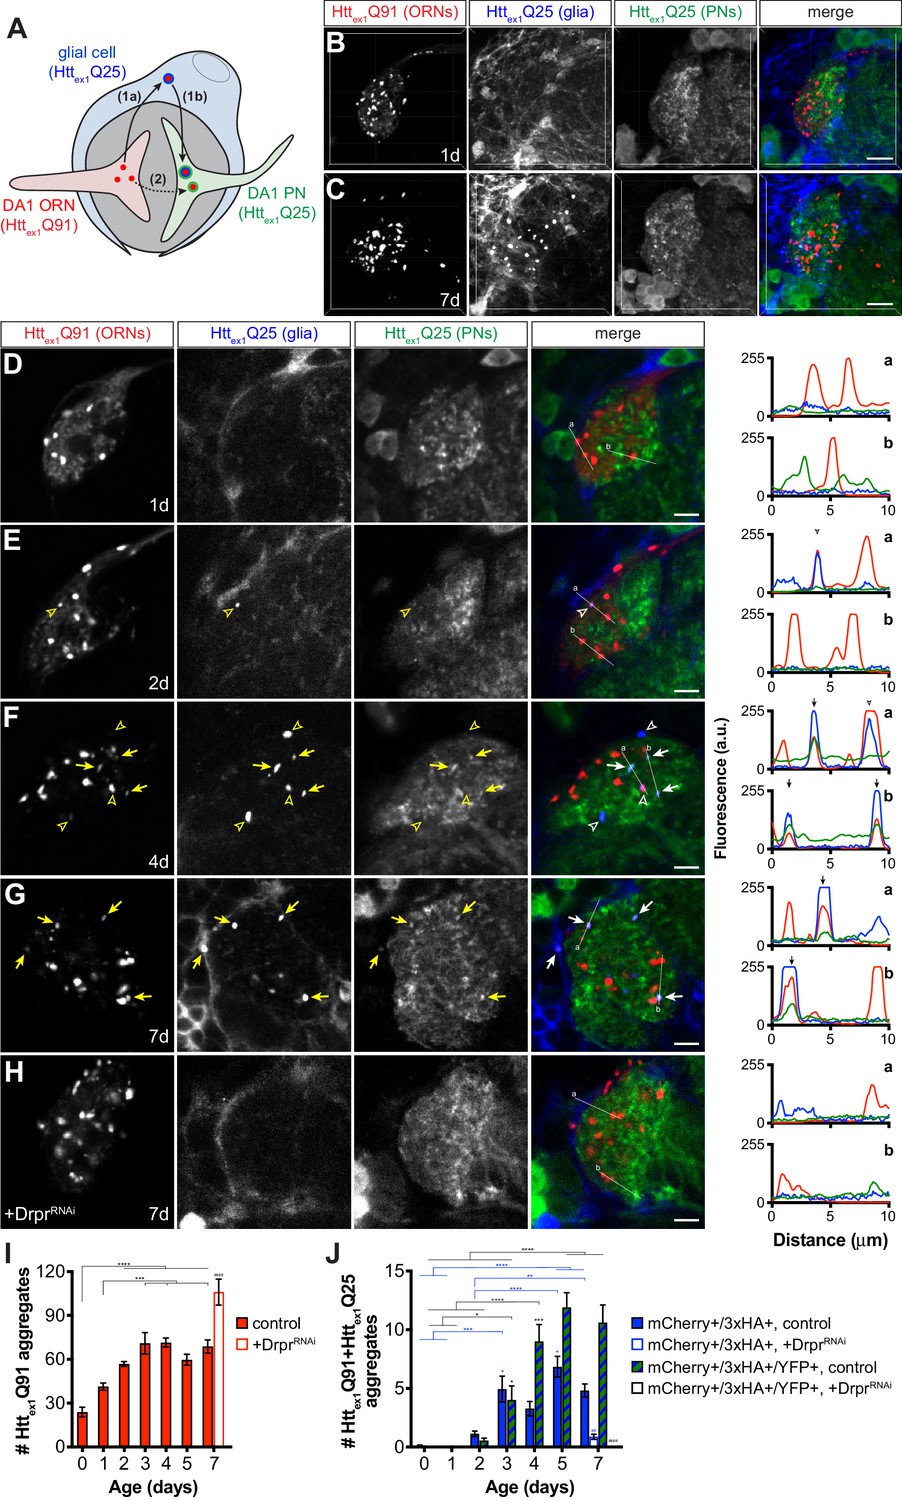
mHttex1 aggregates transfer from presynaptic ORNs to postsynaptic PNs via the cytoplasm of phagocytic glia.
(A) Diagram illustrating our experimental approach for examining a role for Draper-expressing glia in mHttex1 aggregate transfer from DA1 ORNs to DA1 PNs. Flies that combined Or67d-QF-, repo-Gal4-, and GH146-LexA:GAD-driven expression of Httex1Q91-mCherry in DA1 ORNs (red), Httex1Q25-3xHA in all glia (blue), and Httex1Q25-YFP in ~60% of PNs (green), respectively, were generated and analyzed by confocal microscopy of immunostained brains. If Httex1Q91-mCherry aggregates travel to PNs via the glial cytoplasm (route 1), triple-labeled (mCherry+/3xHA+/YFP+) aggregates should be observed. By contrast, if Httex1Q91-mCherry aggregates transfer directly to PNs without accessing the glial cytoplasm (route 2), then only double-labeled (mCherry+/3xHA+ and mCherry+/YFP+) aggregates would be detected. (B–C) Confocal z-stacks of DA1 glomeruli from adult females of the indicated ages expressing Httex1Q91-mCherry in DA1 ORNs (red), Httex1Q25-3xHA in glia (blue), and Httex1Q25-YFP in PNs (green) at the indicated ages. Brains were immunostained with antibodies against the mCherry, 3xHA, and YFP tags unique to each Htt protein. Scale bars = 10 μm. (D–H) Single 0.35 μm confocal z-slices from females of the indicated ages with (D–G) the same genotype as in (B and C) or (H) also expressing dsRNAs targeting drpr in glia (‘+DrprRNAi’). Colocalizing mCherry+/3xHA+ or mCherry+/3xHA+/YFP+ aggregates are indicated by open arrowheads or arrows, respectively, shown in yellow on grayscale and white on merged images for increased visibility. Scale bars = 5 μm. Httex1Q91-mCherry (red), Httex1Q25-3xHA (blue), and Httex1Q25-YFP (green) fluorescence intensity profiles for lines ‘a’ and ‘b’ are shown to the right of each merged image. Lines were scanned from leftmost to rightmost point. Arrowheads and arrows on graphs indicate peak mCherry fluorescence in colocalized mCherry+/3xHA+ and mCherry+/3xHA+/YFP+ aggregates, respectively. (I and J) Quantification of (I) mCherry-only or (J) mCherry+/3xHA+ and mCherry+/3xHA+/YFP+ aggregates identified in control (solid bars) or DrprRNAi-expressing (open bars) animals over time. +DrprRNAi animals were only analyzed at 7 days-old. Data are shown as mean ± SEM; *p<0.05, **p<0.01, ***p<0.001, or ****p<0.0001 by one- or two-way ANOVA followed by Tukey’s multiple comparisons test. ‘*’s indicate statistical significance comparing control flies at different ages [black ‘*’s compare mCherry-only aggregates in (I) and mCherry+/3xHA+/YFP+ aggregates in (J), and blue ‘*’s compare mCherry+/3xHA+ aggregates in J], and ‘#’s indicate statistical significance comparing mCherry+/3xHA+ and mCherry+/3xHA+/YFP+ aggregates, respectively, in control vs DrprRNAi-expressing flies at the same age.
Figure 7—figure supplement 1
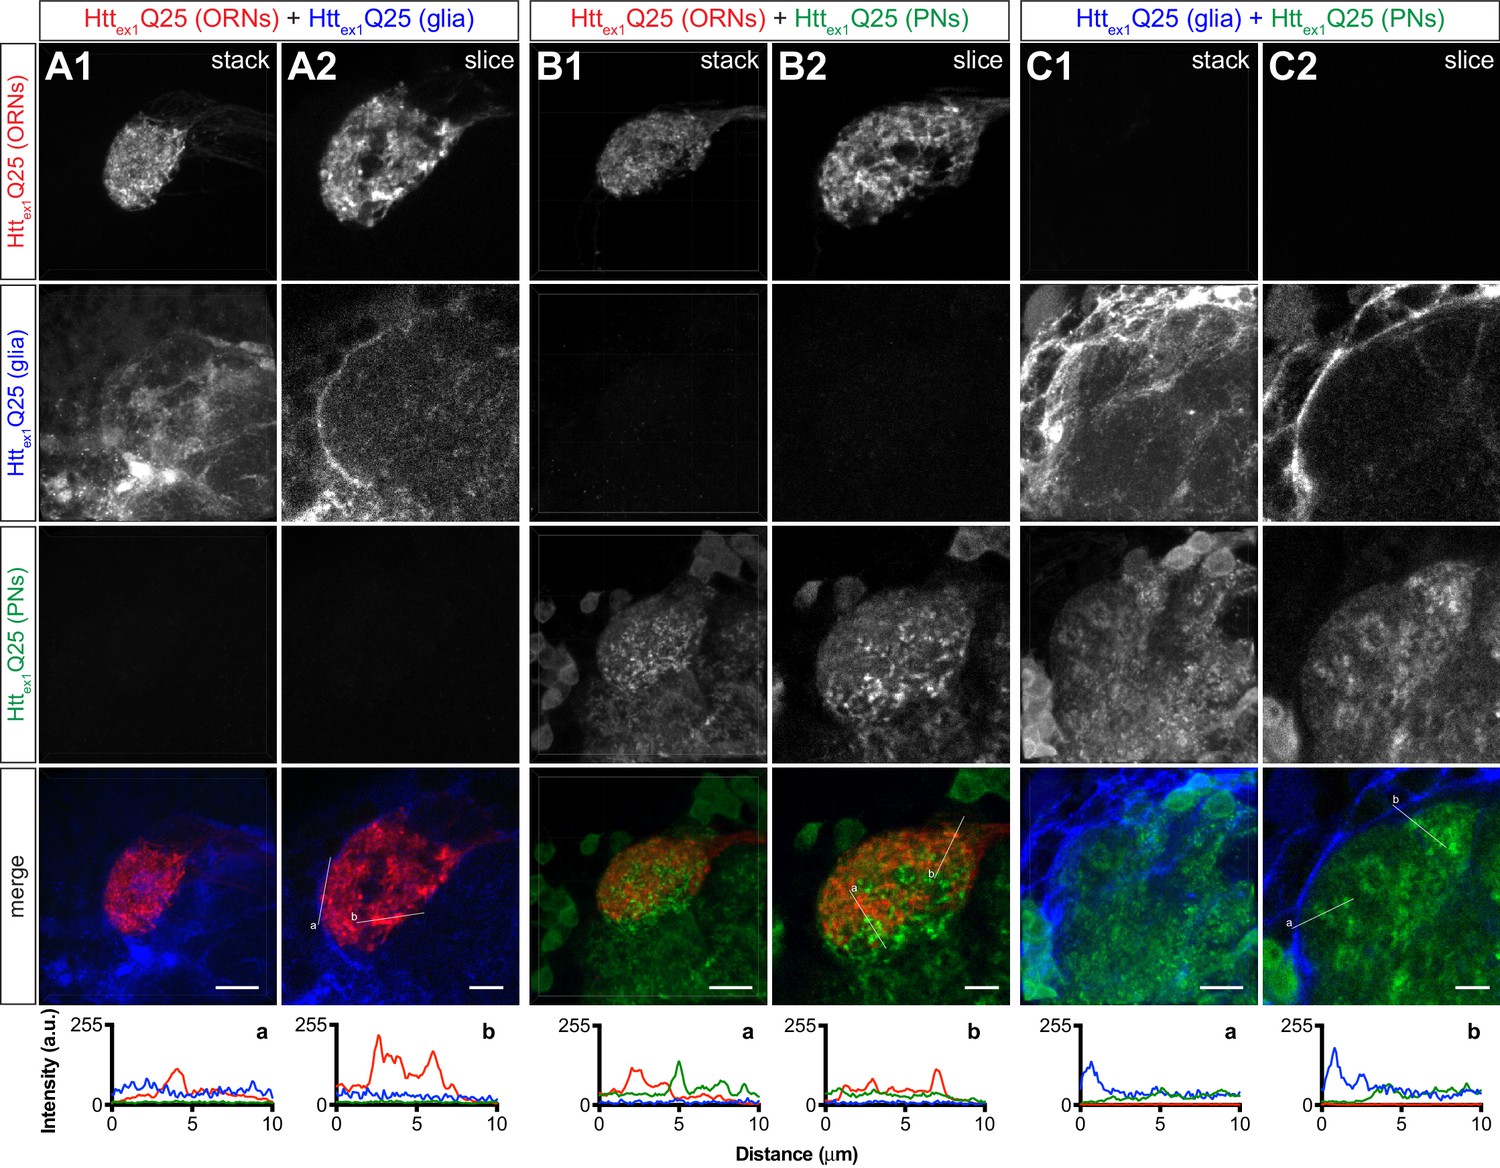
Controls for monitoring transmission of mHttex1 aggregates from presynaptic DA1 ORNs to postsynaptic PNs via a glial intermediate.
(A–C) Confocal z-stacks (A1, B1, and C1) and single 0.35 μm z-slices (A2, B2, and C2) of DA1 glomeruli from 4 to 6 day-old adult females expressing (A1-2) Httex1Q25-mCherry in DA1 ORNs and Httex1Q25-3xHA in repo+ glia, (B1-2) Httex1Q25-mCherry in DA1 ORNs and Httex1Q25-YFP in GH146+ PNs, or (C1-2) Httex1Q25-3xHA in repo+ glia and Httex1Q25-YFP in GH146+ PNs. All brains were immunostained with antibodies against all three epitope tags (i.e., mCherry, YFP, and 3xHA) to show specific staining. Scale bars = 10 μm in (A1, B1, and C1) and 5 μm in (A2, B2, and C2). Httex1Q25-mCherry (red), Httex1Q25-3xHA (blue), and Httex1Q25-YFP (green) fluorescence intensity profiles for lines ‘a’ and ‘b’ shown in merged slices (A2, B2, and C2) are shown below images. Lines were scanned from leftmost to rightmost point.
Videos
Video 1
Semi-automated quantification of mHttex1 and seeded wtHttex1 aggregates in the DA1 glomerulus.
Animation illustrating semi-automated approach for quantifying mHttex1 and wtHttex1 aggregates in brains expressing Httex1Q91-mCherry in DA1 ORNs and Httex1Q25-GFP in GH146+ PNs. Data shown in video are the same as in Figure 1—figure supplement 2A1-2 and C1-7. Segmentation of raw high-magnification 3D confocal data (0:00) in the red channel (0:07) identified distinct Httex1Q91-mCherry surfaces (0:09), which were filtered for those that co-localize with high-intensity GFP signal to isolate the subpopulation associated with Httex1Q25-GFP puncta (0:13). Volumetric surfaces representing Httex1Q91 (red) and Httex1Q91+Httex1Q25 (yellow) aggregates (0:18) are shown for each data set analyzed by this method. The animation also illustrates segmentation of raw data in the green channel (0:28) to identify the brightest Httex1Q25-GFP objects in each data set (0:29). Overlap of mCherry+ and GFP+ surfaces, with GFP+ surfaces set at 50% transparency (0:30), highlights co-localization of smaller Httex1Q91 ‘seeds’ surrounded by Httex1Q25 signal in these aggregates.
Additional files
-
Supplementary file 1
Full genotypes of flies used in this study.
- https://cdn.elifesciences.org/articles/58499/elife-58499-supp1-v2.docx
-
Supplementary file 2
Sample sizes and statistical analyses used in this study.
Symbols and colors in ‘Significance’ column match those shown in figures.
- https://cdn.elifesciences.org/articles/58499/elife-58499-supp2-v2.docx
-
Transparent reporting form
- https://cdn.elifesciences.org/articles/58499/elife-58499-transrepform-v2.docx
Download links
A two-part list of links to download the article, or parts of the article, in various formats.
Downloads (link to download the article as PDF)
Open citations (links to open the citations from this article in various online reference manager services)
Cite this article (links to download the citations from this article in formats compatible with various reference manager tools)
Phagocytic glia are obligatory intermediates in transmission of mutant huntingtin aggregates across neuronal synapses
eLife 9:e58499.
https://doi.org/10.7554/eLife.58499


