Splicing variation of BMP2K balances abundance of COPII assemblies and autophagic degradation in erythroid cells
- Laboratory of Cell Biology, International Institute of Molecular and Cell Biology, Poland
- Laboratory of Cytometry, Nencki Institute of Experimental Biology, Poland
Figures
Figure 1 with 3 supplements
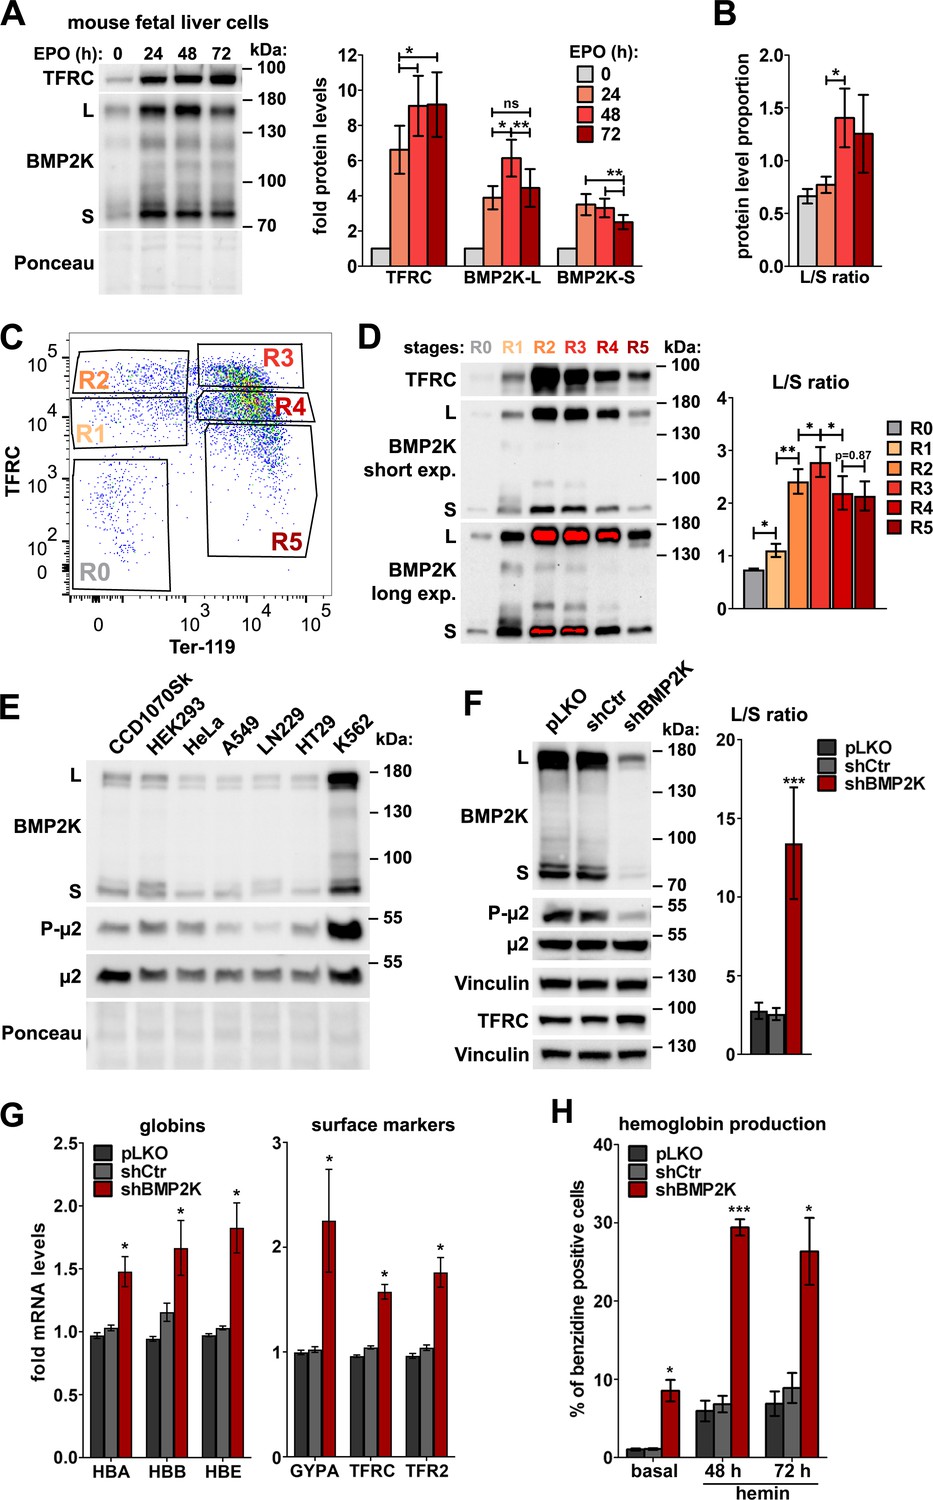
In the erythroid cells, BMP2K splicing variants are enriched and their reduction promotes erythroid differentiation.
(A) Western blots showing the levels of TFRC and BMP2K splicing variants (L and S) at different time-points during erythropoietin (EPO)-stimulated differentiation of mouse fetal liver erythroblasts. Graphs show fold changes in non-normalized protein levels obtained by densitometric analysis of western blotting results (n = 5 +/- SEM). (B) The proportion between the detection intensities of BMP2K-L and -S (L/S ratio) calculated after densitometric analysis of bands from western blots represented in A (n = 6 +/- SEM). (C) Dot plot showing fluorescence intensities of the indicated markers on the surfaces of mouse fetal liver erythroblasts stimulated with EPO for 96 hr. Gates distinguish consecutive differentiation stages (R0–R5) of erythroblasts isolated by fluorescence activated cell sorting (FACS). (D) Western blots (short and long exposures) showing the levels of TFRC and BMP2K variants in the indicated FACS-isolated differentiation stages of erythroblasts. Graph shows the L/S ratio calculated after densitometric analysis of western blotting results (n = 5 +/- SEM). (E) Western blots showing the levels of BMP2K splicing variants or total and Thr156-phosphorylated μ2 (P-μ2) in lysates from the indicated human cell lines. Ponceau staining serves as a gel loading control. (F) Western blots showing the efficiency of depleting all BMP2K variants using shRNA (shBMP2K) in K562 cells, and its effect on the levels of total and phosphorylated μ2 and TFRC as compared to non-depleted cells (empty pLKO vector or non-targeting shRNA, shCtr). Graph shows the L/S ratio calculated after densitometric analysis of western blotting results (n = 6 +/- SEM). (G) Fold changes in mRNA levels of the indicated erythroid markers in control cells or in cells depleted of all BMP2K splicing variants using shRNA (n = 3 or 4 +/- SEM). (H) Percentage of benzidine-positive control cells or cells depleted of BMP2K using shRNA, under basal growth conditions or after stimulation for 48 hr or 72 hr with 20 μM hemin (n = 3 +/- SEM). Values measured for BMP2K-depleted cells (F, G and H) were compared statistically to those measured for shCtr-treated cells. *p<0.05, **p<0.01, ***p<0.001.
-
Figure 1—source data 1
Numerical data for graphs in Figure 1.
- https://cdn.elifesciences.org/articles/58504/elife-58504-fig1-data1-v2.xlsx
Figure 1—figure supplement 1
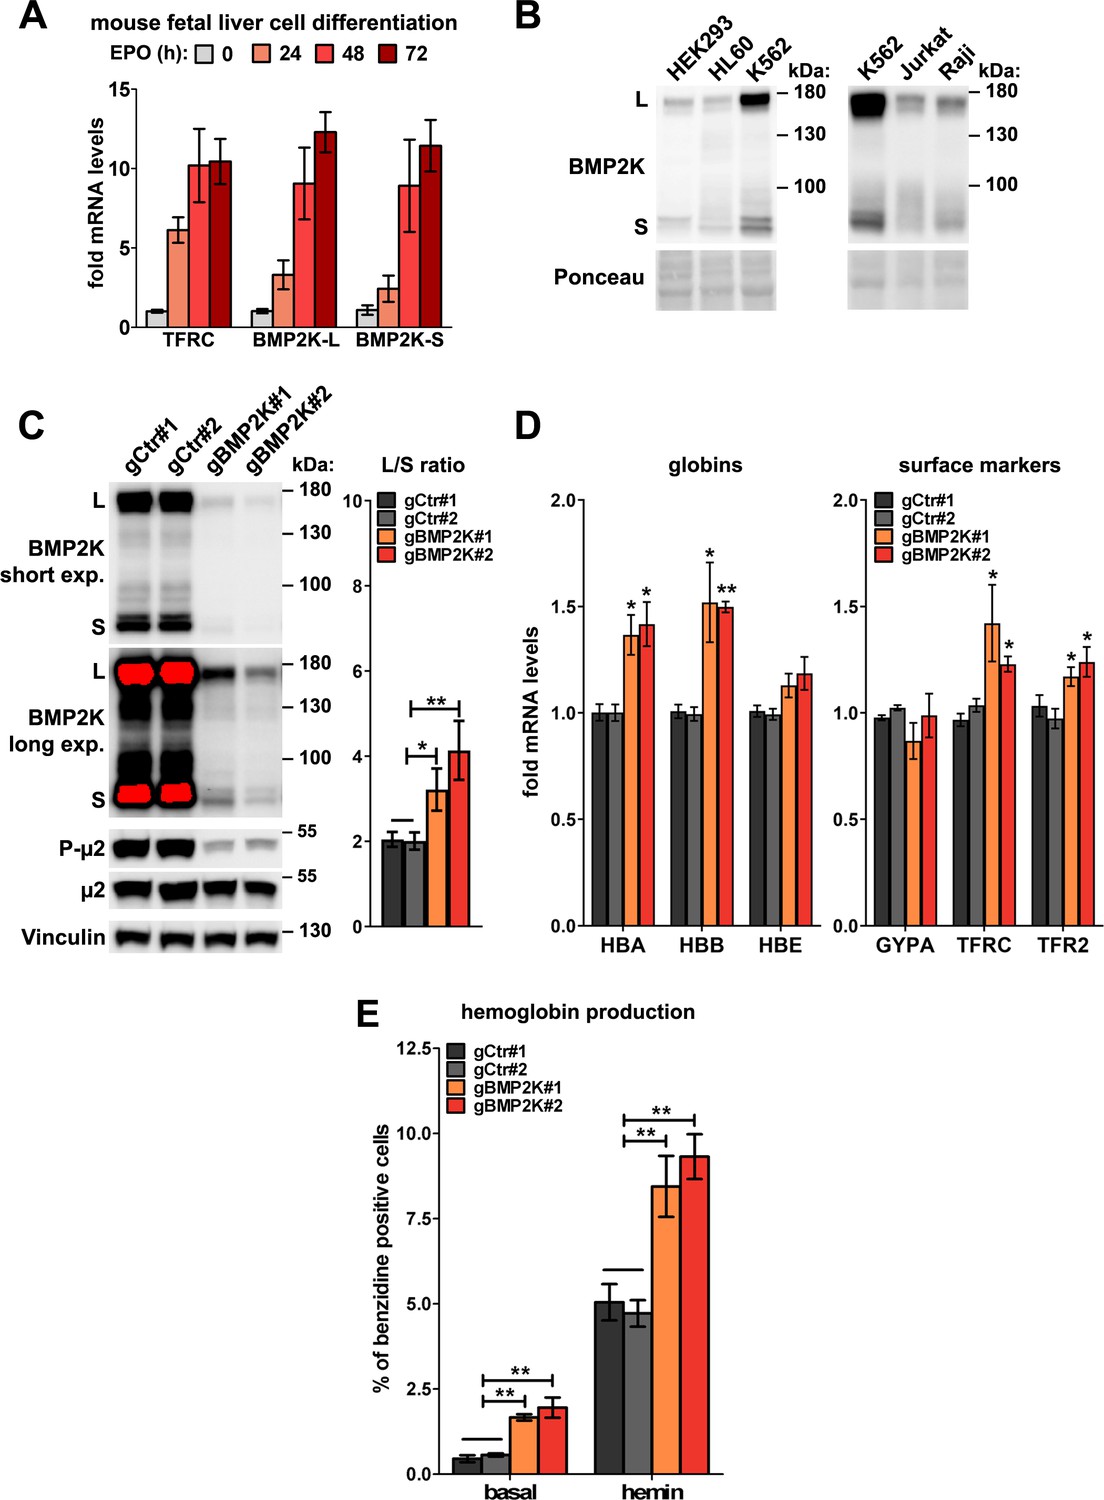
Expression of BMP2K gene in erythroid cells and the effect of its CRISPR/Cas9-mediated silencing on erythroid differentiation.
(A) Fold changes in mRNA levels of transferrin receptor 1 (TFRC) as well as of the longer or shorter BMP2K splicing variants in erythroblasts isolated from mouse fetal liver and differentiated for the indicated time periods using erythropoietin (EPO)-containing medium (n = 4 +/- SEM). (B) Western blots showing the levels of BMP2K splicing variants in lysates from the indicated human cell lines. Ponceau staining serves as a gel loading control. (C) Western blots (short and long exposures) showing the efficiencies of depleting all BMP2K variants using CRISPR/Cas9 approach (gBMP2K#1 or #2) in K562 cells, and its effects on the levels of total and phosphorylated μ2 (P-μ2), as compared to non-depleted cells (non-targeting gRNAs, gCtr#1 and #2). Graph shows the L/S ratio calculated after densitometric analysis of western blotting results (n = 5 +/- SEM). (D) Fold changes in mRNA levels of the indicated erythroid markers in control cells or in cells depleted of all BMP2K splicing variants using CRISPR/Cas9 approach (n = 3 +/- SEM). (E) Percentage of benzidine-positive control cells or cells depleted of BMP2K using CRISPR-Cas9 approach, under basal growth conditions or after stimulation for 48 hr with 20 μM hemin (n = 4 +/- SEM). Values measured for BMP2K-depleted cells (C–E) were compared statistically to the average of values measured for gCtr#1 and gCtr#2-transduced cells. *p<0.05, **p<0.01.
-
Figure 1—figure supplement 1—source data 1
Numerical data for graphs in Figure 1—figure supplement 1.
- https://cdn.elifesciences.org/articles/58504/elife-58504-fig1-figsupp1-data1-v2.xlsx
Figure 1—figure supplement 2

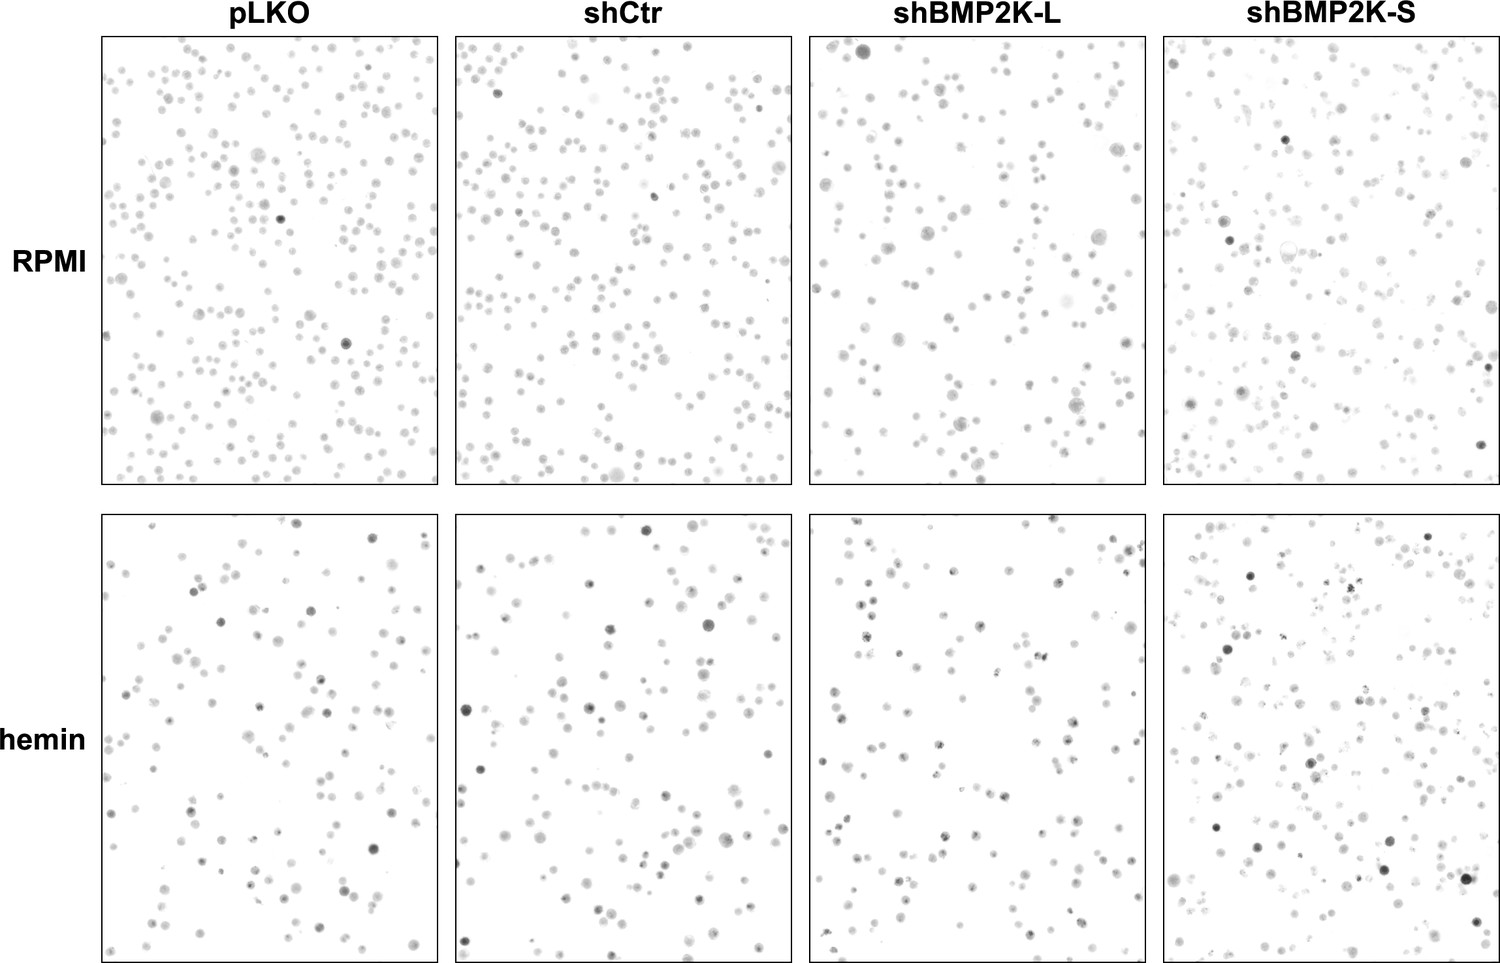
Benzidine staining of K562 cells depleted of all BMP2K splicing variants.
(A and B) Representative images of experiments quantified in Figure 1H and Figure 1—figure supplement 1E showing benzidine staining of non-treated (RPMI medium) or 20 µM hemin-treated (48 hr) K562 cells, control or depleted of all BMP2K splicing variants using shRNA (A) or CRISPR/Cas9 (B) approach. Dark grey/black cells contain hemoglobin.
Figure 1—figure supplement 3
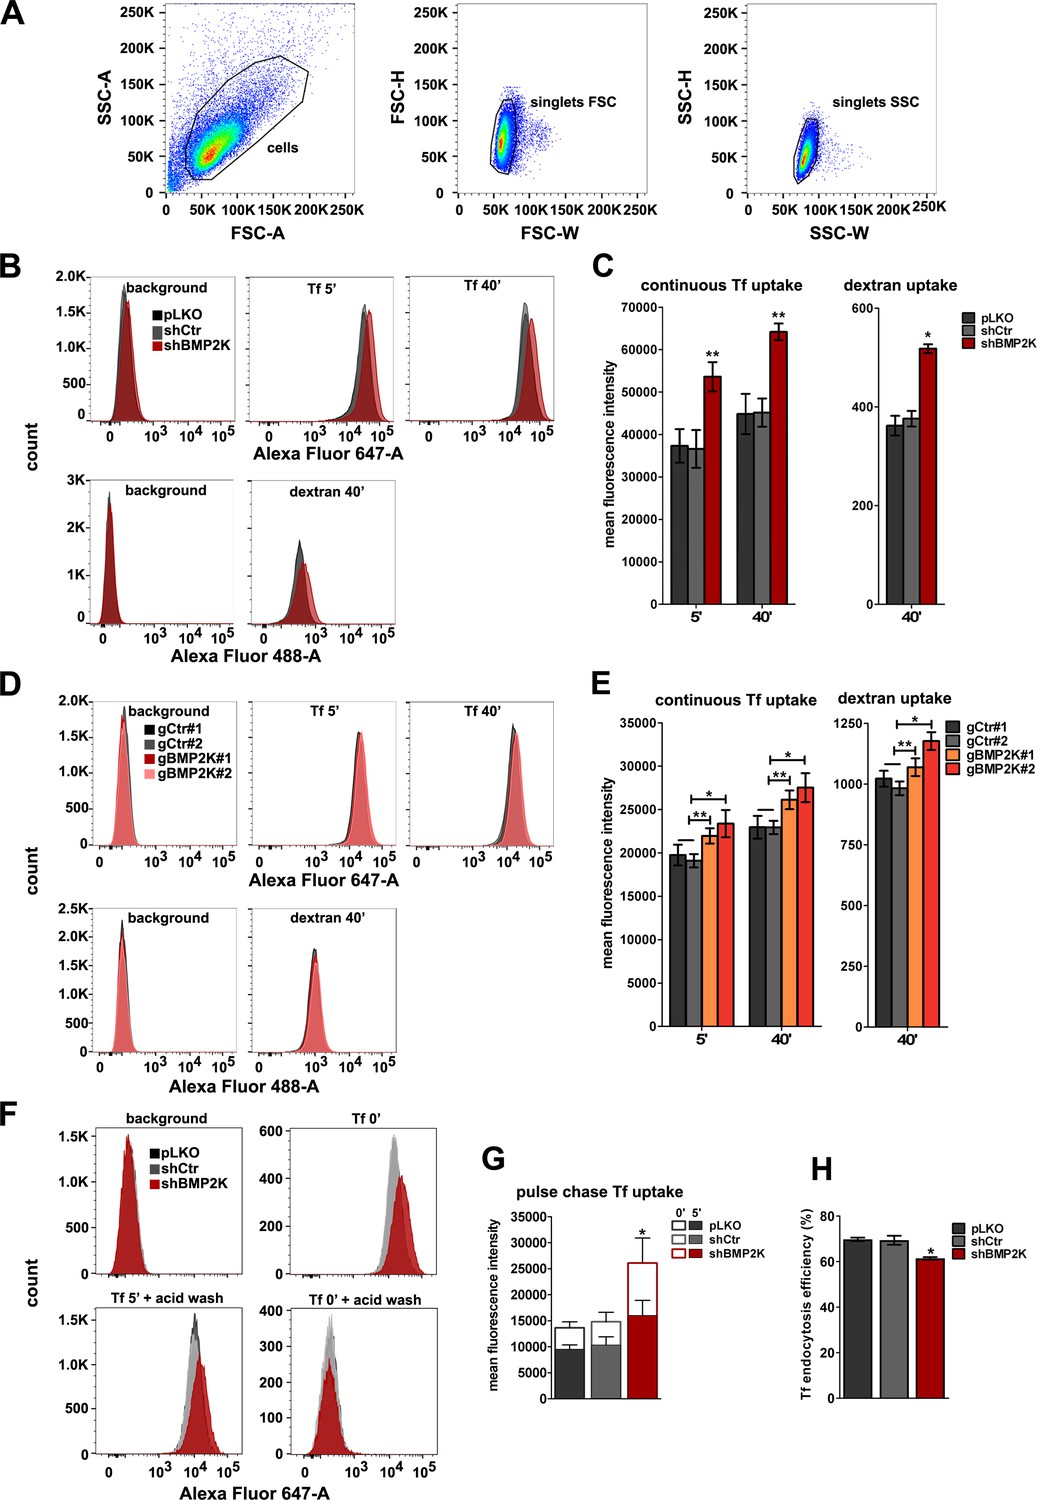
The effects of depleting all BMP2K splicing variants on endocytosis.
(A) An example of gating strategy for flow cytometric analyses applied for K562 cells transduced with empty pLKO vector, including cell gate (FSC vs SSC) and singlet discrimination gates (FSC-H vs FSC-W, SSC-H vs SSC-W). This strategy was applied for all flow cytometry experiments. (B and D) Overlay histograms showing fluorescence signal of AlexaFluor647 or AlexaFluor488, indicating Tf or dextran abundance, respectively, in control cells or cells depleted of BMP2K gene products using shRNA (B) or CRISPR/Cas9 (D) approach. Control constructs used were: empty pLKO vector and non-targeting shRNA, shCtr (B) or non-targeting gRNAs, gCtr#1 and #2 (D). (C and E) Flow cytometry analysis of AlexaFluor647-Transferrin (Tf) or AlexaFluor488-dextran levels in control K562 cells or cells depleted of all BMP2K splicing variants using shRNA (C) or CRISPR/Cas9 (E) approach, after allowing for continuous Tf endocytosis at 37°C for 5' or 40', or after 40' incubation with dextran at 37°C (n = 3 or 4 in C and 4 in E +/- SEM). (F) Overlay histograms showing fluorescence signal of AlexaFluor647, indicating Tf abundance during pulse-chase endocytosis assay in control cells or cells depleted of all BMP2K splicing variants using shRNA. (G, H) Pulse chase Tf uptake in cells with depletion of all BMP2K splicing variants using shRNA. (G) The empty bars represent the amount of fluorescently-labelled Tf pre-bound to cells while the solid bars show the amount of Tf internalized at 37°C for 5’ (n = 3 +/- SEM). (H) The percentage of internalized Tf with respect to the amount of pre-bound Tf (n = 3 +/- SEM). The histograms (B, D and F) illustrate representative experiments included in the analyses shown in C, E, G and H. Values obtained for BMP2K-depleted cells were compared statistically to those in shCtr-treated cells (C, G and H) or to the average of values measured for gCtr#1 and gCtr#2-transduced cells (E). *p<0.05, **p<0.01.
-
Figure 1—figure supplement 3—source data 1
Numerical data for graphs in Figure 1—figure supplement 3.
- https://cdn.elifesciences.org/articles/58504/elife-58504-fig1-figsupp3-data1-v2.xlsx
Figure 2 with 2 supplements
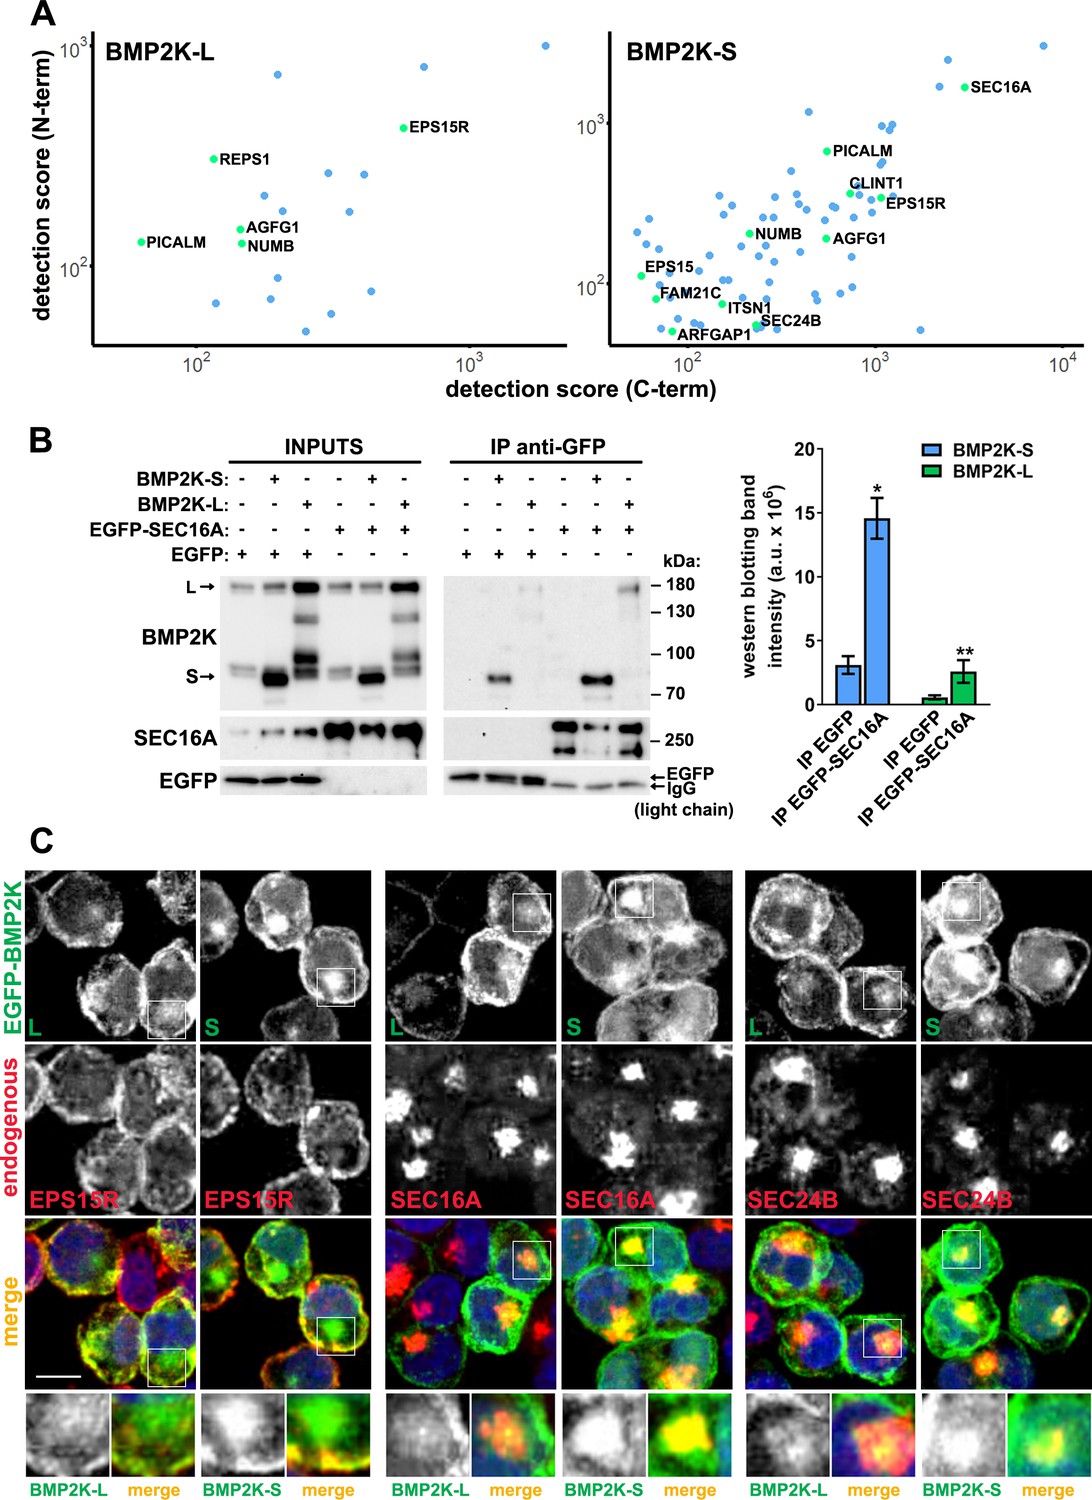
The BioID interactome analysis and its subsequent validation show that both BMP2K splicing variants can associate with SEC16A protein and localize to the early secretory compartment.
(A) Dot plots showing BioID-MS detection scores (log scale) of proteins found as proximal to both N- and C-terminally tagged BMP2K-S or -L variants in HEK293 cells. (B) Levels of BMP2K-L, BMP2K-S, EGFP or EGFP-tagged SEC16A in whole cell lysates (INPUTS) or in immunoprecipitates (IP) using anti-GFP antibodies from HEK293 cells. Different combinations of simultaneous ectopic expression of the analyzed proteins are indicated above the images. Graph shows non-normalized densitometric analysis of western blotting bands expressed in arbitrary units (a.u.; n = 3 +/- SEM). (C) Maximum intensity projection images from confocal microscope showing localization of ectopically expressed EGFP-tagged BMP2K-L or -S with respect to the indicated proteins and cell nuclei marked with DAPI stain (blue) in K562 cells. Insets: Magnified views of boxed regions in the main images. Scale bars, 10 µm. *p<0.05, **p<0.01.
-
Figure 2—source data 1
Numerical data for graphs in Figure 2.
- https://cdn.elifesciences.org/articles/58504/elife-58504-fig2-data1-v2.xlsx
Figure 2—figure supplement 1
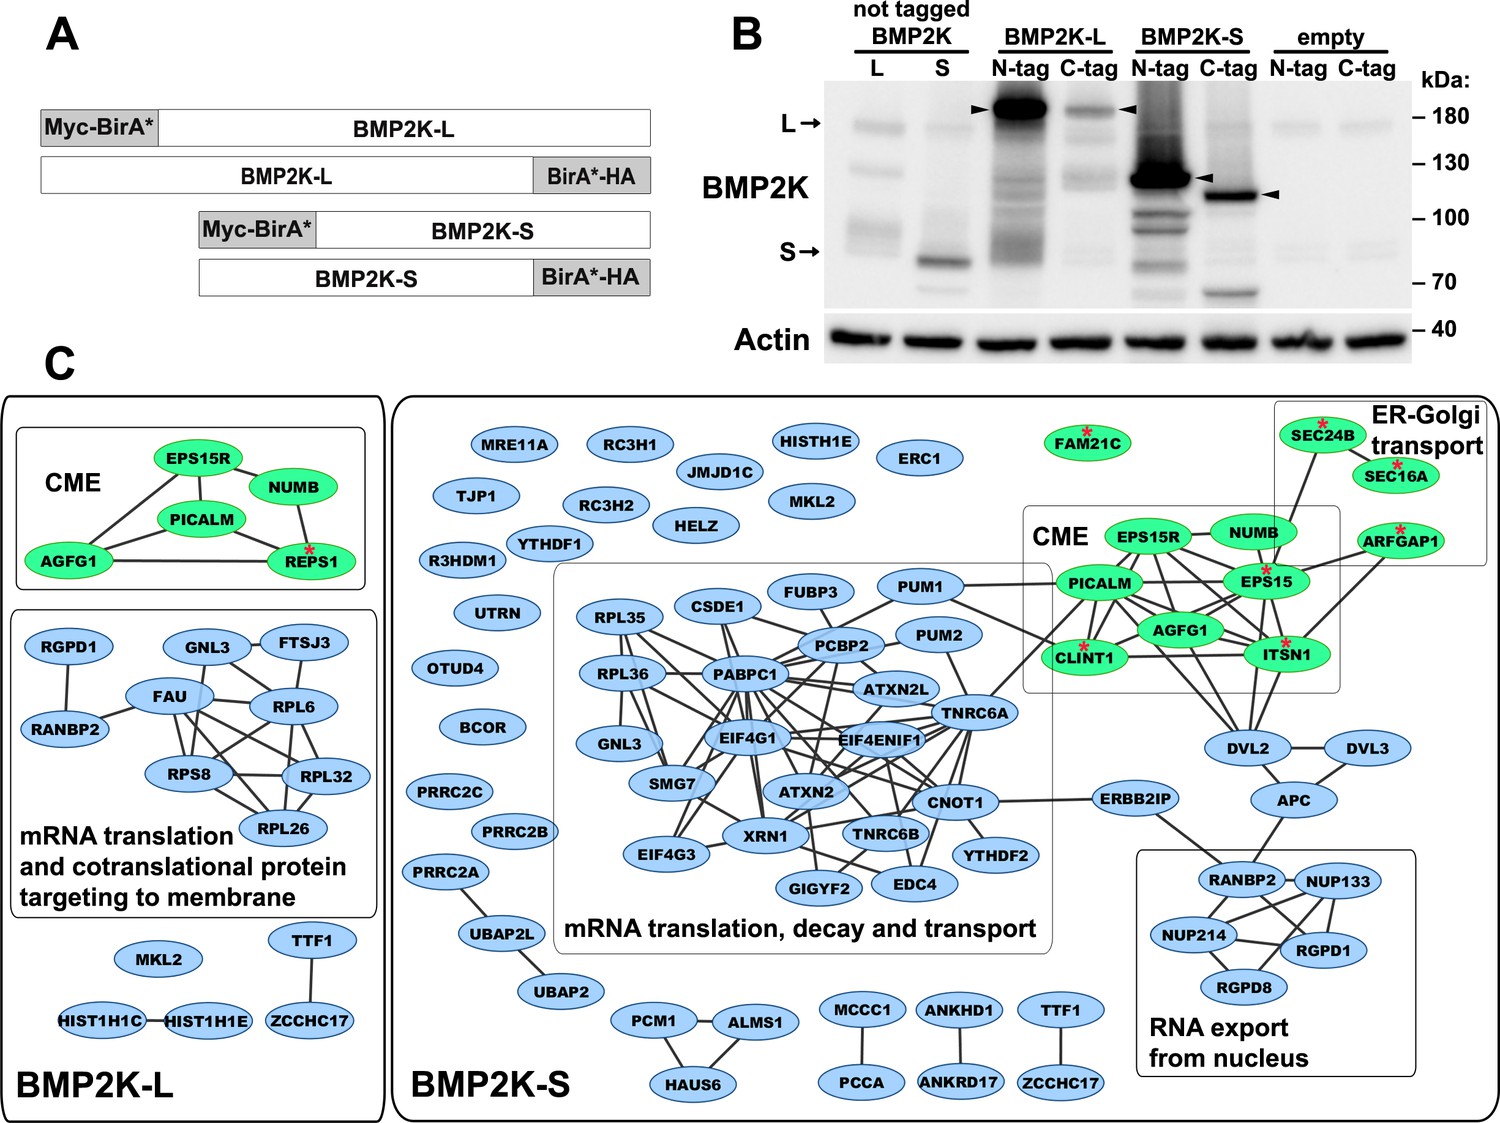
Proximity biotinylation (BioID) analysis of BMP2K-L or -S interactomes.
(A) Schematic representation of fusion proteins that were ectopically expressed in HEK293 cells for the purpose of the proximity biotinylation (BioID) analysis. (B) Western blots showing transient expression in HEK293 cells of BMP2K-L or BMP2K-S, N- or C- terminally tagged with BirA* biotin ligase as well as non-tagged L or S isoforms. Bands representing the full-length proteins are indicated by arrows (for non-tagged L and S isoforms) or arrowheads (for BirA*-tagged proteins). Actin was used as a gel loading control. (C) Cytoscape diagrams (www.cytoscape.org) showing interactions between proteins detected in BioID as proximal to BMP2K-L or -S isoforms with indications of functionally related protein groups (CME – clathrin-mediated endocytosis). Green color indicates known regulators of vesicular trafficking. Red asterisks mark vesicular trafficking-related proteins detected as proximal to only one of the isoforms.
Figure 2—figure supplement 2

The analysis of intracellular distribution of BMP2K variants.
(A) Representative maximum intensity projection images from confocal microscope showing intracellular localization of endogenous BMP2K with respect to endogenous EPS15R in K562 cells depleted of single (shBMP2K-L or shBMP2K-S) or all BMP2K splicing variants (shBMP2K), as compared to empty pLKO vector or non-targeting shRNA construct, shCtr. Cell nuclei marked with DAPI stain (blue). Scale bar, 10 µm. (B) Integral fluorescence intensity of BMP2K staining, shown as arbitrary units (a.u.) per cell, quantified from microscopic images of cells depleted of BMP2K splicing variants as represented by those in A (n = 4 +/- SEM). Values in cells depleted of BMP2K variants were compared statistically to the levels in cells treated with shCtr. (C) Mean pixel intensity of EGFP fluorescence signal in the indicated cell regions (plasma membrane, PM, or juxtanuclear) shown as fold change over mean intensity in the remaining cell area (represented by dashed horizontal line). Quantification performed based on images of cells represented in Figure 2C: transduced with EGFP only, or EGFP-tagged BMP2K variants and stained using antibodies detecting SEC16A or SEC24B proteins (n = 1, >4000 cells/condition). *p<0.05, **p<0.01, ***p<0.01.
-
Figure 2—figure supplement 2—source data 1
Numerical data for graphs in Figure 2—figure supplement 2.
- https://cdn.elifesciences.org/articles/58504/elife-58504-fig2-figsupp2-data1-v2.xlsx
Figure 3 with 1 supplement
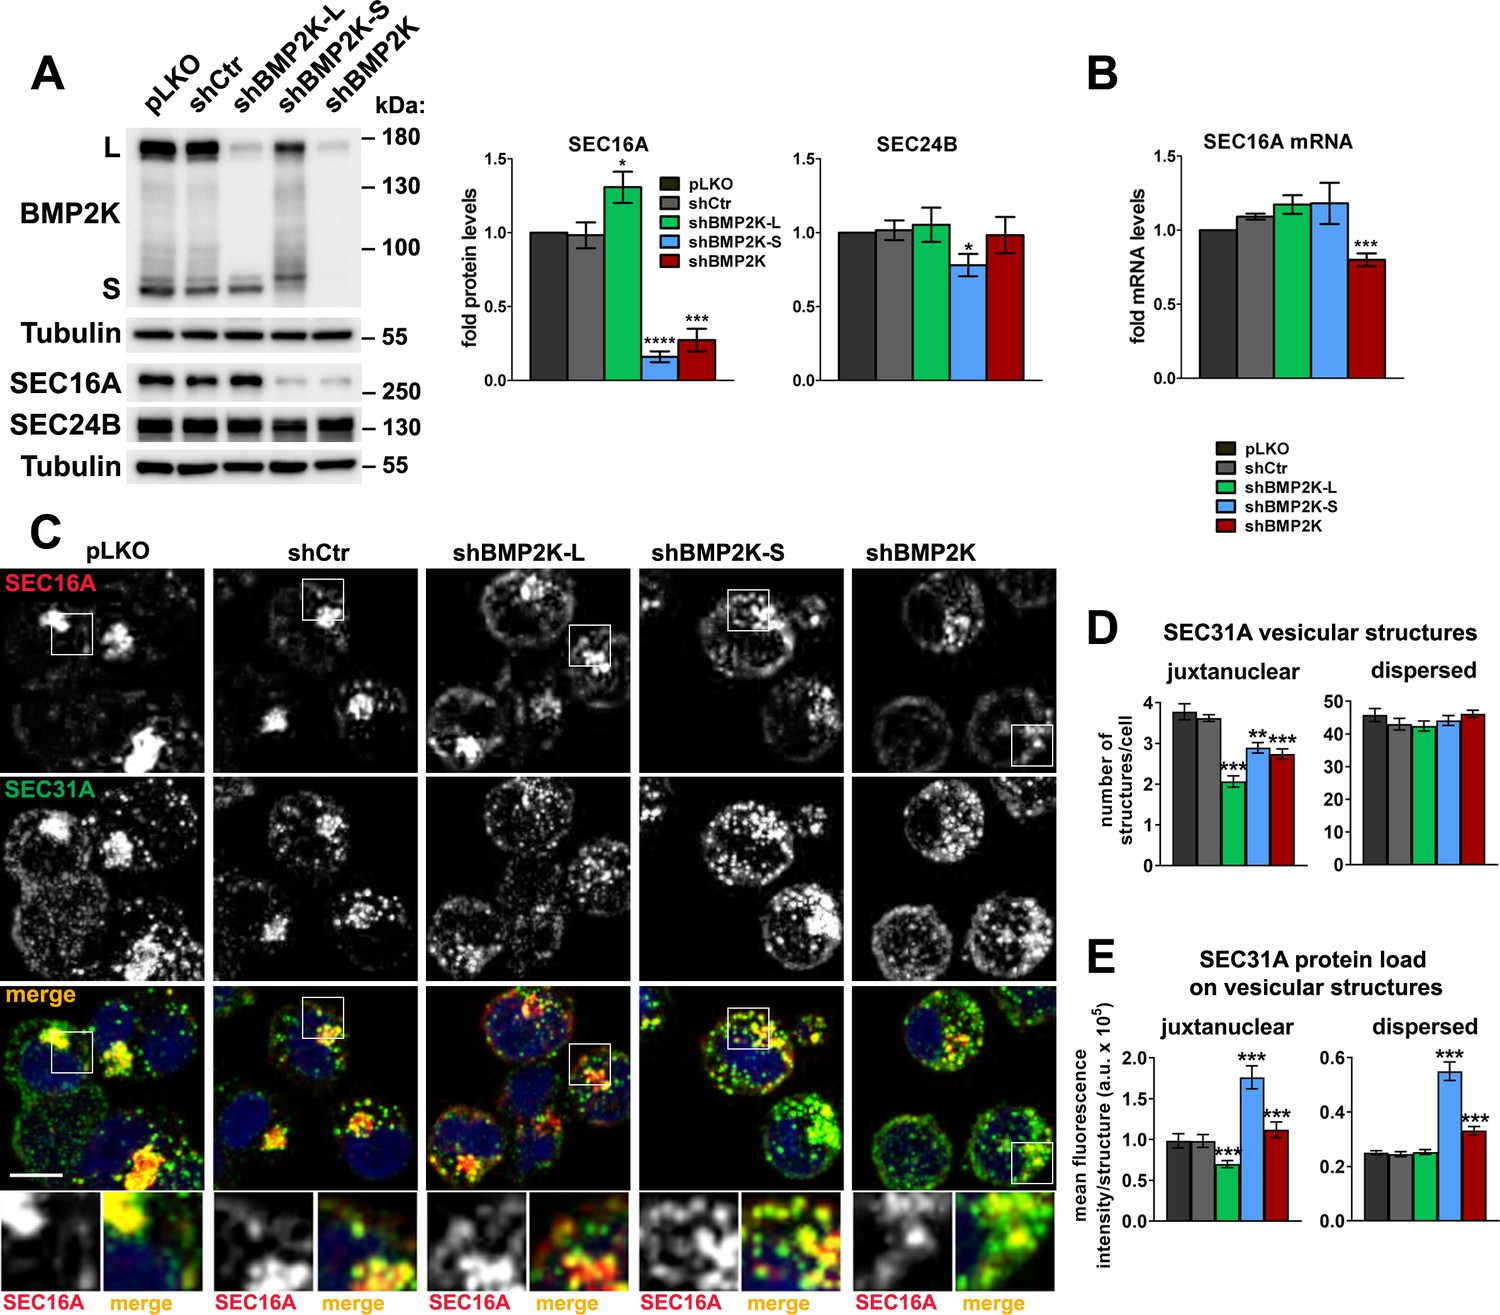
BMP2K splicing variants differentially regulate SEC16A protein levels and distribution and control the abundance of SEC31A-positive structures.
(A) Western blots showing the effect of shRNA-mediated depletion of single (shBMP2K-L or shBMP2K-S) or all BMP2K splicing variants (shBMP2K) on the levels of SEC16A and SEC24B proteins, as compared to empty pLKO vector or non-targeting shRNA construct, shCtr. Graphs show densitometric analysis of western blotting bands for the indicated proteins using tubulin abundance for normalization (n = 5 +/- SEM). (B) SEC16A mRNA fold levels in control cells or in cells with shRNA-mediated depletion of BMP2K variants (n = 5 +/- SEM). (C) Representative maximum intensity projection images from confocal microscope, showing the effect of shRNA-mediated depletion of BMP2K variants on immunolocalization of SEC16A and SEC31A proteins in K562 cells. Cell nuclei marked with DAPI stain (blue). Insets: Magnified views of boxed regions in the main images. Scale bar, 10 µm. (D and E) The number of juxtanuclear and dispersed SEC31A-positive vesicular structures per cell (D) or SEC31A mean fluorescence intensity per vesicular structure (SEC31A protein load) presented in arbitrary units (a.u. in E) in control cells or cells lacking BMP2K variants. Quantification from images represented by those in C (n = 5 +/- SEM). *p<0.05, **p<0.01, ***p<0.001, ****p<0.0001.
-
Figure 3—source data 1
Numerical data for graphs in Figure 3.
- https://cdn.elifesciences.org/articles/58504/elife-58504-fig3-data1-v2.xlsx
Figure 3—figure supplement 1
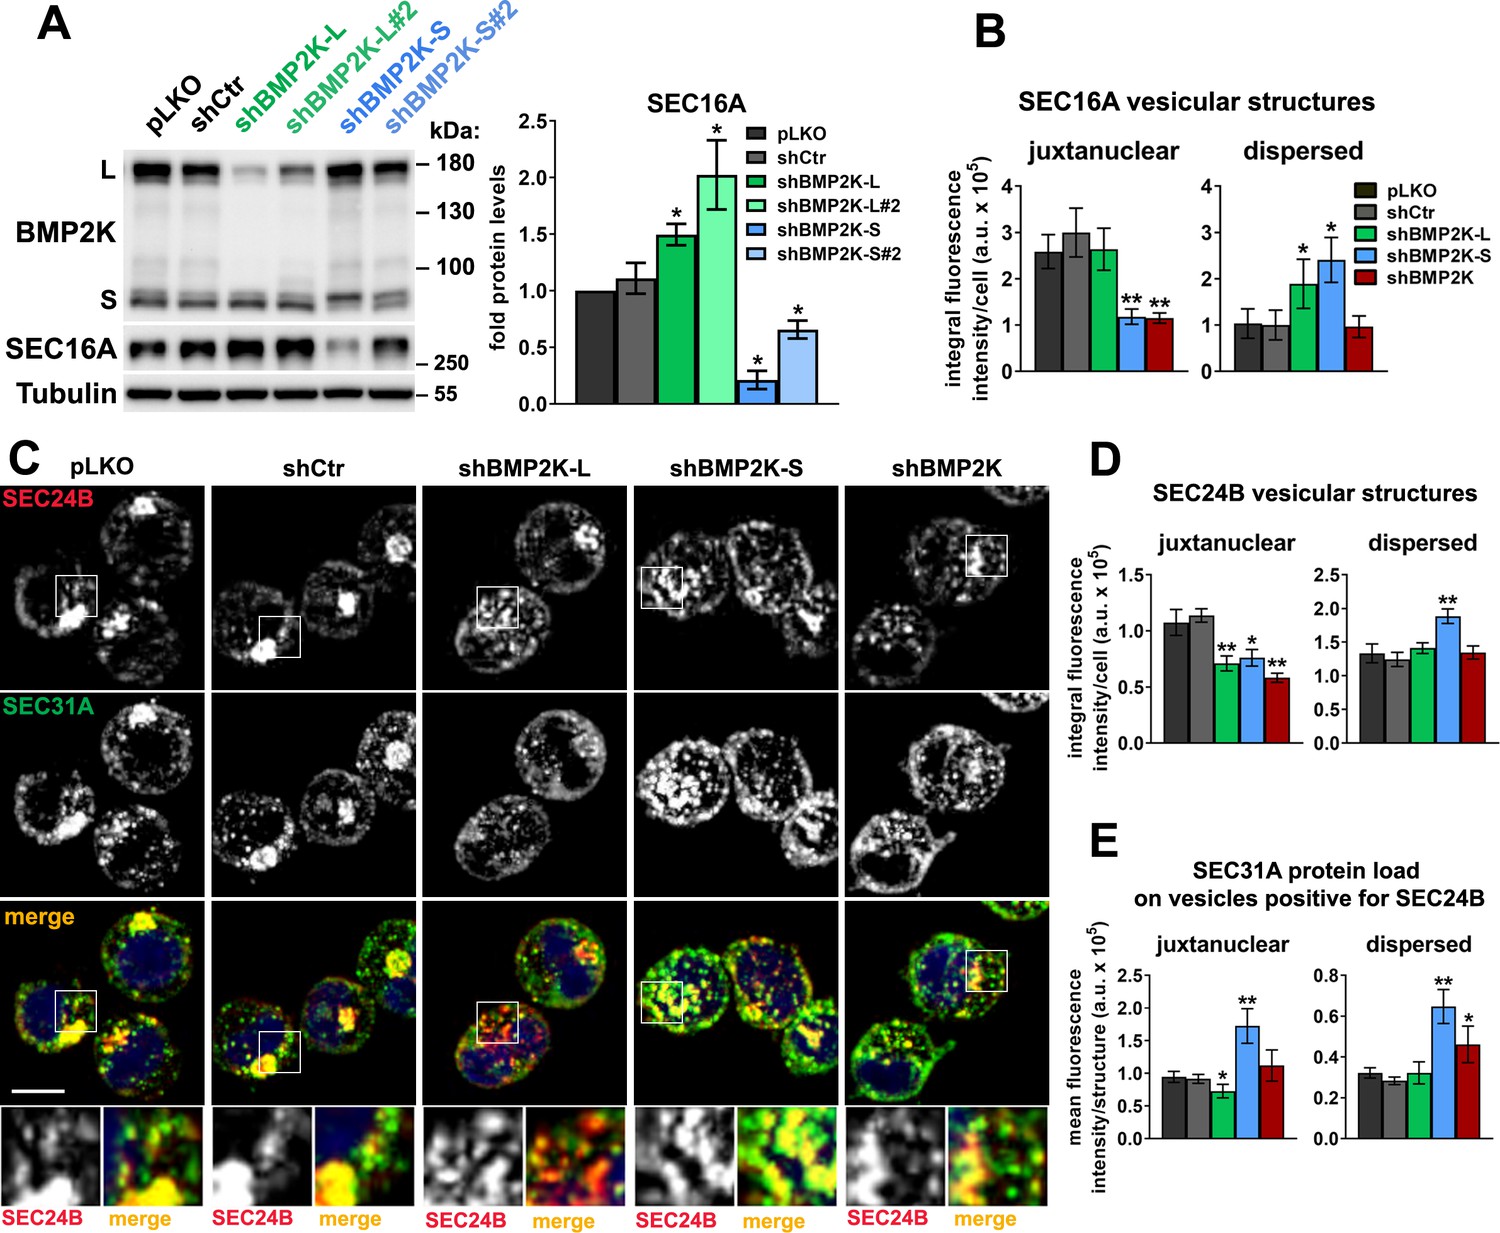
The effects of depleting BMP2K splicing variants on the abundance and distribution of SEC16A and COPII markers.
(A) Western blots showing the efficiencies of BMP2K-L or -S depletion by additional shRNAs (shBMP2K-L#2 and shBMP2K-S#2) and their effects on SEC16A protein levels as compared to control vectors (pLKO, shCtr) and shRNAs shown in Figure 3 (shBMP2K-L and shBMP2K-S). Graph shows densitometric analysis of western blotting bands for the indicated proteins using tubulin abundance for normalization (n = 3 +/- SEM). (B) Integral fluorescence intensity of juxtanuclear or dispersed SEC16A structures presented in arbitrary units (a.u.) per cell in control cells or in cells depleted of single (shBMP2K-L or shBMP2K-S) or all BMP2K splicing variants (shBMP2K). Quantifications performed based on images represented by those shown in Figure 3C (n = 5 +/- SEM). (C) Representative maximum intensity projection images from confocal microscope, showing the effect of shRNA-mediated depletion of BMP2K splicing variants on immunolocalization of SEC24B with respect to immunostained SEC31A protein in K562 cells. Cell nuclei marked with DAPI stain (blue). Insets: Magnified views of boxed regions in the main images. Scale bar, 10 µm. (D and E) Integral fluorescence intensity of juxtanuclear or dispersed SEC24B vesicular structures (D) and SEC31A mean fluorescence intensity (SEC31A protein load) of SEC24B-positive structures (E), presented in arbitrary units (a.u.) per cell, in control cells or cells lacking BMP2K variants. Quantifications in D and E performed based on images represented by those shown in C (n = 4 +/- SEM). Values obtained for cells depleted of BMP2K variants were compared statistically to the levels in cells treated with shCtr. *p<0.05, **p<0.01.
-
Figure 3—figure supplement 1—source data 1
Numerical data for graphs in Figure 3—figure supplement 1.
- https://cdn.elifesciences.org/articles/58504/elife-58504-fig3-figsupp1-data1-v2.xlsx
Figure 4 with 1 supplement
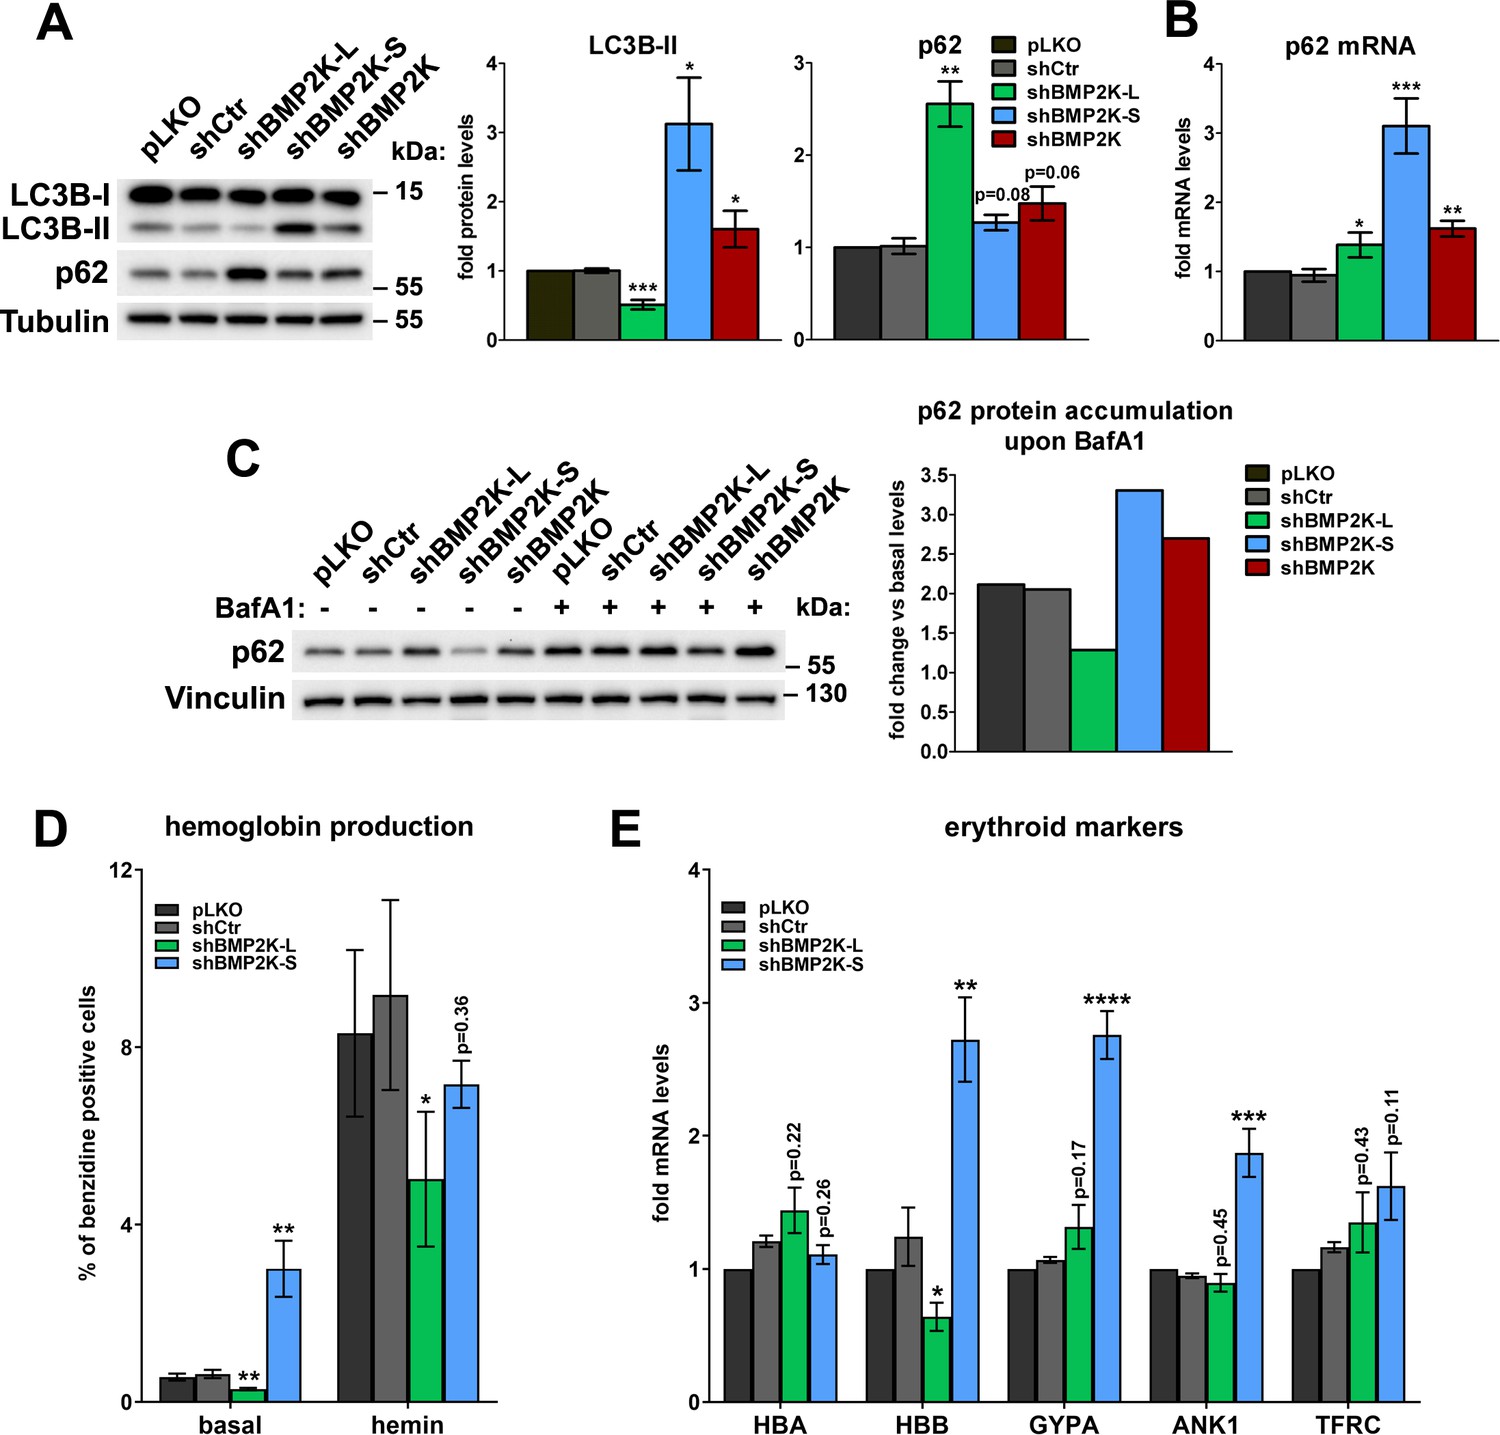
BMP2K-L and BMP2K-S differentially regulate autophagic degradation and erythroid differentiation.
(A) Western blots showing the effects of depletion of single (shBMP2K-L or shBMP2K-S) or all BMP2K splicing BMP2K variants on the levels of LC3B-I, LC3B-II and p62 proteins in K562 cells, as compared to empty pLKO vector or non-targeting shRNA construct, shCtr. Graphs show densitometric analysis of western blotting bands for the indicated proteins using tubulin abundance for normalization (n = 4 +/- SEM). (B) p62 mRNA fold change levels in control cells or in cells with shRNA-mediated depletion of BMP2K variants, as in A (n = 5 +/- SEM). (C) The abundance of p62 protein in non-treated cells or in cells treated for 15 hr with 75 nM bafilomycin A1 (BafA1). Graph shows calculated fold increase of p62 protein levels induced by BafA1, obtained after densitometric analysis of western blotting bands using vinculin abundance for normalization (n = 1). (D) Percentage of benzidine-positive control cells or cells depleted of BMP2K variants, under basal growth conditions or after stimulation for 48 hr with 20 μM hemin (n = 5 +/- SEM). (E) Fold changes in mRNA levels of the indicated erythroid markers in control cells or in cells depleted of all BMP2K splicing variants using shRNA (n = 5 +/- SEM). *p<0.05, **p<0.01, ***p<0.001.
-
Figure 4—source data 1
Numerical data for graphs in Figure 4.
- https://cdn.elifesciences.org/articles/58504/elife-58504-fig4-data1-v2.xlsx
Figure 4—figure supplement 1
Benzidine staining of K562 cells depleted of BMP2K-L or -S.
Representative images of experiments quantified in Figure 4D showing benzidine staining of non-treated (RPMI medium) or 20 µM hemin-treated (48 hr) K562 cells, control or depleted of single BMP2K splicing variants using shRNA. Dark grey/black cells contain hemoglobin.
Author response image 1

(A) Graphical comparison of amino acid sequences adjacent to Thr156 in μ2 and Thr102 in NUMB (both known to be phosphorylated in human cells by AAK1, a BMP2K homologue) and Thr1045 in SEC16A, that we identify as a candidate BMP2K phosphorylation site.
The color code indicates that two upstream residues of SEC16A Thr1045 are identical to the respective residues in μ2, while two downstream amino acids are identical to those in NUMB. (B) Alignment of ~60 amino acids surrounding Thr1045 in human SEC16A and in its homologues from selected vertebrates. Green color indicates residues shown in A, grey color indicates a hydrophobic residue (φ) five amino acids upstream of the putative phosphorylation site. (C) Western blots showing the effect of increasing concentrations of LP935509, AAK1/BMP2K inhibitor, on the levels of endogenous SEC16A and phosphorylated μ2 in K562 cells. (D) Western blots showing the effects of control shRNA (Ctr), shBMP2K-L (L) or shBMP2K-S (S) on the levels of ectopically expressed EGFP-SEC16A either WT or with Thr1045 mutated to Ala (TA) or Glu (TE) in K562 cells. (E) Western blots showing the effects of the LP inhibitor on the levels of ectopically expressed WT or mutant EGFP-SEC16A in K562 cells.
Author response image 2
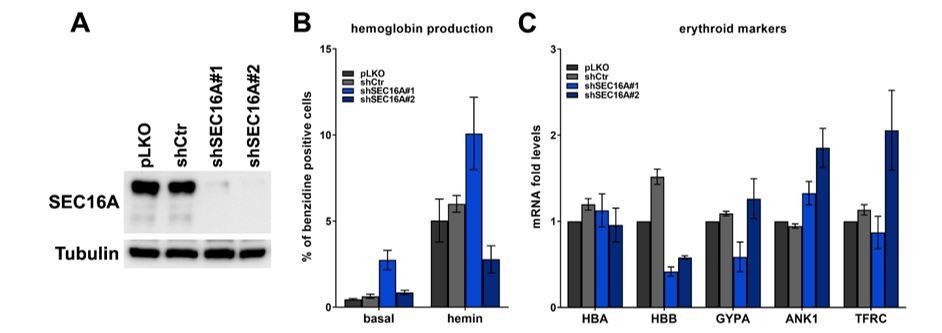
(A) Representative western blot showing the efficiency of SEC16A depletion using two single shRNAs.
(B) Percentage of benzidine-positive control K562 cells or cells depleted of SEC16A, under basal growth conditions or after stimulation for 48 h with 20 μM hemin (n=4 for basal or n=3 for hemin +/- SEM). (C) Fold changes in mRNA levels of the indicated erythroid markers in control cells or in cells depleted of SEC16A (n=3 +/- SEM).
Tables
Key resources table
| Reagent type (species) or resource | Designation | Source or reference | Identifiers | Additional information |
|---|---|---|---|---|
| Cell line (Homo sapiens) | K562 | ATCC | Cat# CCL-243, RRID:CVCL_0004 | |
| Cell line (Homo sapiens) | HEK293 | ATCC | Cat# CRL-1573, RRID:CVCL_0045 | |
| Cell line (Homo sapiens) | HEK293T | ATCC | Cat# CRL-3216, RRID:CVCL_0063 | |
| Transfected construct (Homo sapiens) | BMP2K shRNA | Sigma-Aldrich | TRCN0000000915 | pLKO.1 Lentiviral construct to transfect and express the shRNA |
| Transfected construct (Homo sapiens) | BMP2K-L shRNA | This paper | pLKO.1 Lentiviral construct to transfect and express the shRNA. See Supplementary file 1-Table 3. | |
| Transfected construct (Homo sapiens) | BMP2K-S shRNA | This paper | pLKO.1 Lentiviral construct to transfect and express the shRNA. See Supplementary file 1-Table 3. | |
| Transfected construct (Homo sapiens) | empty pLKO.1 plasmid | Sigma-Aldrich | SHC001 | pLKO.1 Lentiviral construct to transfect and express the shRNA |
| Transfected construct (Homo sapiens) | non-targeting shRNA plasmid | Sigma-Aldrich | SHC202 | pLKO.1 Lentiviral construct to transfect and express the shRNA |
| Transfected construct (Homo sapiens) | BMP2K gRNAs (gBMP2K#1and #2) | This paper | lentiCRISPRv2 Lentiviral construct to transfect and express the gRNA together with Cas9. See Supplementary file 1-Table 4. | |
| Transfected construct (Homo sapiens) | non-targeting gRNAs (gCtr#1and #2) | This paper | lentiCRISPRv2 Lentiviral construct to transfect and express the gRNA together with Cas9. See Supplementary file 1-Table 4. | |
| Transfected construct (Homo sapiens) | pEGFP-SEC16A | Addgene | Cat# 36155 | |
| Biological sample (Mus musculus) | Primary mouse fetal liver cells | Mossakowski Medical Research Centre Polish Academy of Sciences | Freshly isolated from Mus musculus (strain C57BL/6J) | |
| Antibody | anti-BMP2K (mouse monoclonal, ascites) | Santa Cruz Biotechnology | Cat# sc-134284, RRID:AB_2227882 | WB(1:2000), IF(1:500) |
| Antibody | anti-SEC16A (rabbit polyclonal) | Bethyl | Cat# A300-648A, RRID:AB_519338 | WB(1:1000) |
| Antibody | anti-SEC16A (rabbit polyclonal) | Atlas Antibodies | Cat# HPA005684, RRID:AB_1079189 | IF(1:400) |
| Antibody | anti-SEC24B (rabbit monoclonal) | Cell Signaling Technology | Cat# 12042, RRID:AB_2797807 | WB(1:1000), IF(1:200) |
| Antibody | anti-SEC31A (mouse monoclonal) | BD Biosciences | Cat# 612350, RRID:AB_399716 | IF(1:200) |
| Antibody | anti-EPS15R (rabbit monoclonal) | Abcam | Cat# ab76004, RRID:AB_1310187 | IF(1:200) |
| Antibody | anti-LC3B (rabbit polyclonal) | Cell Signaling Technology | Cat# 2775, RRID:AB_915950 | WB(1:1000) |
| Antibody | anti-SQSTM1/p62 (mouse monoclonal) | BD Biosciences | Cat# 610833, RRID:AB_398152 | WB(1:1000) |
| Antibody | anti-Phospho-μ2 (Thr156) (D4F3) (rabbit monoclonal) | Cell Signaling Technology | Cat# 7399, RRID:AB_10949770 | WB(1:1000) |
| Antibody | anti-μ2 (mouse monoclonal) | BD Biosciences | Cat# 611350, RRID:AB_398872 | WB(1:500) |
| Antibody | anti-GFP (goat polyclonal) | R&D Systems | Cat# AF4240, RRID:AB_884445 | IP(1:60) |
| Antibody | APC-conjugated anti-CD71/TFRC (rat monoclonal) | Thermo Fisher Scientific | Cat# 17-0711-80, RRID:AB_1834356 | FC(1:160) |
| Antibody | PE-conjugatedanti-TER-119 (rat monoclonal) | Thermo Fisher Scientific | Cat# 12-5921-81, RRID:AB_466041 | FC(1:80) |
| Peptide, recombinant protein | recombinant human EPO | PeproTech | Cat# 100–64 | |
| Chemical compound, drug | Hemin | Sigma-Aldrich | Cat# H9039 | |
| Chemical compound, drug | benzidine dihydrochloride | Sigma-Aldrich | Cat# B3383 | |
| Chemical compound, drug | bafilomycin A1 | Sigma-Aldrich | Cat# B1793 | |
| Software, algorithm | Harmony 4.9 | PerkinElmer | Imaging and Analysis Software for Opera Phenix microscope | |
| Software, algorithm | ImageJ software | ImageJ (http://imagej.nih.gov/ij/) | RRID:SCR_003070 | |
| Software, algorithm | GraphPad Prismeight software | GraphPad Prism (https://graphpad.com) | RRID:SCR_015807 | |
| Other | Alexa Fluor 647-conjugated Transferrin | Thermo Fisher Scientific | Cat# T23366 | |
| Other | Alexa Fluor 488-conjugated 10 kDa dextran | Thermo Fisher Scientific | Cat# T23366 | |
| Other | Dynabeads MyOne Streptavidin-coupled magnetic beads | Thermo Fisher Scientific | Cat# 65001 |
Additional files
-
Supplementary file 1
Supplementary tables.
Tables 1 and 2. List of proteins detected in BioID as proximal to BMP2K-L (1) or BMP2K-S (2) tagged with a mutant BirA biotin ligase (BirA*). Corresponding Gene symbols and Uniprot identifiers are provided. The list is ranked according to mean score between subtracted scores from N-terminally (N-tag) and C-terminally (C-tag) tagged baits. Table 3. List of shRNAs designed to deplete both (shBMP2K), or specific (BMP2K-L or BMP2K-S) BMP2K variants. Target nucleotide sequences as well as their locations on mRNA are provided. CDS – coding sequence, UTR – untranslated region. Table 4. List of gRNAs, non-targeting (gCtrl#1 and 2) or targeting BMP2K gene by CRISPR/Cas9 system (gBMP2K#1 and 2). When applicable, chromosomal position of base after cut by Cas9 as well as targeted DNA strand and location on gene are indicated. Table 5. List of primers used for assessing the levels of indicated human or mouse transcripts using qRT-PCR. Nucleotide sequences of both, forward and reverse primers are provided.
- https://cdn.elifesciences.org/articles/58504/elife-58504-supp1-v2.docx
-
Transparent reporting form
- https://cdn.elifesciences.org/articles/58504/elife-58504-transrepform-v2.docx
Download links
A two-part list of links to download the article, or parts of the article, in various formats.
Downloads (link to download the article as PDF)
Open citations (links to open the citations from this article in various online reference manager services)
Cite this article (links to download the citations from this article in formats compatible with various reference manager tools)
Splicing variation of BMP2K balances abundance of COPII assemblies and autophagic degradation in erythroid cells
eLife 9:e58504.
https://doi.org/10.7554/eLife.58504


