Splicing variation of BMP2K balances abundance of COPII assemblies and autophagic degradation in erythroid cells

  1. Jaroslaw Cendrowski  Is a corresponding author
  2. Marta Kaczmarek
  3. Michał Mazur
  4. Katarzyna Kuzmicz-Kowalska
  5. Kamil Jastrzebski
  6. Marta Brewinska-Olchowik
  7. Agata Kominek
  8. Katarzyna Piwocka
  9. Marta Miaczynska  Is a corresponding author
  1. Laboratory of Cell Biology, International Institute of Molecular and Cell Biology, Poland
  2. Laboratory of Cytometry, Nencki Institute of Experimental Biology, Poland

Abstract

Intracellular transport undergoes remodeling upon cell differentiation, which involves cell type-specific regulators. Bone morphogenetic protein 2-inducible kinase (BMP2K) has been potentially implicated in endocytosis and cell differentiation but its molecular functions remained unknown. We discovered that its longer (L) and shorter (S) splicing variants regulate erythroid differentiation in a manner unexplainable by their involvement in AP-2 adaptor phosphorylation and endocytosis. However, both variants interact with SEC16A and could localize to the juxtanuclear secretory compartment. Variant-specific depletion approach showed that BMP2K isoforms constitute a BMP2K-L/S regulatory system that controls the distribution of SEC16A and SEC24B as well as SEC31A abundance at COPII assemblies. Finally, we found L to promote and S to restrict autophagic degradation and erythroid differentiation. Hence, we propose that BMP2K-L and BMP2K-S differentially regulate abundance and distribution of COPII assemblies as well as autophagy, possibly thereby fine-tuning erythroid differentiation.

Introduction

In eukaryotic cells, vesicular transport underlies endocytosis and exocytosis, ensuring the proper distribution of transmembrane proteins between cellular compartments. It involves vesicles which, depending on their origin, can be formed by one of protein coat assemblies (clathrin, COPI and COPII) (Gomez-Navarro and Miller, 2016). Clathrin assembles into lattices shaping vesicles transporting cargo from the plasma membrane (PM) or the trans-Golgi network to the endolysosomal system (Robinson, 2015). COPI and COPII vesicles transport cargo within the early secretory pathway. COPII vesicles bud at the ER exit sites (ERES) and deliver cargo to the ER-Golgi intermediate compartment (ERGIC) and the Golgi (Venditti et al., 2014), while COPI vesicles transport cargo from the Golgi and the ERGIC back to the ER and between the Golgi cisternae (Arakel and Schwappach, 2018).

As initially characterized in yeast, COPII–mediated transport involves sequential recruitment of coat components, including the Sar1 GTPase, the Sec23/Sec24, and the Sec13/Sec31 subcomplexes. The Sec23/Sec24 inner shell sorts cargo into ER-derived vesicles while Sec13 and Sec31 polymerize forming their outer cage. The scission of budding vesicles occurs due to Sar1 GTPase activity which is stimulated by the assembled coat, particularly by the recruitment of Sec31 (Bielli et al., 2005; Lee et al., 2005; Sato and Nakano, 2005; Townley et al., 2008). COPII vesicle production is regulated by Sec16 protein by two distinct mechanisms, either by providing a scaffold organizing COPII assembly (Bhattacharyya and Glick, 2007; Connerly et al., 2005; Ivan et al., 2008; Martínez-Menárguez et al., 1999; Watson et al., 2006) or by negative regulation of COPII turnover through inhibition of the Sec31 recruitment (Bharucha et al., 2013; Kung et al., 2012; Yorimitsu and Sato, 2012).

Vesicular trafficking contributes to autophagosome formation upon induction of macroautophagy (hereafter referred to as autophagy) (Lamb and Tooze, 2016). Autophagosome biogenesis is initiated at the ER and occurs via incorporation of vesicles derived from ERES or endosomal recycling compartment (Farhan et al., 2017; Lamb et al., 2016; Sanchez-Wandelmer et al., 2015). In yeast, Sec16, Sec23 and Sec24 are required for autophagosome formation (Ishihara et al., 2001), while in mammalian cells ERES contributes to autophagy via a subset of COPII vesicles marked by particular isoforms of the inner shell proteins, SEC23B, SEC24A and SEC24B (Jeong et al., 2018).

The membrane transport pathways undergo profound remodeling upon cell differentiation. Particularly rapid and intense membrane rearrangements occur during erythroid cell maturation. In human, erythroid progenitors undergo enormous expansion to fulfill the daily requirement of around 2 × 1011 new erythrocytes (Dzierzak and Philipsen, 2013). This robust differentiation involves efficient iron uptake through transferrin endocytosis and activation of pathways for organelle removal such as their autophagic clearance (Moras et al., 2017; Ney, 2011). This needs to be coordinated with a delivery of a vast amount of erythroid-specific surface markers through the secretory pathway (Satchwell et al., 2011; van den Akker et al., 2010). However, although proper COPII-dependent secretion is indispensable for erythropoiesis (Bianchi et al., 2009; Satchwell et al., 2013; Schwarz et al., 2009), terminal erythroid differentiation is associated with a loss of COPII coat components (Satchwell et al., 2013).

A possible candidate protein that could be involved in rearrangement of membrane trafficking pathways during cell differentiation is bone morphogenetic protein 2 (BMP-2)-inducible kinase (BMP2K). It has been discovered as a transcriptional target of BMP-2 in osteoblast differentiation (Kearns et al., 2001) but later identified as an interactor of proteins involved in clathrin-mediated endocytosis (CME) (Borner et al., 2012; Brehme et al., 2009; Krieger et al., 2013). Up to date, the cellular function of this member of the Ark1/Prk1 family of serine/threonine kinases is ill-defined and none of its phosphorylation targets are established, although it is suspected to phosphorylate the medium (μ2) adaptin of the AP-2 clathrin adaptor complex (Wrobel et al., 2019). Recent reports implicated BMP2K in leukemogenesis (Tokyo Children’s Cancer Study Group (TCCSG) et al., 2017; Pandzic et al., 2016; Wang et al., 2020). In a study that did not consider its possible endocytic functions, BMP2K was fished out as a putative stimulator of autophagy, potentially required for erythropoiesis (Potts et al., 2013). However, no insights were provided into possible mechanisms of how this putative endocytic kinase would regulate autophagy.

Here we report that splicing variants of BMP2K constitute a two-element system regulating distribution and abundance of COPII assemblies and autophagy. Our study uncovers an unusual mechanism of two splicing variants of a kinase playing opposing roles in intracellular processes that may allow for their fine-tuning during cell differentiation.

Results

The levels of BMP2K splicing variants are initially increased but later reduced during mouse erythroid differentiation

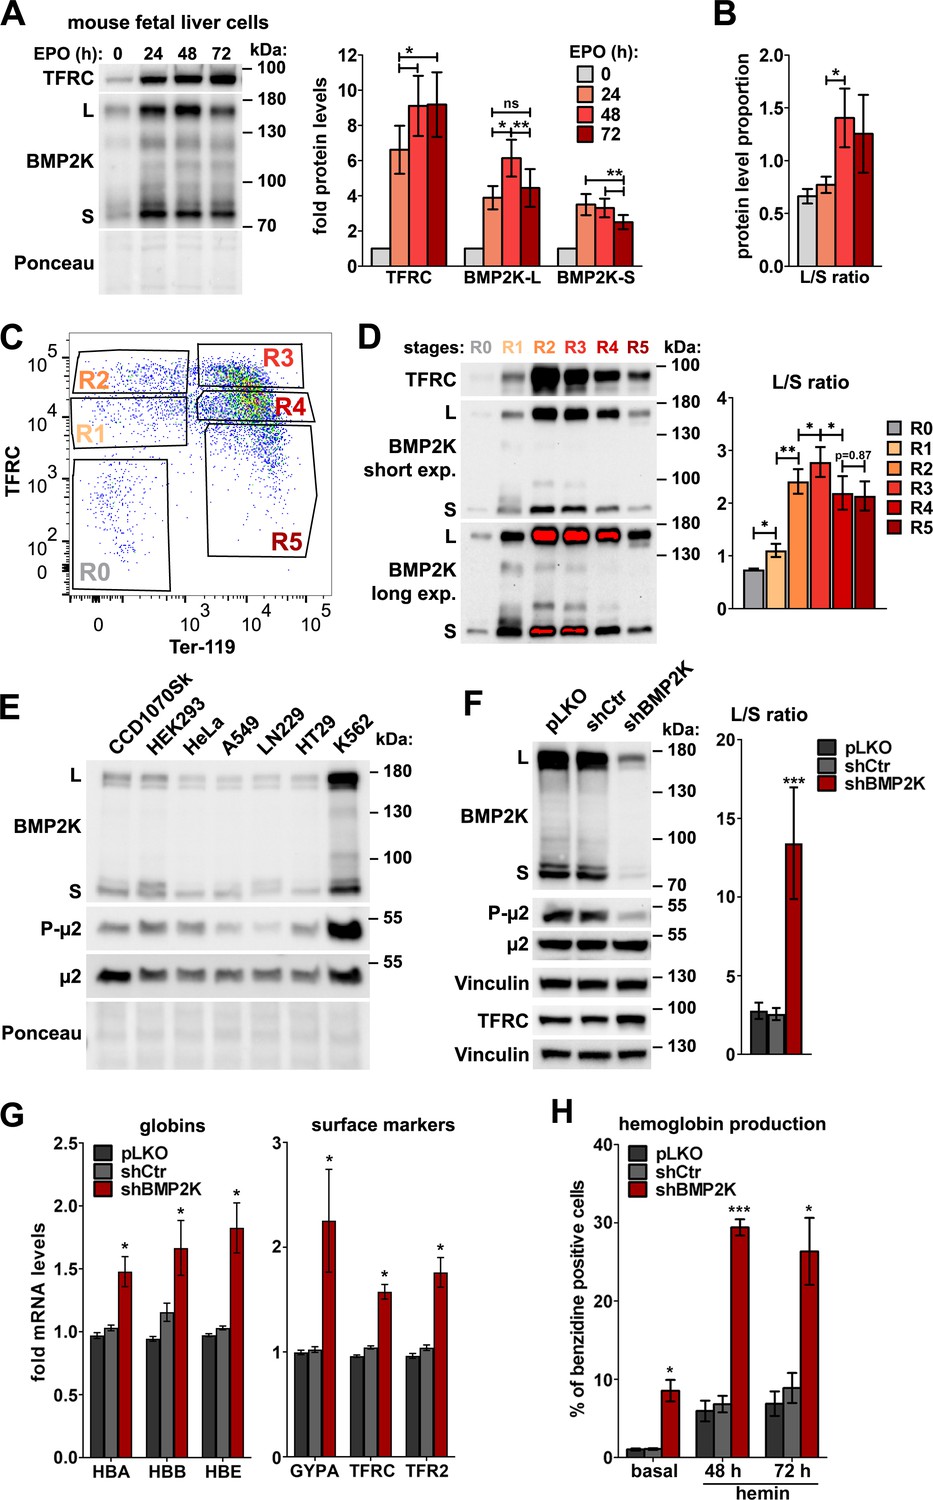
To choose a proper biological context to study cellular functions of BMP2K, we mined gene expression databases and found that the expression of human BMP2K gene is high in the early erythroid lineage (biogps.org) and upregulated during erythroid maturation in a manner similar to that of erythroid-enriched markers, such as TFRC (transferrin receptor 1) (Novershtern et al., 2011). To verify these data, we analyzed mRNA abundance of mouse BMP2K in an ex vivo erythropoiesis model. According to the UniProtKB database, mouse expresses two splicing variants (isoforms) of the kinase, the longer (BMP2K-L) and the shorter (BMP2K-S), which result from alternative mRNA splicing. We observed that in isolated mouse fetal liver erythroblasts differentiated with erythropoietin (EPO)-containing medium, mRNA levels of BMP2K-L and BMP2K-S increased gradually, similarly to TFRC (Figure 1—figure supplement 1A).

We next analyzed protein levels of TFRC and BMP2K variants at consecutive time-points (24, 48 and 72 hr) of differentiation. While the amounts of TFRC were markedly elevated, the abundance of BMP2K-L and -S was initially upregulated and subsequently downregulated (Figure 1A). Noteworthy, the proportion between the intensities of western blotting detection of the two isoforms (L/S ratio) changed with time of differentiation, as BMP2K-S protein was upregulated earlier (the highest levels detected at 24 hr) than that of BMP2K-L (the highest levels detected at 48 hr) (Figure 1B).

Figure 1 with 3 supplements see all
In the erythroid cells, BMP2K splicing variants are enriched and their reduction promotes erythroid differentiation.

(A) Western blots showing the levels of TFRC and BMP2K splicing variants (L and S) at different time-points during erythropoietin (EPO)-stimulated differentiation of mouse fetal liver erythroblasts. Graphs show fold changes in non-normalized protein levels obtained by densitometric analysis of western blotting results (n = 5 +/- SEM). (B) The proportion between the detection intensities of BMP2K-L and -S (L/S ratio) calculated after densitometric analysis of bands from western blots represented in A (n = 6 +/- SEM). (C) Dot plot showing fluorescence intensities of the indicated markers on the surfaces of mouse fetal liver erythroblasts stimulated with EPO for 96 hr. Gates distinguish consecutive differentiation stages (R0–R5) of erythroblasts isolated by fluorescence activated cell sorting (FACS). (D) Western blots (short and long exposures) showing the levels of TFRC and BMP2K variants in the indicated FACS-isolated differentiation stages of erythroblasts. Graph shows the L/S ratio calculated after densitometric analysis of western blotting results (n = 5 +/- SEM). (E) Western blots showing the levels of BMP2K splicing variants or total and Thr156-phosphorylated μ2 (P-μ2) in lysates from the indicated human cell lines. Ponceau staining serves as a gel loading control. (F) Western blots showing the efficiency of depleting all BMP2K variants using shRNA (shBMP2K) in K562 cells, and its effect on the levels of total and phosphorylated μ2 and TFRC as compared to non-depleted cells (empty pLKO vector or non-targeting shRNA, shCtr). Graph shows the L/S ratio calculated after densitometric analysis of western blotting results (n = 6 +/- SEM). (G) Fold changes in mRNA levels of the indicated erythroid markers in control cells or in cells depleted of all BMP2K splicing variants using shRNA (n = 3 or 4 +/- SEM). (H) Percentage of benzidine-positive control cells or cells depleted of BMP2K using shRNA, under basal growth conditions or after stimulation for 48 hr or 72 hr with 20 μM hemin (n = 3 +/- SEM). Values measured for BMP2K-depleted cells (F, G and H) were compared statistically to those measured for shCtr-treated cells. *p<0.05, **p<0.01, ***p<0.001.

EPO-stimulated mouse fetal erythroblast cultures are a heterogeneous mixture of cells at various differentiation stages (Zhang et al., 2003). To assess precisely the amounts of BMP2K variants at particular stages, we labelled EPO-stimulated cells with antibodies recognizing mouse erythroid surface markers, CD71/TFRC and Ter-119 (Zhang et al., 2003). This allowed us to isolate, by fluorescence activated cell sorting (FACS), the earliest primitive progenitors (CD71low/Ter-119low – population R0) as well as further stages of erythroblast differentiation (consecutively: CD71med/Ter-119low – R1, CD71high/Ter-119low – R2, CD71high/Ter-119high – R3, CD71med/Ter-119high – R4 and CD71low/Ter-119high – R5) (Figure 1C). Consistently with the analysis of heterogeneous cultures (Figure 1B), the levels of BMP2K isoforms were low in the early stages (R0 and R1), the highest in the transitory stages (R2 and R3) and reduced at the last stages (R4 and R5) (Figure 1D). Again, erythroid differentiation was associated with a change in the L/S ratio. It was in favor of BMP2K-S (L/S < 1) in primitive progenitors (R0) but was shifted towards BMP2K-L (L/S > 1) upon differentiation, being the highest at R3 (L/S > 2.5) and remaining high at R4 and R5 (L/S ~ 2) when total BMP2K protein levels were again downregulated (Figure 1D).

Thus, we found that during erythroid differentiation, the levels of BMP2K splicing variants are initially upregulated and subsequently reduced. The ratio between the two isoforms changes during erythroid differentiation, with BMP2K-S being predominant in the early erythroid precursors and BMP2K-L prevailing during differentiation and maturation.

Reducing the levels of BMP2K splicing variants in K562 cells promotes erythroid differentiation

The observed changes in protein abundance of mouse BMP2K variants upon differentiation could suggest that the initial increase of their levels would promote early steps of erythropoiesis while their subsequent decrease would favor erythroid maturation. To verify this complex hypothetical scenario, we sought a simpler cellular model. We found that K562 human erythroleukemia cells contain much higher amounts of BMP2K than various immortalized, solid tumor or non-erythroid blood cancer cell lines (Figure 1E and Figure 1—figure supplement 1B). In K562 cells the longer isoform (BMP2K-L) appeared as more abundant than the shorter (BMP2K-S) (Figure 1E,F and Figure 1—figure supplement 1B,C). Their L/S ratio was approximately 2:1 (calculated for control cells shown in Figure 1F and Figure 1—figure supplement 1C).

K562 cells have erythroid progenitor-like features (Andersson et al., 1979) and can initiate erythroid differentiation (Barbarani et al., 2017; Bu et al., 2014; Ma et al., 2013; Wang et al., 2011; Wu et al., 2018). To learn whether BMP2K silencing would reverse or advance erythroid differentiation of K562 cells, we silenced BMP2K gene expression using shRNA (shBMP2K) or CRISPR/Cas9 (gBMP2K#1 or #2) approaches. Although we did not achieve a complete BMP2K gene knock-out with the CRISPR/Cas9 approach, using both techniques we obtained efficient reduction of BMP2K variant levels. We noticed that BMP2K depletion was associated with a concomitant upregulation of the control 2:1 L/S ratio, very strongly (up to 13:1) upon shBMP2K and less potently (up to 3:1 or 4:1) upon gBMP2K#1 or #2 (Figure 1F and Figure 1—figure supplement 1C). A possible cause of differences in the L/S ratio upon various BMP2K depletion techniques remains obscure.

To assess the effects of BMP2K depletion on erythroid differentiation, we measured the expression levels of erythroid-specific genes, by qPCR, and the production of hemoglobin, by benzidine staining. As reported (Villeval et al., 1983), control K562 cells expressed several erythroid-specific genes (Figure 1G and Figure 1—figure supplement 1D) but only 0.5–1% of these cells were positive for hemoglobin (Figure 1H, Figure 1—figure supplements 1E and 2A,B). This percentage increased upon treatment with a heme precursor hemin, as described (Ma et al., 2013; Wang et al., 2011). We found that BMP2K depletion promoted erythroid differentiation of K562 cells. shBMP2K markedly elevated expression of erythroid-specific genes (Figure 1G) and potently increased the number of hemoglobin-positive cells under basal culture conditions (by 6-fold) and in the presence of hemin (by 4-fold) (Figure 1H and Figure 1—figure supplement 2A). In turn, both gRNAs weakly induced the expression of erythroid markers (Figure 1—figure supplement 1D) and stimulated hemoglobin production less potently than shBMP2K (~3 fold in basal conditions and ~2 fold upon hemin treatment) (Figure 1—figure supplements 1E and 2B).

Collectively, elevated expression of erythroid markers and increased hemoglobin production in K562 cells depleted of all BMP2K splicing variants suggested that at least one of the variants inhibits cellular events responsible for erythroid differentiation. As the extent of differentiation correlated with the ratio between the remaining L and S levels it is possible that the balance between variant abundance affects erythroid maturation. These observations need to be verified in more physiological models of erythropoiesis.

The role of BMP2K in CME does not explain its involvement in erythroid differentiation

As BMP2K is a putative endocytic kinase found among interactors of µ2 (Brehme et al., 2009), it could affect erythroid differentiation via regulation of AP-2-dependent CME. Consistent with its postulated role in phosphorylating the µ2 adaptin at Thr156 (Wrobel et al., 2019), K562 cells had high phospho-µ2 levels (Figure 1E) that were strongly reduced upon BMP2K depletion (Figure 1F and Figure 1—figure supplement 1C). However, while the phosphorylation of µ2 was shown to promote endocytosis (Olusanya et al., 2001; Ricotta et al., 2002; Wrobel et al., 2019), BMP2K depletion increased continuous uptake of fluorescently labelled Tf and 10 kDa dextran (a fluid-phase marker) by K562 cells (Figure 1—figure supplement 3A–E). shBMP2K increased early (5 min) and steady state (40 min) Tf uptake as well as dextran internalization, all by around 30% (Figure 1—figure supplement 3B,C). gBMP2K#1 or #2 had a weaker effect on endocytosis than shBMP2K, increasing early and steady state Tf uptake roughly by 10–15% and dextran internalization only by 5–15% (Figure 1—figure supplement 3D,E).

The elevated Tf uptake despite lower µ2 phosphorylation in BMP2K-depleted cells could occur due to the increase in expression of genes encoding transferrin receptors, as described above (Figure 1G and Figure 1—figure supplement 1D). Consistently, shBMP2K led to elevated TFRC protein levels (Figure 1F) and higher binding of Tf to cell surface on ice (0’ in Figure 1—figure supplement 3F,G, empty bars), arguing for a higher number of Tf receptor molecules available on the PM. A pulse-chase uptake assay of the pre-bound Tf showed a reduction of Tf internalization efficiency (% of surface-bound Tf that was internalized at 37 °C) in shBMP2K-treated cells (down to 62% from 70% in control cells) (Figure 1—figure supplement 3H). However, due to elevated Tf binding, their resultant Tf pulse-chase uptake was higher than in control cells (Figure 1—figure supplement 3G).

Collectively, despite lower Tf endocytosis efficiency, cells lacking all BMP2K variants showed higher continuous Tf uptake, possibly due to elevated surface abundance of Tf receptors. The latter observation made the effects of BMP2K depletion on Tf uptake difficult to dissect. Thus, although we confirmed the implication of BMP2K kinase in CME, this role could not explain its involvement in erythroid differentiation. Therefore, we hypothesized that in addition to endocytosis, BMP2K variants could regulate other cellular events to affect red blood cell maturation.

BMP2K splicing variants can associate with SEC16A protein and localize to the early secretory compartment

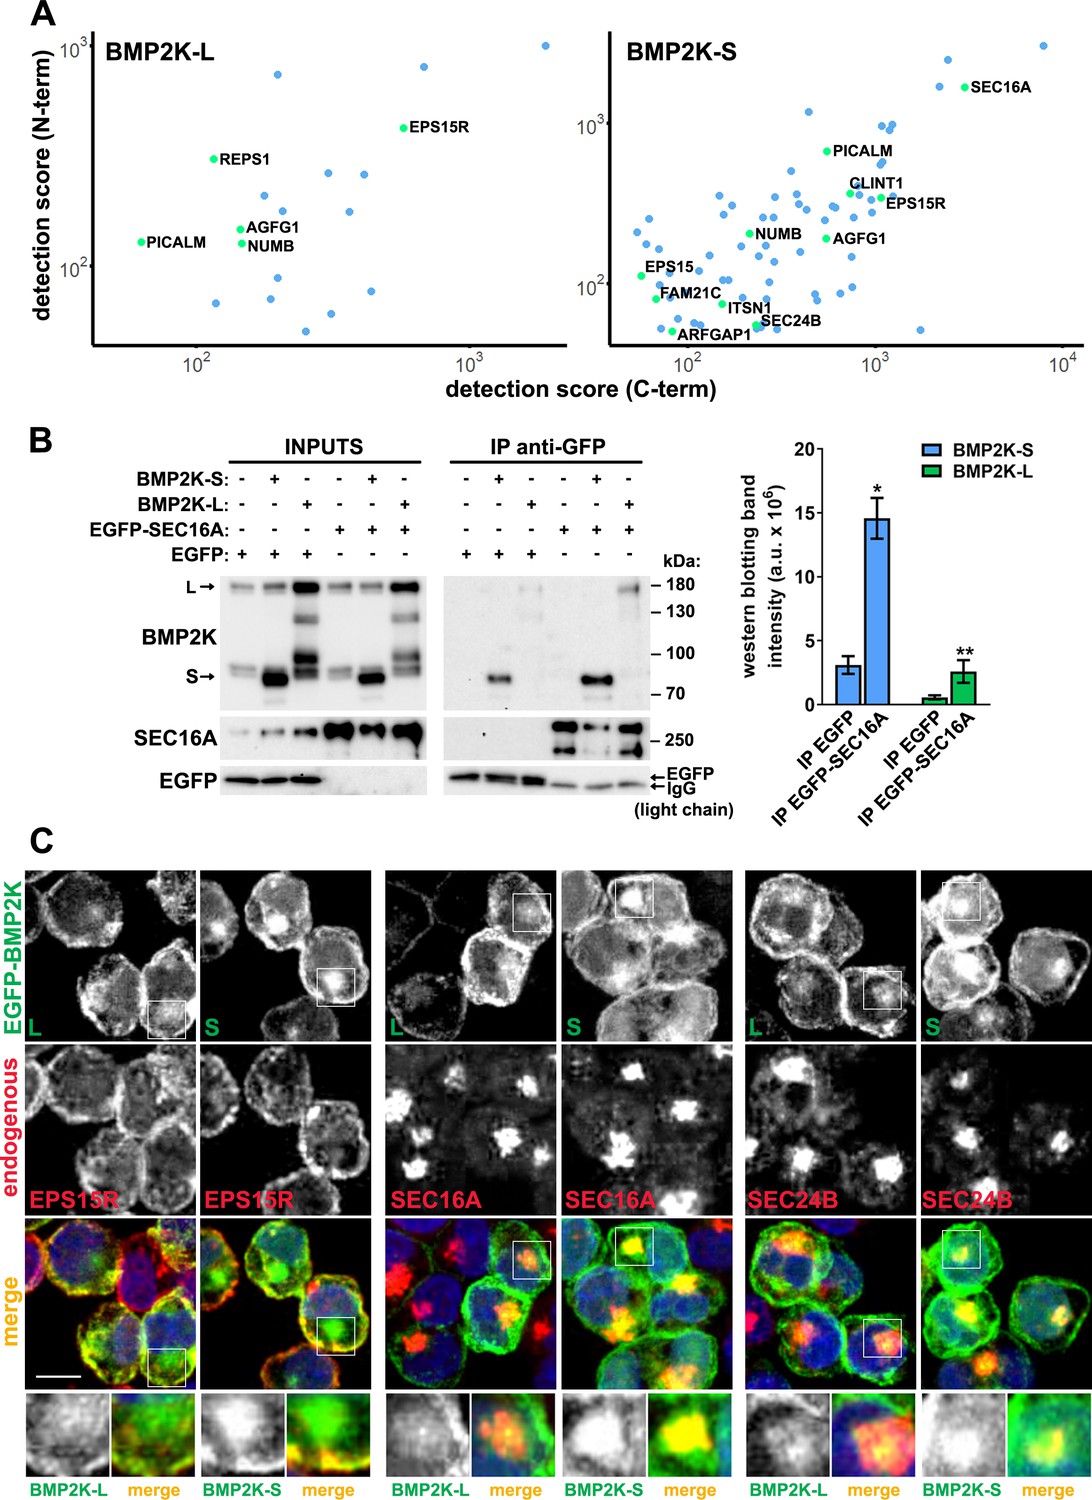
To find out in which other cellular processes the two BMP2K isoforms could function, we investigated their interactomes. To this end, we performed proximity biotinylation (BioID) followed by liquid chromatography coupled to tandem mass spectrometry (LC-MS/MS) in HEK293 cells ectopically expressing the L or the S variant tagged with a mutant BirA biotin ligase (BirA*) at their N- or C-termini (Figure 2—figure supplement 1A,B). To avoid artifacts due to BirA tag at either of the termini, we focused on proteins detected as common interactors of N- and C-terminally tagged BMP2K isoforms (Supplementary file 1-Table 1,2, Figure 2A, Figure 2—figure supplement 1C). Within the two variant-specific interactomes, we found proteins involved in vesicular transport or mRNA translation and transport (Figure 2—figure supplement 1C).

Figure 2 with 2 supplements see all
The BioID interactome analysis and its subsequent validation show that both BMP2K splicing variants can associate with SEC16A protein and localize to the early secretory compartment.

(A) Dot plots showing BioID-MS detection scores (log scale) of proteins found as proximal to both N- and C-terminally tagged BMP2K-S or -L variants in HEK293 cells. (B) Levels of BMP2K-L, BMP2K-S, EGFP or EGFP-tagged SEC16A in whole cell lysates (INPUTS) or in immunoprecipitates (IP) using anti-GFP antibodies from HEK293 cells. Different combinations of simultaneous ectopic expression of the analyzed proteins are indicated above the images. Graph shows non-normalized densitometric analysis of western blotting bands expressed in arbitrary units (a.u.; n = 3 +/- SEM). (C) Maximum intensity projection images from confocal microscope showing localization of ectopically expressed EGFP-tagged BMP2K-L or -S with respect to the indicated proteins and cell nuclei marked with DAPI stain (blue) in K562 cells. Insets: Magnified views of boxed regions in the main images. Scale bars, 10 µm. *p<0.05, **p<0.01.

Among regulators of vesicular transport found as proximal to both BMP2K isoforms were CME adaptors: NUMB, PICALM, EPS15R, and AGFG1 (HRB) (Benmerah et al., 1995; Chaineau et al., 2008; Coda et al., 1998; Miller et al., 2015; Santolini et al., 2000; Tebar et al., 1996Figure 2A and Figure 2—figure supplement 1C). However, as proximal to BMP2K-S we also found proteins annotated to ER-Golgi transport, that is SEC16A, SEC24B and ARFGAP1 (Watson et al., 2006; Wendeler et al., 2007; Yang et al., 2002Figure 2A and Figure 2—figure supplement 1C). Of note, SEC16A was detected with the highest MS score among all trafficking regulators identified for BMP2K-S (Figure 2A).

Unfortunately, we were not able to efficiently immunoprecipitate endogenous SEC16A protein to verify the BioID results, likely due to its large size and lack of appropriate antibodies. Hence, to assess the ability of BMP2K-L or -S to associate with SEC16A, we overexpressed them in HEK293 cells together with EGFP only or with EGFP-tagged SEC16A, and performed immunoprecipitation using anti-GFP antibodies. Although we repeatedly observed some non-specific co-precipitation of both BMP2K isoforms on agarose resin with EGFP only, they were significantly enriched in EGFP-SEC16A precipitates (Figure 2B).

Next, we asked whether BMP2K isoforms localized intracellularly to endocytic and/or secretory compartments in K562 cells. Using the monoclonal antibody recognizing in western blotting all BMP2K variants, by confocal microscopy we detected signal predominantly near the PM. There, it overlapped to some extent with EPS15R, found in BioID as proximal to both isoforms (Figure 2—figure supplement 2A). However, intensity of the signal detected with anti-BMP2K antibody, although weaker due to BMP2K-L depletion, did not decline upon shBMP2K-S (Figure 2—figure supplement 2A,B). Moreover, in cells depleted of all BMP2K variants, the signal reduction, as compared to control cells, was similar to cells lacking BMP2K-L only (Figure 2—figure supplement 2A,B). Thus, considering the monoclonal antibody not suitable for detection of BMP2K-S in microscopy, we analyzed the intracellular localization of EGFP-tagged BMP2K variants ectopically expressed in K562 cells. EGFP-BMP2K-L was enriched predominantly near the PM, where it colocalized with EPS15R (Figure 2C and Figure 2—figure supplement 2A,B). EGFP-BMP2K-S, although also overlapping with EPS15R near the PM, strongly concentrated in the juxtanuclear region positive for SEC16A or SEC24B (Figure 2C and Figure 2—figure supplement 2C). Such juxtanuclear localization to SEC16A or SEC24B-positive compartment, however weaker, could also be observed for EGFP-BMP2K-L (Figure 2C and Figure 2—figure supplement 2C).

Altogether, both BMP2K-L and -S can interact with SEC16A and localize to an early secretory compartment, indicating that both variants could regulate SEC16A-dependent intracellular processes.

BMP2K splicing variants differentially regulate SEC16A protein levels and intracellular distribution

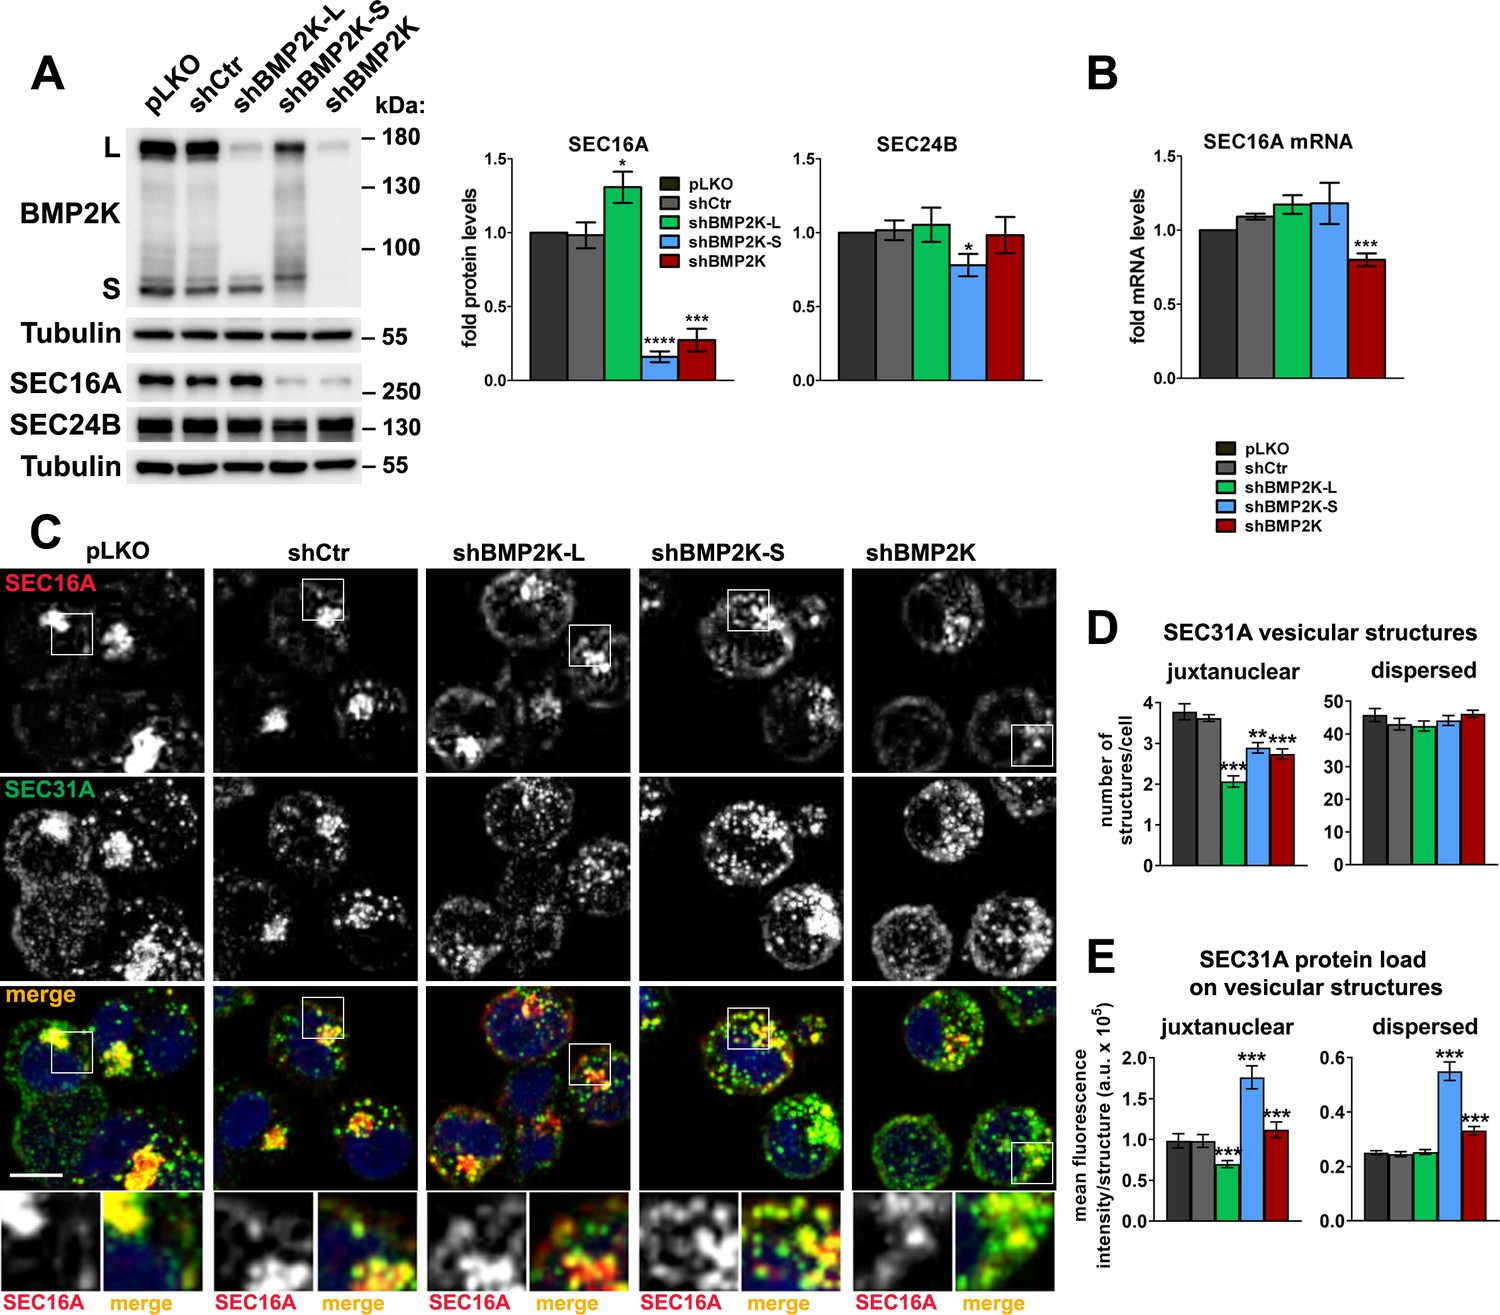
To address whether BMP2K splicing variants could regulate SEC16A-dependent processes, we designed shRNAs to reduce the expression specifically of BMP2K-L or BMP2K-S. Silencing of the longer variant had no effect on the expression of the shorter, while BMP2K-S depletion only modestly reduced full length BMP2K-L levels (Figure 3A).

Figure 3 with 1 supplement see all
BMP2K splicing variants differentially regulate SEC16A protein levels and distribution and control the abundance of SEC31A-positive structures.

(A) Western blots showing the effect of shRNA-mediated depletion of single (shBMP2K-L or shBMP2K-S) or all BMP2K splicing variants (shBMP2K) on the levels of SEC16A and SEC24B proteins, as compared to empty pLKO vector or non-targeting shRNA construct, shCtr. Graphs show densitometric analysis of western blotting bands for the indicated proteins using tubulin abundance for normalization (n = 5 +/- SEM). (B) SEC16A mRNA fold levels in control cells or in cells with shRNA-mediated depletion of BMP2K variants (n = 5 +/- SEM). (C) Representative maximum intensity projection images from confocal microscope, showing the effect of shRNA-mediated depletion of BMP2K variants on immunolocalization of SEC16A and SEC31A proteins in K562 cells. Cell nuclei marked with DAPI stain (blue). Insets: Magnified views of boxed regions in the main images. Scale bar, 10 µm. (D and E) The number of juxtanuclear and dispersed SEC31A-positive vesicular structures per cell (D) or SEC31A mean fluorescence intensity per vesicular structure (SEC31A protein load) presented in arbitrary units (a.u. in E) in control cells or cells lacking BMP2K variants. Quantification from images represented by those in C (n = 5 +/- SEM). *p<0.05, **p<0.01, ***p<0.001, ****p<0.0001.

First, we analyzed whether shRNA-mediated depletion of BMP2K-L or -S affected SEC16A abundance in K562 cells. shBMP2K-L led to a modest but reproducible increase, while shBMP2K-S reduced SEC16A protein levels (Figure 3A). Depletion of all BMP2K isoforms (shBMP2K) lowered SEC16A levels, to the same extent as shBMP2K-S (Figure 3A). By comparison, protein levels of SEC24B, were essentially unaffected by depletion of BMP2K variants (Figure 3A). To ensure that the observed changes in SEC16A abundance were not caused by RNAi off-target effects, we tested additional shRNAs. Reassuringly, shBMP2K-L#2 increased while shBMP2K-S#2 reduced SEC16A amounts (Figure 3—figure supplement 1A). The regulation of SEC16A protein levels by the BMP2K-L or -S variants was not due to altered gene transcription. We observed only ~30% downregulation of SEC16A mRNA levels in cells lacking all BMP2K variants (Figure 3B).

Next, we tested whether the absence of BMP2K isoforms affected intracellular distribution of SEC16A. In control K562 cells, it concentrated in the juxtanuclear region but was also dispersed throughout the cytoplasm (Figure 3C). Depletion of BMP2K-L had no apparent effect on the morphology or staining intensity of juxtanuclear SEC16A compartment but increased integral fluorescence intensity of the dispersed structures, arguing for their expansion (Figure 3C and Figure 3—figure supplement 1B). Upon shBMP2K-S, SEC16A staining was diffused with lower intensity of the juxtanuclear compartment and higher intensity of the dispersed structures (Figure 3C and Figure 3—figure supplement 1B). In cells lacking all BMP2K variants, the juxtanuclear SEC16A compartment was also visually diffused but the SEC16A staining intensity was overall lower (Figure 3C and Figure 3—figure supplement 1B).

Hence, BMP2K-L regulates negatively, while -S positively, SEC16A protein abundance and both variants control SEC16A intracellular distribution. Whether the underlying mechanism involves kinase activities of BMP2K variants or their physical interaction with SEC16A remains to be dissected.

The BMP2K-L/S system regulates abundance and distribution of COPII assemblies

The observed regulation of SEC16A protein levels and distribution suggested that the two BMP2K variants could affect ERES function and therefore abundance of COPII assemblies. To verify this, we first analyzed the effects of BMP2K variant depletion on distribution of SEC24B, a COPII inner shell component identified as proximal to BMP2K-S in the BioID analysis (Figure 2A and Figure 2—figure supplement 1C). Similarly to SEC16A, in control cells, SEC24B-positive vesicular structures were concentrated juxtanuclearly or dispersed throughout the cytoplasm (Figure 3—figure supplement 1C,D). shBMP2K-L reduced integral intensity of the juxtanuclear but not of the dispersed SEC24B structures (Figure 3—figure supplement 1C,D). Upon shBMP2K-S, SEC24B staining was diffused as it was the case for SEC16A, with lower intensity of the juxtanuclear and higher of the dispersed structures (Figure 3—figure supplement 1C,D).

As shown in yeast, Sec16 regulates COPII turnover by inhibiting the recruitment of Sec31 outer cage component in a manner modulated by Sec24 (Bharucha et al., 2013; Kung et al., 2012; Yorimitsu and Sato, 2012). Given the altered intracellular distribution of SEC16A and SEC24B upon depletions of BMP2K variants, we tested whether they affected the localization of SEC31A, a ubiquitously expressed COPII marker and Sec31 homologue in mammals (D'Arcangelo et al., 2013; Satchwell et al., 2013; Tang et al., 2000). In control K562 cells, SEC31A-positive vesicular structures co-localized with both, juxtanuclear and diffused SEC16A- or SEC24B-positive sites (Figure 3C and Figure 3—figure supplement 1C). shBMP2K-L did not affect the appearance of dispersed SEC31A structures. However, it decreased the number of juxtanuclear structures (Figure 3D) and reduced their SEC31A staining intensity (mean fluorescence intensity per structure in Figure 3E, hereafter referred to as SEC31A load). shBMP2K-S, although had essentially no effect on the number of SEC31A-positive structures (Figure 3D), strongly increased SEC31A load in both, juxtanuclear and dispersed sites (Figure 3E).

To confirm whether the observed changes in SEC31A abundance occurred at COPII assemblies, we analyzed whether depletion of BMP2K variants affected specifically SEC31A load at vesicular structures positive for SEC24B (Figure 3—figure supplement 1C,E). Reassuringly, upon shBMP2K-L the juxtanuclear SEC24B structures had lower SEC31A load, while upon shBMP2K-S, both juxtanuclear and dispersed SEC24B structures showed elevated SEC31A load (Figure 3—figure supplement 1C,E). Hence, we found that BMP2K-L positively regulates the abundance and SEC31A load of juxtanuclear COPII assemblies while BMP2K-S negatively regulates SEC31A load of juxtanuclear and dispersed assemblies.

Having identified these differential roles of the two BMP2K variants, we investigated the intracellular distribution of SEC24B and SEC31A upon shBMP2K that reduced the expression of both variants. shBMP2K recapitulated the effect of shBMP2K-L on SEC24B distribution (lower juxtanuclear SEC24B abundance in Figure 3—figure supplement 1C,D) and partially recapitulated the effect of shBMP2K-S on SEC31A abundance (higher SEC31A load in Figure 3C,E and Figure 3—figure supplement 1C,E). Therefore, cells lacking both BMP2K variants showed lower abundance of juxtanuclear COPII sites, likely due to BMP2K-L depletion, but higher SEC31A load, possibly due to BMP2K-S depletion.

Collectively, we identified a novel intracellular regulatory system, termed the BMP2K-L/S system, where the two BMP2K variants together control the abundance, SEC31A load and distribution of COPII assemblies. Further investigation should address how this dual regulation affects COPII-mediated trafficking.

BMP2K-L promotes while BMP2K-S restricts autophagic degradation and erythroid differentiation

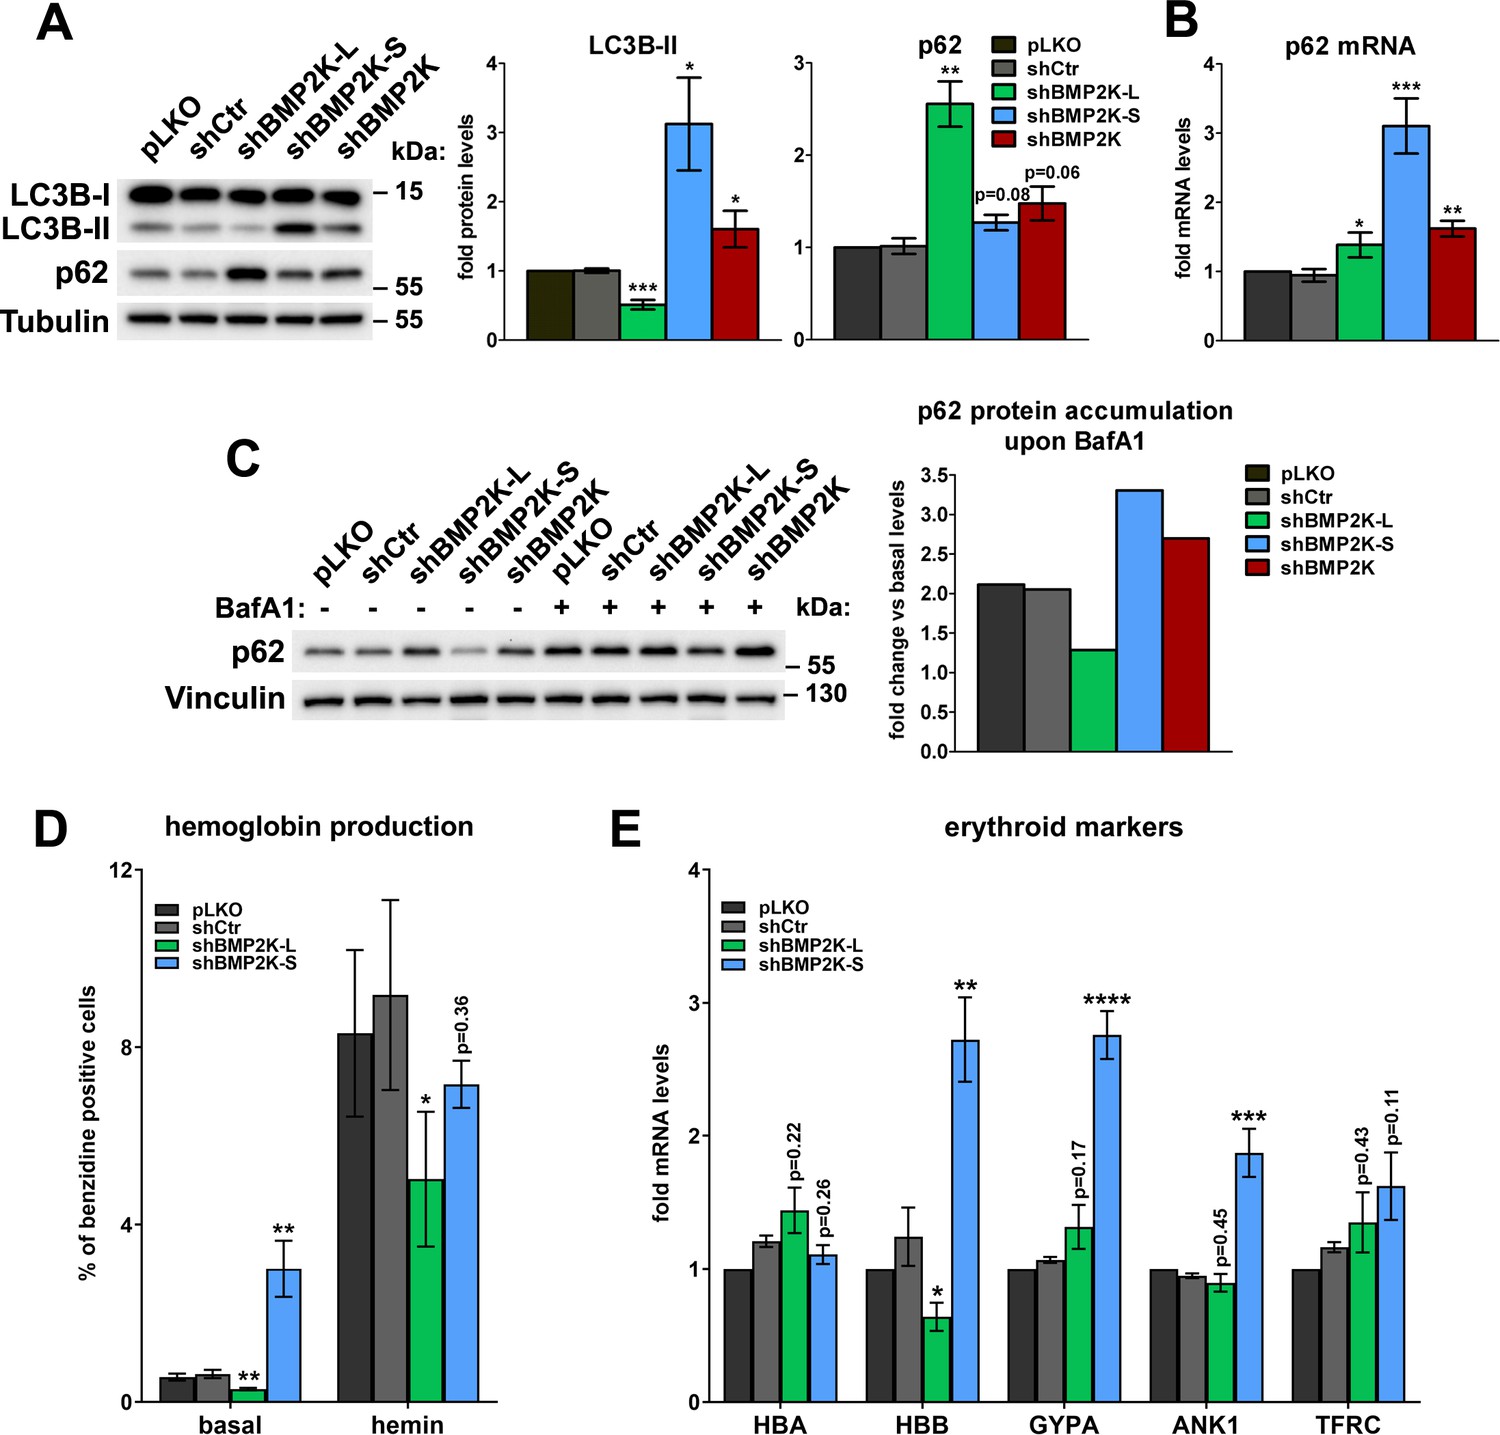
SEC24B, whose intracellular distribution is regulated by the BMP2K-L/S system (Figure 3—figure supplement 1C–E), also contributes to autophagy (Jeong et al., 2018). As BMP2K was fished out as a stimulator of LC3-dependent autophagy (Potts et al., 2013), we verified whether BMP2K variants regulated autophagic degradation in K562 cells. We observed that shBMP2K-L reduced, while shBMP2K-S increased, the levels of lipidated LC3B (Figure 4A), indicative of inhibited or activated autophagy, respectively. shBMP2K upregulated the abundance of LC3B-II, but to a lesser extent than BMP2K-S depletion (Figure 4A). This intermediate effect of global BMP2K silencing could result from opposing actions of the two isoforms.

Figure 4 with 1 supplement see all
BMP2K-L and BMP2K-S differentially regulate autophagic degradation and erythroid differentiation.

(A) Western blots showing the effects of depletion of single (shBMP2K-L or shBMP2K-S) or all BMP2K splicing BMP2K variants on the levels of LC3B-I, LC3B-II and p62 proteins in K562 cells, as compared to empty pLKO vector or non-targeting shRNA construct, shCtr. Graphs show densitometric analysis of western blotting bands for the indicated proteins using tubulin abundance for normalization (n = 4 +/- SEM). (B) p62 mRNA fold change levels in control cells or in cells with shRNA-mediated depletion of BMP2K variants, as in A (n = 5 +/- SEM). (C) The abundance of p62 protein in non-treated cells or in cells treated for 15 hr with 75 nM bafilomycin A1 (BafA1). Graph shows calculated fold increase of p62 protein levels induced by BafA1, obtained after densitometric analysis of western blotting bands using vinculin abundance for normalization (n = 1). (D) Percentage of benzidine-positive control cells or cells depleted of BMP2K variants, under basal growth conditions or after stimulation for 48 hr with 20 μM hemin (n = 5 +/- SEM). (E) Fold changes in mRNA levels of the indicated erythroid markers in control cells or in cells depleted of all BMP2K splicing variants using shRNA (n = 5 +/- SEM). *p<0.05, **p<0.01, ***p<0.001.

To validate the above results we monitored the levels of SQSTM1/p62 protein (hereafter referred to as p62), an established autophagic cargo. We observed that cells lacking BMP2K-L, although having unchanged p62 mRNA levels (Figure 4B), showed a strong increase of its protein content (Figure 4A), likely due to restrained autophagy. Conversely, cells lacking BMP2K-S, despite a strong increase in p62 mRNA levels (Figure 4B), did not accumulate the protein (Figure 4A), which could be explained by elevated autophagic degradation. These observations reinforced the opposing effects of both BMP2K variants on autophagy. In turn, cells treated with shBMP2K showed slightly elevated levels of both p62 protein and mRNA (Figure 4A,B), a phenotype difficult to interpret unequivocally.

To clarify the effect of depleting all BMP2K splicing variants on autophagy, we performed autophagic flux analysis. To this end, we inhibited autophagic degradation using bafilomycin A1 (BafA1) and analyzed the accumulation of non-degraded p62 protein in BMP2K-depleted cells (Figure 4C). Consistent with autophagy inhibition, in cells lacking BMP2K-L, the accumulation of p62 protein was weaker than in control cells. In turn, in BMP2K-S-depleted cells, stronger p62 accumulation confirmed the increased autophagic flux. Importantly, silencing of all BMP2K splicing variants using shBMP2K also elevated p62 accumulation upon BafA1 treatment, indicative of increased autophagic flux (Figure 4C). Hence, we discovered that the two BMP2K isoforms play opposite roles in regulation of autophagy and that the net outcome of depleting both variants using shBMP2K (resulting in high L/S ratio shown in Figure 1F) is modestly elevated basal autophagic degradation.

As autophagy promotes erythroid differentiation (Cao et al., 2016; Grosso et al., 2017), the effects of BMP2K variant depletion on autophagic degradation suggested that BMP2K-L could favor, while BMP2K-S restrict erythroid differentiation of K562 cells. Consistently, we observed that shBMP2K-L impaired whereas shBMP2K-S increased hemoglobin production under basal culture conditions (Figure 4D and Figure 4—figure supplement 1A). BMP2K-L-depleted cells also poorly upregulated hemoglobin production upon hemin (Figure 4D and Figure 4—figure supplement 1A). However, worse differentiation of these cells was not associated with reduced transcription of erythroid-specific genes (Figure 4E). In turn, although in cells lacking BMP2K-S, the hemin-induced hemoglobin production was not increased (Figure 4D and Figure 4—figure supplement 1A), mRNA levels of several erythroid markers were significantly upregulated (Figure 4E). Taken together, BMP2K splicing variants differentially regulate erythroid differentiation.

Collectively, we found that BMP2K-L, which positively regulates the abundance of SEC31A at COPII assemblies, stimulates autophagy and erythroid differentiation, while BMP2K-S, which restricts SEC31A presence at COPII assemblies, limits autophagic degradation and erythroid differentiation. It remains to be studied whether the BMP2K-L/-S system controls autophagy via modulation of COPII vesicle trafficking and whether such mechanism underlies regulation of erythroid differentiation by BMP2K variants.

Discussion

Enrichment of a protein during cell lineage differentiation may reflect its regulatory role in this process, either positive or negative. Induced transcription of BMP2K gene was shown in differentiating osteoblasts (Kearns et al., 2001) and erythroid cells (Perucca et al., 2017), where BMP2K was proposed to inhibit (Kearns et al., 2001) or stimulate the differentiation (Potts et al., 2013), respectively. Here, we show that BMP2K splicing variants can regulate differentiation in opposite manners. We find that although the protein abundance of BMP2K variants increases at initial steps of erythroid differentiation, it subsequently decreases during red blood cell maturation. As high levels of BMP2K variants restrict erythroid differentiation, the upregulated expression of BMP2K gene during erythropoiesis might serve to slow down red blood cell maturation. Consistently, we identify one of the variants, BMP2K-S, as a negative regulator of erythroid differentiation. However, our results indicate that BMP2K-L promotes differentiation. The opposite roles of the two splicing variants provide a possible explanation why erythroid maturation is associated not only with reduction of BMP2K variant levels but also with increased L/S ratio, that is the balance between variant levels shifted in favor of the longer.

As BMP2K kinase has been considered a putative regulator of CME (Borner et al., 2012; Brehme et al., 2009; Krieger et al., 2013), we initially hypothesized that BMP2K variants would control erythroid differentiation via regulation of endocytosis. Yeast homologues of BMP2K and AAK1 kinases, Akl1 and Prk1, suppress endocytosis (Bar-Yosef et al., 2018; Roelants et al., 2017; Takahashi et al., 2006; Zeng and Cai, 1999; Zeng et al., 2001). Consistently, erythroid differentiation of K562 cells upon silencing of BMP2K expression correlates with elevated Tf uptake. However, as measured by the pulse-chase assay, cells lacking BMP2K variants show lower efficiency of Tf endocytosis, possibly due to lower µ2 phosphorylation (Olusanya et al., 2001; Ricotta et al., 2002; Wrobel et al., 2019). Our data suggest that the elevated Tf uptake upon silencing of BMP2K expression could result, despite lower endocytosis efficiency, from higher abundance of Tf receptor, whose local clustering promotes Tf endocytosis (Liu et al., 2010).

Autophagic clearance of intracellular content is indispensable for erythroid differentiation (Cao et al., 2016; Grosso et al., 2017) and activation of autophagy can by itself increase expression of genes encoding markers of erythroid maturation (Cao et al., 2016). We show that depletion of all BMP2K variants induces autophagic degradation. It also strongly elevates hemoglobin production upon addition of hemin, a heme precursor which stimulates erythroid differentiation in a manner independent of Tf uptake (Fibach et al., 1987) but involving activation of autophagy (Fader et al., 2016; Grosso et al., 2019). Moreover, a positive regulator of differentiation, BMP2K-L, promotes autophagy, while negative regulator BMP2K-S, inhibits autophagic degradation. Thus, it is tempting to hypothesize that BMP2K variants could regulate erythroid differentiation via modulation of autophagic degradation, that remains to be confirmed.

Although in the BioID interactomes of BMP2K variants we did not find any bona-fide autophagic regulators, we detected components of the ER-Golgi transport pathway that contributes to autophagosome formation (Ge et al., 2013; Shima et al., 2019; Wang et al., 2014). We show that BMP2K-L increases the abundance of SEC24B-positive COPII assemblies and their SEC31A load, while BMP2K-S decreases SEC31A load on SEC24B-positive COPII assemblies and limits their localization to the juxtanuclear secretory compartment. Given the involvement of SEC24B in autophagy (Jeong et al., 2018), it is possible that the BMP2K-L/S system controls autophagy in part by regulating trafficking of vesicles containing SEC24B, that remains to be verified. Another intriguing question concerns the cellular role of COPII assemblies dispersed outside of the juxtanuclear secretory compartment, whose SEC31A load strongly increases in the absence of BMP2K-S. Once COPII vesicles are formed, they immediately reach their target compartment, ERGIC, located in close proximity to ERES (Lord et al., 2013). Therefore it is unlikely that the dispersed COPII assemblies represent vesicles transported from the juxtanuclear compartment to the cell periphery. Future studies should address whether they are implicated in regulation of autophagic degradation or erythroid differentiation by BMP2K variants.

Although K562 cells represent a convenient model of erythroid differentiation, they do not fully recapitulate distinct maturation stages occurring physiologically. However, our finding that depletion of both BMP2K variants in these cells promotes erythroid maturation is consistent with reduction of BMP2K-L and -S levels upon late stages of mouse fetal liver cell differentiation. Erythroblast maturation involves activation of autophagic degradation (Zhang et al., 2009) and secretion of erythroid-specific markers to the PM (Satchwell et al., 2013; van den Akker et al., 2010). Hence, our results suggest that the BMP2K-L/S system could act in coordination of these events during maturation of the erythroid lineage.

Endocytosis and autophagy (Fraser et al., 2017; Tooze et al., 2014) as well as secretory trafficking and autophagy (Davis et al., 2017; McCaughey and Stephens, 2018) are clearly interdependent. We provide evidence that an endocytic kinase regulates autophagy. This may occur at least in part via modulation of COPII assembly. Thus, through its alternative splicing variants, BMP2K kinase functions at the crossroad between endocytosis, secretion and autophagy. We propose that BMP2K variants represent a regulatory system wherein the activator (BMP2K-L) promotes, while the inhibitor (BMP2K-S) restricts processes required for erythroid maturation.

Materials and methods

Key resources table
Reagent type
(species) or resource
DesignationSource or referenceIdentifiersAdditional information
Cell line (Homo sapiens)K562ATCCCat# CCL-243, RRID:CVCL_0004
Cell line (Homo sapiens)HEK293ATCCCat# CRL-1573, RRID:CVCL_0045
Cell line (Homo sapiens)HEK293TATCCCat# CRL-3216, RRID:CVCL_0063
Transfected construct (Homo sapiens)BMP2K shRNASigma-AldrichTRCN0000000915pLKO.1 Lentiviral construct to transfect and express the shRNA
Transfected construct (Homo sapiens)BMP2K-L shRNAThis paperpLKO.1 Lentiviral construct to transfect and express the shRNA. See Supplementary file 1-Table 3.
Transfected construct (Homo sapiens)BMP2K-S shRNAThis paperpLKO.1 Lentiviral construct to transfect and express the shRNA. See Supplementary file 1-Table 3.
Transfected construct (Homo sapiens)empty pLKO.1 plasmidSigma-AldrichSHC001pLKO.1 Lentiviral construct to transfect and express the shRNA
Transfected construct (Homo sapiens)non-targeting shRNA plasmidSigma-AldrichSHC202pLKO.1 Lentiviral construct to transfect and express the shRNA
Transfected construct (Homo sapiens)BMP2K gRNAs (gBMP2K#1and #2)This paperlentiCRISPRv2 Lentiviral construct to transfect and express the gRNA together with Cas9. See Supplementary file 1-Table 4.
Transfected construct (Homo sapiens)non-targeting gRNAs (gCtr#1and #2)This paperlentiCRISPRv2 Lentiviral construct to transfect and express the gRNA together with Cas9. See Supplementary file 1-Table 4.
Transfected construct (Homo sapiens)pEGFP-SEC16AAddgeneCat# 36155
Biological sample (Mus musculus)Primary mouse fetal liver cellsMossakowski Medical Research Centre Polish Academy of SciencesFreshly isolated from Mus musculus (strain C57BL/6J)
Antibodyanti-BMP2K (mouse monoclonal, ascites)Santa Cruz BiotechnologyCat# sc-134284, RRID:AB_2227882WB(1:2000), IF(1:500)
Antibodyanti-SEC16A (rabbit polyclonal)BethylCat# A300-648A, RRID:AB_519338WB(1:1000)
Antibodyanti-SEC16A (rabbit polyclonal)Atlas AntibodiesCat# HPA005684, RRID:AB_1079189IF(1:400)
Antibodyanti-SEC24B (rabbit monoclonal)Cell Signaling TechnologyCat# 12042, RRID:AB_2797807WB(1:1000), IF(1:200)
Antibodyanti-SEC31A (mouse monoclonal)BD BiosciencesCat# 612350, RRID:AB_399716IF(1:200)
Antibodyanti-EPS15R (rabbit monoclonal)AbcamCat# ab76004, RRID:AB_1310187IF(1:200)
Antibodyanti-LC3B (rabbit polyclonal)Cell Signaling TechnologyCat# 2775, RRID:AB_915950WB(1:1000)
Antibodyanti-SQSTM1/p62 (mouse monoclonal)BD BiosciencesCat# 610833, RRID:AB_398152WB(1:1000)
Antibodyanti-Phospho-μ2
(Thr156) (D4F3) (rabbit monoclonal)
Cell Signaling TechnologyCat# 7399, RRID:AB_10949770WB(1:1000)
Antibodyanti-μ2 (mouse monoclonal)BD BiosciencesCat# 611350, RRID:AB_398872WB(1:500)
Antibodyanti-GFP (goat polyclonal)R&D SystemsCat# AF4240, RRID:AB_884445IP(1:60)
AntibodyAPC-conjugated anti-CD71/TFRC (rat monoclonal)Thermo Fisher ScientificCat# 17-0711-80, RRID:AB_1834356FC(1:160)
AntibodyPE-conjugatedanti-TER-119
(rat monoclonal)
Thermo Fisher ScientificCat# 12-5921-81, RRID:AB_466041FC(1:80)
Peptide, recombinant proteinrecombinant human EPOPeproTechCat# 100–64
Chemical compound, drugHeminSigma-AldrichCat# H9039
Chemical compound, drugbenzidine dihydrochlorideSigma-AldrichCat# B3383
Chemical compound, drugbafilomycin A1Sigma-AldrichCat# B1793
Software, algorithmHarmony 4.9PerkinElmerImaging and Analysis Software for Opera Phenix microscope
Software, algorithmImageJ softwareImageJ (http://imagej.nih.gov/ij/)RRID:SCR_003070
Software, algorithmGraphPad Prismeight softwareGraphPad Prism (https://graphpad.com)RRID:SCR_015807
OtherAlexa Fluor 647-conjugated TransferrinThermo Fisher ScientificCat# T23366
OtherAlexa Fluor 488-conjugated 10 kDa dextranThermo Fisher ScientificCat# T23366
OtherDynabeads MyOne Streptavidin-coupled magnetic beadsThermo Fisher ScientificCat# 65001

Antibodies

The following antibodies were used: anti-BMP2K (sc-134284) and anti-GAPDH (sc-25778) from Santa Cruz; anti-phospho-μ2 (#7399), anti-SEC24B (#12042) and anti-LC3B (#2775) from Cell Signaling Technologies; anti-EPS15R (ab76004) from Abcam; anti-tubulin (T5168), anti-vinculin (V9131) and anti-beta-actin (A5441) from Sigma; anti-SQSTM1/p62 (610833), anti-μ2 (611350) and anti-SEC31A (612350) from BD Biosciences; anti-GFP (AF4240) from R&D Systems; anti-SEC16A (A300-648A) from Bethyl Laboratories Inc; anti-SEC16A (HPA005684) from Atlas Antibodies; anti-TFRC (H68.4), APC-conjugated anti-TFRC (#17-0711-80) and PE-conjugated anti-Ter-119 (#12-5921-81) from Thermo Fisher Scientific; secondary horseradish peroxidase (HRP)-conjugated goat anti-mouse and goat anti-rabbit antibodies from Jackson ImmunoResearch; secondary Alexa Fluor 488-conjugated anti-mouse and Alexa Fluor 555-conjugated anti-rabbit antibodies from Thermo Fisher Scientific.

Plasmids

To obtain pcDNA3.1-BMP2K-L construct, full-length human BMP2K-L was amplified from HEK293 cell cDNA by PCR using oligonucleotides 5’-ggggAAGCTTATGAAGAAGTTCTCTCGGATGCC-3’ (forward with HindIII restriction site) and 5’-ggggGGATCCCTACTGTTTAGAAGGAAATGGAGCAG-3’ (reverse with BamHI restriction site), subcloned into the pcDNA3.1 vector, and sequence-verified. To obtain pcDNA3.1-BMP2K-S construct, full-length human BMP2K-S was amplified from the clone IRAT32H09 (SourceBioScience) by PCR with the oligonucleotides 5’-ggggAAGCTTATGAAGAAGTTCTCTCGGATGCC-3’ (forward with HindIII restriction site) and 5’-AACAGCTATGACCATG-3’ (reverse M13 primer), subcloned into the pcDNA3.1 vector, and sequence-verified.

The pcDNA3.1-Myc-BirA*-BMP2K-L or pcDNA3.1-Myc-BirA*-BMP2K-S constructs were obtained by amplification of BMP2K-L or BMP2K-S from pcDNA3.1-BMP2K-L or pcDNA3.1-BMP2K-S using oligonucleotides 5’-gctaGGATCCTATGAAGAAGTTCTCTCGGAT-3’ (forward with BamHI restriction site) and 5’-gcgcGGTACCCTACTGTTTAGAAGGAAATG-3’ (reverse with KpnI restriction site for BMP2K-L) or 5’-gcgcGGTACCTTACTGTGAAGCAAAATAAG-3’ (reverse with KpnI restriction site for BMP2K-S) and subcloning into pcDNA3.1 mycBioID vector. The pcDNA3.1-BMP2K-L-BirA*-HA or pcDNA3.1-BMP2K-S-BirA*-HA constructs were obtained by amplification of BMP2K-L or BMP2K-S from pcDNA3.1-BMP2K-L or pcDNA3.1-BMP2K-S using oligonucleotides 5’-gcgcACCGGTATGAAGAAGTTCTCTCGGAT-3’ (forward with AgeI restriction site) and 5’-gcgcGGATCCCTGTTTAGAAGGAAATGGAG-3’ (reverse with BamHI restriction site for BMP2K-L) or 5’-gcgcGGATCCCTGTGAAGCAAAATAAGCCT-3’ (reverse with BamHI restriction site for BMP2K-S) and subcloning into pcDNA3.1 MCS-BirA(R118G)-HA vector. The pcDNA3.1 mycBioID and pcDNA3.1 MCS-BirA(R118G)-HA vectors (Addgene plasmids # 35700 and # 36047) were gifts from Kyle Roux (Satchwell et al., 2011). pEGFP-SEC16A construct (Addgene plasmid # 36155) was a gift from David Stephens (Watson et al., 2006). psPAX2 (Addgene plasmid # 12260) and pMD2.G (Addgene plasmid # 12259) lentiviral packaging plasmids were a gift from Didier Trono. pUltra-Chili vector (Addgene plasmid # 48687) was a gift from Malcolm Moore. MISSION shRNA plasmids were obtained from Sigma-Aldrich. pLKO.1 - TRC cloning vector (Addgene plasmid # 10878) was a gift from David Root. LentiCRISPRv2 vector (Addgene plasmid # 52961) was a gift from Feng Zhang. shRNA sequences for depletion of specific BMP2K splicing variants were cloned into the pLKO.1 - TRC cloning vector using a protocol provided by Addgene. gRNA sequences for CRISPR/Cas9 mediated gene inactivation were cloned into the LentiCRISPRv2 vector using a protocol described elsewhere (Sanjana et al., 2014).

To obtain the pUltra-EGFP-BMP2K-L or pUltra-EGFP-BMP2K-S lentiviral constructs, first, pEGFP-BMP2K-L and pEGFP-BMP2K-S plasmids were generated. The pEGFP-BMP2K-L construct was obtained by restriction digestion of pcDNA3.1-BMP2K-L with HindIII and BamHI and subcloning the insert into pEGFP-C3 vector. The pEGFP-BMP2K-S construct was obtained by amplification of BMP2K-S from pcDNA3.1-BMP2K-S using oligonucleotides 5’-ggggAAGCTTATGAAGAAGTTCTCTCGGATGCC-3’ (forward with HindIII restriction site) and 5’-ggggGGATCCTTACTGTGAAGCAAAATAAGCCTTC-3’ (reverse with BamHI restriction site) and subcloning into pEGFP-C3 vector. Next, pEGFP-BMP2K-L or pEGFP-BMP2K-S plasmids were digested with AgeI and BamHI restriction enzymes and the inserts were subcloned into pUltra-Chili vectors, substituting their dTomato inserts with the EGFP-BMP2K coding sequences.

Cell culture and treatment

Request a detailed protocol

HEK293 cells were maintained in Dulbecco’s modified Eagle’s medium (DMEM) and K562 cells in RPMI-1640 medium (Sigma-Aldrich). All media had high glucose concentration and were supplemented with 10% fetal bovine serum and 2 mM L-glutamine (Sigma-Aldrich). Hemin (H9039, Sigma-Aldrich) was used to stimulate erythroid differentiation of K562 cells at 20 μM concentration for 48 hr or 72 hr. Hemin 4 mM stocks were prepared according to the published protocol (Addya et al., 2004). Briefly, 13 mg of hemin was resuspended in 200 μl of 0.5 M sodium hydroxide, mixed with 250 μl of 1 M Tris (pH 7.8) and H2O was added to a final volume of 5 ml. K562 cells were also treated for 48 hr with 75 nM bafilomycin A1 (B1793, Sigma-Aldrich) to assess autophagic flux.

The identity of K562 cells has been authenticated by STR profiling. Their profile matched all of the reference ATCC STR loci. These cells were regularly tested as mycoplasma-negative.

Cell transfection and lentiviral transduction

Request a detailed protocol

For western blotting in HEK293 cells, 2.6*105 cells were seeded per well in 12-well plates. For co-immunoprecipitation of proteins ectopically expressed in HEK293 cells, 6*105 cells were seeded in 60 mm dishes. The cells were transfected after 24 hr with plasmid DNA using Lipofectamine 2000 Transfection Reagent (Thermo Fisher Scientific) according to the manufacturer’s protocol.

Lentiviral particles to transduce K562 cells were produced in HEK293T cells using psPAX2 and pMD2.G packaging plasmids as described elsewhere (Barde et al., 2010). For infection, 1*106 K562 cells were grown in 10 ml of virus-containing RPMI-1460 medium for 24 hr. To achieve shRNA-mediated depletion of BMP2K, MISSION shRNA plasmids were used. The empty pLKO.1 plasmid (SHC001), and the construct expressing non-targeting shRNA (SHC202) served as controls. After initial testing (not shown in the manuscript figures) of 5 different shRNA sequences (TRCN0000000914, TRCN0000000915, TRCN0000000916, TRCN0000000917, TRCN0000226438), only one (TRCN0000000915, shBMP2K) was found to efficiently downregulate BMP2K expression as assessed by western blotting. To achieve shRNA-mediated depletion of specific BMP2K splicing variants, shRNA sequences were designed using the siRNA Selection Program (Yuan et al., 2004) and cloned into pLKO.1 – TRC cloning vector. These sequences are listed in Supplementary file 1-Table 3. To achieve CRISPR/Cas9-mediated inactivation of BMP2K gene, four different gRNA sequences (Doench et al., 2016) were cloned into the lentiCRISPRv2 vector and were lentivirally introduced into K562 cells. Their efficiency of gene expression silencing was tested by western blotting and two sequences causing the strongest reduction of BMP2K protein levels were chosen for further experiments. gRNAs used in this study are listed in Supplementary file 1-Table 4. For BMP2K depletion, cells were transduced with lentiviral particles containing control or gene-targeting vectors for 24 hr and selected with 2 µg/ml puromycin for 72 hr.

For overexpression of EGFP-tagged BMP2K variants, K562 cells were transduced for 24 hr with lentiviral particles containing pUltra-EGFP-BMP2K-L or -S plasmids and analyzed after three subsequent days of culture.

Mouse fetal liver erythroblast isolation, ex vivo differentiation and FACS

Request a detailed protocol

Mouse fetal liver erythroid progenitors were isolated and stimulated for differentiation as described (Zhao et al., 2014). Briefly, 8–10 livers were extracted from embryonic day 13.5 C56/BL6 mouse embryos and manually disrupted. Ter119-positive differentiated cells were recognized using specific biotin-conjugated antibodies (13-5921-81) and removed from the cell suspension using Dynabeads MyOne Streptavidin-coupled magnetic beads (65001; both reagents from Thermo Fisher Scientific). To induce erythroid differentiation, 4*105 purified and washed cells were cultured on fibronectin-coated 12-well plates in the presence of erythropoietin (EPO)-containing Iscove’s Modified Dulbecco’s Medium: 2 U/ml recombinant human EPO (100-64), 10 μg/ml insulin (I3536), 200 μg/ml holo-transferrin (T0665), 0.1 mM β-mercaptoethanol (M3148), 1% BSA, 15% FBS and 2 mM L-glutamine (EPO from PeproTech and other reagents from Sigma-Aldrich). After 24 hr, 48 hr or 72 hr of differentiation the cells were harvested for western blotting or qRT-PCR analyses.

To analyze protein levels in mouse erythroblasts at various stages of differentiation, the isolated mouse fetal liver progenitors were differentiated for 96 hr and labeled with APC-conjugated anti-TFRC and PE-conjugated anti-Ter-119 antibodies as described (Zhao et al., 2014). The labeled cells were FACS-separated using BD FACSAria II cell sorter and harvested for western blotting analysis.

Immunofluorescence staining and microscopy

Request a detailed protocol

K562 cells (non-treated or transduced with lentiviral plasmids) were transferred to ice, fixed with 3% paraformaldehyde for 15 min on ice followed by 15 min at room temperature. After three washes with PBS, cells were immunostained in suspension using an adapted version of a protocol described for adherent cells (Mamińska et al., 2016). Stained cells were resuspended in 0.5% low-melting agarose (Sigma-Aldrich) and transferred to microscopy 96-well plates (Greiner Bio-One). The plates were scanned using Opera Phenix high content screening microscope (PerkinElmer) with 40 × 1.1 NA water immersion objective. Harmony 4.9 software (PerkinElmer) was used for image acquisition and their quantitative analysis. To quantify chosen parameters in the obtained images (number of vesicular structures per cell, mean fluorescence intensity per structure, integral fluorescence intensity per cell and mean pixel intensity), more than 40 microscopic fields were analyzed per each experimental condition. Maximum intensity projection images were obtained from 7 to 8 z-stack planes with 1 μm interval. Pictures were assembled in Photoshop (Adobe) with only linear adjustments of contrast and brightness.

Western blotting

Request a detailed protocol

Cells were lysed in RIPA buffer (1% IGEPAL CA-630, 0.5% sodium deoxycholate, 0.1% SDS, 50 mM Tris (pH 7.4), 150 mM NaCl, 0.5 mM EDTA) supplemented with protease inhibitor cocktail (6 μg/ml chymostatin, 0.5 μg/ml leupeptin, 10 μg/ml antipain, 2 μg/ml aprotinin, 0.7 μg/ml pepstatin A and 10 μg/ml 4-amidinophenylmethanesulfonyl fluoride hydrochloride; Sigma-Aldrich) and phosphatase inhibitor cocktails (P0044 and P5726, Sigma-Aldrich). For HEK293 or K562 cells, protein concentration was measured with BCA Protein Assay Kit (Thermo Scientific) and 10–50 µg of total protein per sample were resolved on SDS-PAGE. For mouse fetal liver erythroblasts, RIPA lysate equivalents of 3*105 cells were resolved on SDS-PAGE. Resolved proteins were transferred to nitrocellulose membrane (Whatman), probed with specific primary and secondary antibodies, and detected using ChemiDoc imaging system (Bio-Rad) or Odyssey infrared imaging system (LI-COR Biosciences).

Densitometric analysis of western blotting bands was performed using Image Lab 5.2.1 software (Bio-Rad). The raw data were normalized to tubulin band intensities (for K562 cells) or were not normalized (for mouse fetal liver erythroblasts) and presented as fold levels over respective controls.

Co-immunoprecipitation (Co-IP)

Request a detailed protocol

For co-immunoprecipitation of proteins ectopically expressed in HEK293 cells, an equivalent of 8*105 cells in 300 μl of RIPA buffer was used per reaction. The lysates were incubated for 1.5 hr at 4°C with 1 µg of goat anti-GFP antibodies with rotation. The immune complexes were captured by incubation with Protein G-agarose for 2 hr at 4°C with rotation. The agarose beads-bound protein complexes were spun down and washed three times using IP wash buffer (50 mM Hepes, pH 7.5, 300 mM NaCl, 1 mM EGTA, 1 mM EDTA, 1% Triton X-100, 10% glycerol, 5 μg/ml DNase and protease inhibitor cocktail) and one time using 50 mM Hepes, pH 7.5. The proteins were eluted from the beads by incubation at 95°C for 10 min with Laemmli buffer and analyzed by western blotting. Protein G-agarose beads were blocked in PBS with 5% BSA for 2 hr at 4°C with rotation before they were added to capture the immune complexes.

Quantitative real-time PCR (qRT-PCR)

Request a detailed protocol

Total RNA was isolated from cells with High Pure Isolation Kit (Roche). For cDNA synthesis random nonamers, oligo(dT)23 and M-MLV reverse transcriptase (Sigma-Aldrich) were used according to the manufacturer’s instructions. To estimate the expression of genes of interest we used primers designed with NCBI tool (and custom-synthesized by Sigma-Aldrich) listed in Supplementary file 1-Table 5. The qRT-PCR reaction was performed with the Kapa Sybr Fast ABI Prism qPCR Kit (KapaBiosystems) using a 7900HT Fast Real-Time PCR thermocycler (Applied Biosystems) with at least three technical repeats per experimental condition. The data were normalized according to the expression level of housekeeping gene, GAPDH (in K562 cells) or RPL19 (in mouse fetal liver erythroblasts) and presented as fold changes.

Transferrin and dextran uptake assay

Request a detailed protocol

For continuous transferrin (Tf) uptake experiments, 1*106 K562 cells were pre-incubated for 30 min on ice with 25 μg/ml Alexa Fluor 647-conjugated Tf (Thermo Fisher Scientific) and incubated at 37 °C for 5 or 40 min (early uptake or steady-state loading, respectively) followed by washing and fixation with 3% PFA for 5 min. For dextran uptake measurement, cells were incubated with 125 μg/ml Alexa Fluor 488-conjugated 10 kDa dextran (Thermo Fisher Scientific) at 37 °C for 40 min followed by washing and fixation.

The pulse-chase Tf uptake was performed according to a described protocol (Dannhauser et al., 2017) but adapted for K562 cells cultured in suspension. Briefly, non-starved cells were incubated for 15 min on ice with 5 μg/ml Alexa Fluor 647-conjugated Tf (Thermo Fisher Scientific) in RPMI medium, followed by washing unbound Tf with ice-cold PBS. Then cells were either analyzed immediately by flow cytometry, to assess the cell surface Tf binding, or were resuspended in pre-warmed RPMI medium and incubated at 37 °C for 5 min to initiate Tf uptake. The uptake was stopped by washing in ice-cold PBS and non-internalized Tf was stripped by two acid washes (0.15 m glycine buffer, pH 3). Upon final wash with ice-cold PBS, cells were analyzed by flow cytometry. For each experimental conditions we applied control conditions, including non-stained cells (without Alexa Fluor 647-conjugated Tf incubation to estimate background fluorescence), and cells stripped immediately upon incubation with Tf (to determine the efficiency of surface-bound Tf removal).

Fixed (continuous uptake) or non-fixed (pulse-chase uptake) cells were resuspended in PBS and the fluorescence of incorporated Tf or dextran was recorded from 50 000 cells with a BD LSR Fortessa flow cytometer. The data collection and calculation of mean fluorescence intensities were performed using BD FACSDiva 6.2 software. Flow cytometry data were analyzed and visualized by FlowJo software (BD Biosciences).

Hemoglobin content analysis

Request a detailed protocol

Hemoglobin content in K562 cells was visualized by staining with benzidine dihydrochloride (B3383, Sigma-Aldrich). Briefly, 300 µl of 2 mg/ml solution in 3% acetic acid was added to an equal volume of fresh RPMI-1640 medium with 2*105 cells, followed immediately by addition of 12 µl of 30% hydrogen peroxide solution. The stained cells were imaged in bright-field using the IX 7C Olympus microscope and the percentage of hemoglobin-positive cells was counted using the ImageJ software. At least 1000 cells from 4 to 6 images were counted per sample.

Proximity biotinylation (BioID)

Request a detailed protocol

The expression of Myc-BirA*-BMP2K-L, Myc-BirA*-BMP2K-S, BMP2K-L-BirA*-HA or BMP2K-S-BirA*-HA fusion proteins was assessed after transient transfection of HEK293 cells. The obtained constructs as well as empty vectors were linearized using PvuI restriction enzyme and introduced into HEK293 cells using Lipofectamine 2000 Transfection Reagent. The cells underwent antibiotic selection with 500 μg/ml G418 (Gibco) and clones stably expressing each of the fusion proteins were generated. The expression efficiencies among the obtained clones were assessed by western blotting (not shown in the manuscript figures) and two clones expressing the highest levels of each fusion protein were selected for biotin labelling. Biotin labelling and subsequent pull down of biotinylated proteins using Dynabeads MyOne Streptavidin-coupled magnetic beads (65001; Thermo Fisher Scientific) was performed in two biological repeats for each of the two selected clones, following the originally described protocol (Roux et al., 2013). The qualitative analysis of biotinylated proteins from each sample was performed by mass spectrometry and analyzed using Mascot software. The Mascot scores obtained for each of the two clones per condition (Myc-BirA*-BMP2K-L, Myc-BirA*-BMP2K-S, BMP2K-L-BirA*-HA or BMP2K-S-BirA*-HA) were averaged and the scores obtained for proteins identified in the control samples (false-positive background of Myc-BirA* or BirA*-HA) were subtracted. The final subtracted C-tag or N-tag scores were obtained from averaging the subtracted scores from two biological repeats.

Mass spectrometry of biotinylated proteins

Request a detailed protocol

Proteins biotinylated in BioID were reduced with 5 mM TCEP (for 60 min at 60°C). To block reduced cysteines, 200 mM MMTS at a final concentration of 10 mM was added and the sample was incubated at room temperature for 10 min. Trypsin (Promega) was added at a 1:20 vol./vol. ratio and incubated at 37 °C overnight. Finally, trifluoroacetic acid was used to inactivate trypsin. Peptide mixtures were analyzed by liquid chromatography coupled to tandem mass spectrometry (LC-MS/MS) using Nano-Acquity (Waters Corporation) UPLC system and LTQ-FT-Orbitrap (Thermo Scientific) mass spectrometer. Measurements were carried out in the positive polarity mode, with capillary voltage set to 2.5 kV. A sample was first applied to the Nano-ACQUITY UPLC Trapping Column using water containing 0.1% formic acid as a mobile phase. Next, the peptide mixture was transferred to Nano-ACQUITY UPLC BEH C18 Column using an acetonitrile gradient (5–35% acetonitrile over 160 min) in the presence of 0.1% formic acid with a flow rate of 250 nl/min. Peptides were eluted directly to the ion source of the mass spectrometer. Each LC run was preceded by a blank run to ensure that there was no carry-over of material from previous analysis. HCD fragmentation was used. Up to 10 MS/MS events were allowed per each MS scan.

Acquired raw data were processed by Mascot Distiller followed by Mascot Search (Matrix Science, London, UK, on-site license) against SwissProt database restricted to human sequences. Search parameters for precursor and product ions mass tolerance were 30 ppm and 0.1 Da, respectively, enzyme specificity: trypsin, missed cleavage sites allowed: 1, fixed modification of cysteine by methylthio and variable modification of methionine oxidation. Peptides with Mascot score exceeding the threshold value corresponding to <5% expectation value, calculated by Mascot procedure, were considered to be positively identified. BioID-MS detection scores were visualized using R package ggplot2 and scales (R version 3.4.4).

The mass spectrometry proteomics data have been deposited to the ProteomeXchange Consortium via the PRIDE (Perez-Riverol et al., 2019) partner repository with the dataset identifier PXD013542.

Statistical analysis

Request a detailed protocol

Data are provided as mean ± SEM. Statistical analysis was performed with Prism 8 (GraphPad Software) using unpaired two-tailed Student t test (for qRT-PCR analysis and western blotting densitometry in K562 cells) or paired two-tailed Student t test (for uptake experiments, hemoglobin content analysis, western blotting densitometry in mouse fetal erythroblasts and quantified parameters from confocal microcopy analysis). Data points were marked according to the p value, where p>0.05 is left unmarked or indicated with p=value, *p<0.05, **p<0.01, ***p<0.001, ****<0.0001.

Data availability

The mass spectrometry proteomics data have been deposited to the ProteomeXchange Consortium via the PRIDE partner repository with the dataset identifier PXD013542.

The following data sets were generated
    1. Cendrowski J
    2. Miaczynska M
    (2019) PRIDE
    ID PXD013542. BMP2K is an inhibitor of erythroid differentiation that restricts endocytosis and SEC16A-dependent autophagy.

References

Decision letter

  1. Elizabeth A Miller
    Reviewing Editor; MRC Laboratory of Molecular Biology, United Kingdom
  2. Vivek Malhotra
    Senior Editor; The Barcelona Institute of Science and Technology, Spain
  3. Elizabeth A Miller
    Reviewer; MRC Laboratory of Molecular Biology, United Kingdom

In the interests of transparency, eLife publishes the most substantive revision requests and the accompanying author responses.

Acceptance summary:

In this work, the authors explore the roles of two forms (long, L, and short, S) of BMP2K that play a role in erythroid differentiation. BMP2K interacts with components of the COPII machinery that mediates ER export of secretory and membrane proteins, and also participates in autophagy. This suggests an intriguing regulatory mechanism for modulating cell fate by altering membrane trafficking events.

Decision letter after peer review:

Thank you for submitting your work entitled "Splicing variants of BMP2K, an erythroid-enriched endocytic kinase, coordinate SEC16A-dependent autophagy" for consideration by eLife. Your article has been reviewed by three peer reviewers, including Elizabeth A Miller as the Reviewing Editor and Reviewer #1, and the evaluation has been overseen by a Senior Editor.

Our decision has been reached after consultation between the reviewers. Based on these discussions and the individual reviews below, we regret to inform you that the work as submitted will not be considered for immediate publication in eLife. That said, there was considerable enthusiasm from all reviewers about the topic, specifically its relevance to erythroid differentiation. But all reviewers had significant reservations regarding various aspects of the study as presented. Of particular concern were the co-localization and immunofluorescence experiments that were difficult to discern and not quantified. All reviewers found the flow of logic difficult to follow, and a final model was unclear with respect to autophagy regulation and erythroid differentiation, and in particular to the role of Sec16 in this. All reviewers shared the opinion that a substantially revised and refocused manuscript that provides a clearer vision of the putative cross talk and its relevance to erythroid differentiation would be more compelling and suitable for eLife.

We hope that the attached reviewer comments, provided verbatim, will help guide you in terms of what was confusing or distracting in the current submission. These comments should serve as a guide for additional experiments that will be necessary to add clarity and ameliorate reviewers' concerns. We would be happy to consider a heavily revised submission, but also understand if you would prefer submission elsewhere for more timely publication.

Reviewer #1:

This manuscript from the Miaczynska lab describes potentially important insight into crosstalk between secretion, endocytic and autophagy pathways. Starting from the known endocytosis-associated protein, BMP2K, the authors use a combination of BioID, co-IP, co-localization and knock-down/knock-out studies to probe the multiple cellular pathways that BMP2K participates in. Some of the findings are strong, others less so, but the major concern is that causal links between any of the new effectors are lacking. The findings might better be presented as a focused report that highlights the new interactors and focuses on the most robust findings.

Essential revisions:

1) Overexpression experiments (Figure 1, Figure 2) clearly induce artifactual aggregates/structures. Although the authors are careful not to claim these represent endogenous structures, the findings are still somewhat overinterpreted. To my mind, the only thing these experiments demonstrate is that aggregates of BMP2K-L can sequester/recruit endocytic machinery.

2) The Sec16 co-IP experiment (Figure S2) is problematic: the no-GFP control IP clearly pulls down some BMP2K, raising the concern that the protein is sticky and will bind non-specifically. A GFP pulldown with an unrelated protein is probably a better control.

3) Some claims about co-localization and organelle morphology (Figure 3 and Figure 4D respectively) are difficult for me to see in the images presented. In the case of the Golgi morphology, is it possible that any differences are simply the result of increased ARFGAP? A control experiment overexpressing ARFGAP would address this. This problem highlights the causality issue in many interpretations.

4) I'm not sure exactly what the BFA experiment (Figure 5) tells us. BFA treatment has profound and pleiotropic effects, so again, the causal nature of what happens in these conditions is difficult to understand.

Reviewer #2:

The paper reports the characterization of molecular events leading to the transition for erythroid to red blood cells, which are devoid of nucleus as well as many organelles. The notion is that autophagy is activated during this transition leading to the clearance of many of these organelles.

The authors focus on two isoforms of the BMP2 kinase as this kinase appears to be upregulated during this transition.

The manuscript reports the differential localization and role of two isoforms of the, Short (S) and Long (L). BIoID has been performed with these two isoforms that bind different set of markers. When L is overexpressed in HeLa, it is found in aggregates and interacts with components of the endocytic machinery (that also localized in these aggregates) in line with the BioID. Conversely, S is more around or at the early secretory pathway and interact with ARFGAP and Sec16A.

The manuscript mostly focuses on S and Sec16A presented as a key player in autophagy.

They use two techniques. siRNA and CRISPR KO. shRNA of S revealed that Sec16A level is severely reduced but CRISPR KO does not reproduce any of this.

Taken together, the authors show that BMP2K is upregulated during the transition mentioned above yet it restricts autophagy. Furthermore, the reviewer is left with the notion that Sec16 is a negative regulator of autophagy and that BMP2K restricts autophagy, even though this kinase is upregulated during the transition and it is argued that autophagy should be stimulated.

At that stage, the manuscript is confusing and not publishable.

Essential revisions:

1) Sec16 has not been shown to be a positive player in autophagy. The paper Kundu, 2016 needs to be carefully read. Sec16 is phosphorylated by ULK1 but in basal conditions. In yeast, it indeed has been shown to be an autophagic player but this has not been confirmed in mammalian cells.

So Instead of presenting Sec16 as an established autophagic player, the authors should genuinely review all the evidences suggesting that it might be, and show that it is.

Furthermore, reading through the manuscript, the reviewer became increasingly confused as to whether the authors think/show that it is a positive or a negative factor for autophagy. This confusion therefore makes the reviewer weary of the title.

The Abstract is also confusing. What does functional cross talk with Sec16A mean?

2) I would disagree that the role of the early secretory pathway to autophagosome formation is still cloudy and badly understood. It is clearer and clearer especially since the publication of the article from Jeong, Cuervo and Pagano showing the switch from Sec23B being degraded in basal conditions to forming a "specific" coat for COPII vesicles dedicated to fuel the growth of the nascent autophagome.

In this regard, why are Sec24 and Sec23 not investigated in relation to S instead of Sec16 especially since Sec24 appears to be an interactor of this kinase. Sec24 level should be monitored.

3) In relation to this, what happens to general trafficking out of the ER through the secretory pathway upon manipulation of the 2 kinases isoforms (Oe, si RNA and CRISPR). This is not shown or even mentioned.

4) The co-localisation between S and Sec 16 is not convincing. Granted, some S is present at the compartments of the early secretory pathway upon OE in HeLa cells (Figure 2B). In the K562 cells, the cytoplasm is very small and would be cramped with most of the organelles. The reviewer doubts the colocalition is real even though the use of a relevant cell line is laudable.

Also puzzling is that overexpressed S co-immunoprecipitates with overexpressed GFP-Sec16 in HeLa cells. However, in the erythroid cell line K562, endogenous S does not co-precipitate Sec16 and Sec16 does not co-precipitate S.

5) However, it is not uncommon for a kinase to not localize near its substrate since binding is transient. Therefore, the emphasis should be on showing that Sec16 is phosphorylated by this kinase. Is the site known or can it be mapped? Is it conserved in species that do not have red blood cell?

6) the difference between shRNA and CRISPR KO is puzzling (to a certain extent) but removing Sec16 for BMP2K KO cells does not clarify the situation and leads to a mechanism. Either the shRNA has off targets and should not be used. Or Sec16 is not the right mechanism to focus upon.

7) The conclusion of the manuscript is that the two isoforms have antagonistic effects on the regulation of autophagy. S appears to inhibit it while L appears to activate it but overall, the enzyme restrict autophagy. Yet, both isoforms are upregulated in mouse fetal liver (so during the transition that is studied). How this make sense in a situation where autophagy should be stimulated to remove organelles from red blood cell cytoplasm?

8) The manuscript is complicated by the fact that it reports data on the endocytic markers that are hardly part of the story line and do not contribute to the clarity of the presentation. I would advise to remove the L part of the story with endocytosis and makes another article with it.

Reviewer #3:

This manuscript describes the membrane traffic functions of two splice variants of BMPK2 that influence pathways important for erythroid differentiation. There are several features of the study that are of interest to the broad readership of eLife and represent steps forward in understanding how membrane traffic pathways interact during cellular differentiation.

1) The membrane traffic role of this particular kinase, implicated in oncogenesis, has not been previously defined in detail.

2) The observation that two splice variants of the same gene regulate two different membrane traffic pathways (endocytosis and autophagy) that are both required for erythroid differentiation reveals the importance of balancing these two pathways for complex celllular functions.

3) This is another emerging example of cross-talk between endocytic and early secretory pathway players regulating specialized membrane traffic that leads to cell differentiation.

This study reports a number of different approaches to discovering the roles and functions of the BMPK2 splice variants and together the experimental results generally support the conclusions. The complexity of the findings make the story challenging to follow as a reader, since the data are revealed presumably in the order that the investigators followed their inquiry. However, this reviewer cannot obviously see another way to present the story, though the story is really about a dual regulator for membrane traffic pathways that influence erythroid differentiation.

A few issues need to be addressed in revision to support the interpretations of the data:

1) The initial cellular localization data shows that the two splice variants are localized differently, but quantification of overlap with the markers studied should be included for Figure 2-all panels.

2) The data in Figure S2C is much more convincing than the data in Figure 2C and D as an argument that mu2 phosphorylation is influenced by the L form. This should be included in the main figure.

3) It is clear that the downregulation of the different splice variants have different effects on distribution of secretory pathway markers (Figure 4D), but again quantification of co-localization changes should be provided.

4) There is some concern that the Tf uptake assay is not really measuring CME because there is no washing step after Tf binding (or at least this was not stated in the methods). So it seems that the 5 minute and the 40 minute time points both represent uptake of Tf that would be a combination of CME and bulk uptake. It has been reported that where CME is downregulated, bulk endocytosis is increased (eg with dynamin mutants), so both Tf and dextran uptake can increase together in these circumstances. Thus, it is not possible to conclude that BMP2K is a negative regulator of both types of endocytosis. Bulk uptake of both could increase because it is a positive regulator that is then removed. This doesn't change the story that both endocytosis and autophagy are mediated by the BMPK2 splice variants, but it would change the authors' discussion of how BMPK2 regulates the CME pathway.

[Editors’ note: further revisions were suggested prior to acceptance, as described below.]

Thank you for submitting your article "Splicing variation of BMP2K balances endocytosis, COPII trafficking and autophagy in erythroid cells" for consideration by eLife. Your article has been reviewed by three peer reviewers, including Elizabeth A Miller as the Reviewing Editor and Reviewer #1, and the evaluation has been overseen by Vivek Malhotra as the Senior Editor.

The reviewers have discussed the reviews with one another and the Reviewing Editor has drafted this decision to help you prepare a revised submission.

We would like to draw your attention to changes in our revision policy that we have made in response to COVID-19 (https://elifesciences.org/articles/57162). Specifically, when editors judge that a submitted work as a whole belongs in eLife but that some conclusions require a modest amount of additional new data, as they do with your paper, we are asking that the manuscript be revised to either limit claims to those supported by data in hand, or to explicitly state that the relevant conclusions require additional supporting data.

Our expectation is that the authors will eventually carry out the additional experiments and report on how they affect the relevant conclusions either in a preprint on bioRxiv or medRxiv, or if appropriate, as a Research Advance in eLife, either of which would be linked to the original paper.

Essential revisions:

Reviewers had legitimate concerns about the claims, some of which are poorly substantiated, as well as some more technical concerns. After ample discussion, reviewers agreed to support a resubmission as a more focused Short Report rather than a Research Article. The Short Report format encompasses a novel important finding without the need for extensive mechanism. We believe your findings on the short and long forms of BMPK2, with their differential effects on COPII function fall into this category. In particular, the relevance of this to erythroid function broadens the general interest. To this end, we are making the following suggestions to streamline your findings and present only the most robustly supported findings. Where specific outcomes have not been demonstrated, you should tone down the conclusions. You should also acknowledge the limitations of the erythroid model you use with respect to full differentiation as noted by reviewer 3. Most importantly, you should not claim that secretion or COPII function has been impacted, since you don't measure secretion directly. Some aspects were repetitive (eg. showing both shRNA and gRNA KD/KO) and some of this duplication could be moved to supplementary figures, as suggested by reviewer 3. The discussion should be similarly streamlined.

One suggested revision plan:

Figure 1. A condensed composite of current Figure 1 and Figure 2 showing BMPK2 for the developmental trajectory and erythroid cell lines, and the relevance for erythroid differentiation. Here, the relevant comments of reviewers 2 and 3 should be taken into consideration.

(The mu-2 phosphorylation and endocytosis effects should be supplemental or omitted since causality here cannot be demonstrated. This aspect seems to be a side-line and disrupts the narrative flow and focus.)

Figure 2. Current Figure 4, showing mass spectrometry data and colocalization experiments (Eps15 as supplement). Again, note the technical concerns of reviewer 2 with respect to microscopy.

Figure 3. Effects of S and L forms on ERES (central versus peripheral), but tone down the interpretation on secretion unless experiments can be shown that quantify such an effect. Links to autophagy.

Figure 4. Link Sec16 data back to erythroid differentiation. Here, any additional data that support the function of autophagy vs. secretion switches in erythroid differentiation would be most helpful: S/L effects and Sec16 KD effects on erythroid differentiation.

Reviewer #1:

This manuscript investigates the role of BMPK2 splice isoforms in erythroid precursor cells, dissecting the role of the short and long forms in modulating endocytosis, exocytosis and autophagy. The data are of high quality, but the ms suffers from overinterpretation and the flow of logic could be vastly improved.

Specific concerns for discussion:

1) The relevance of the L/S ration in KO/KD experimetns versus simple abundance of either isoform isn't substantiated (Figure 2) so should be toned down with respect to causality.

2) Similarly, causality in regard to Tf internalization, mu-2 phosphorylation and erythroid development is not clear from the experiments, which makes conclusions difficult to draw. This section should be consolidated and simplified to spell out: observed effects are difficult to dissect because of changes in TfR abundance at the cell surface.

3) There are many situations where the findings are overstated (eg. Results section). In each case, the authors claim to have demonstrated regulation or control over COPII trafficking, when in reality all they have demonstrated is changes in abundance and different intracellular structures. In the absence of some measure of impact on secretion per se, this should be toned down.

4) Related to this problem of overstating conclusions, it's very muddy in the narrative as presented what the different COPII-positive structures represent (ERES vs autophagic sites) and how the different splice KDs impact these. Being more clear up front about what the model is would help with the flow of logic.

5) This would require some experimentation, but the over-riding question I had at the end was what impact the splice-specific and Sec16 KD had on erythroid differentiation. This seems to be a major conclusion that the authors want to make but the data were not there? I ended up making myself a table of the different findings to put it all together. This is something that would make the ms easier to follow.

Reviewer #2:

The manuscript by Cendrowski et al. studied the role of two isoforms of BMP2K and their differential effects on endocytosis, COPII trafficking and autophagy. They propose a model in which the differential biologic roles and expression of these two isoforms regulates erythroid maturation.

I noticed that this manuscript is a re-submission to eLife, but I see this work now for the first time. I assessed it independently of this, but had a look at how the authors had responded to the previous comments.

Overall, the topic of the study is highly interesting and the model the authors are proposing is intriguing. However, I was not convinced by many of the data and don't think that they support the claims of the authors. Too many interesting observations were made, that lack a mechanistic foundation, which strongly limits the impact of the work. In my view, this manuscript is not suitable for eLife.

Below are my main comments/concerns that are a technical as well as conceptual in nature.

1) Figure 1A,B: The blot shown does not really reflect the quantification. The problem is that the blot is a bit overexposed, making it hard to judge the bands properly.

2) Figure 1D: I agree that the L/S ratio changes, but both isoforms follow the same pattern, i.e. the increase from R0 to R3 and then drop in R5. Some changes in ratio are not detectable in the representative blot. For instance, the ratio at R1 and R5 is almost identical, yet the authors claim that there is a 2fold difference. Again, a better match between quantitation and representative blot is required to support the claim.

3) Figure 2: I agree that in panel B, the L/S ration in K562 cells is different. However, in panel A , the ratio is essential 1. The fact that this is "overexposed" as the authors state, is not sufficient to explain this discrepancy.

4) Figure 2C: Is the CRISPR-knockout incomplete, or are the remaining bands non-specific? The authors have not commented on this.

5) Conceptually: if you knockout BMP2K (i.e. the levels are 0), how can there be a ratio of any isoform of this gene. A ratio is only measurable if the knockout is not complete. Regardless of this conceptual problem, I don't think that L/S ratio is different between control and gRNA cells.

6) Figure 2: What sequence is the shRNA targeting? It is strange that the L/S ratio would change if the shRNA would target a sequence common to both isoforms. There is no explanation for this.

7) Figure 2H: Is the effect of g#1 really biologically significant? The difference in endocytosis of Tf or dextrane is less than 5%.

8) Figure 3: Why does the total level of TFRC increase when the whole BMP2K is depleted, but not when the individual isoforms are depleted? There is no mechanism for this observation.

9) Why do BMP2K-S depleted cells exhibit overall reduced endocytosis? Unless I am missing something, I find it hard to use the available data to explain this phenomenon.

10) Figure 4: the images are not of the best quality. I am well aware that cells such K562 cells are not as nice for microscopy studies compared to HeLa cells. However, the images are not really convincing. Because the authors are anyway using GFP-tagged L/S variants of BMP2K, I would suggest that they perform the colocalization studies in HeLa cells or any other cell line that is more suitable for imaging. To simply make the point that BMPK2 isoforms colocalize with Sec16A, HeLa cells should be sufficient. Single planes as well as maximum intensity projections should be shown.

11) It is important that the authors describe the sectioning (how many confocal planes and what section thickness). This is important, because the authors are using 40x objectives with NA1.1 or 1.3 and the information is required to judge the imaging procedure.

12) Figure 5: the authors try to make conclusions about ERES and COPII vesicles. This is absolutely not supported by data. The peripheral elements that the authors call "vesicles" are most certainly ERES. They are far too big to be COPII vesicles. Such vesicles would be maximally 80 nm in diameter, which is unlikely to be detectable using the staining protocols/methods that the authors are using. I see that a 40x objective with an NA of 1.3 was used. In addition, the authors used a point scanning confocal microscope. The quantum efficiency of standard PMT detectors for such microscopes is usually below 50%, making it unlikely to be able to detect vesicles.

13) Figure 5: The only method to determine whether any protein regulates COPII trafficking is to actually measure trafficking (i.e. a budding assay or a RUSH assay). The number of ERES does not necessarily correlate with the extent of trafficking defect. Thus, the conclusion that the authors are making are not supported by the data.

14) The finding that Sec16A depletion stimulates bulk autophagy is a highly surprising and begs for a mechanism.

15) Figure 6: the claim that BMP2K regulates production of COPII vesicles is not supported by the data at all (see comment above).

16) How does BMP2K-S regulate Sec16A protein stability? There is no mechanism. No CHX chase is performed. Is the degradation proteosomal or lysosomal?

17) The claim that BMP2K regulates the trafficking of Sec24B vesicles is not supported by the data.

Reviewer #3:

The manuscript by Miaczynska et al., is extensive study of the roles of two splice variants of BMP2K in erythroid cells (short and long isoforms). The work has strikingly moved the roles of the protein away from the suspected role in endocytosis and into ER to Golgi trafficking and also autophagy. The work initially starts out in mouse fetal liver cells and then moves to a more "simplified" model in K562 erythroleukemic cells. The premise that they go someway to prove is that the 2 BMPK isoforms have opposite functions- which is reinforced by the single knockdown data. The L form promotes COPII assembly and stimulates autophagy and the short form has an inhibitory role. These two processes are essential for erythroid differentiation.

The manuscript is a lengthy one, with knockdown experiments to determine effects of the different isoforms and also proximity labelling studies to identify interaction partners. Followed by lots of knockdown experiments to tease out the role. These data develop a significant case for BMP2K to have an important role in COPII coat formation and potentially autophagy. However, some of the data is extrapolated from a cell line that does not differentiate that well and so is not full proof for such a role in differentiation. This does not negate the worthiness of the article and I still judge it publishable in eLife, just means that the claims that are made need to be reinforced with statements such as this could be explored further in a erythroid differentiation systems or knockout mice experiments. I found the discussion poorly focused and would recommend an additional edit with a tight, organised structure that covers the pertinent points. That other related kinases may also have such a dual function is a nice point to make but perhaps could be made at the end not at the start of the discussion as its speculation. There is also no mention of how the short form could have a inhibitory effect. Do the authors think its because it lacks the c terminus and so competes with the long form?

Essential revisions:

1) The title and aspects of the paper need to remove all mention of COPII trafficking as this reviewer is not convinced this has been investigated directly. COPII formation has been explored here and cargo loading indirectly. No actual trafficking measurements. Sorry picky point.

2) Figure 2; it’s important to note in the text that the secretory pathway is lost during the late stages of differentiation so the drop in BMP2K at the late stages may not have any affect at this point as nearly everything that is not in a reticulocyte is being down regulated and is actively degraded. See for example Satchwell et al., 2013 for the human expression of various secretory components and before that paper there are multiple EM papers which show the pathway disappears. This alteration would not be seen in the K562 system. So the loss of the BMP2K protein expression seen in mice fetal liver and the ratio at the end may not matter. This point impacts on the second panel for schematic in Figure 8. It would be better to focus on abundance of each isoform relative to each other for the part of differentiation that there is a secretory pathway.

3) Where possible L/S ratio should still be calculated and provided when the proteins are depleted. I do think that all the depletion experiments are very repetitive. Could the authors consider some of this data being put in supplemental?

4) As mentioned at the start more in-depth studies of erythropoiesis are needed to fit the model and the suggestions. So instances of over interpretation and extrapolation should have a health warning attached or at least be said but then say this would need to be established in future work.

5) I am loath to add extra work but potential role of BMP2K in erythroid differentiation was studied in K562s induced to differentiate with hemin and this was only carried out when both isoforms where KD simultaneously (Figure 2 and S2). Did the authors conduct a KD separately of either L or S in K562 and if so, what was the effect? What about KD of Sec16? I feel I am missing some key experiments that add evidence in this simpler system. There is also the classic rescue experiment that we are lacking (overexpressing the L and S forms to alter the ration would be possible). Was this tried in K562? Or just overexpressing the isoforms and looking at the effects? Were any of these attempted?

https://doi.org/10.7554/eLife.58504.sa1

Author response

[Editors’ note: the authors resubmitted a revised version of the paper for consideration. What follows is the authors’ response to the first round of review.]

Reviewer #1:

This manuscript from the Miaczynska lab describes potentially important insight into crosstalk between secretion, endocytic and autophagy pathways. Starting from the known endocytosis-associated protein, BMP2K, the authors use a combination of BioID, co-IP, co-localization and knock-down/knock-out studies to probe the multiple cellular pathways that BMP2K participates in. Some of the findings are strong, others less so, but the major concern is that causal links between any of the new effectors are lacking. The findings might better be presented as a focused report that highlights the new interactors and focuses on the most robust findings.

Essential revisions:

1) Overexpression experiments (Figure 1, Figure 2) clearly induce artifactual aggregates/structures. Although the authors are careful not to claim these represent endogenous structures, the findings are still somewhat overinterpreted. To my mind, the only thing these experiments demonstrate is that aggregates of BMP2K-L can sequester/recruit endocytic machinery.

We agree with the reviewer. We believe that the formation of aggregates may reflect some biochemical properties of BMP2K-L. However, as indeed we have too little data for a proper interpretation, we decided to remove all results of BMP2K overexpression in HeLa cells (former Figure 2 and S2) and to focus only on results obtained in K562 cells.

2) The Sec16 co-IP experiment (Figure S2) is problematic: the no-GFP control IP clearly pulls down some BMP2K, raising the concern that the protein is sticky and will bind non-specifically. A GFP pulldown with an unrelated protein is probably a better control.

We thank the reviewer for pointing this out. First, we apologize for the mistake in the initial manuscript, where we named the control samples as no-GFP control (former Figure S2). In fact, we used a control plasmid overexpressing EGFP alone in the EGFP-SEC16A IP experiment in HEK293 cells (now shown in Figure 2B). Second, we have been indeed aware of BMP2K-S being sticky to the agarose beads. The presented analysis involves an already optimized co-IP protocol, which includes washes in high salt concentration to reduce the unspecific binding. Despite that, some unspecific signal is still observed and we admit it in the manuscript. In the revised version, to make sure that our results hold true, we reproduced the co-IP experiment several times and performed quantification from 3 independent repetitions (Figure 2B). This also allowed us to conclude that both BMP2K isoforms, and not only the S variant, may interact with SEC16A.

3) Some claims about co-localization and organelle morphology (Figure 3 and Figure 4D respectively) are difficult for me to see in the images presented. In the case of the Golgi morphology, is it possible that any differences are simply the result of increased ARFGAP? A control experiment overexpressing ARFGAP would address this. This problem highlights the causality issue in many interpretations.

Aiming at giving our manuscript a better focus on the most robust findings as suggested by the reviewer, we removed all data questioned in this point and replaced them with new results that provide more clear-cut information. The main change is that the revised manuscript focuses now on the function of SEC16A rather than of ARFGAP1. We recognize that our data regarding ARFGAP1 are promising but, as we realized thanks to the reviewers comments, they require a separate study.

We removed the analysis regarding ARFGAP1 and Golgi morphology shown in former Figure 4D and replaced them with the quantified IF data regarding SEC16A morphology and the distribution of COPII markers (Figure 3, Figure 3—figure supplement 1). Due to the shifted focus of the manuscript, we did not perform the control experiment overexpressing ARFGAP1 proposed by the reviewer. Instead, as a control experiment we performed depletion of SEC16A (former Figure 5).

On another note, we removed the IF analysis from former Figure 3 because we discovered that the mouse monoclonal antibody used to detect endogenous BMP2K inefficiently recognizes BMP2K-S in microscopy (shown in Figure 2—figure supplement 1), in contrast to immunoblotting where it recognizes both isoforms (see also response to reviewer 2, point 4).

4) I'm not sure exactly what the BFA experiment (Figure 5) tells us. BFA treatment has profound and pleiotropic effects, so again, the causal nature of what happens in these conditions is difficult to understand.

The reviewer is right and we removed the data of BFA experiments from the manuscript. Instead, we present a more detailed analysis of SEC16A function in K562 cells and its modulation by BMP2K-L and -S variants (Figure 3 and Figure 3—figure supplement 1).

Reviewer #2:

The paper reports the characterization of molecular events leading to the transition for erythroid to red blood cells, which are devoid of nucleus as well as many organelles. The notion is that autophagy is activated during this transition leading to the clearance of many of these organelles.

The authors focus on two isoforms of the BMP2 kinase as this kinase appears to be upregulated during this transition.

The manuscript reports the differential localization and role of two isoforms of the, Short (S) and Long (L). BIoID has been performed with these two isoforms that bind different set of markers. When L is overexpressed in HeLa, it is found in aggregates and interacts with components of the endocytic machinery (that also localized in these aggregates) in line with the BioID. Conversely, S is more around or at the early secretory pathway and interact with ARFGAP and Sec16A.

The manuscript mostly focuses on S and Sec16A presented as a key player in autophagy.

They use two techniques. siRNA and CRISPR KO. shRNA of S revealed that Sec16A level is severely reduced but CRISPR KO does not reproduce any of this.

Taken together, the authors show that BMP2K is upregulated during the transition mentioned above yet it restricts autophagy. Furthermore, the reviewer is left with the notion that Sec16 is a negative regulator of autophagy and that BMP2K restricts autophagy, even though this kinase is upregulated during the transition and it is argued that autophagy should be stimulated.

At that stage, the manuscript is confusing and not publishable.

Essential revisions:

1) Sec16 has not been shown to be a positive player in autophagy. The paper Kundu, 2016 needs to be carefully read. Sec16 is phosphorylated by ULK1 but in basal conditions. In yeast, it indeed has been shown to be an autophagic player but this has not been confirmed in mammalian cells.

So Instead of presenting Sec16 as an established autophagic player, the authors should genuinely review all the evidences suggesting that it might be, and show that it is.

Furthermore, reading through the manuscript, the reviewer became increasingly confused as to whether the authors think/show that it is a positive or a negative factor for autophagy. This confusion therefore makes the reviewer weary of the title.

We are grateful to the reviewer for this insightful comment. Not to rely on unconfirmed assumptions regarding the role of SEC16A, we performed additional experiments to address the involvement of SEC16A in basal autophagy of K562 cells (Former Figure 5D-G). By shRNA and CRISPR/Cas9-mediated gene silencing we find that SEC16A is not required for basal autophagic degradation in these cells. On the contrary, we observed elevated autophagic flux in the absence of this protein. This discovery greatly impacted the interpretation of our further results. Namely, we found that in K562 cells, SEC16A is required for the production of juxtanuclear COPII vesicles but not of COPII assemblies dispersed outside of the juxtanuclear compartment (Figure 3D-E). Conversely, the absence of SEC16A increases recruitment of SEC31A to the dispersed structures. This suggests that SEC16A could inhibit COPII outer cage formation as demonstrated so far only for yeast Sec16. Importantly, we further show that SEC31A recruitment at SEC16A-positive ERES is regulated by BMP2K variants (Figure 3C-E, Figure 3—figure supplement 1).

The Abstract is also confusing. What does functional cross talk with Sec16A mean?

We removed the confusing sentence about functional cross talk with SEC16A from the abstract (and references to it elsewhere in the text) and replaced it with more precise conclusions regarding the role of BMP2K-L and -S in the regulation of SEC16A-dependent functions.

2) I would disagree that the role of the early secretory pathway to autophagosome formation is still cloudy and badly understood. It is clearer and clearer especially since the publication of the article from Jeong, Cuervo and Pagano showing the switch from Sec23B being degraded in basal conditions to forming a "specific" coat for COPII vesicles dedicated to fuel the growth of the nascent autophagome. In this regard, why are Sec24 and Sec23 not investigated in relation to S instead of Sec16 especially since Sec24 appears to be an interactor of this kinase. Sec24 level should be monitored.

We now provided more accurate information in the introduction section and analyzed SEC24B protein levels (Figure 3A) as well as its intracellular localization (Figure 3—figure supplement 1) in the absence of either of the BMP2K variants. The levels of SEC24B are largely unaffected, however the intracellular distribution of SEC24B is altered upon BMP2K-L or BMP2K-S depletion due to their effects on SEC16A-dependent trafficking.

3) In relation to this, what happens to general trafficking out of the ER through the secretory pathway upon manipulation of the 2 kinases isoforms (Oe, si RNA and CRISPR). This is not shown or even mentioned.

With respect to this valid point, we included new pieces of data showing the effects of depleting BMP2K variants on COPII distribution and the amount of SEC31A recruited to COPII structures (Figure 3C-E, Figure 3—figure supplement 1). We observe that both kinases markedly affect COPII production but in an opposite manner. BMP2K-L promotes while S restricts generation of COPII vesicles. Specifically, depletion of BMP2K-S leads to accumulation of SEC31A on SEC24B-positive COPII assemblies in a manner proportional to the amount of BMP2K-L left in the cell. Hence, cells lacking all BMP2K variants but with preserved high L/S ratio show moderately elevated COPII production.

Following the reviewers suggestion to provide a more focused manuscript, we decided to elaborate the role of BMP2K variants in autophagy. Thus, we did not analyze secretion of any model cargo. However, we observed changes in Tf receptor abundance on the plasma membrane (Figure 3D, open bars) that may result from altered COPII-mediated trafficking of Tf receptors, which we comment on in the Discussion section.

During the revision of our manuscript, we have been made aware of a report which provides additional rationale to address the role of BMP2K in autophagy. While studying an unrelated subject, Potts et al., 2013 fished out BMP2K as a putative regulator of autophagy and possibly mitophagy, also in erythroid cells. However, this study did not consider BMP2K as a putative membrane trafficking regulator or report its mechanisms of action. The involvement of particular BMP2K splicing variants was also not addressed. Potts et al. found BMP2K to potentially stimulate LC3-dependent autophagy. Extending this finding we show that it is the BMP2K-L variant that stimulates autophagy but in a manner counteracted by BMP2K-S. We further propose that this regulation may involve SEC16A-dependent COPII trafficking.

4) The co-localisation between S and Sec 16 is not convincing. Granted, some S is present at the compartments of the early secretory pathway upon OE in HeLa cells (Figure 2B). In the K562 cells, the cytoplasm is very small and would be cramped with most of the organelles. The reviewer doubts the colocalition is real even though the use of a relevant cell line is laudable.

We agree with the reviewer that in cells with small cytoplasm, such as K562, the organelles are so crowded that the observed colocalization may not reflect actual interaction of proteins. Nevertheless, what can be clearly distinguished is whether a given protein is enriched in particular cell regions, such as the plasma membrane region or the juxtanuclear region. Being aware that the analysis of overexpressed EGFP-tagged proteins does not allow drawing firm conclusions about protein associations, we use it only to complement the data from the BioID analysis. In the revised manuscript we show that we cannot rely on the monoclonal anti-BMP2K antibody in the IF analysis (Figure 2—figure supplement 2A,B), thus we removed such data from former Figure 3. The analysis of intracellular distribution of EGFP-tagged proteins overexpressed in K562 cells (Figure 2B and Figure 2—figure supplement 2C) is consistent with the co-IP with SEC16A in HEK293 cells (Figure 2B), that not only BMP2K-S but also BMP2K-L may have functions related to early secretory pathway. In agreement with this, we further show that indeed both variants regulate SEC16A function.

Also, puzzling is that overexpressed S co-immunoprecipitates with overexpressed GFP-Sec16 in HeLa cells. However, in the erythroid cell line K562, endogenous S does not co-precipitate Sec16 and Sec16 does not co-precipitate S.

We would like to clarify that in the previous manuscript we did not show data or claim in the text that endogenous BMP2K-S does not co-precipitate SEC16A and vice versa.

We agree with the reviewer about the importance of co-immunoprecipitation between the endogenous proteins as an approach confirming that interactions occur in the cell type of interest. However, this method is limited by the availability of antibodies. Both anti-BMP2K and anti-SEC16A antibodies are not suitable for efficient immunoprecipitation of endogenous proteins. Although we cannot confirm a physical interaction between BMP2K variants and SEC16A in K562 cells, we show a functional interaction, wherein both L and S BMP2K variants regulate SEC16A-dependent COPII production. Collectively, given (a) the detection of SEC16A as a protein proximal to BMP2K-S in BioID, (b) positive validation by co-IP in HEK293 cells and colocalization of EGFP-BMP2K variants in K562 cells as well as (c) the functional interaction, it is very likely that at least one BMP2K isoform interacts directly with SEC16A.

5) However, it is not uncommon for a kinase to not localize near its substrate since binding is transient. Therefore, the emphasis should be on showing that Sec16 is phosphorylated by this kinase. Is the site known or can it be mapped? Is it conserved in species that do not have red blood cell?

This is a very valid comment, which we wished to address. As we show in the Author response image 1, human SEC16A contains a Thr1045 residue, whose surrounding amino acid sequence is similar to the sites in μ2 and NUMB described as phosphorylated by AAK1 (Figure for the reviewers, panel A). This threonine is preceded by a sequence that matches a consensus for this family of kinases (Sorensen and Conner, 2008), namely φXXQXT (where φ is a hydrophobic residue and X is any amino acid). This putative phosphorylation site is highly conserved among vertebrates (Author response image 1 panel B) and we could not find a similar motif in the Sec16 sequences of D. melanogaster, C. elegans or S. cerevisiae (not shown). Hence, this site is not present in organisms that do not produce red blood cells.

We performed a preliminary analysis to test whether the changes in SEC16A protein levels observed by us upon depletion of BMP2K variants could result from altered phosphorylation by BMP2K. To this end we treated K562 cells with a pharmacological inhibitor of AAK1 and BMP2K (LP935509). It efficiently inhibited μ2 phosphorylation (Author response image 1 panel C), that as we show in our manuscript, is controlled primarily by BMP2K-L in K562 cells. Interestingly, this compound modestly upregulated SEC16A levels similarly to depletion of BMP2K-L (Author response image 1 panel C). This suggests that elevated SEC16A levels due to BMP2K-L depletion could result from reduced phosphorylation of SEC16A by BMP2K-L.

To test this, we mutated the T1045 site to alanine (TA) or glutamic acid (TE) and overexpressed the EGFP-tagged constructs in K562 cells (Figure Author response image 1 panel D-E). We observed that similarly to endogenous SEC16A, the overexpressed WT EGFP-SEC16A was upregulated upon shBMP2K-L and upon the LP inhibitor treatment. The same occurred for the TA mutant, however this upregulation did not occur for the TE mutant (Author response image 1 panel D-E). No upregulation of the TE mutant is a promising result, however the fact that levels of the TA mutant are regulated in the same way as those of WT does not allow drawing final conclusions from this experiment. It is however possible that the presence of a relatively big EGFP tag interferes with this analysis. We believe that very likely at least one of BMP2K variants phosphorylates SEC16A on T1045, however proving this properly will require a lot of time and substantial effort which we wish to devote in a follow-up study. We anticipate a complex scenario where BMP2K-L transiently interacts with SEC16A and phosphorylates T1045, while BMP2K-S stably binds SEC16A and alters either phosphorylation itself or the functional outcome of T1045 phosphorylation.

Author response image 1
(A) Graphical comparison of amino acid sequences adjacent to Thr156 in μ2 and Thr102 in NUMB (both known to be phosphorylated in human cells by AAK1, a BMP2K homologue) and Thr1045 in SEC16A, that we identify as a candidate BMP2K phosphorylation site.

The color code indicates that two upstream residues of SEC16A Thr1045 are identical to the respective residues in μ2, while two downstream amino acids are identical to those in NUMB. (B) Alignment of ~60 amino acids surrounding Thr1045 in human SEC16A and in its homologues from selected vertebrates. Green color indicates residues shown in A, grey color indicates a hydrophobic residue (φ) five amino acids upstream of the putative phosphorylation site. (C) Western blots showing the effect of increasing concentrations of LP935509, AAK1/BMP2K inhibitor, on the levels of endogenous SEC16A and phosphorylated μ2 in K562 cells. (D) Western blots showing the effects of control shRNA (Ctr), shBMP2K-L (L) or shBMP2K-S (S) on the levels of ectopically expressed EGFP-SEC16A either WT or with Thr1045 mutated to Ala (TA) or Glu (TE) in K562 cells. (E) Western blots showing the effects of the LP inhibitor on the levels of ectopically expressed WT or mutant EGFP-SEC16A in K562 cells.

6) the difference between shRNA and CRISPR KO is puzzling (to a certain extent) but removing Sec16 for BMP2K KO cells does not clarify the situation and leads to a mechanism ( see below point 11.3 and 13). Either the shRNA has off targets and should not be used. Or Sec16 is not the right mechanism to focus upon.

We agree that removing both SEC16A and BMP2K using the CRISPR/Cas9 approach is not suitable to clarify the interplay between SEC16A and BMP2K variants. As we observed that induction of erythroid differentiation is associated with reduced levels of SEC16A, there is no good rationale for co-depleting this protein together with BMP2K. We removed these data from the manuscript.

7) The conclusion of the manuscript is that the two isoforms have antagonistic effects on the regulation of autophagy. S appears to inhibit it while L appears to activate it but overall, the enzyme restrict autophagy. Yet, both isoforms are upregulated in mouse fetal liver (so during the transition that is studied). How this make sense in a situation where autophagy should be stimulated to remove organelles from red blood cell cytoplasm?

Inspired by this very relevant comment, we investigated in more detail the changes in protein levels of the two variants during mouse erythroblast differentiation. In addition to analyzing various differentiation time points (Figure 1A-B and Figure 1—figure supplement 3A), we assessed variant abundances in cells at particular differentiation stages, isolated by FACS (Figure 1C-D). We observe that although initially upregulated, the levels of both variants are reduced in late differentiation stages (erythroid maturation). Moreover, erythroid maturation is associated with increasing abundance of L over S (i.e. increasing L/S ratio) even at final stages. We validated these findings in K562 cells (former Figure 2) where depletion of all variants by shRNA (strongly promoting erythroid differentiation) is characterized by a strong increase in the L/S ratio while their depletion by CRISPR/Cas9 (modestly promoting differentiation) is associated with a modest increase in the L/S ratio. We further show that the two variants constitute the BMP2K-L/S regulatory system, wherein BMP2K-L promotes while BMP2K-S inhibits the intracellular processes important for erythroid differentiation, such as COPII trafficking (Figure 3, Figure 3—figure supplement 1) and autophagy (Figure 4D-F).

As we write in the Discussion section, our interpretation is that BMP2K-L is upregulated during erythropoiesis to promote erythroid maturation, while BMP2K-S inhibits this function (possibly as a negative feedback regulator). Therefore, at later stages of differentiation, upon reducing BMP2K-S levels below a certain threshold, BMP2K-L can exert its pro-maturation effects. However, as these are splicing variants, they should be (and appear to be) co-regulated on the transcriptional level, hence co-reduced upon maturation. We believe that the L/S ratio must be fine-tuned by additional mechanisms, which remain to be addressed. This fine-tuning may possibly allow adapting the erythropoiesis rate to altered demand for red blood cell production.

8) The manuscript is complicated by the fact that it reports data on the endocytic markers that are hardly part of the story line and do not contribute to the clarity of the presentation. I would advise to remove the L part of the story with endocytosis and makes another article with it.

We thank the reviewer for this suggestion. As the revised version is indeed more focused on the regulation of SEC16A function by BMP2K variants, for the purpose of clarity, we removed the analysis of endocytic markers in HeLa and HEK293 cells. However, we still show the involvement of BMP2K variants in endocytosis in K562 cells as a starting point in our analysis, before addressing other intracellular pathways (Former Figure 2G-H). Although based on literature data and our results, BMP2K is clearly an endocytic kinase we show that the role of its variants in regulation of endocytosis cannot explain their involvement in erythroid differentiation. We did not find evidence that the two variants would regulate endocytosis in an opposite manner as we did uncover for COPII trafficking and autophagy.

Although we recognize that the story-line would be more straightforward if focused only on one BMP2K variant, our data clearly show that both variants regulate SEC16A-dependent processes. In addition, as we find that BMP2K-S inhibits BMP2K-L-activated processes it is impossible to properly study one isoform in isolation from the other.

Reviewer #3:

[…] A few issues need to be addressed in revision to support the interpretations of the data:

1) The initial cellular localization data shows that the two splice variants are localized differently, but quantification of overlap with the markers studied should be included for Figure 2-all panels.

Please find our response below, along with point 2.

2) The data in Figure S2C is much more convincing than the data in Figure 2C and D as an argument that mu2 phosphorylation is influenced by the L form. This should be included in the main figure.

Both suggestions in (1) and (2) are absolutely right. However, to deliver a more focused message of the revised and restructured manuscript we decided to remove the data obtained in HeLa cells (former Figure 1B-C, and 2) and in HEK293 cells (former Figure S2C). Although they validate the results of the BioID analysis, they do not help to understand the role of BMP2K variants in the erythroid lineage.

3) It is clear that the downregulation of the different splice variants have different effects on distribution of secretory pathway markers (Figure 4D), but again quantification of co-localization changes should be provided.

The results in the former Figure 4D relate to ARFGAP1. In the revised version we decided to focus on SEC16A and COPII trafficking and for the sake of brevity we left out all data concerning an interesting link between BMP2K and ARFGAP1, to be elaborated in a follow-up study. Hence, these results have been replaced with analyses that focus on SEC16A function (Figure 3, Figure 3—figure supplement 1B,D), to which we have provided proper quantification, as requested by the reviewer.

4) There is some concern that the Tf uptake assay is not really measuring CME because there is no washing step after Tf binding (or at least this was not stated in the methods). So it seems that the 5 minute and the 40 minute time points both represent uptake of Tf that would be a combination of CME and bulk uptake. It has been reported that where CME is downregulated, bulk endocytosis is increased (eg with dynamin mutants), so both Tf and dextran uptake can increase together in these circumstances. Thus, it is not possible to conclude that BMP2K is a negative regulator of both types of endocytosis. Bulk uptake of both could increase because it is a positive regulator that is then removed. This doesn't change the story that both endocytosis and autophagy are mediated by the BMPK2 splice variants, but it would change the authors' discussion of how BMPK2 regulates the CME pathway.

We appreciate this insightful and very helpful comment. Indeed, in the previous version of the manuscript we showed only continuous Tf uptake which may not reflect the regulation of CME. In the revised manuscript we include analysis of the pulse chase Tf uptake that, as suggested by the reviewer, involves a washing step after Tf binding (former Figure 3D-E). As we wished to put more focus on possible differential functions of the two BMP2K variants, we performed this assay not only in cells lacking all BMP2K variants (shBMP2K), but also for isoform-specific depletions, shBMP2K-L and shBMP2K-S. This allowed us (a) to discover that among the two variants it is BMP2K-L that promotes Tf CME efficiency, (b) to find that BMP2K variants may regulate Tf receptor delivery to the plasma membrane, and (c) to conclude that regulation of Tf endocytosis could not explain the role of BMP2K variants in erythroid differentiation.

In addition, following the reviewer’s suggestion, we mention the possibility of BMP2K variants regulating bulk endocytosis in the Discussion section.

[Editors’ note: what follows is the authors’ response to the second round of review.]

[…] One suggested revision plan:

Figure 1. A condensed composite of current Figures1 and Figure 2 showing BMPK2 for the developmental trajectory and erythroid cell lines, and the relevance for erythroid differentiation. Here, the relevant comments of reviewers 2 and 3 should be taken into consideration.

(The mu-2 phosphorylation and endocytosis effects should be supplemental or omitted since causality here cannot be demonstrated. This aspect seems to be a side-line and disrupts the narrative flow and focus.)

Figure 2. Current Figure 4, showing mass spectrometry data and colocalization experiments (Eps15 as supplement). Again, note the technical concerns of reviewer 2 with respect to microscopy.

Figure 3. Effects of S and L forms on ERES (central versus peripheral), but tone down the interpretation on secretion unless experiments can be shown that quantify such an effect. Links to autophagy.

Figure 4. Link Sec16 data back to erythroid differentiation. Here, any additional data that support the function of autophagy vs. secretion switches in erythroid differentiation would be most helpful: S/L effects and Sec16 KD effects on erythroid differentiation.

We would like to thank the Senior Editor, the Reviewing Editor and the peer reviewers for providing us with a clear path towards publication of our study and their constructive comments.

Following the editorial decision and instructions we have streamlined the manuscript to fit it to the Short Report format. We have removed or shortened parts that disturbed the flow of logic and have narrowed down the story to four main figures, as outlined by the editors. We have also corrected the quality of some western blotting or immunofluorescence images as requested by the reviewers. The part regarding the effects of BMP2K gene silencing on endocytosis has been shortened and presented in the supplement. The description of potential differences between the two BMP2K splicing variants in regulation of μ2 phosphorylation or endocytosis has been omitted. Instead, as requested by the reviewers, we have added new results showing the effects of depleting single variants (L or S) on erythroid differentiation of K562 cells. We have also analyzed the effect of SEC16A depletion on differentiation (see Author response image 2). However, the results of this analysis are difficult to interpret (see response to reviewer #1 point 5 and reviewer #3 point 5). Considering this and the fact that our surprising findings on the role of SEC16A in regulation of autophagy require further mechanistic explanation (as pointed out by reviewer #2), we have not included the data on SEC16A depletion in the current manuscript. We plan to use these results as a starting point for the follow-up study. Finally, we have toned down far-reaching conclusions indicated by the reviewers and have pointed out which aspects of the study require further investigation. The title of the resubmitted report is "Splicing variation of BMP2K balances abundance of COPII assemblies and autophagic degradation in erythroid cells".

Reviewer #1:

This manuscript investigates the role of BMPK2 splice isoforms in erythroid precursor cells, dissecting the role of the short and long forms in modulating endocytosis, exocytosis and autophagy. The data are of high quality, but the ms suffers from overinterpretation and the flow of logic could be vastly improved.

Specific concerns for discussion:

1) The relevance of the L/S ration in KO/KD experimetns versus simple abundance of either isoform isn't substantiated (Figure 2) so should be toned down with respect to causality.

In the revised report, we have toned down our interpretation and conclusions (Results section).

2) Similarly, causality in regard to Tf internalization, mu-2 phosphorylation and erythroid development is not clear from the experiments, which makes conclusions difficult to draw. This section should be consolidated and simplified to spell out: observed effects are difficult to dissect because of changes in TfR abundance at the cell surface.

As requested, we have consolidated and simplified this section. The results on Tf internalization are now presented in the supplement (Figure 1—figure supplement 3).

3) There are many situations where the findings are overstated (eg. Results section). In each case, the authors claim to have demonstrated regulation or control over COPII trafficking, when in reality all they have demonstrated is changes in abundance and different intracellular structures. In the absence of some measure of impact on secretion per se, this should be toned down.

In the revised report, we have toned down all conclusions related to COPII trafficking and we have commented that they require further verification (Results section).

4) Related to this problem of overstating conclusions, it's very muddy in the narrative as presented what the different COPII-positive structures represent (ERES vs autophagic sites) and how the different splice KDs impact these. Being more clear up front about what the model is would help with the flow of logic.

We have been more precise in describing the results concerning the different COPII-positive structures. Our data show a correlation between increased SEC31A abundance on dispersed COPII assemblies and autophagy or erythroid differentiation. To our knowledge, COPII structures outside of the juxtanuclear secretory compartment have not been studied before. We have pointed out in the Results section and discussion section that whether and how these structures are related to autophagy and/or differentiation requires further investigation.

5) This would require some experimentation, but the over-riding question I had at the end was what impact the splice-specific and Sec16 KD had on erythroid differentiation. This seems to be a major conclusion that the authors want to make but the data were not there? I ended up making myself a table of the different findings to put it all together. This is something that would make the ms easier to follow.

We have included new data showing that depletion of BMP2K-L partially impairs, while depletion of BMP2K-S to some extent promotes erythroid differentiation (Figure 4D,E). We have also analyzed the effect of shRNA-mediated SEC16A depletion (Author response image 2 panel A) on erythroid differentiation of K562 cells, however these data are difficult to interpret. shSEC16A#1 strongly elevates hemoglobin production under both basal and hemin-stimulated conditions, while shSEC16A#2 impairs hemoglobin production upon hemin (Author response image 2 panel B). Neither of these effects is associated with consistent changes in the expression of erythroid markers (Author response image 2 panel C). We believe that BMP2K variants might affect SEC16A involvement in differentiation by altering its function (possibly via phosphorylation) rather than by regulating its levels, that remains to be addressed in the future. As we also write in response to point 14 of reviewer #2, we have removed the data regarding the effect of SEC16A depletion on COPII abundance and autophagy. This part would make the manuscript too long for the Short Report format and, as pointed out by reviewer #2, contains surprising results that need to be substantiated by mechanistic evidence. We plan to address this in a follow-up paper for which the removed parts will be a starting point.

Author response image 2
(A) Representative western blot showing the efficiency of SEC16A depletion using two single shRNAs.

(B) Percentage of benzidine-positive control K562 cells or cells depleted of SEC16A, under basal growth conditions or after stimulation for 48 h with 20 μM hemin (n=4 for basal or n=3 for hemin +/- SEM). (C) Fold changes in mRNA levels of the indicated erythroid markers in control cells or in cells depleted of SEC16A (n=3 +/- SEM).

Reviewer #2:

The manuscript by Cendrowski et al. studied the role of two isoforms of BMP2K and their differential effects on endocytosis, COPII trafficking and autophagy. They propose a model in which the differential biologic roles and expression of these two isoforms regulates erythroid maturation.

I noticed that this manuscript is a re-submission to eLife, but I see this work now for the first time. I assessed it independently of this, but had a look at how the authors had responded to the previous comments.

Overall, the topic of the study is highly interesting and the model the authors are proposing is intriguing. However, I was not convinced by many of the data and don't think that they support the claims of the authors. Too many interesting observations were made, that lack a mechanistic foundation, which strongly limits the impact of the work. In my view, this manuscript is not suitable for eLife.

Below are my main comments/concerns that are a technical as well as conceptual in nature.

1) Figure 1A,B: The blot shown does not really reflect the quantification. The problem is that the blot is a bit overexposed, making it hard to judge the bands properly.

In the revised report we present less exposed blots in Figure 1A that better reflect the quantification shown in Figure 1B.

2) Figure 1D: I agree that the L/S ratio changes, but both isoforms follow the same pattern, i.e. the increase from R0 to R3 and then drop in R5. Some changes in ratio are not detectable in the representative blot. For instance, the ratio at R1 and R5 is almost identical, yet the authors claim that there is a 2fold difference. Again, a better match between quantitation and representative blot is required to support the claim.

We thank the reviewer for pointing this out. For the revised manuscript, we have performed additional biological repeats of the analysis shown in Figure 1D (now n=5). This is a technically difficult experiment as it requires FACS-based isolation of 6 distinct populations from primary cells stimulated in vitro. Despite high variability between biological repeats, we managed to obtain more reliable results shown in the western blot that matches the densitometric quantification. Thanks to this, we could specify that the highest L/S ratio in these cultures is observed in the R3 population (>2) but is still high (~2) in R4 and R5.

3) Figure 2: I agree that in panel B, the L/S ration in K562 cells is different. However, in panel A, the ratio is essential 1. The fact that this is "overexposed" as the authors state, is not sufficient to explain this discrepancy.

We have provided a better blot now shown in current Figure 1E.

4) Figure 2C: Is the CRISPR-knockout incomplete, or are the remaining bands non-specific?

The authors have not commented on this.

Within the time-frame of our analysis, the CRISPR/Cas9 approach in K562 cells does not lead to complete BMP2K knock-out although it efficiently reduces the levels of both variants (shown in Figure 1—figure supplement 1C). We have pointed this out in the Results section.

5) Conceptually: if you knockout BMP2K (i.e. the levels are 0), how can there be a ratio of any isoform of this gene. A ratio is only measurable if the knockout is not complete. Regardless of this conceptual problem, I don't think that L/S ratio is different between control and gRNA cells.

Indeed, as pointed out above, the knockout is not complete. To assess the L/S ratio we have performed quantification of multiple biological repetitions (n=5) of CRISPR/Cas9-mediated BMP2K depletion and we have obtained highly significant increase of the L/S ratio with respect to control cells. Moreover, we have provided a better western blot (short and long exposures) in the Figure 1—figure supplement 1C.

As compared to other cell types, cell of the erythroid lineage and K562 cells contain very high levels of BMP2K protein variants. It is thus possible that even upon efficient depletion, the remaining levels of either of the variants are high enough to affect erythroid differentiation.

6) Figure 2: What sequence is the shRNA targeting? It is strange that the L/S ratio would change if the shRNA would target a sequence common to both isoforms. There is no explanation for this.

The shRNA is targeting a sequence encoding part of the kinase domain, present in both variants. In current Supplementary file 1—table 3, we have provided the information regarding locations of target nucleotide sequences of shRNAs used in our study.

As we now write in the Results section, we have no clear explanation for changing L/S ratio upon shRNA. However, there are several possible explanations for this, including: (a) BMP2K-L protein could be more stable than BMP2K-S, (b) mRNA of BMP2K-L could be more abundant than that of -S and therefore more difficult to remove by RNAi, (c) mRNA for BMP2K-L could be located in a different cellular compartment (potentially due to local translation or mRNA transport) where it could be less accessible for shRNA. In order to keep the new report version concise, we did not include these speculations in the manuscript.

7) Figure 2H: Is the effect of g#1 really biologically significant? The difference in endocytosis of Tf or dextrane is less than 5%.

We agree with the reviewer that this effect of gBMP2K#1 is very weak, although it is one of several results showing the same tendency. Actually, such a weak effect fits with our general view that upregulated endocytosis upon BMP2K depletion does not induce erythroid differentiation but could rather be a secondary effect of induced differentiation.

8) Figure 3: Why does the total level of TFRC increase when the whole BMP2K is depleted, but not when the individual isoforms are depleted? There is no mechanism for this observation.

To improve the flow of logic, in the new report version, we have removed the results showing effects of BMP2K-L or -S depletion on total and cell surface abundance of TFRC.

9) Why do BMP2K-S depleted cells exhibit overall reduced endocytosis? Unless I am missing something, I find it hard to use the available data to explain this phenomenon.

We have shortened the description of results regarding TFRC levels and endocytosis and toned down our conclusions (subsection “The role of BMP2K in CME does not explain its involvement in erythroid differentiation”). The only conclusion that we now make is that the role of BMP2K variants in regulation of endocytosis cannot explain their involvement in erythroid differentiation.

10) Figure 4: the images are not of the best quality. I am well aware that cells such K562 cells are not as nice for microscopy studies compared to HeLa cells. However, the images are not really convincing. Because the authors are anyway using GFP-tagged L/S variants of BMP2K, I would suggest that they perform the colocalization studies in HeLa cells or any other cell line that is more suitable for imaging. To simply make the point that BMPK2 isoforms colocalize with Sec16A, HeLa cells should be sufficient. Single planes as well as maximum intensity projections should be shown.

We apologize for insufficient quality of pictures in the former Figure 4. Now we show better images in the current Figure 2C (more representative cells were chosen and improved imaging conditions were applied). In the initially submitted manuscript, we had provided immunofluorescence data in HeLa cells but the former reviewers advised us to remove these results, as ectopic expression of EGFP-BMP2K-L in HeLa led to formation of big aggregates, likely artifacts of overexpression. In addition, the analysis in yet another cell line disrupted the flow of logic of the manuscript. Therefore, we had been advised to show only immunofluorescence in K562 cells.

On a technical note, we performed the staining procedure in suspension and stained cells were immobilized on the microscopy plates in agarose. As a result, the imaged cells were not exactly at the same z-position. Therefore, single stacks were not suitable for analysis. As we have shortened the manuscript to the Short Report format there is no space for showing both single stack and projection images.

11) It is important that the authors describe the sectioning (how many confocal planes and what section thickness). This is important, because the authors are using 40x objectives with NA1.1 or 1.3 and the information is required to judge the imaging procedure.

For the confocal microcopy experiments, shown in current Figure 2C, Figure 2—figure supplement 2A, Figure 3C, and Figure 3—figure supplement 1C, we captured images from 7-8 sections with 1 μm interval in the z axis. This information is also included in the Materials and methods section.

12) Figure 5: the authors try to make conclusions about ERES and COPII vesicles. This is absolutely not supported by data. The peripheral elements that the authors call "vesicles" are most certainly ERES. They are far too big to be COPII vesicles. Such vesicles would be maximally 80 nm in diameter, which is unlikely to be detectable using the staining protocols/methods that the authors are using. I see that a 40x objective with an NA of 1.3 was used. In addition, the authors used a point scanning confocal microscope. The quantum efficiency of standard PMT detectors for such microscopes is usually below 50%, making it unlikely to be able to detect vesicles.

We agree with the reviewer and in the revised version we have refrained from calling the detected structures as “vesicles”. Instead we state in the Title, Abstract, and Results section that we observe effects on the distribution and abundance of COPII assemblies.

13) Figure 5: The only method to determine whether any protein regulates COPII trafficking is to actually measure trafficking (i.e. a budding assay or a RUSH assay). The number of ERES does not necessarily correlate with the extent of trafficking defect. Thus, the conclusion that the authors are making are not supported by the data.

We thank the reviewer for pointing this out. In the revised manuscript, we refrain from concluding that COPII trafficking is regulated. We only mention that whether BMP2K variants regulate COPII trafficking requires further investigation subsection “The BMP2K-L/-S system regulates abundance and distribution of COPII assemblies”).

14) The finding that Sec16A depletion stimulates bulk autophagy is a highly surprising and begs for a mechanism.

As we also write in the response to point 5 of reviewer #1, we have removed the data regarding depletion of SEC16A. We agree that such a surprising result requires investigation of an underlying mechanism, that we wish to perform in a follow-up study.

15) Figure 6: the claim that BMP2K regulates production of COPII vesicles is not supported by the data at all (see comment above).

We thank the reviewer for pointing this out. In the revised manuscript, we conclude that BMP2K variants regulate the abundance and distribution of COPII assemblies (page 9).

16) How does BMP2K-S regulate Sec16A protein stability? There is no mechanism. No CHX chase is performed. Is the degradation proteosomal or lysosomal?

These are very important questions that we have not addressed yet. We wish to focus on them in the follow-up study.

17) The claim that BMP2K regulates the trafficking of Sec24B vesicles is not supported by the data.

We agree with the reviewer. In the revised manuscript we use SEC24B only as a marker of COPII assemblies and the trafficking of SEC24B-positive vesicles is not addressed or mentioned in the text.

Reviewer #3:

The manuscript by Miaczynska et al., is extensive study of the roles of two splice variants of BMP2K in erythroid cells (short and long isoforms). The work has strikingly moved the roles of the protein away from the suspected role in endocytosis and into ER to Golgi trafficking and also autophagy. The work initially starts out in mouse fetal liver cells and then moves to a more "simplified" model in K562 erythroleukemic cells. The premise that they go someway to prove is that the 2 BMPK isoforms have opposite functions- which is reinforced by the single knockdown data. The L form promotes COPII assembly and stimulates autophagy and the short form has an inhibitory role. These two processes are essential for erythroid differentiation.

The manuscript is a lengthy one, with knockdown experiments to determine effects of the different isoforms and also proximity labelling studies to identify interaction partners. Followed by lots of knockdown experiments to tease out the role. These data develop a significant case for BMP2K to have an important role in COPII coat formation and potentially autophagy. However, some of the data is extrapolated from a cell line that does not differentiate that well and so is not full proof for such a role in differentiation. This does not negate the worthiness of the article and I still judge it publishable in eLife, just means that the claims that are made need to be reinforced with statements such as this could be explored further in a erythroid differentiation systems or knockout mice experiments. I found the discussion poorly focused and would recommend an additional edit with a tight, organised structure that covers the pertinent points. That other related kinases may also have such a dual function is a nice point to make but perhaps could be made at the end not at the start of the discussion as its speculation. There is also no mention of how the short form could have a inhibitory effect. Do the authors think its because it lacks the c terminus and so competes with the long form?

We thank the reviewer for these constructive comments. We have shortened and refocused the Discussion section, as suggested.

Regarding a possible mechanism by which BMP2K-S could have an inhibitory effect, it might involve some kind of competition between the two variants. However, as both variants have the kinase domain, the mechanism is likely more complex. As found in a high throughput proteomic study, SEC16A might interact with AP-2 and clathrin proteins (Hein et al., 2015). BMP2K-L has multiple AP-2 and clathrin binding sites in its C-terminus, absent from BMP2K-S. Therefore, association with CME proteins could possibly affect the functional interaction between BMP2K variants and SEC16A. However, to fit the short rShort Report format we have not included these speculations in the manuscript text.

Essential revisions:

1) The title and aspects of the paper need to remove all mention of COPII trafficking as this reviewer is not convinced this has been investigated directly. COPII formation has been explored here and cargo loading indirectly. No actual trafficking measurements. Sorry picky point.

As requested by the reviewer, we have removed any references to COPII trafficking from the manuscript title, Abstract, subtitles and conclusions. We only mention that whether BMP2K variants regulate COPII trafficking requires further investigation (subsection “The BMP2K-L/-S system regulates abundance and distribution of COPII assemblies”).

2) Figure 2; it’s important to note in the text that the secretory pathway is lost during the late stages of differentiation so the drop in BMP2K at the late stages may not have any affect at this point as nearly everything that is not in a reticulocyte is being down regulated and is actively degraded. See for example Satchwell et al., 2013 for the human expression of various secretory components and before that paper there are multiple EM papers which show the pathway disappears. This alteration would not be seen in the K562 system. So the loss of the BMP2K protein expression seen in mice fetal liver and the ratio at the end may not matter. This point impacts on the second panel for schematic in Figure 8. It would be better to focus on abundance of each isoform relative to each other for the part of differentiation that there is a secretory pathway.

We have added the information about loss of the secretory pathway during the late stages of differentiation in the introduction of the revised manuscript, citing the relevant references. The reviewer’s comment touches upon a very interesting issue. On the one hand, the secretory pathway is required for rearrangement of PM of maturing erythroblasts and on the other it is eventually lost in reticulocytes. As described, among consecutive stages of mouse fetal liver erythroblast differentiation, reticulocytes are in the last, R5 stage (Zhang et al., 2003). We observe an increase in the L/S ratio already in earlier stages, being the highest in R3 when cells start to expose erythroid-specific markers (such as Ter-119) on their surfaces. Hence, BMP2K levels and the L/S ratio are high upon transition that would require activation of erythroid-specific secretion. Moreover, BMP2K levels are reduced with the high L/S ratio when cells begin to terminally differentiate (R4-R5), at the time of loss of the COPII machinery. We have briefly commented on this in the Discussion section of the revised manuscript. In turn, former Figure 8 with the final model schematic has been removed to shorten the manuscript to the Short Report format.

3) Where possible L/S ratio should still be calculated and provided when the proteins are depleted. I do think that all the depletion experiments are very repetitive. Could the authors consider some of this data being put in supplemental?

We agree that the depletion experiments are repetitive but provide additional verification of our observations. In order to adapt the manuscript to the Short Report format, we chose not to provide the L/S ratio at all times when depletions are shown. To avoid repetitive experiments in the main figures, we have moved the results of CRISPR/Cas9-mediated BMP2K depletion to the supplement (current Figure 1—figure supplement 3).

4) As mentioned at the start more in-depth studies of erythropoiesis are needed to fit the model and the suggestions. So instances of over interpretation and extrapolation should have a health warning attached or at least be said but then say this would need to be established in future work.

As requested by the reviewer, we have commented about the limitations of using K562 cells as the model of erythroid differentiation (mentioned in the Results section and the Discussion section).

5) I am loath to add extra work but potential role of BMP2K in erythroid differentiation was studied in K562s induced to differentiate with hemin and this was only carried out when both isoforms where KD simultaneously (Figure 2 and S2). Did the authors conduct a KD separately of either L or S in K562 and if so, what was the effect? What about KD of Sec16? I feel I am missing some key experiments that add evidence in this simpler system. There is also the classic rescue experiment that we are lacking (overexpressing the L and S forms to alter the ration would be possible). Was this tried in K562? Or just overexpressing the isoforms and looking at the effects? Were any of these attempted?

As requested also by the Editor and reviewer #1, we have analyzed the effect of depleting either L or S on erythroid differentiation of K562 cells (current Figure 4D,E). As we also write in response to point 5 of Reviewer #1, we observe that cells lacking BMP2K-L differentiate less potently, while those lacking BMP2K-S differentiate more potently. Interestingly, cells lacking BMP2K-S only do not behave exactly like cells lacking all variants. Thus, it is possible that both variants need to be reduced with an optimal L/S ratio to potently induce differentiation. We have also analyzed the effect of SEC16A depletion on K562 cell differentiation (Author response image 2 panels A-C). However, although shSEC16A#1 increased hemoglobin production in basal and hemin-stimulated conditions, shSEC16A#2 inhibited the induction of hemoglobin production upon hemin (Author response image 2 panel B). In addition, the two shRNAs caused changes in mRNA levels of erythroid markers that were not consistent with the effects on hemoglobin production ( Author response image 2 panel C). Hence, although we observed that SEC16A inhibits basal autophagic degradation (former Figure 5, currently omitted), we could not confirm that it restricts erythroid differentiation. It is possible that BMP2K variants differentially affect SEC16A function, which might be difficult to dissect by SEC16A depletion. So far, we have not tested the effects of overexpressing BMP2K variants in normal or BMP2K-depleted K562 cells on erythroid differentiation, though this is a very good suggestion. Given the laboratory work limitations in our institutions due to the current epidemiological situation, we could not attempt to perform such experiments during the revision. However, we plan to perform them in the future.

https://doi.org/10.7554/eLife.58504.sa2

Article and author information

Author details

  1. Jaroslaw Cendrowski

    Laboratory of Cell Biology, International Institute of Molecular and Cell Biology, Warsaw, Poland
    Contribution
    Conceptualization, Data curation, Formal analysis, Supervision, Validation, Investigation, Visualization, Methodology, Writing - original draft, Project administration, Writing - review and editing
    For correspondence
    jcendrowski@iimcb.gov.pl
    Competing interests
    No competing interests declared
    ORCID icon "This ORCID iD identifies the author of this article:" 0000-0002-8579-7279
  2. Marta Kaczmarek

    Laboratory of Cell Biology, International Institute of Molecular and Cell Biology, Warsaw, Poland
    Contribution
    Investigation, Visualization, Methodology
    Competing interests
    No competing interests declared
    ORCID icon "This ORCID iD identifies the author of this article:" 0000-0003-4939-6299
  3. Michał Mazur

    Laboratory of Cell Biology, International Institute of Molecular and Cell Biology, Warsaw, Poland
    Contribution
    Investigation, Methodology
    Competing interests
    No competing interests declared
    ORCID icon "This ORCID iD identifies the author of this article:" 0000-0001-5087-4409
  4. Katarzyna Kuzmicz-Kowalska

    Laboratory of Cell Biology, International Institute of Molecular and Cell Biology, Warsaw, Poland
    Contribution
    Investigation, Methodology
    Competing interests
    No competing interests declared
    ORCID icon "This ORCID iD identifies the author of this article:" 0000-0001-6146-1554
  5. Kamil Jastrzebski

    Laboratory of Cell Biology, International Institute of Molecular and Cell Biology, Warsaw, Poland
    Contribution
    Formal analysis, Visualization, Methodology
    Competing interests
    No competing interests declared
    ORCID icon "This ORCID iD identifies the author of this article:" 0000-0001-6481-1759
  6. Marta Brewinska-Olchowik

    Laboratory of Cytometry, Nencki Institute of Experimental Biology, Warsaw, Poland
    Contribution
    Formal analysis, Visualization
    Competing interests
    No competing interests declared
    ORCID icon "This ORCID iD identifies the author of this article:" 0000-0002-2135-6220
  7. Agata Kominek

    Laboratory of Cytometry, Nencki Institute of Experimental Biology, Warsaw, Poland
    Contribution
    Formal analysis
    Competing interests
    No competing interests declared
    ORCID icon "This ORCID iD identifies the author of this article:" 0000-0003-1567-9442
  8. Katarzyna Piwocka

    Laboratory of Cytometry, Nencki Institute of Experimental Biology, Warsaw, Poland
    Contribution
    Resources, Funding acquisition
    Competing interests
    No competing interests declared
    ORCID icon "This ORCID iD identifies the author of this article:" 0000-0001-6676-5282
  9. Marta Miaczynska

    Laboratory of Cell Biology, International Institute of Molecular and Cell Biology, Warsaw, Poland
    Contribution
    Conceptualization, Resources, Supervision, Funding acquisition, Writing - original draft, Writing - review and editing
    For correspondence
    miaczynska@iimcb.gov.pl
    Competing interests
    No competing interests declared
    ORCID icon "This ORCID iD identifies the author of this article:" 0000-0003-0031-5267

Funding

Narodowe Centrum Nauki (UMO-2011/02/A/NZ3/00149)

  • Jaroslaw Cendrowski
  • Katarzyna Kuzmicz-Kowalska
  • Kamil Jastrzebski
  • Marta Miaczynska

Fundacja na rzecz Nauki Polskiej (POIR.04.04.00-00-20CE/16-00)

  • Marta Kaczmarek
  • Kamil Jastrzebski
  • Marta Miaczynska

Fundacja na rzecz Nauki Polskiej (POIR.04.04.00-00-1C54/16-00)

  • Jaroslaw Cendrowski
  • Michał Mazur

Fundacja na rzecz Nauki Polskiej (POIR.04.04.00-00-23C2/17-00)

  • Katarzyna Piwocka

The funders had no role in study design, data collection and interpretation, or the decision to submit the work for publication.

Acknowledgements

We are grateful to J Jaworski and K Mleczko-Sanecka for providing reagents. We also thank M Banach-Orłowska, M Maksymowicz, A Poświata, L Wolińska-Nizioł and D Zdżalik-Bielecka for critical reading of the manuscript. This work was funded by the MAESTRO grant (UMO-2011/02/A/NZ3/00149) from National Science Center to M Miaczynska. M Miaczynska, M Kaczmarek and K Jastrzębski were supported by TEAM grant (POIR.04.04.00-00-20CE/16–00), J Cendrowski and M Mazur supported by HOMING grant (POIR.04.04.00-00-1C54/16-00), K Piwocka was supported by TEAM-TECH Core Facility Plus grant (POIR.04.04.00-00-23C2/17-00) – the three grants from the Foundation for Polish Science co-financed by the European Union under the European Regional Development Fund. Mass spectrometric analysis was performed in the Mass Spectrometry Laboratory, IBB PAS, Warsaw. The MS equipment was sponsored in part by the Centre for Preclinical Research and Technology (CePT), a project co-sponsored by European Regional Development Fund and Innovative Economy, The National Cohesion Strategy of Poland.

Senior Editor

  1. Vivek Malhotra, The Barcelona Institute of Science and Technology, Spain

Reviewing Editor

  1. Elizabeth A Miller, MRC Laboratory of Molecular Biology, United Kingdom

Reviewer

  1. Elizabeth A Miller, MRC Laboratory of Molecular Biology, United Kingdom

Publication history

  1. Received: May 2, 2020
  2. Accepted: August 13, 2020
  3. Accepted Manuscript published: August 14, 2020 (version 1)
  4. Version of Record published: September 4, 2020 (version 2)

Copyright

© 2020, Cendrowski et al.

This article is distributed under the terms of the Creative Commons Attribution License, which permits unrestricted use and redistribution provided that the original author and source are credited.

Metrics

  • 2,246
    Page views
  • 248
    Downloads
  • 4
    Citations

Article citation count generated by polling the highest count across the following sources: Crossref, PubMed Central, Scopus.

Download links

A two-part list of links to download the article, or parts of the article, in various formats.

Downloads (link to download the article as PDF)

Open citations (links to open the citations from this article in various online reference manager services)

Cite this article (links to download the citations from this article in formats compatible with various reference manager tools)

  1. Jaroslaw Cendrowski
  2. Marta Kaczmarek
  3. Michał Mazur
  4. Katarzyna Kuzmicz-Kowalska
  5. Kamil Jastrzebski
  6. Marta Brewinska-Olchowik
  7. Agata Kominek
  8. Katarzyna Piwocka
  9. Marta Miaczynska
(2020)
Splicing variation of BMP2K balances abundance of COPII assemblies and autophagic degradation in erythroid cells
eLife 9:e58504.
https://doi.org/10.7554/eLife.58504

Further reading

    1. Cell Biology
    Ignacio Bravo-Plaza, Victor G Tagua ... Miguel A Peñalva
    Research Article

    Uso1/p115 and RAB1 tether ER-derived vesicles to the Golgi. Uso1/p115 contains a globular-head-domain (GHD), a coiled-coil (CC) mediating dimerization/tethering and a C-terminal region (CTR) interacting with golgins. Uso1/p115 is recruited to vesicles by RAB1. Genetic studies placed Uso1 paradoxically acting upstream of, or in conjunction with RAB1 (Sapperstein et al., 1996). We selected two missense mutations in uso1 resulting in E6K and G540S in the GHD that rescued lethality of rab1-deficient Aspergillus nidulans. The mutations are phenotypically additive, their combination suppressing the complete absence of RAB1, which emphasizes the key physiological role of the GHD. In living hyphae Uso1 recurs on puncta (60 sec half-life) colocalizing partially with the Golgi markers RAB1, Sed5 and GeaA/Gea1/Gea2, and totally with the retrograde cargo receptor Rer1, consistent with Uso1 dwelling in a very early Golgi compartment from which ER residents reaching the Golgi recycled back to the ER. Localization of Uso1, but not of Uso1E6K/G540S, to puncta is abolished by compromising RAB1 function, indicating that E6K/G540S creates interactions bypassing RAB1. That Uso1 delocalization correlates with a decrease in the number of Gea1 cisternae supports that Uso1-and-Rer1-containing puncta are where the protein exerts its physiological role. In S-tag-coprecipitation experiments Uso1 is an associate of the Sed5/Bos1/Bet1/Sec22 SNARE complex zippering vesicles with the Golgi, with Uso1E6K/G540S showing stronger association. Using purified proteins, we show that Bos1 and Bet1 bind the Uso1 GHD directly. However, Bet1 is a strong E6K/G540S-independent binder, whereas Bos1 is weaker but becomes as strong as Bet1 when the GHD carries E6K/G540S. G540S alone markedly increases GHD binding to Bos1, whereas E6K causes a weaker effect, correlating with their phenotypic contributions. AlphaFold2 predicts that G540S increases binding of the GHD to the Bos1 Habc domain. In contrast, E6K lies in an N-terminal, potentially alpha-helical, region that sensitive genetic tests indicate as required for full Uso1 function. Remarkably, this region is at the end of the GHD basket opposite to the end predicted to interact with Bos1. We show that unlike dimeric full-length and CTR∆ Uso1 proteins, the GHD lacking the CC/CTR dimerization domain, whether originating from bacteria or Aspergillus extracts and irrespective of whether it carries or not E6K/G540S, would appear to be monomeric. With the finding that overexpression of E6K/G540S and wild-type GHD complement uso1∆, our data indicate that the GHD monomer is capable of providing, at least partially, the essential Uso1 functions, and that long-range tethering activity is dispensable. Rather, these findings strongly suggest that the essential role of Uso1 involves the regulation of SNAREs.

    1. Cell Biology
    Sandipan Dasgupta, Daniella Y Dayagi ... Jeffrey E Gerst
    Research Article

    Full-length mRNAs transfer between adjacent mammalian cells via direct cell-to-cell connections called tunneling nanotubes (TNTs). However, the extent of mRNA transfer at the transcriptome-wide level (the 'transferome') is unknown. Here, we analyzed the transferome in an in vitro human-mouse cell co-culture model using RNA-sequencing. We found that mRNA transfer is non-selective, prevalent across the human transcriptome, and that the amount of transfer to mouse embryonic fibroblasts (MEFs) strongly correlates with the endogenous level of gene expression in donor human breast cancer cells. Typically, <1% of endogenous mRNAs undergo transfer. Non-selective, expression-dependent RNA transfer was further validated using synthetic reporters. RNA transfer appears contact-dependent via TNTs, as exemplified for several mRNAs. Notably, significant differential changes in the native MEF transcriptome were observed in response to co-culture, including the upregulation of multiple cancer and cancer-associated fibroblast-related genes and pathways. Together, these results lead us to suggest that TNT-mediated RNA transfer could be a phenomenon of physiological importance under both normal and pathogenic conditions.