Transcriptional profiling of mouse peripheral nerves to the single-cell level to build a sciatic nerve ATlas (SNAT)
- Department of Biology, Institute of Molecular Health Sciences, Swiss Federal Institute of Technology, ETH Zurich, Switzerland
- Functional Genomics Center Zurich, ETH Zurich/University of Zurich, Switzerland
Figures
Figure 1 with 1 supplement
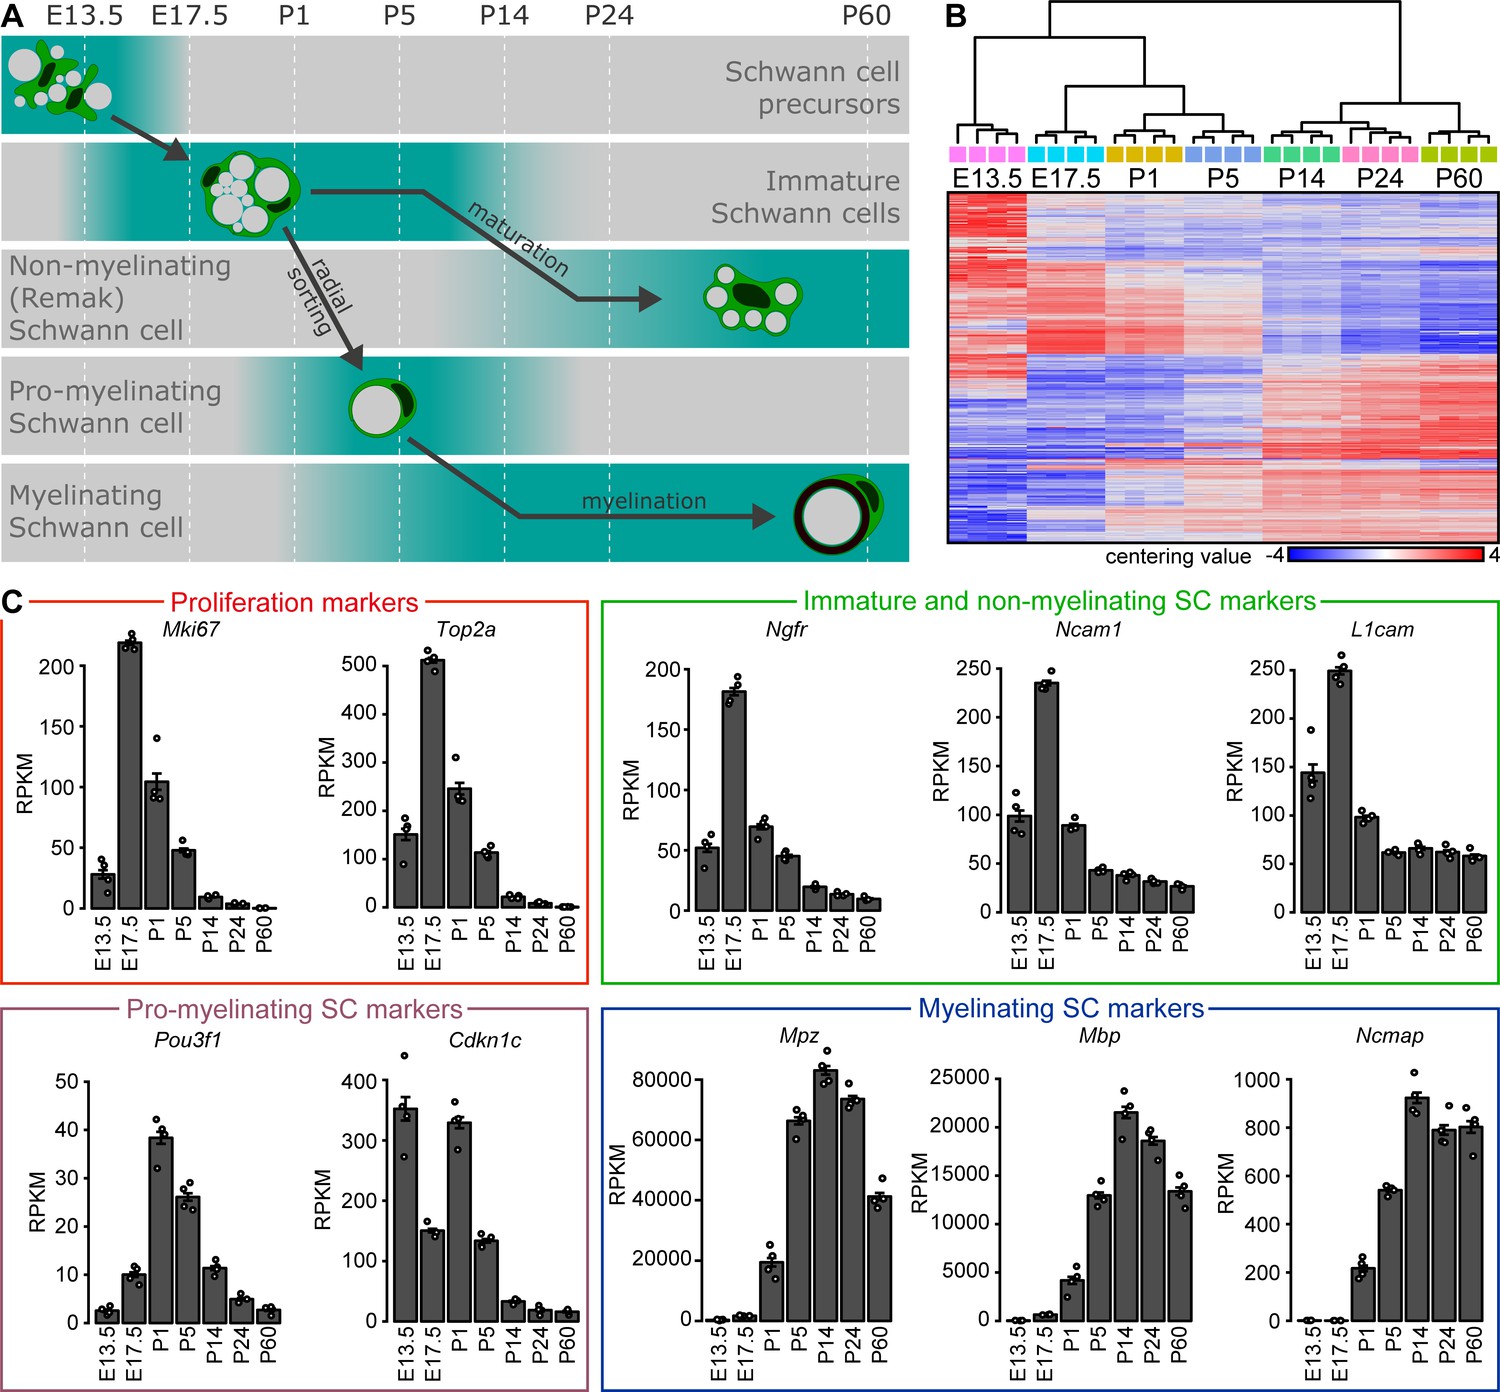
Bulk RNA profiling of peripheral nerves at various stages of embryonic and postnatal development.
(A) Schematic representation of developmental stages used for analysis with key differentiation events of the Schwann cell (SC) lineage aligned to those stages. At embryonic day (E) 13.5, SC precursors can be found in peripheral nerves. At E17.5, sciatic nerves contain immature SCs which proliferate and perform radial sorting of axons. Radial sorting continues at P1 and P5. Sorted axons are engaged in a 1:1 relation by a pro-myelinating SC. These structures are frequent in sciatic nerves at P1 and P5, and to a much lesser extent at P14. Pro-myelinating SCs undergo transcriptional changes to promote the onset of myelination, followed by radial and axial growth of the myelin sheath which keeps pace with body growth at P14 and P24. Small-caliber axons not sorted for myelination remain engaged by SCs that are undergoing maturation toward a non-myelinating SC (also known as a Remak cell) at both P14 and P24. By P60, the developmental myelination program is largely completed, and sciatic nerves are widely populated by mature myelinating SCs and by mature non-myelinating (Remak) SCs. (B, C) Four independent samples were used for bulk RNA sequencing at every time point, two derived from male and two from female mice. Each independent sample was derived from one or two mice pooled together. At E13.5, various peripheral nerves distal to the DRG were taken from each embryo, and the nerves from two separate embryos of the same sex were pooled per sample. At E17.5, sciatic nerves were pooled from two embryos of the same sex per sample. At all postnatal time points (P1, P5, P14, P24, and P60), sciatic nerves from one mouse were used for each independent sample. (B) Heat map of centering values (normalized count row value of each sample subtracted by the mean of the row) and hierarchical cluster analysis of 2000 most variable genes during postnatal nerve development. The four independent samples sequenced at each time point cluster closer to each other than the samples of adjacent time points. Clustering of the samples reconstruct the correct chronology of nerve maturation and SC differentiation. The heat map color gradient also shows a high degree of consistency between the individual independent samples sequenced at each time point. (C) Plotting the transcript levels (RPKM) of genes related to proliferation and Schwann cell maturation throughout the timeline of analysis reveals the expected pattern of relative abundance according to the chronology of nerve maturation. The proliferation-related transcripts Mki67 and Top2a are highest at E17.5 and P1. The transcripts for Ngfr, Ncam1, and L1cam are enriched in immature Schwann cells and peak at E17.5. These transcripts are also expressed by non-myelinating (Remak) cells, and are therefore also detected (albeit at lower levels) later in development. Pou3f1 transcripts are enriched in pro-myelinating Schwann cells, and peak at P1 and P5. Except for E13.5, Cdkn1c shows a similar transcription abundance dynamic as Pou3f1, consistent with expression by pro-myelinating Schwann cells. Transcripts for the myelin proteins Mpz, Mbp, and Ncmap are accumulated from P5 onwards, around the onset of myelination, and highlight the presence of myelinating Schwann cells. See also Figure 1—figure supplement 1.
Figure 1—figure supplement 1
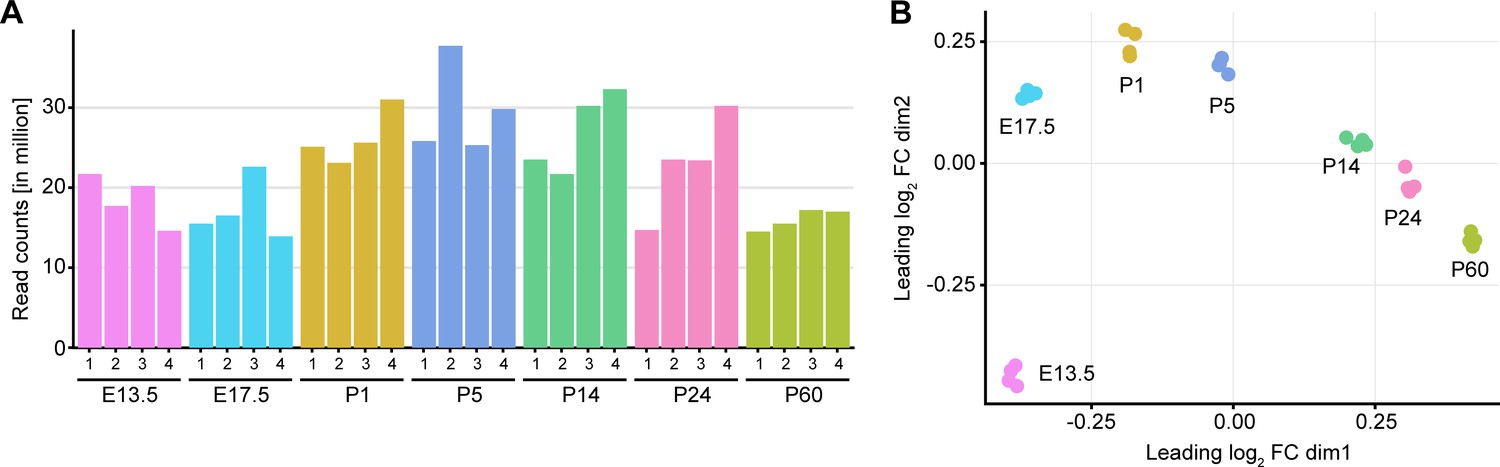
Library depth and MDS plot for each sample used in bulk RNA sequencing of peripheral nerves during development.
(A) Number of read counts (in millions) for each independent sample at each time point analyzed. At least 12 million reads per individual sample were mapped to the transcriptome for data analysis. (B) Multidimensional scaling (MDS) plot showing dissimilarity of each individual sample sequenced at every time point. The individual samples from each time point cluster close to each other, and the various time points form a regular pattern that resembles the gradual changes occurring during nerve maturation in chronological order. Four individual samples were sequenced per time point, two samples derived from male and two from female mice.
Figure 2 with 1 supplement
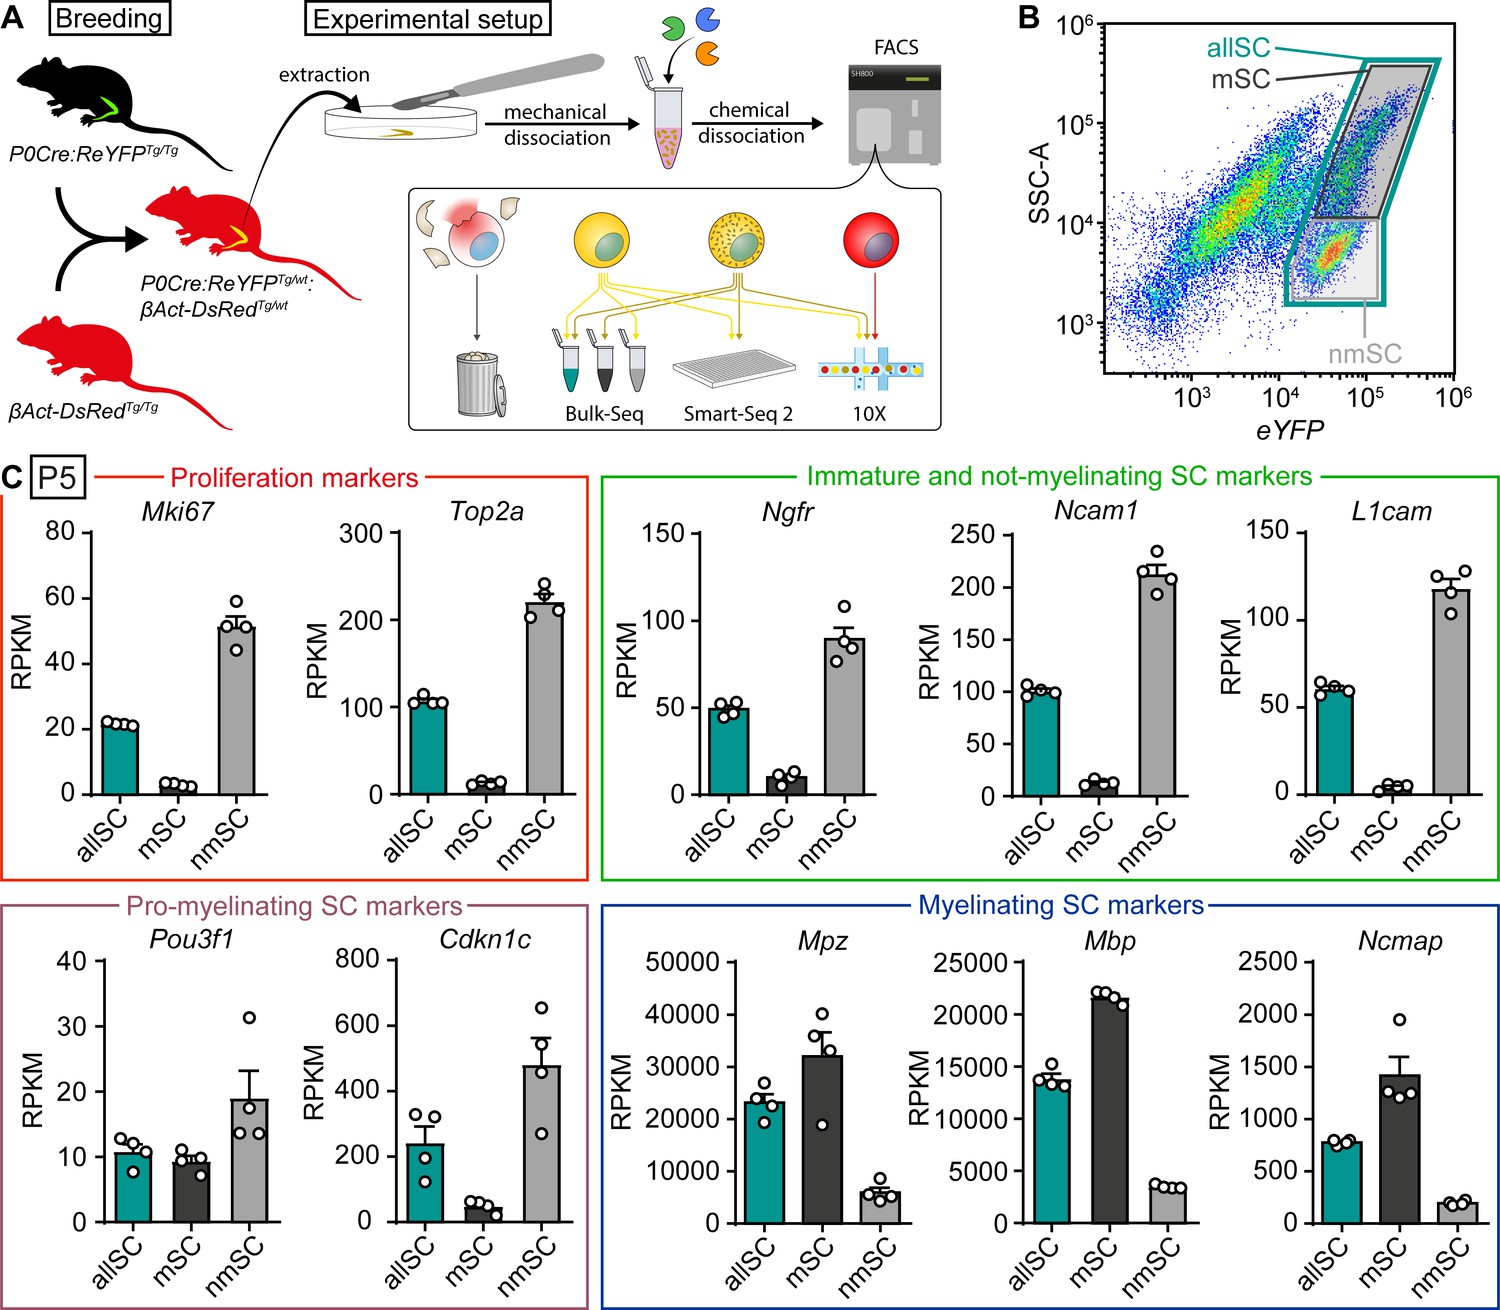
Bulk RNA profiling of sorted Schwann cells as a whole population or selectively enriched in myelinating and not-myelinating fractions.
(A) Schematic representation of the general experimental setup used in the study, including the animal models expressing fluorescent reporter proteins. P0Cre:ReYFPTg (schematically represented as green) labels Schwann cells (SCs) specifically with YFP, whereas the βAct-DsRedTg (schematically represented as red) labels all cells with dsRed. In experimental mice, SCs in sciatic nerves express both dsRed and YFP (schematically colored in yellow), whereas other nerve cells express only dsRed (schematically colored in red). Sciatic nerves were extracted at various ages, and cell suspensions were prepared through mechanical and enzymatic dissociation. This suspension was loaded into a FACS machine, which sorted SCs based on fluorescence and granularity, depending on the experiment. Debris and ruptured cells had low levels of dsRed signal, and were therefore discarded. In the schematic, not-myelinating Schwann cells are represented in yellow, whereas myelinating Schwann cells are represented in yellow with granules. Granularity differences allowed enrichment of SC populations with lower or higher SSC-A values (see panel B). The bulk RNA sequencing shown in panels (B) and (C) used this strategy to obtain fractions enriched in myelinated (mSC) and not-myelinated (nmSC) SCs, plus a third condition of all SCs (allSC) mixed from P5 sciatic nerves. The single-cell RNA sequencing experiments shown in Figures 3–6, with respective supplements, carried out using Smart-Seq2 or 10x Genomics, included a mixture of myelinating and not-myelinating SCs. Non-Schwann cells in the nerve, labeled with only dsRed, were sequenced in experiments using 10x Genomics (Figures 5 and 6, with respective supplements). (B) Scatter plot from FACS experiments depicting YFP fluorescence levels in the x-axis, and side/back scatter (SSC-A) in the y-axis. SCs are located in the plot region related to higher YFP levels. In this region, SCs extracted from P5 nerves form two semi-distinct clouds of dots. A system of three gates were used to collect SCs. (1) a gate for SCs with higher SSC-A levels, enriched in myelinating SCs (mSC, color-coded in black frame), (2) a gate for SCs with the lower SSC-A levels, enriched in not-myelinating SCs (nmSC, color-coded in gray frame), and (3) a gate including both clouds (allSC, color-coded in green frame). The color-code of these gates is recapitulated in the bulk-RNA-seq schematic shown in (panel A), and in the bar graphs in (C). (C) Plotting marker transcript levels (RPKM) of genes related to proliferation and SC maturation (same markers as depicted in Figure 1) in SCs collected with each of the three gating strategies. In each gate, four independent replicate samples were collected, two from female mice and two from male mice. Each independent replicate consists of at least 10,000 SCs. Transcripts from the proliferation-related genes Mki-67 and Top2a are strongly enriched in the nmSC gate compared to the mSC gate. Transcripts of Ngfr, Ncam1, and L1cam, characteristic of immature Schwann cells, are also strongly elevated within the nmSC gate relative to the mSC gate. The transcript of Pou3f1, expressed by pro-myelinating SCs, appears slightly enriched in the nmSC gate, even though the levels between the mSC and allSC populations are similar. Furthermore, the levels of Cdkn1c are also consistently higher in the nmSC compared to the mSC gate. As the pro-myelinating stage represents a transition between not-myelinating and myelinating SCs, the fine expression pattern of this gene is likely to revolve around major morphological changes in SCs, which makes it difficult to enrich for pro-myelinating SCs in this experimental setting. Transcript levels of Mpz, Mbp, and Ncmap, typical markers of myelinating SCs, are enriched in the mSC gate compared to the nmSC gate. As expected, the levels of most transcripts on the allSC gate were intermediate between the levels detected in the mSCs and the nmSCs gates. See also Figure 2—figure supplement 1.
Figure 2—figure supplement 1
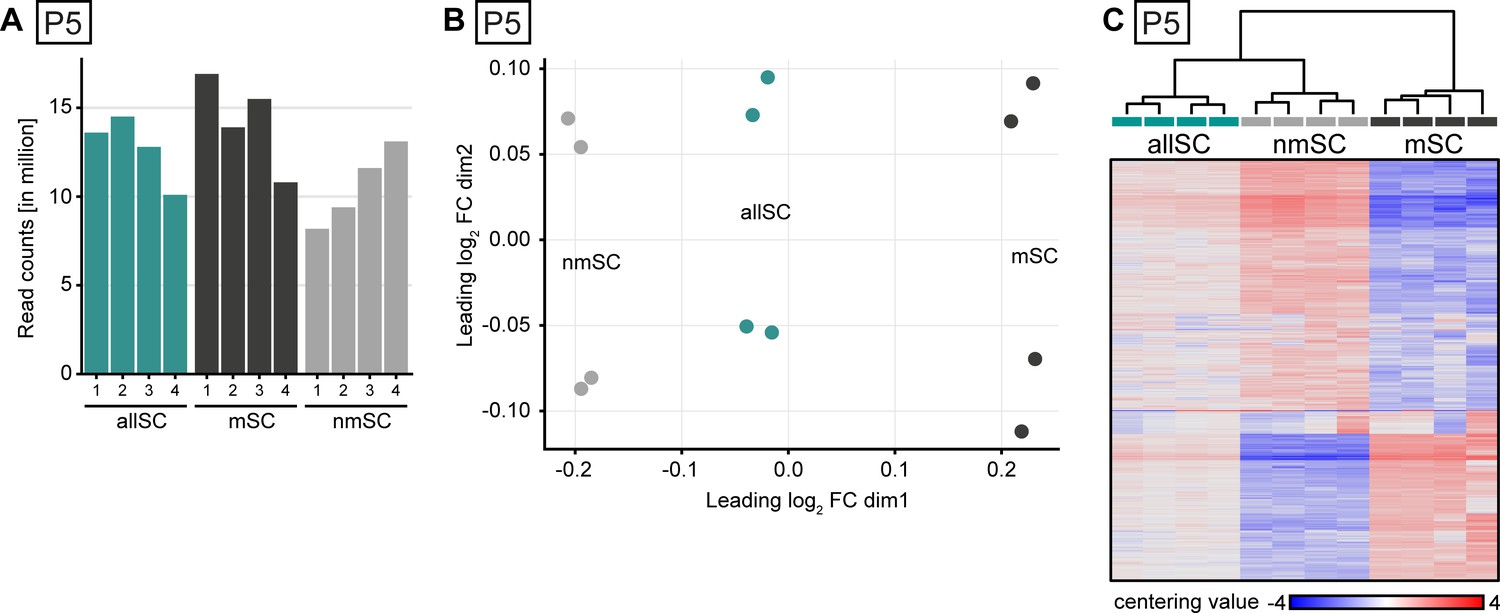
Library depth, MDS plot, and heat map projection of bulk-sequenced Schwann cell populations at P5.
(A) Number of read counts (in millions) for each of the four samples collected in each of the three gates. At least eight million reads per sample were mapped to the transcriptome for data analysis. (B) Multidimensional scaling (MDS) plot showing dissimilarity of each individual sample sequenced within each gating strategy. The furthest separation in the plot was between the samples derived from the nmSC gate and the samples derived from the mSC gate, while in-between were located the samples derived from the allSC gate. Out of the four individual independent samples sequenced in each gate, two samples derived from male and two from female mice. In every gate, the samples cluster in pairs, each pair derived from mice of the same sex. (C) Heat map of centering value (normalized count row value of each sample subtracted by the mean of the row) and hierarchical cluster analysis of the 2000 most variably expressed genes between cells extracted with each gating strategy. For each gate, four independent samples were used, two derived from male and two from female mice. Each sample was derived from a Schwann cell suspension extracted from one mouse. The four independent samples sequenced in each gate cluster closer to each other than the cells derived from different gates. The heat map color gradient also shows a high degree of consistency between the individual samples within each gating strategy. Cells extracted from the mSC and the nmSC gates differ the most in row centering score color pattern, whereas the cells sorted from the allSC gate display an intermediate pattern.
Figure 3 with 2 supplements
RNA single-cell profiling of Schwann cells handled with Smart-Seq2 protocol over various stages of postnatal development.
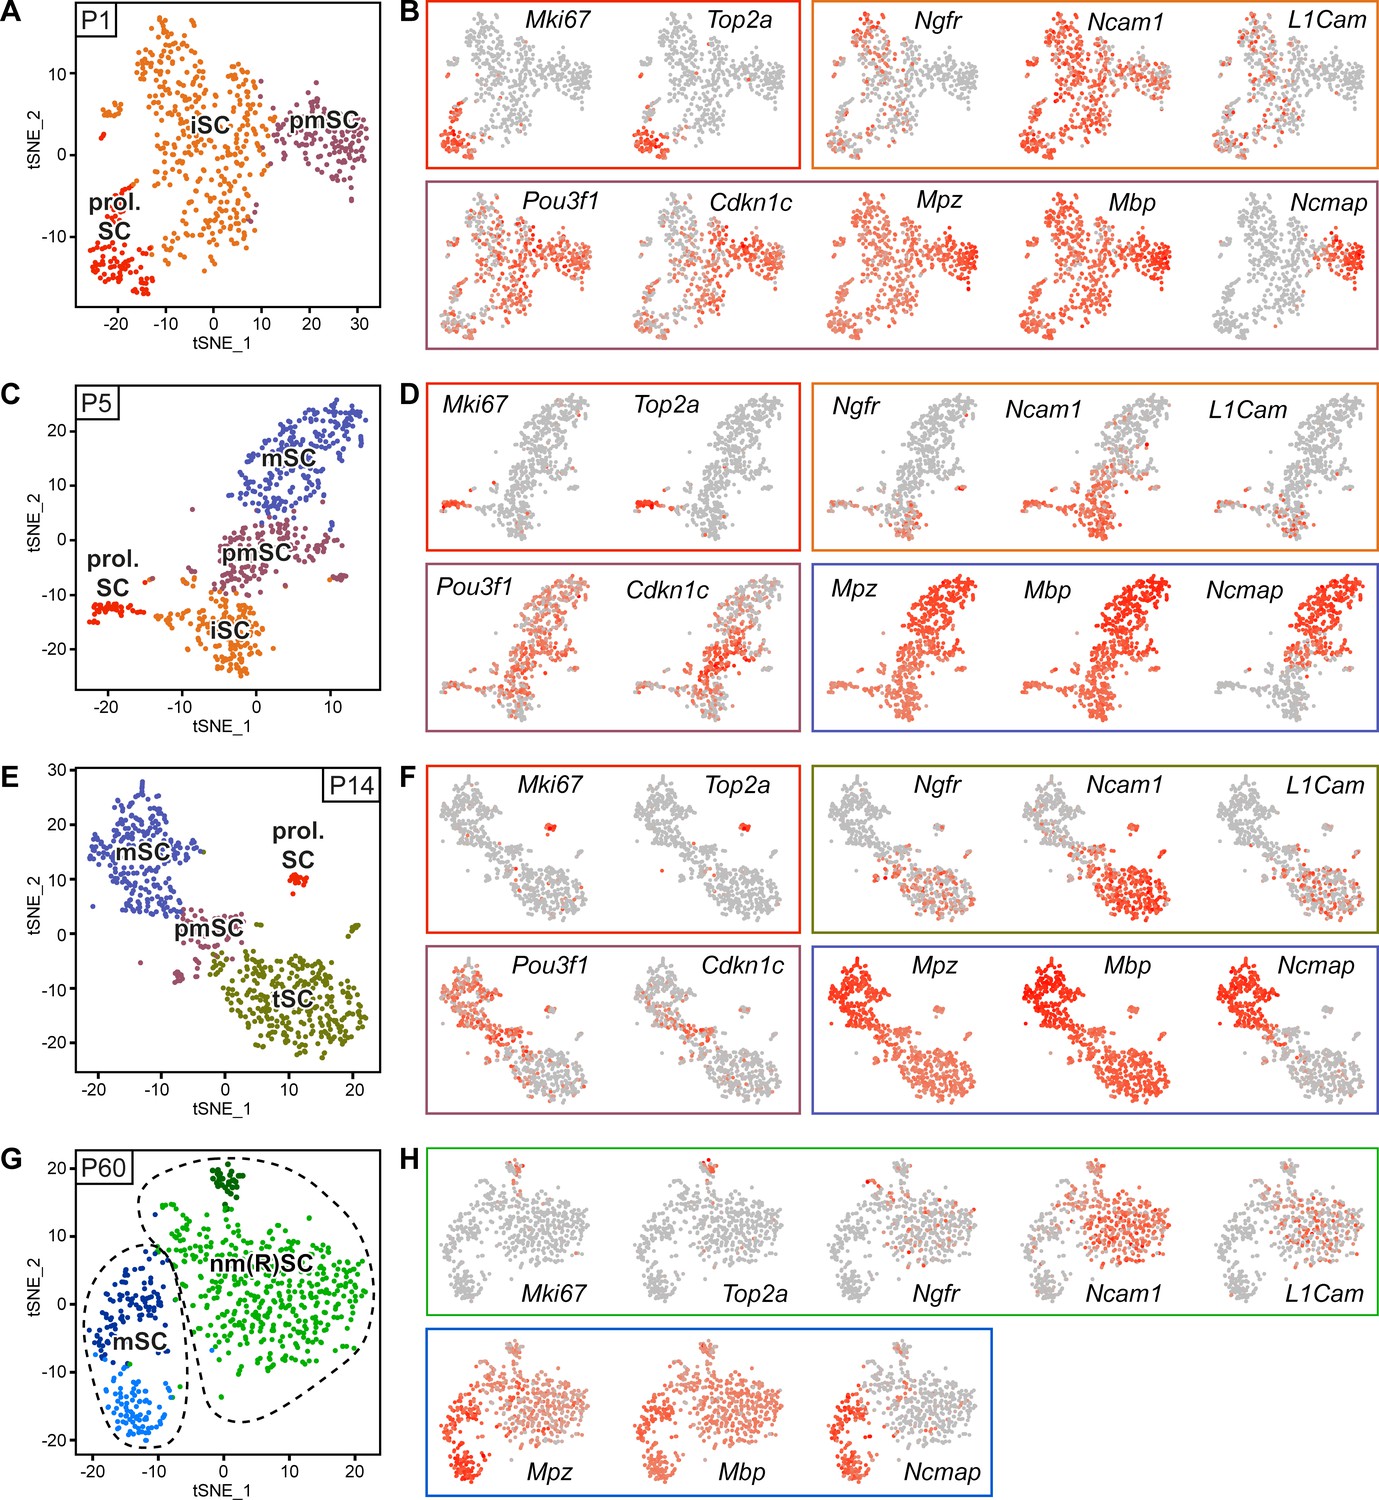
(A–H) Cells extracted from sciatic nerves were sorted based on expression of YFP (selection for Schwann cells (SCs)). Single YFP-positive SCs were individually sorted into single wells of a 384-well plate, containing lysis reagents for Smart-Seq2 library preparation (see schematic in Figure 2A). Four postnatal time points were selected, P1, P5, P14, and P60, covering various stages of SC differentiation. Two 384-well plates, each plate containing cells derived from different animals, were sorted and subjected to sequencing at each time point. Cells from each plate derived from a cell-suspension extracted from male and female mice in a 1:1 ratio. One male and one female mouse were pooled per plate at P1, P5, and P14, while two male and two female mice were pooled per plate at P60. (A) tSNE plot of SCs extracted from sciatic nerves of P1 mice. Data analysis indicates three distinct clusters, one relating to proliferating Schwann cells (prol. SC), another to immature Schwann cells (iSC), and a third cluster to pro-myelinating Schwann cells (pmSC). (B, D, F, H) tSNE plots with color overlays indicating transcript levels per cell. A gradient of red tones indicates relative abundance of each transcript per cell, in which dark red indicates higher levels, and gray indicates not detected. The color of the surrounding frame relates to the color-code of each cluster. Markers expressions described are enriched in (although not exclusive to) the cluster indicated. (B) The proliferation transcripts Mki67 and Top2a label the prol. SC cluster. Ngfr, Ncam1, and L1cam are enriched in the iSC clusters. Pou3f1 and Cdkn1c are slightly enriched in the pmSC cluster. The myelin protein transcripts Mpz, Mbp, and Ncmap are particularly enriched in the pmSC cluster. (C) tSNE plot of SCs extracted from P5 mice. Data analysis indicates four distinct clusters, one relating to prol. SC, another to iSC, a third cluster to pmSC, and a fourth cluster relates to myelinating SCs (mSC). (D) Mki67 and Top2a localize to the prol. SC cluster; Ngfr, Ncam1 and L1cam are enriched in the iSC cluster; and Pou3f1 and Cdkn1c are enriched in the pmSC cluster. The myelin protein transcripts Mpz, Mbp, and Ncmap are accumulated in the mSC cluster. (E) tSNE plot of SCs extracted from P14 mice. Data analysis indicates four distinct clusters, one relating to prol. SC, another to non-myelinating cells undergoing maturation and marked here as transition SCs (tSC), a third cluster to pmSC, and a fourth cluster depicts mSC. (F) As expected, Mki67 and Top2a localize to the prol. SC cluster; Ngfr, Ncam1, and L1cam are enriched in the tSC cluster; and Pou3f1 and Cdkn1c are enriched in the pmSC cluster. The myelin protein transcripts Mpz and Mbp and Ncmap are enriched in the mSC cluster. (G) Batch-corrected tSNE plot of SCs extracted from P60 mice. Data analysis indicates four distinct clusters, with two clusters relating to mature non-myelinating (Remak) SCs (nm(R)SC), and two clusters related to myelinating SCs. (H) Mki67 and Top2a are proliferation-related genes labeling some cells in the nm(R)SC clusters; Ngfr, Ncam1 and L1cam mainly localize to the nm(R)SC clusters. The myelin protein transcripts Mpz, Mbp, and Ncmap are enriched in the mSC clusters. Dashed lines indicate a merge of clusters produced in the default output of the analysis (Figure 3—figure supplement 2). See also Figure 3—figure supplement 1.
Figure 3—figure supplement 1
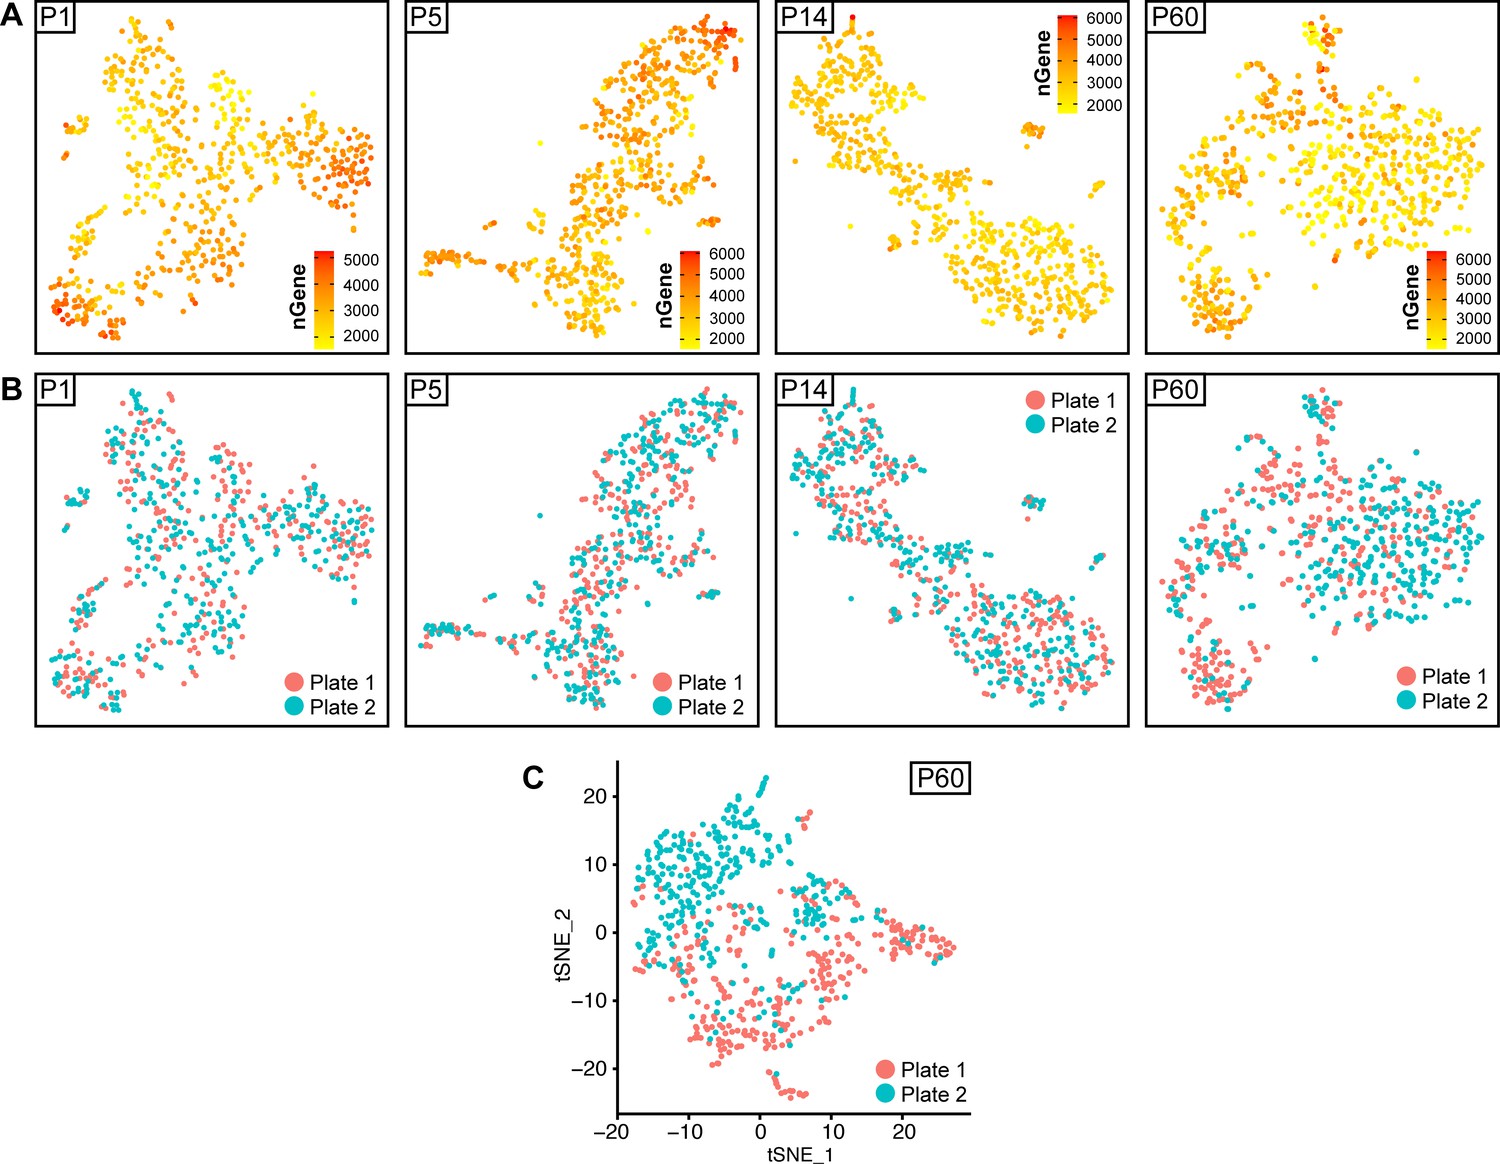
tSNE plots depicting the source plate of each cell, and gene detection depth per cell in Schwann cells handled with Smart-Seq2 through different stages of postnatal development.
(A) tSNE plots depicting the depth of gene detection per cells (nGene) at all ages analyzed. (B, C) tSNE plots at every analysis time point with cells color-coded to their plate of origin (designated as plate 1 or plate 2 per time point). Cells from both plates are found at comparable levels in all clusters at P1, P5, and P14 (B). At P60, there is a bias in cell distribution across the tSNE plot, related to the plate of origin (C). Applying a batch correction between these two plates was used to reduce this bias (B).
Figure 3—figure supplement 2
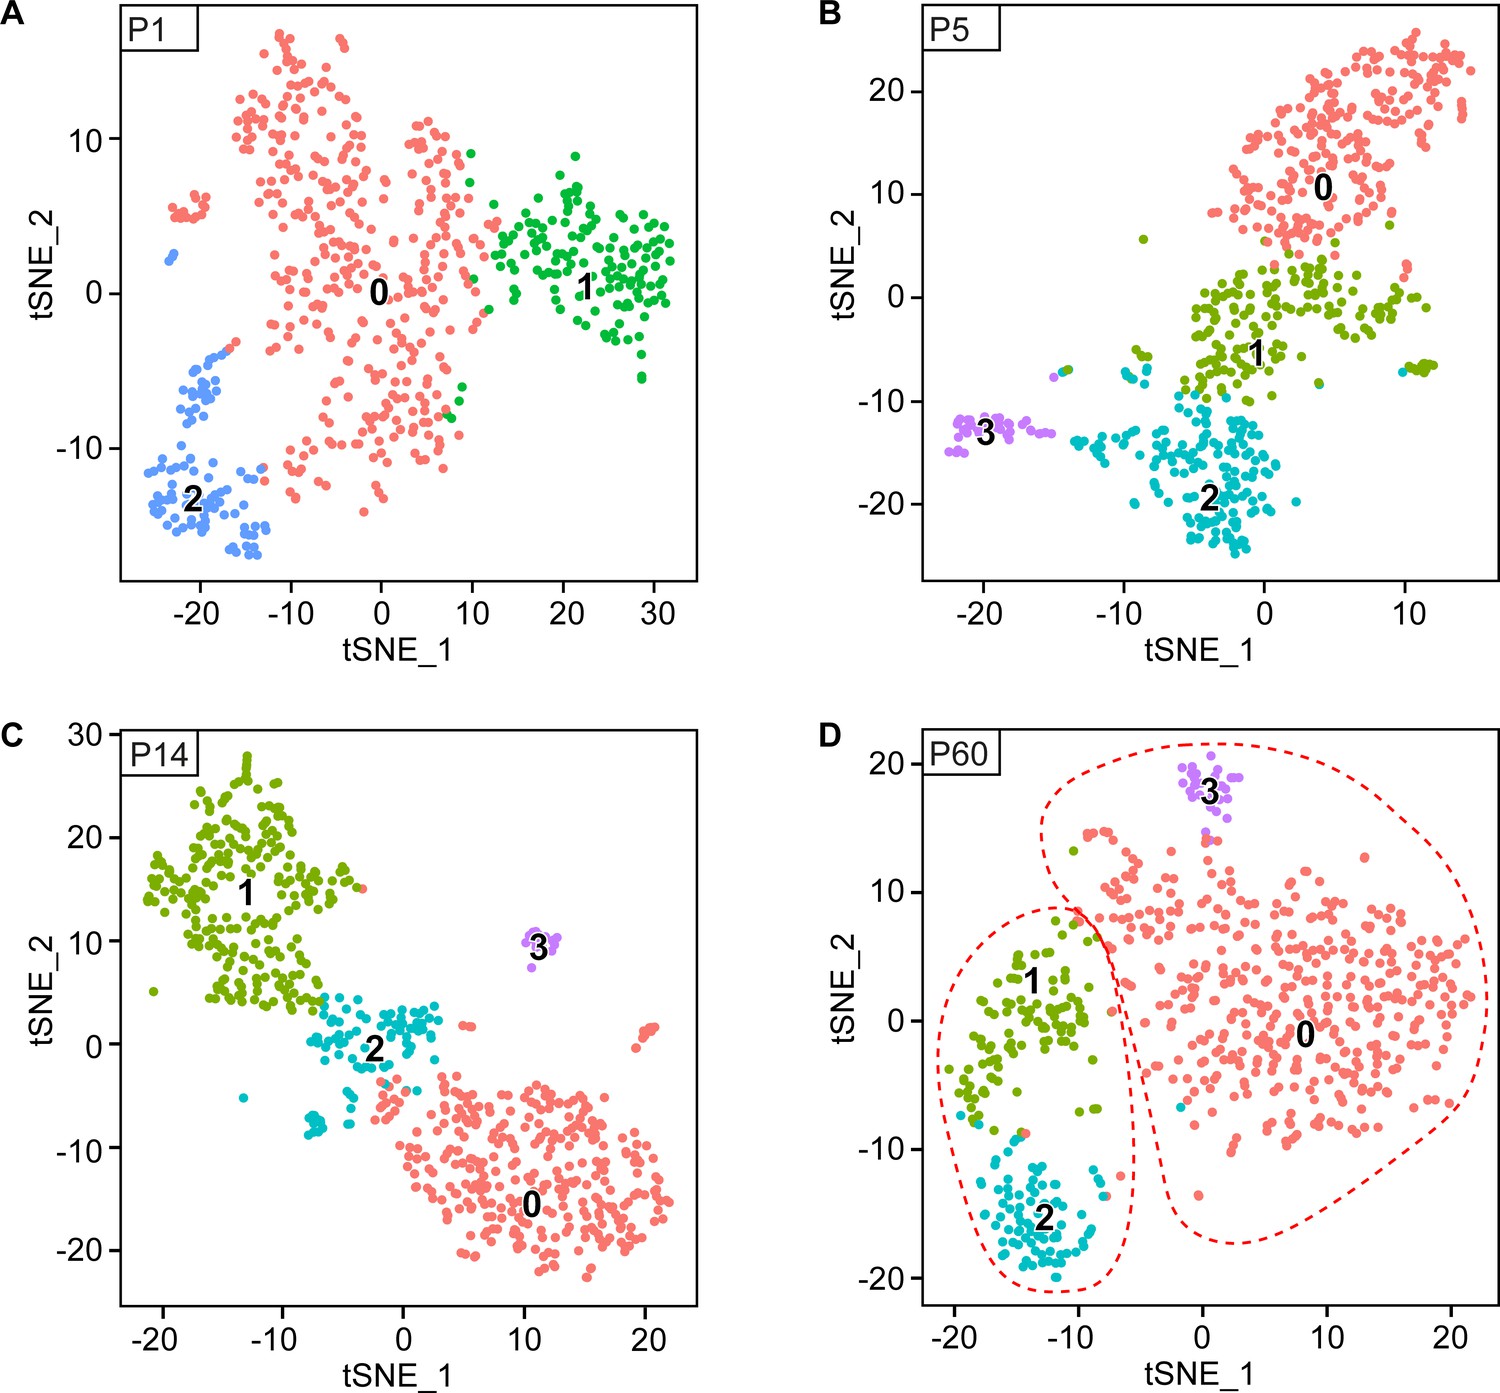
Original clusters overlaid with tSNE plots related to single-cell sequencing analysis of sciatic nerve cells handled with Smart-Seq2 at individual time points.
(A–D) tSNE plots overlaid with the clusters generated upon initial data treatment of Smart-Seq2 single-cell RNA sequencing at P1 (A), P5 (B), P14 (C) and P60 batch corrected (D). In the final tSNE plot shown in Figure 3G, clusters 1 and 2 at P60 (D) were merged in a single cluster group labeled myelinating SCs (mSC). Also, clusters 0 and 3 at P60 (D) were merged in a single cluster group labeled non-myelinating (Remak) SCs (nm(R)SC). Default numbering and colors are shown for each cluster.
Figure 4 with 2 supplements
Integrated RNA profiling with single-cell resolution covering various stages of Schwann cell development.
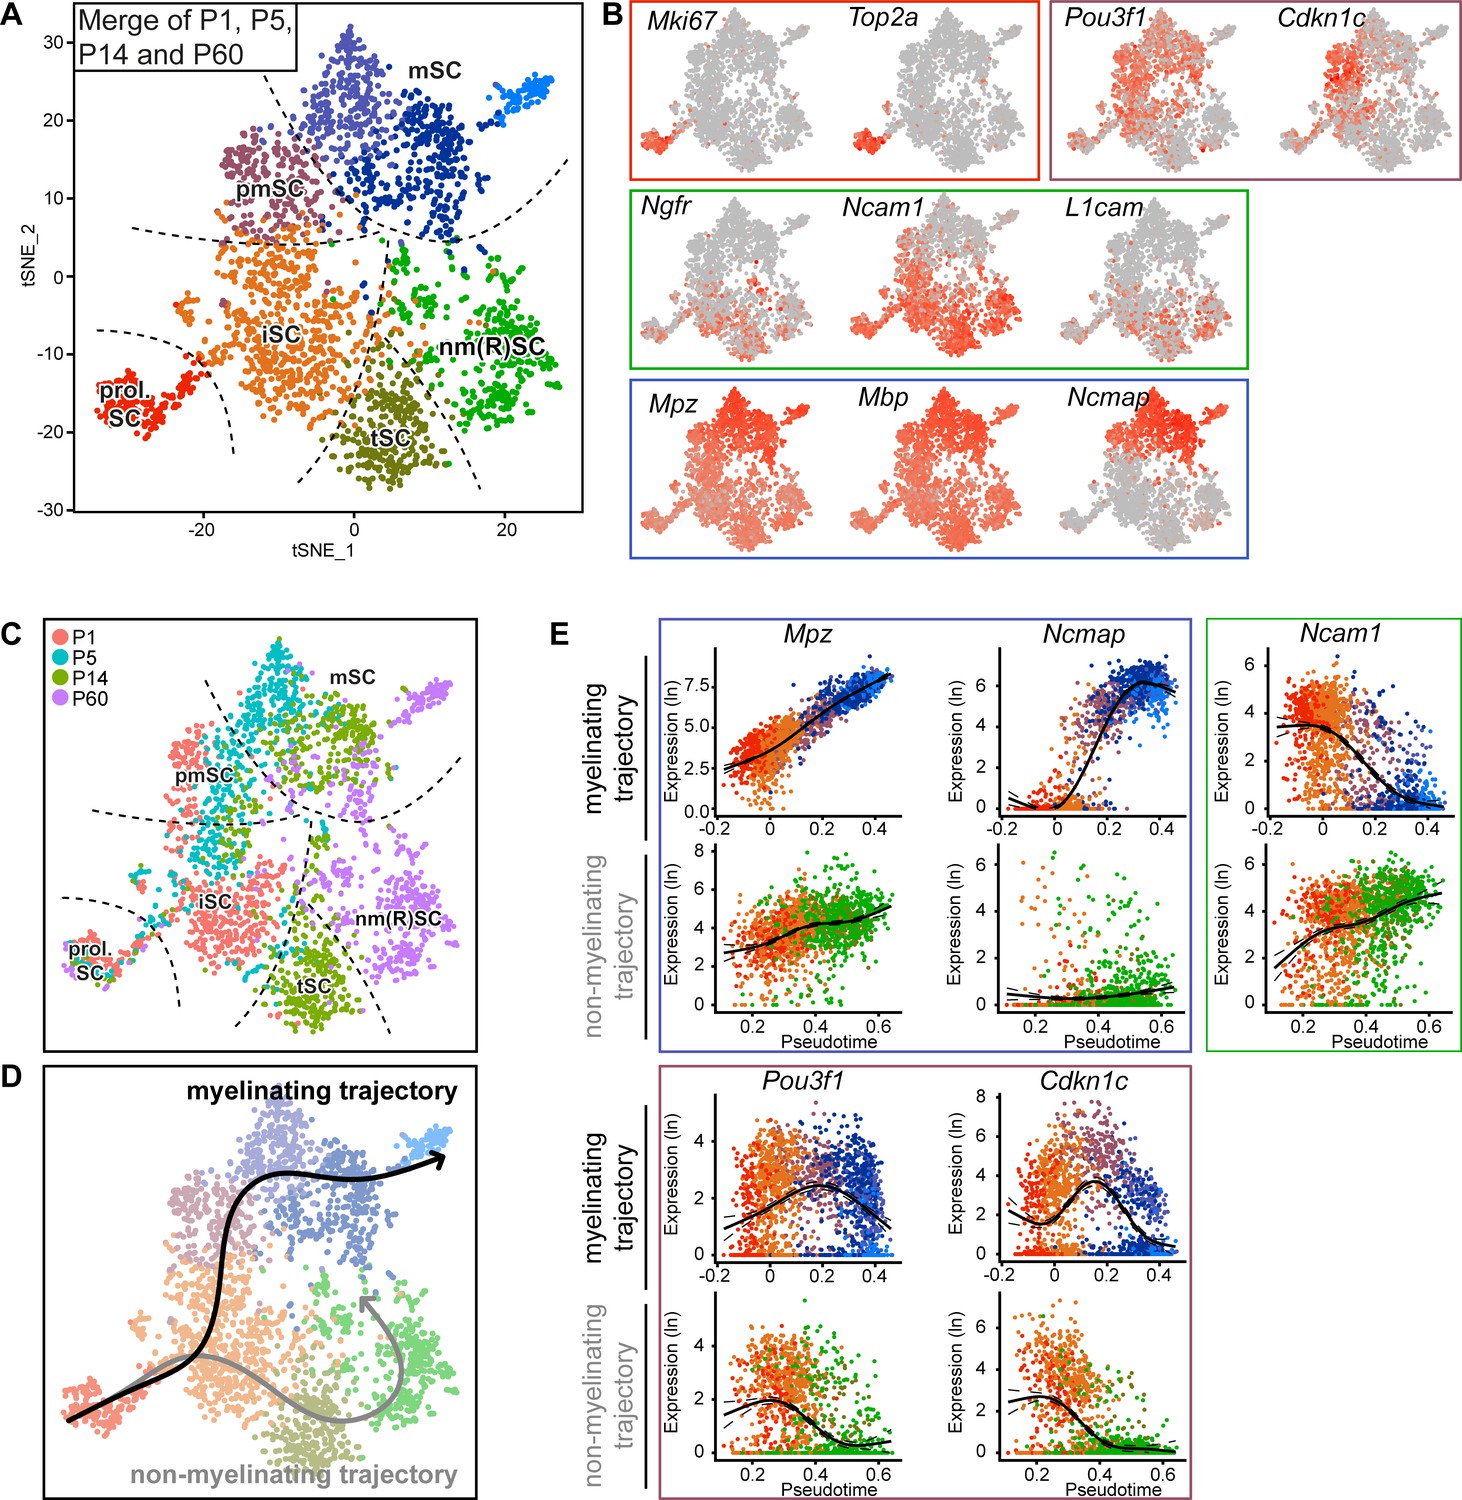
(A) tSNE plot derived from single-cell RNA sequencing of Schwann cells (SCs) handled with the Smart-Seq2 protocol. All data presented in Figure 3 were condensed into a single plot. Data analysis resulted in eight clusters, marked with the same nomenclature as in Figure 3. These clusters include proliferating SCs (prol. SC), immature SCs (iSC), transition SCs (tSC), mature non-myelinating (Remak) SCs (nm(R)SC), pro-myelinating SCs (pmSC), and myelinating SCs (mSC). (B) tSNE plot with color overlay indicating detected transcript levels per cell. A gradient of red tones indicates relative abundance of each transcript per cell, in which dark red indicates higher levels, and gray indicates not detected. The color of the surrounding frame relates to the color code of each cluster. The markers expressions described here are enriched in (although not exclusive to) the cluster indicated. Expression of Mki67 and Top2a was enriched in the prol. SC cluster. The levels of Ngfr, Ncam1, and L1cam were enriched in the iSC, tSC and nm(R)SC clusters. Pou3f1 and Cdkn1c were enriched in the pmSC cluster. Transcripts for the myelin proteins Mpz, Mbp, and Ncmap are high in the myelinating SC clusters (mSC). (C) tSNE plot including all Schwann cells (SCs) from all ages handled with the Smart-Seq2 protocol, with cells color-coded to their age of analysis (P1, P5, P14, and P60). The distribution of the cells with increasing age relates to the differentiation trajectories predicted in (D) and is congruent with known morphological features observed in the nerve at the different ages. Dashed lines outline the approximate region of each cluster. (D) Smooth curves reconstructed by supervised application of the Slingshot package depict two branching trajectories, with the prol. SC set as starting cluster. One of the branches depicts the myelinating trajectory (black arrow, top), and the other branch depicts the non-myelinating trajectory of SC maturation (gray arrow, bottom). (E) Temporally changing gene expression based on the two trajectories produced by Slingshot shown in (D). In each frame, the top row depicts gene expression change along the myelinating trajectory, whereas the bottom row shows gene expression change along the non-myelinating trajectory. Within the blue frame, transcripts of Mpz and Ncmap strongly accumulate over pseudotime in the myelinating trajectory but not in the non-myelinating trajectory. Within the green frame, transcripts of Ncam1 are reduced over pseudotime along the myelinating trajectory, and increased over pseudotime along the non-myelinating trajectory. Within the purple frame, transcript levels of Pou3f1 and Cdkn1c peak at the pro-myelinating stage and are lower before and after in pseudotime along the myelinating trajectory, while both are decreasing along pseudotime in the non-myelinating trajectory. See also Figure 4—figure supplement 1 and Figure 4—figure supplement 2.
Figure 4—figure supplement 1
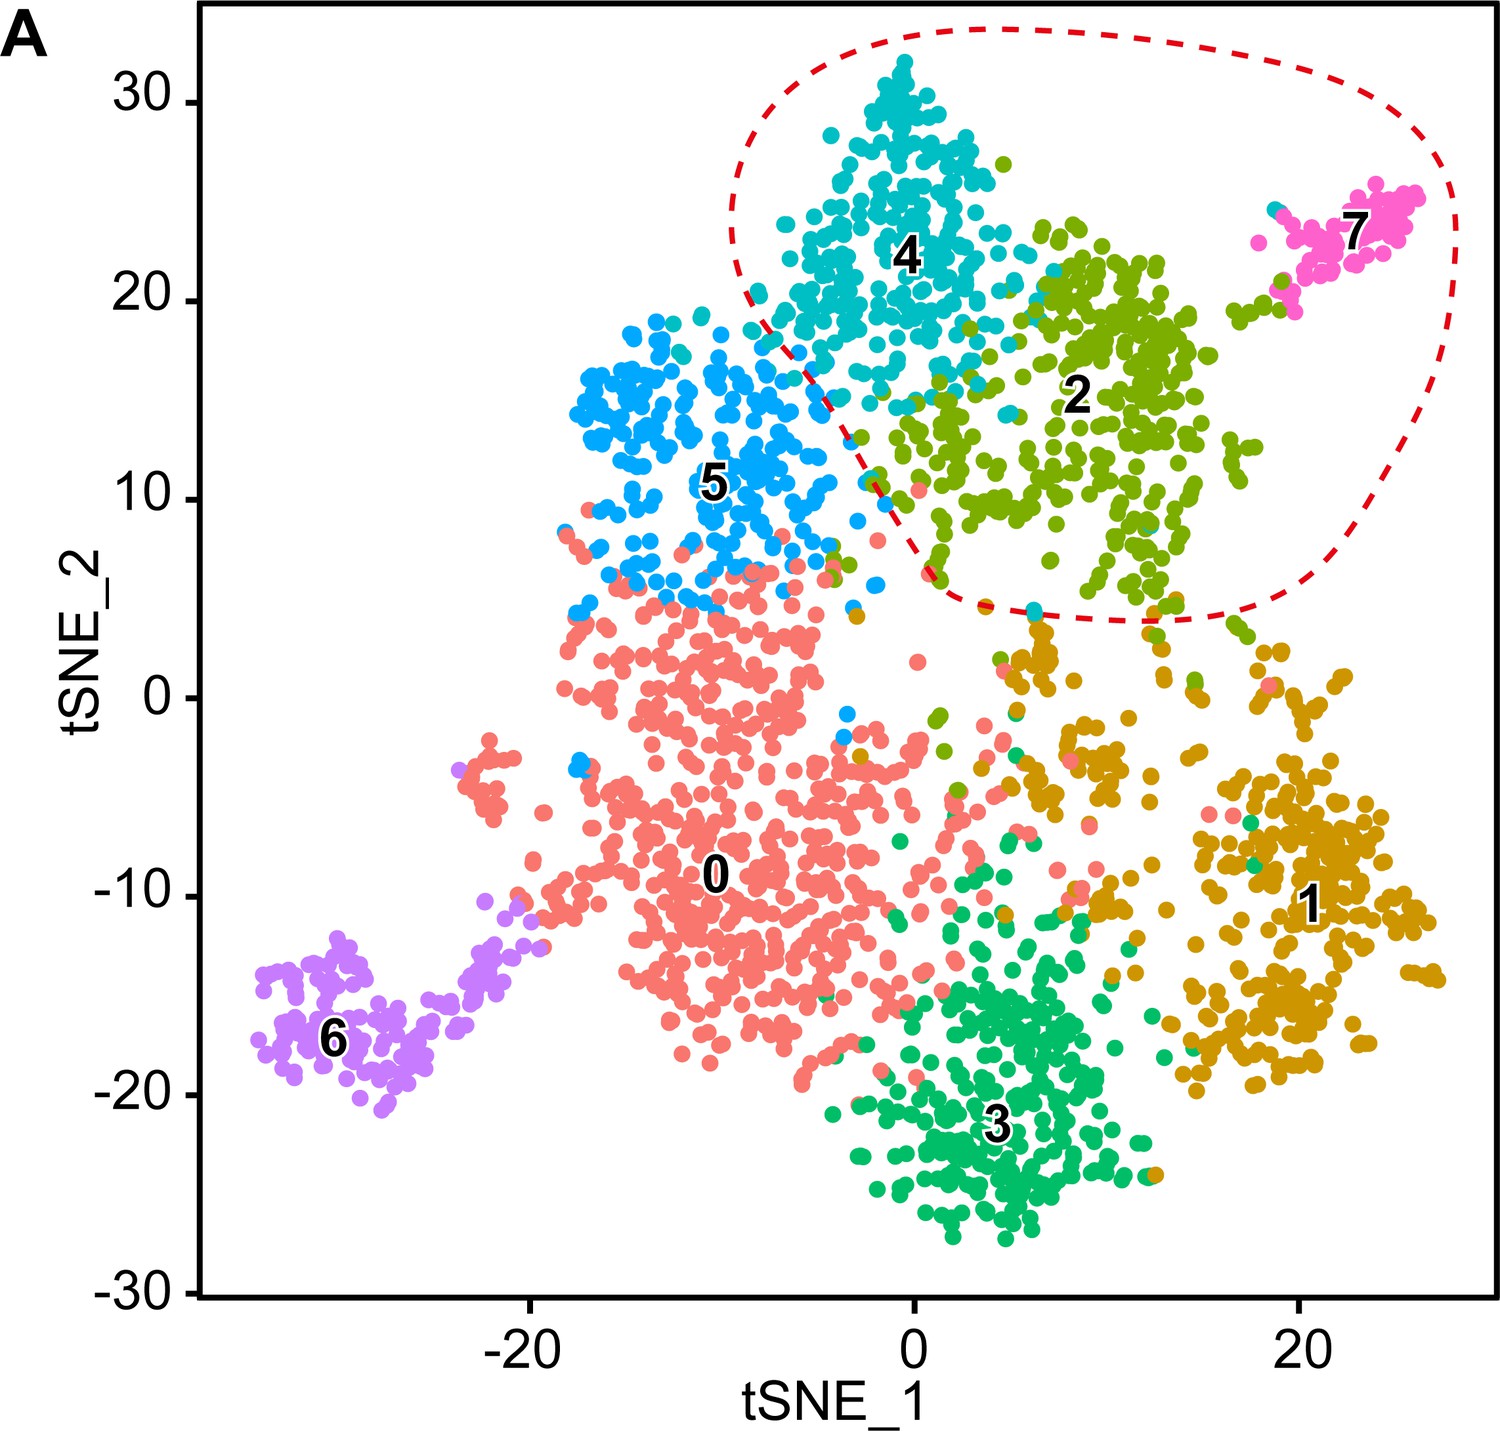
Original clusters overlaid with the tSNE plot related to single-cell sequencing analysis of sciatic nerve cells handled with Smart-Seq2 covering the various integrated time points.
(A) tSNE plot overlaid with the clusters generated upon initial data treatment of Smart-Seq2 single-cell RNA sequencing integrating cells derived from P1, P5, P14, and P60. The clusters 2, 4, and 7 were merged in a single cluster group labeled myelinating Schwann cells (mSC) in the final tSNE (see Figure 4A). Default numbering and colors are shown for each cluster.
Figure 4—figure supplement 2
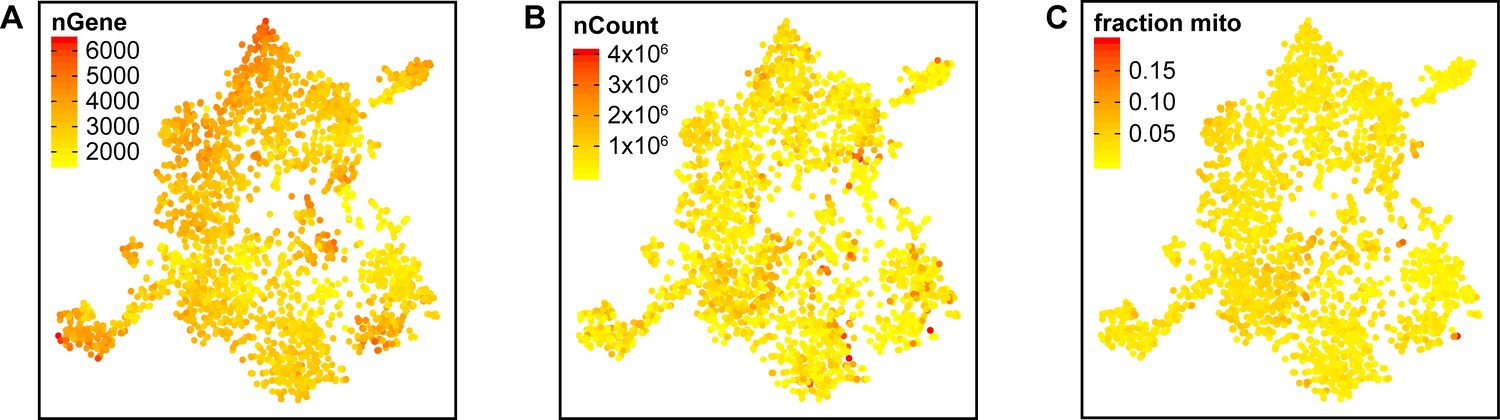
Integrated tSNE plot of Schwann cells handled with Smart-Seq2 depicting the gene detection depth per cell.
(A) tSNE plot color coded for the number of detected genes per cell (nGene). (B) tSNE plot color coded for the number of reads mapped to the transcriptome per cell (nCount). (C) tSNE plot color coded for the fraction of mitochondrial content per cell (fraction mito).
Figure 5 with 3 supplements
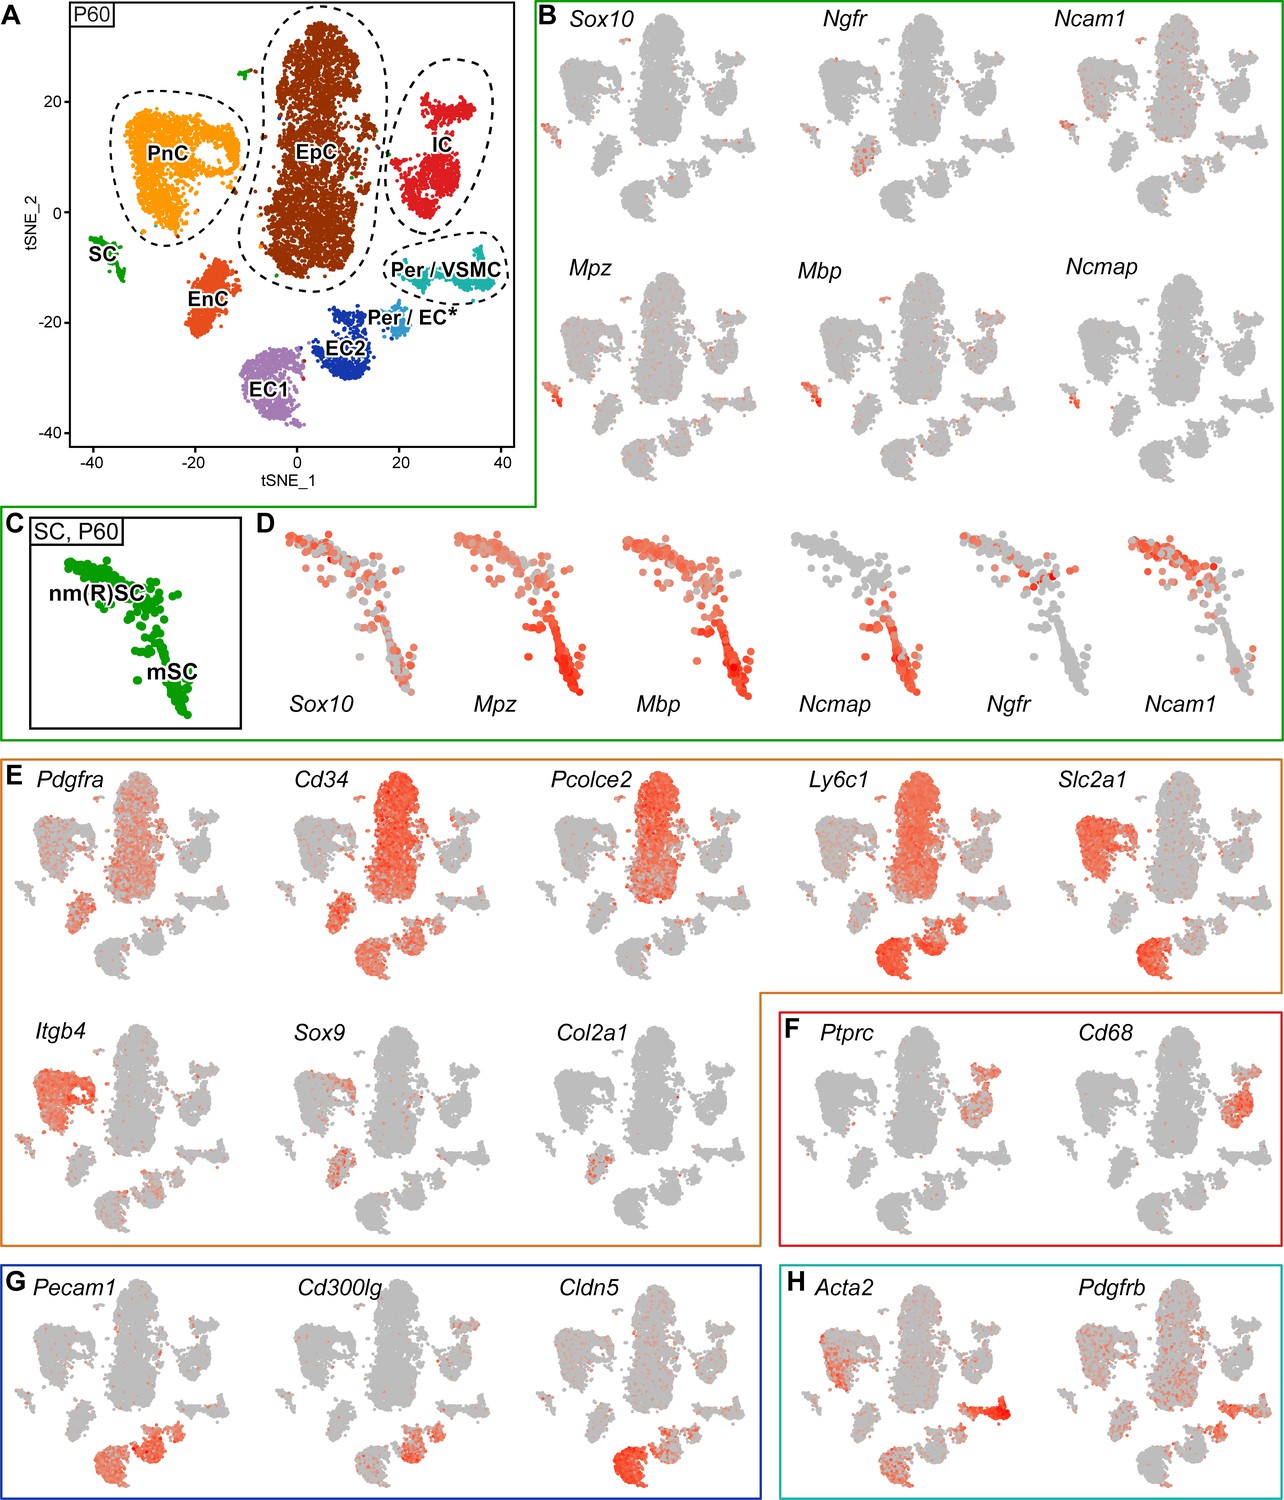
RNA single-cell profiling of sciatic nerve cells handled with 10x Genomics at P60.
(A) tSNE plot depicting the major clusters of nerve-resident cells based on RNA sequencing of single cells extracted from sciatic nerves at P60 and handled with 10x Genomics. These plots include single clusters of Schwann cells (SC), perineurial cells (PnC), endoneurial cells (EnC), epineurial cells (EpC), and immune cells (IC). Pericytes and vascular smooth muscle cells (Per/VSMC) are represented as one cluster. A second cluster marked as pericytes/endothelial cells (Per/EC*) includes defining markers of both pericytes and endothelial cells within the same cell. The tentative nature of this cluster is indicated by an asterisk (see text). Markers typical of endothelial cells form two separate clusters, marked as endothelial cells 1 and 2 (EC1, EC2). Dashed lines indicate a merge of clusters produced from the default output of the analysis (see Figure 5—figure supplement 3). (B, D–H) tSNE plots overlaid with the detected relative transcript levels. A gradient of red tones indicates relative abundance of each transcript per cell, in which dark red indicates higher levels, and gray indicates not detected. The markers described label the cluster indicated, although not always exclusively. (B–D) tSNE overview in (B), and focused on Schwann cell cluster (SC) in (D), overlaid with key markers for all SCs (Sox10), myelinating SCs (Mpz, Mbp, and Ncmap), and non-myelinating SCs (Ngfr and Ncam1). The distribution pattern of these transcripts across the cluster indicates regions enriched in nm(R)SC and in mSC (C). (E) tSNE plots overlaid with the detected relative transcript levels for EnC, PnC, and EpC clusters. All three clusters are labeled by Pdgfra, whereas Cd34 labels PnC at lower levels than EnC and EpC. The EpC cluster is labeled by Pcolce2 and Ly6c1, the PnC cluster is labeled by Slc2a1 and Itgb4, and the EnC cluster is labeled by Sox9 and Col2a1. (F) The IC cluster is labeled by Ptprc and Cd68. (G) The two clusters representing endothelial cells (EC1 and EC2) are both labeled by Pecam1, as is the Per/EC cluster. The EC2 cluster is predominantly labeled by expression of the marker Cd300lg, whereas the EC1 cluster is labeled by the tight junction marker Cldn5. (H) The Per/VSMC cluster is labeled by Acta2 and Pdgfrb. See also Figure 5—figure supplement 1, Figure 5—figure supplement 2 and Figure 5—figure supplement 3.
Figure 5—figure supplement 1
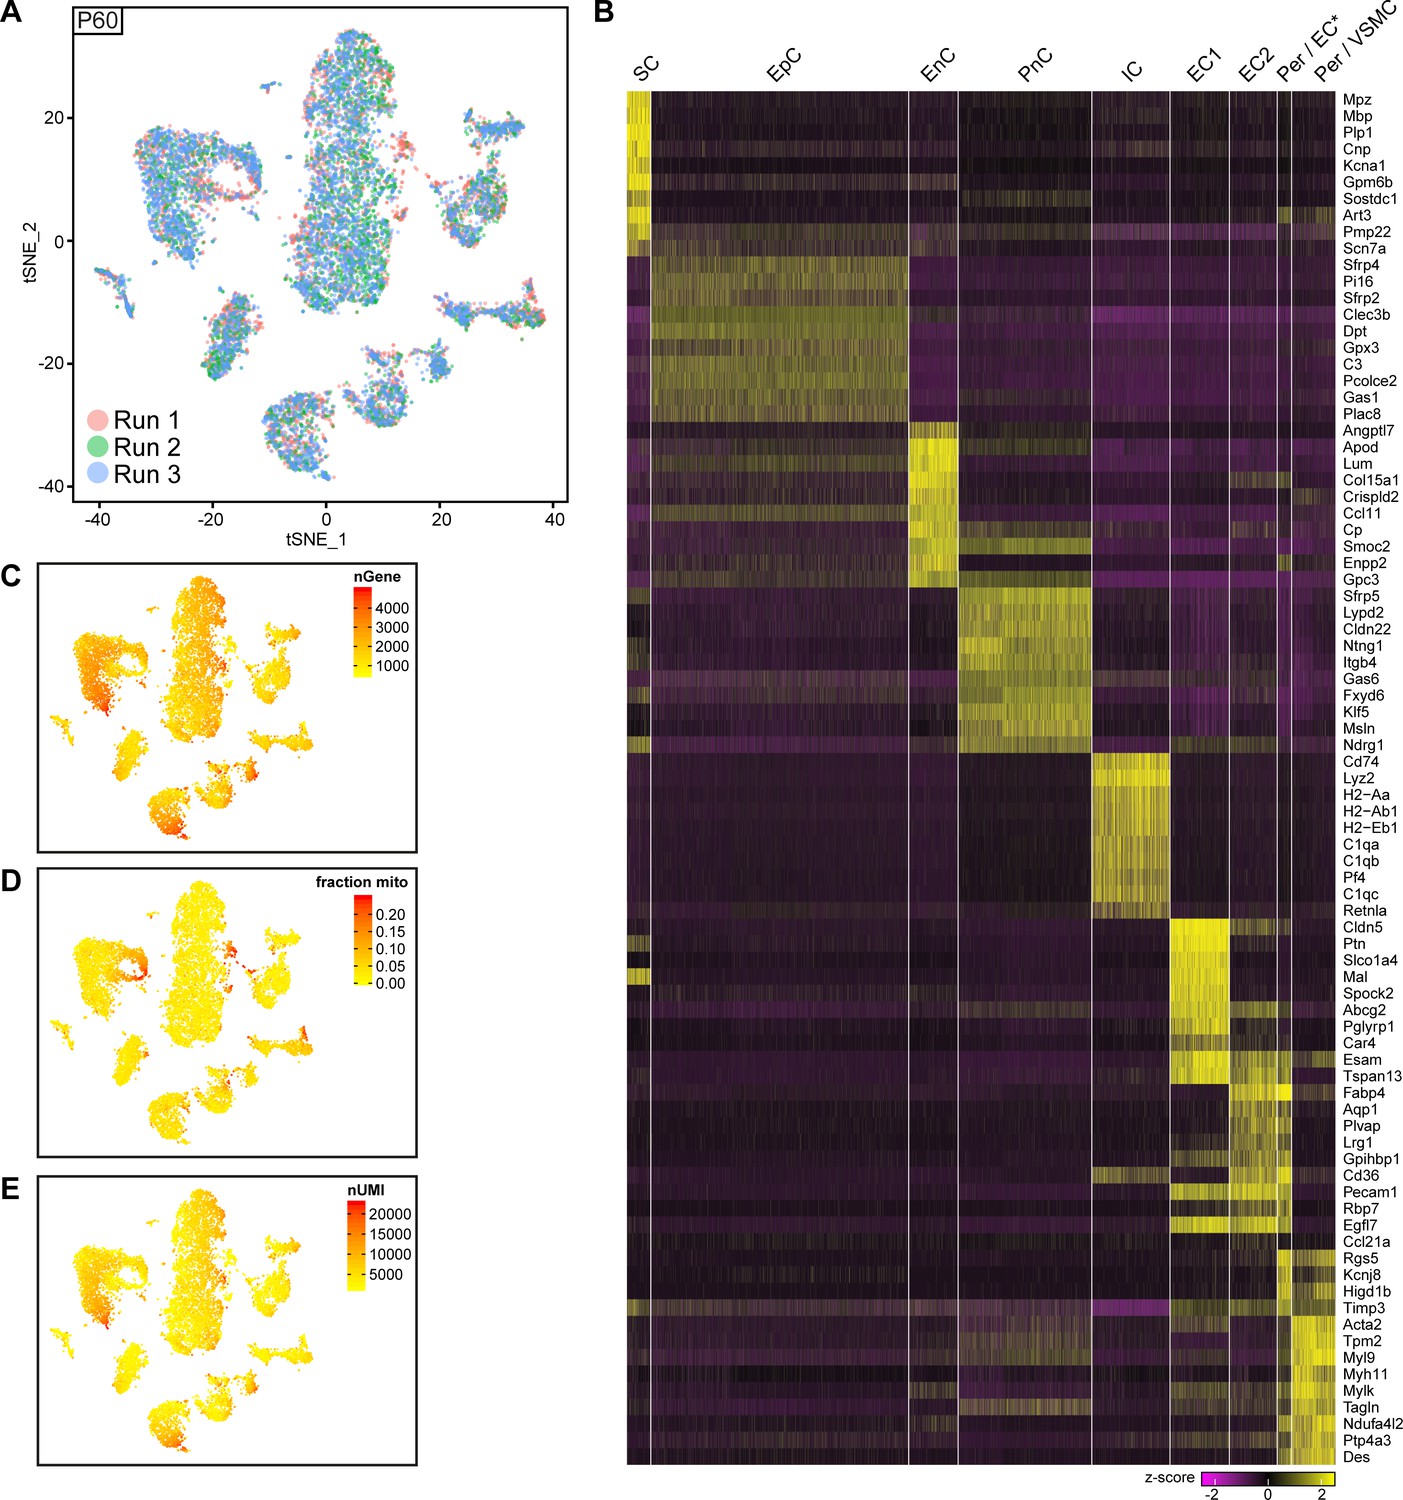
Integrated tSNE plot of nerve cells handled with 10x Genomics at P60, encoding the chromium run that each cell derives from, the most enriched transcripts per cluster, and the gene detection depth per cell.
(A) tSNE depicting nerve cells at P60 handled with 10x Genomics, in which cells are color-coded according to the independent chromium run they were processed with (labelled as run 1, 2, and 3). Cells from all runs can be found in each cluster. (B) Heat map depicting row z-scores of the 10 genes with the most enriched transcripts per cluster within the dataset. (C) tSNE plot as shown in (A) color coded for the number of detected genes per cell (nGene). (D) tSNE plot as shown in (A) color coded for the fraction of mitochondrial content per cell (fraction mito). (E) tSNE plot as shown in (A) color coded for the number of unique molecular identifiers detected per cell (nUMI).
Figure 5—figure supplement 2
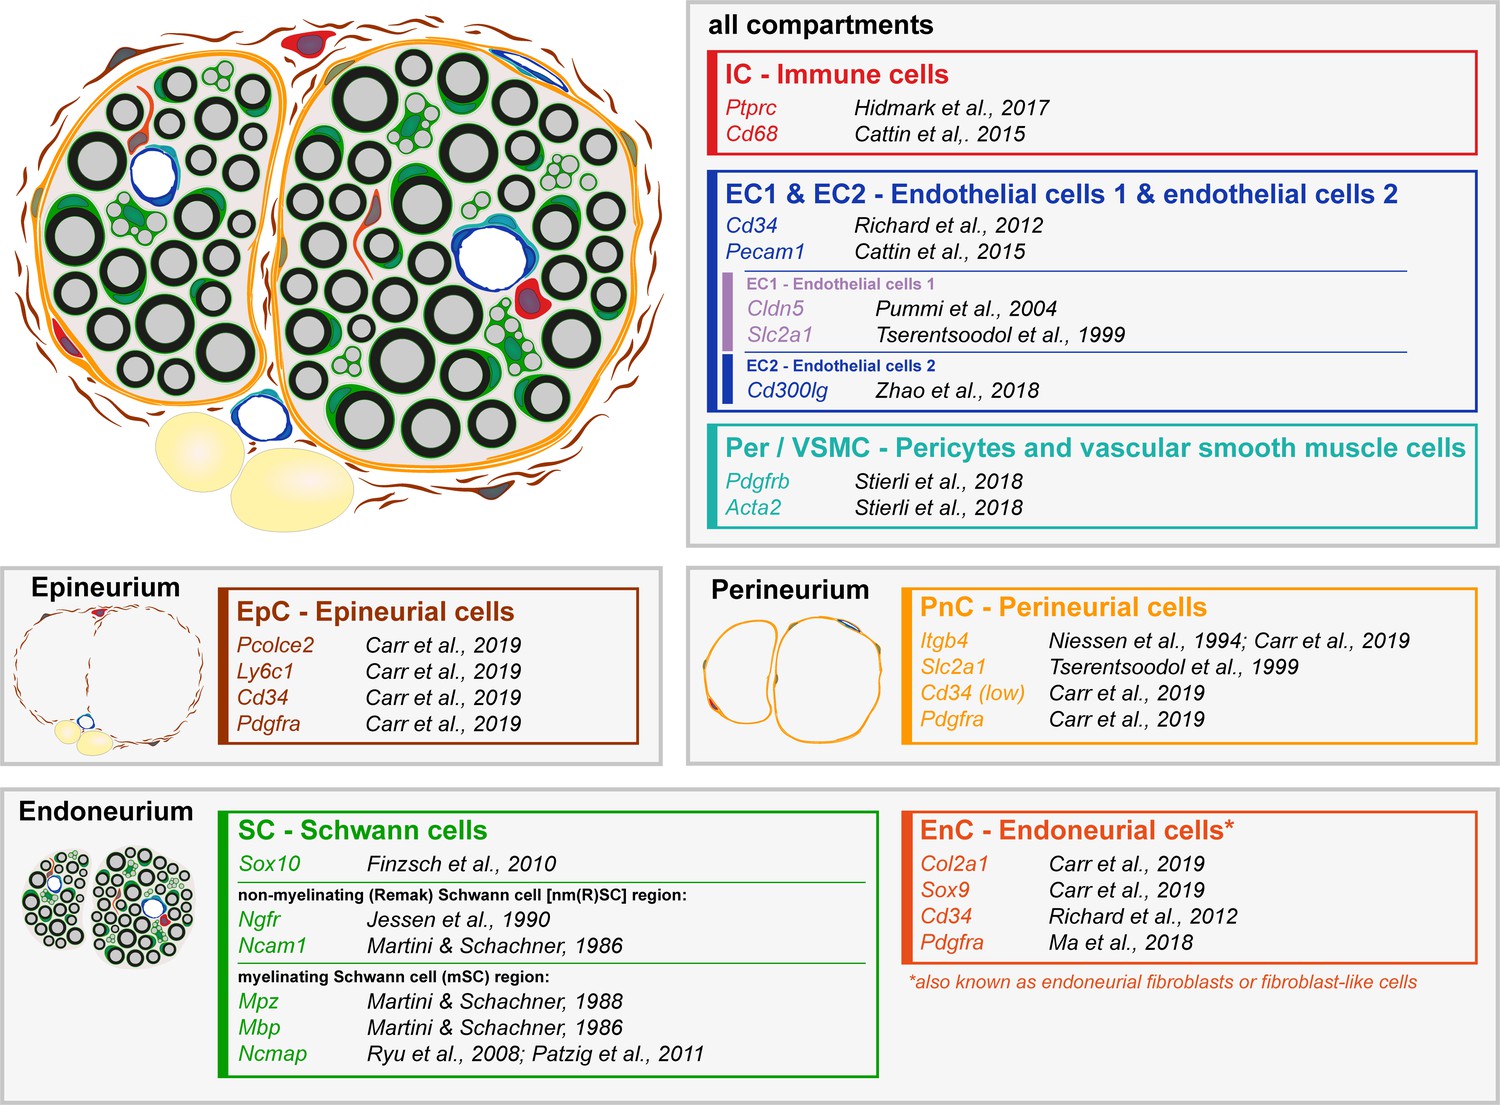
Schematic representation of a sciatic nerve cross-section with the major cell types distributed in the different nerve layers.
Major cell types detected in single-cell RNA sequencing at P60 (Figure 5) are schematically represented in a sciatic nerve cross-section. Exemplary markers used in the identification of the clusters are shown next to the respective citations. The endoneurium compartment contains myelinating Schwann cells (mSC), non-myelinating Schwann cells (nm(R)SC) and endoneurial cells (EnC, also known as endoneurial fibroblasts or fibroblast-like cells). The perineurium contains perineurial cells (PnC). The epineurium contains epineurial cells (EpC), and also epineurial adipocytes (in yellow; not represented in the tSNE plot as a separate cluster). The nerve also contains immune cells (IC), endothelial cells (EC1, EC2), pericytes, and vascular smooth muscle cells (Per/VSMC). The various nerve compartments (endoneurium, perineurium and epineurium) are vascularized, and immune cells are associated with the different layers (including within the vessels).
Figure 5—figure supplement 3
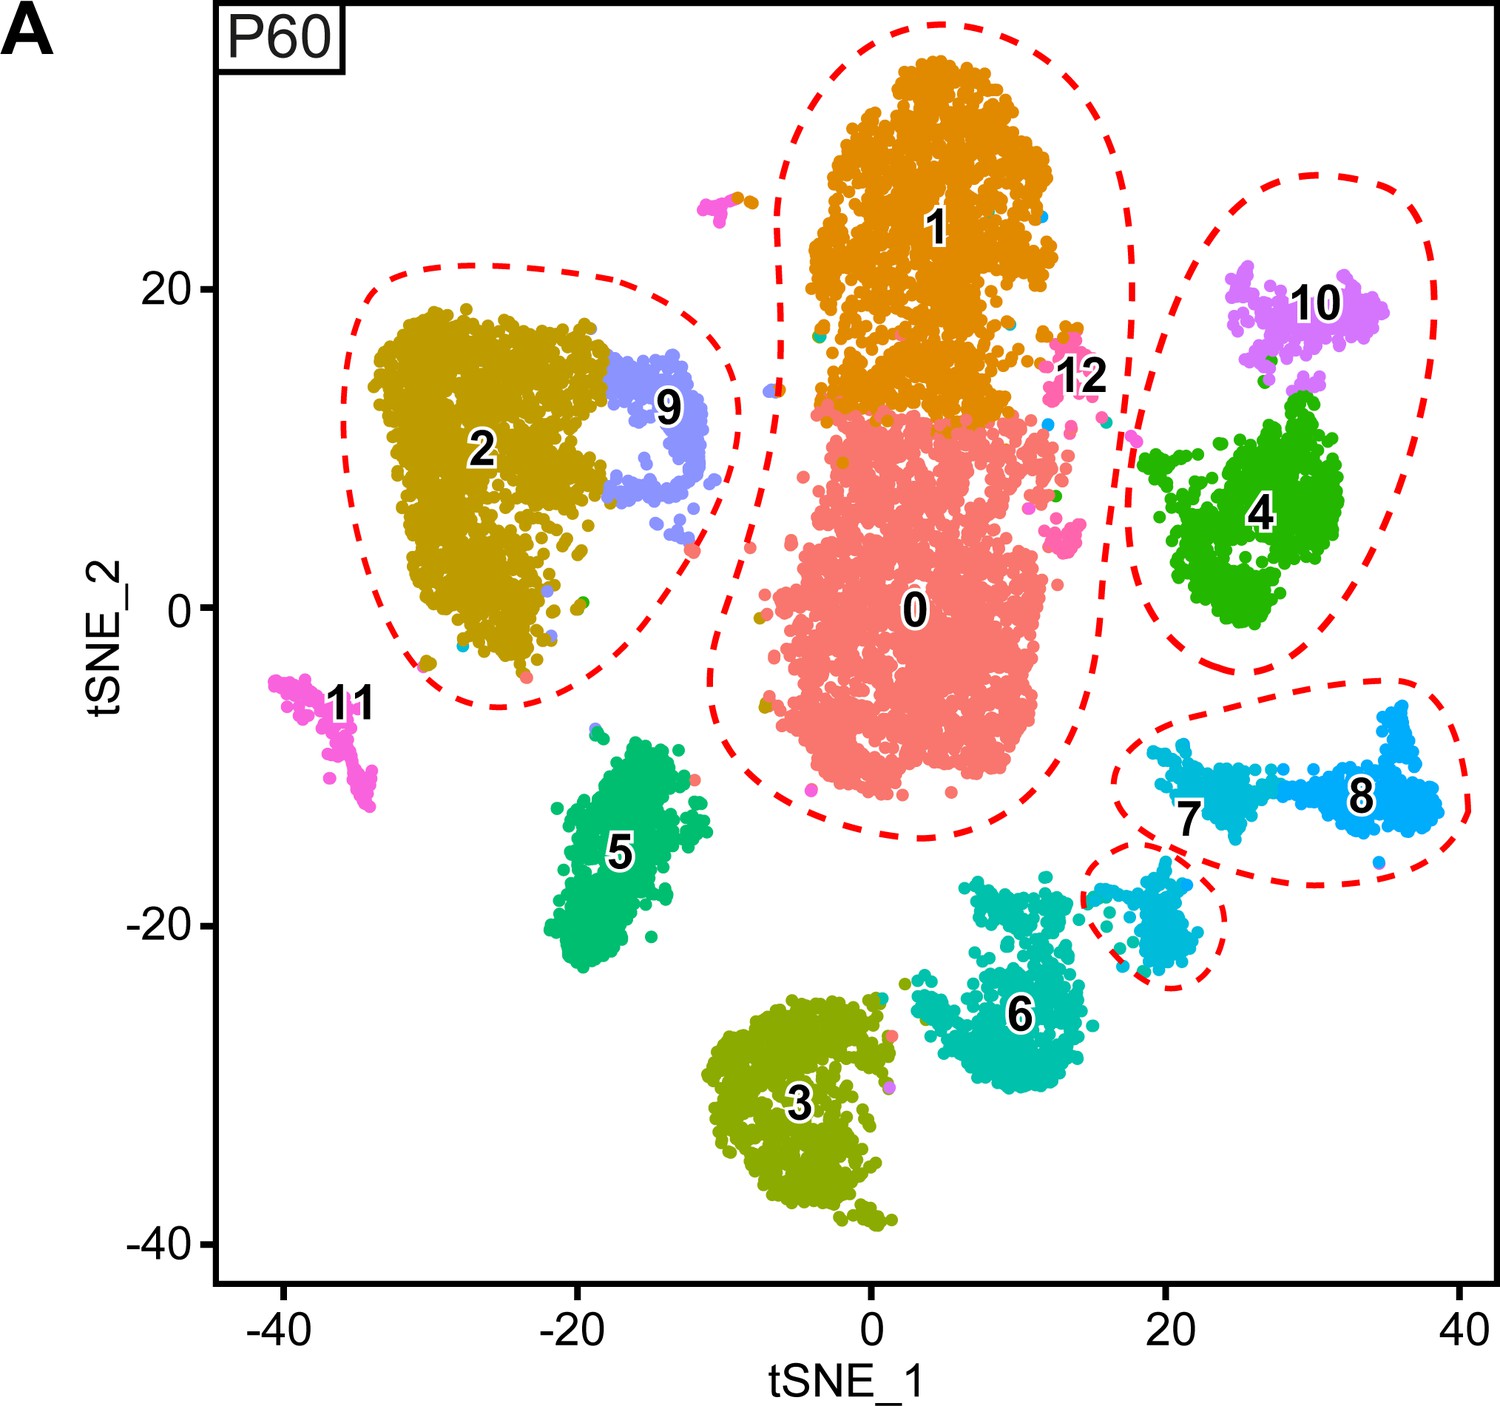
Original clusters overlaid with tSNE plots related to single-cell sequencing analysis of sciatic nerve cells handled with 10x Genomics at P60.
(A) tSNE plots overlaid with the clusters generated upon initial data treatment of 10x Genomics single-cell RNA sequencing at P60. The clusters 4 and 10 were merged in a single cluster labeled immune cells (IC) in the final tSNE. The clusters 2 and 9 were merged in a single cluster labeled perineurial cells (PnC) in the final tSNE. The clusters 1, 0, and 12 were merged in a single cluster labeled epineurial cells (EpC) in the final tSNE. The lower island of cluster seven was split from the pericytes and vascular smooth muscle cells (Per/VSMC) cluster in the final tSNE because it also contains the endothelial cell marker Pecam1, and is therefore now marked pericyte/endothelial cell cluster (Per/EC*). Clusters 7 and 8 were merged as a single cluster labeled pericytes and vascular smooth muscle cells (Per/VSMC) in the final tSNE. See final tSNE on (Figure 5A). Default numbering and colors are shown for each cluster.
Figure 6 with 2 supplements
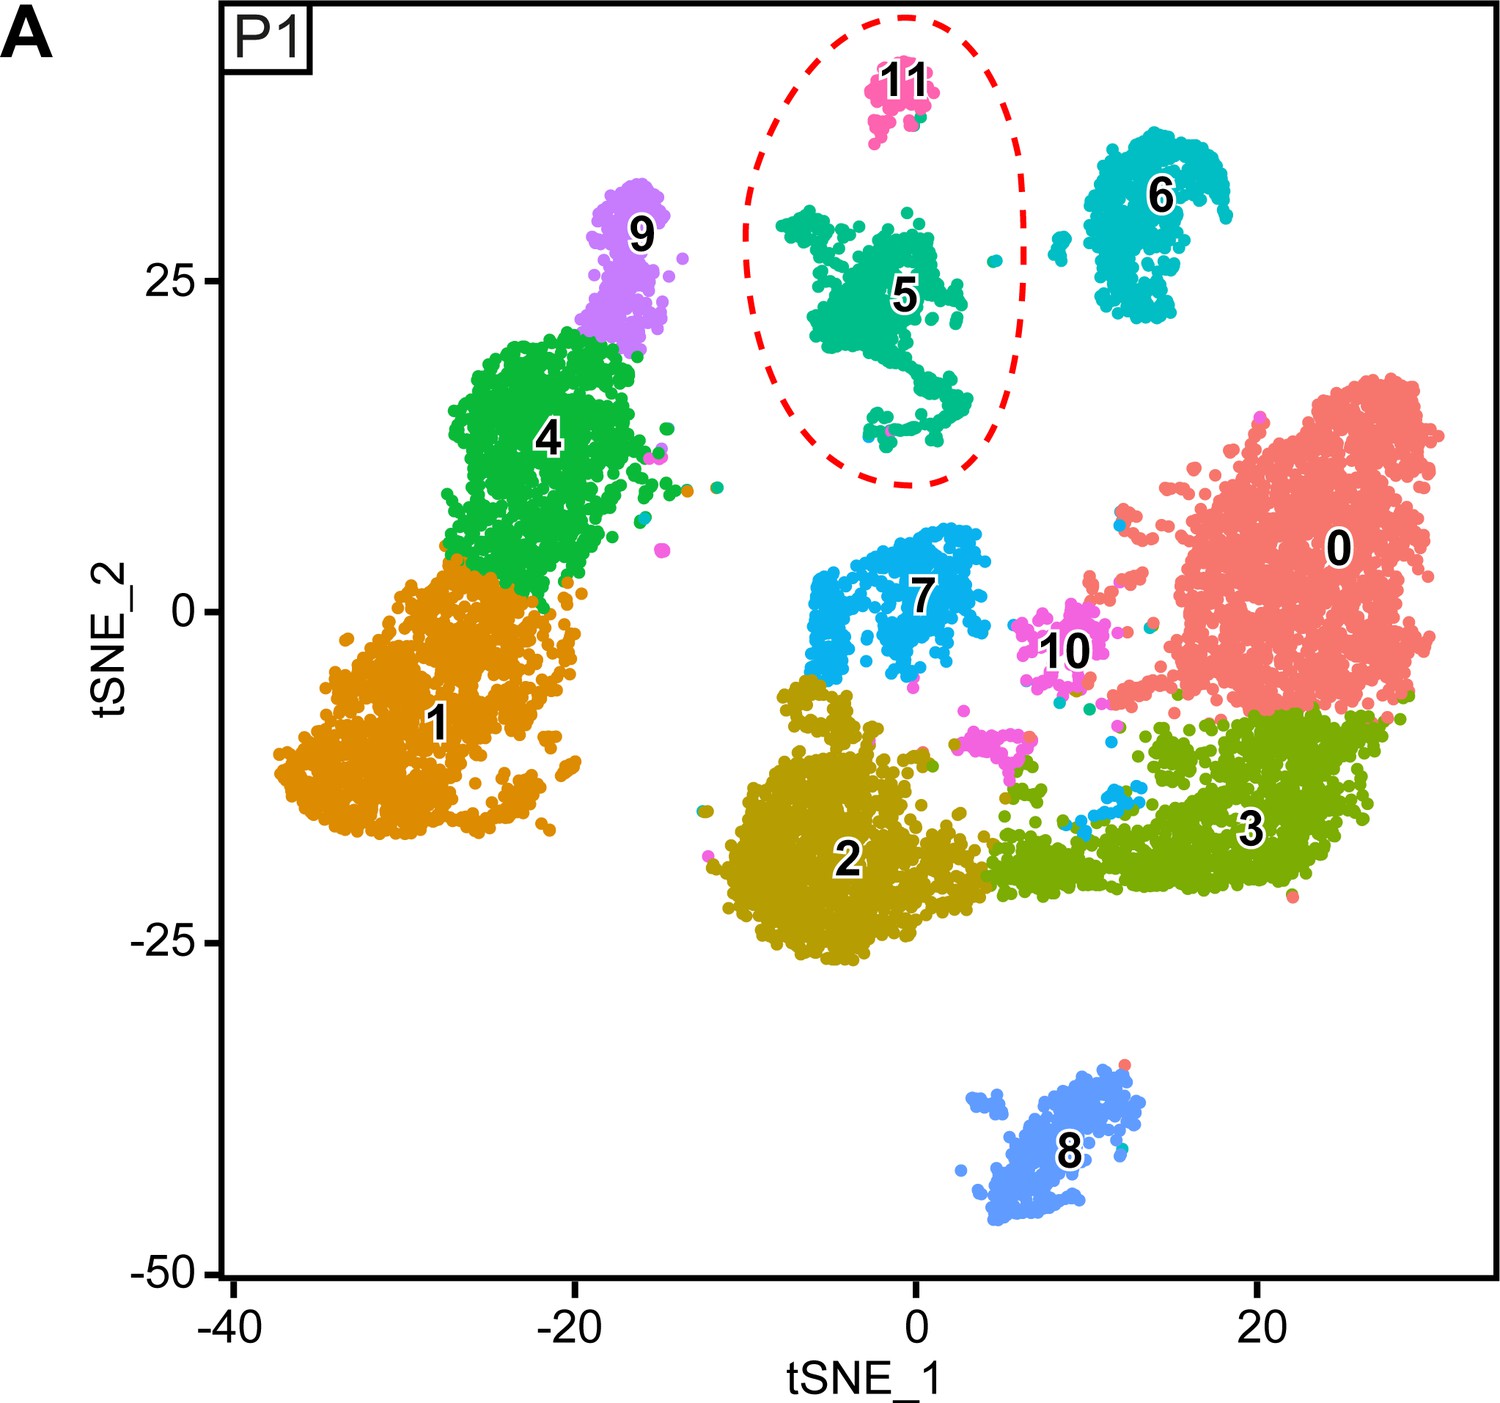
RNA single-cell profiling of sciatic nerve cells handled with 10x Genomics at postnatal day 1.
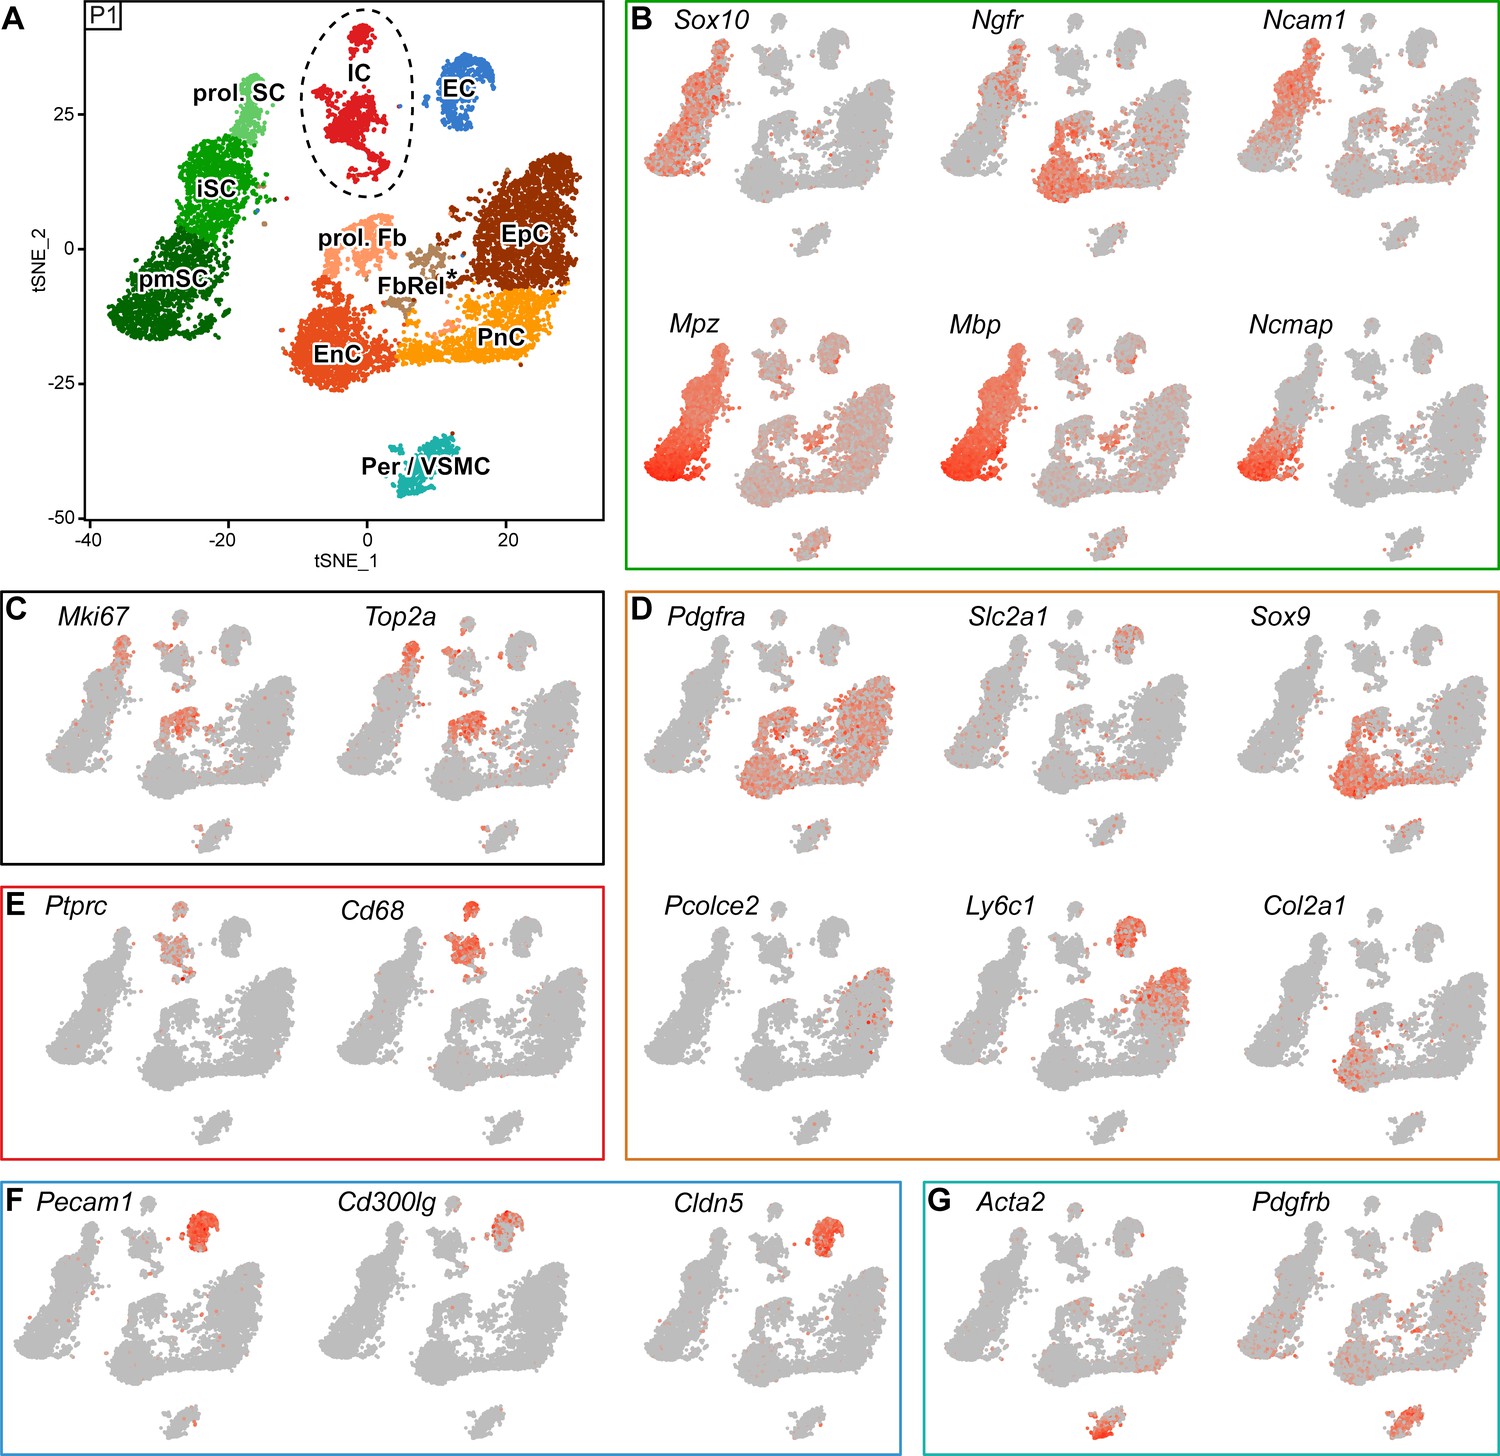
(A) tSNE plot depicting the major clusters of nerve resident cells at P1 and handled with 10x Genomics. These include single clusters of pericytes and vascular smooth muscle cells (Per/VSMC), endothelial cells (EC), immune cells (IC), perineurial cells (PnC), endoneurial cells (EnC), and epineurial cells (EpC). Schwann cells (SCs) are represented as three clusters, including proliferating Schwann cells (prol. SC), immature Schwann cells (iSC) and pro-myelinating Schwann cells (pmSCs). In addition, another cluster expressing markers typical of proliferating cells was marked as proliferating fibroblast-like cells (prol. Fb), and a cluster located between EnC, PnC and EpC was marked as fibroblast-related cluster (FbRel*). The tentative nature of this cluster is indicated by an asterisk (see text). Dashed lines indicate a merge of clusters produced from the default output of the analysis (see Figure 6—figure supplement 2). (B–G) tSNE plots overlaid with the detected relative transcript levels. A gradient of red tones indicates relative abundance of each transcript per cell, in which dark red indicates higher levels, and gray indicates not detected. The markers described here label the indicated cluster also at P60 (see Figure 5), although not always exclusively. (B) All SC clusters are labeled by expression of Sox10. The iSC and prol. SC clusters are labeled by Ncam1 and Ngfr, whereas the pmSC cluster is labeled by Ncmap and is enriched in Mpz and Mbp. (C) The proliferating cell clusters (prol. SC and prol. Fb) are labeled by Mki67 and Top2a. (D) tSNE plots overlaid with the detected relative transcript levels for EnC, PnC, and EpC clusters. All three clusters are labeled by Pdgfra. The PnC cluster is moderately labeled by Slc2a1, the EnC cluster is labeled by Sox9 and Col2a1, and the EpC cluster is labeled by Ly6c1 and Pcolce2. (E) The IC cluster is labeled by Ptprc and Cd68. (F) The EC cluster is labeled by Pecam1, Cldn5, and in part Cd300lg. (G) The Per/VSMC cluster is labeled by Acta2 and Pdgfrb. See also Figure 6—figure supplement 1 and Figure 6—figure supplement 2.
Figure 6—figure supplement 1
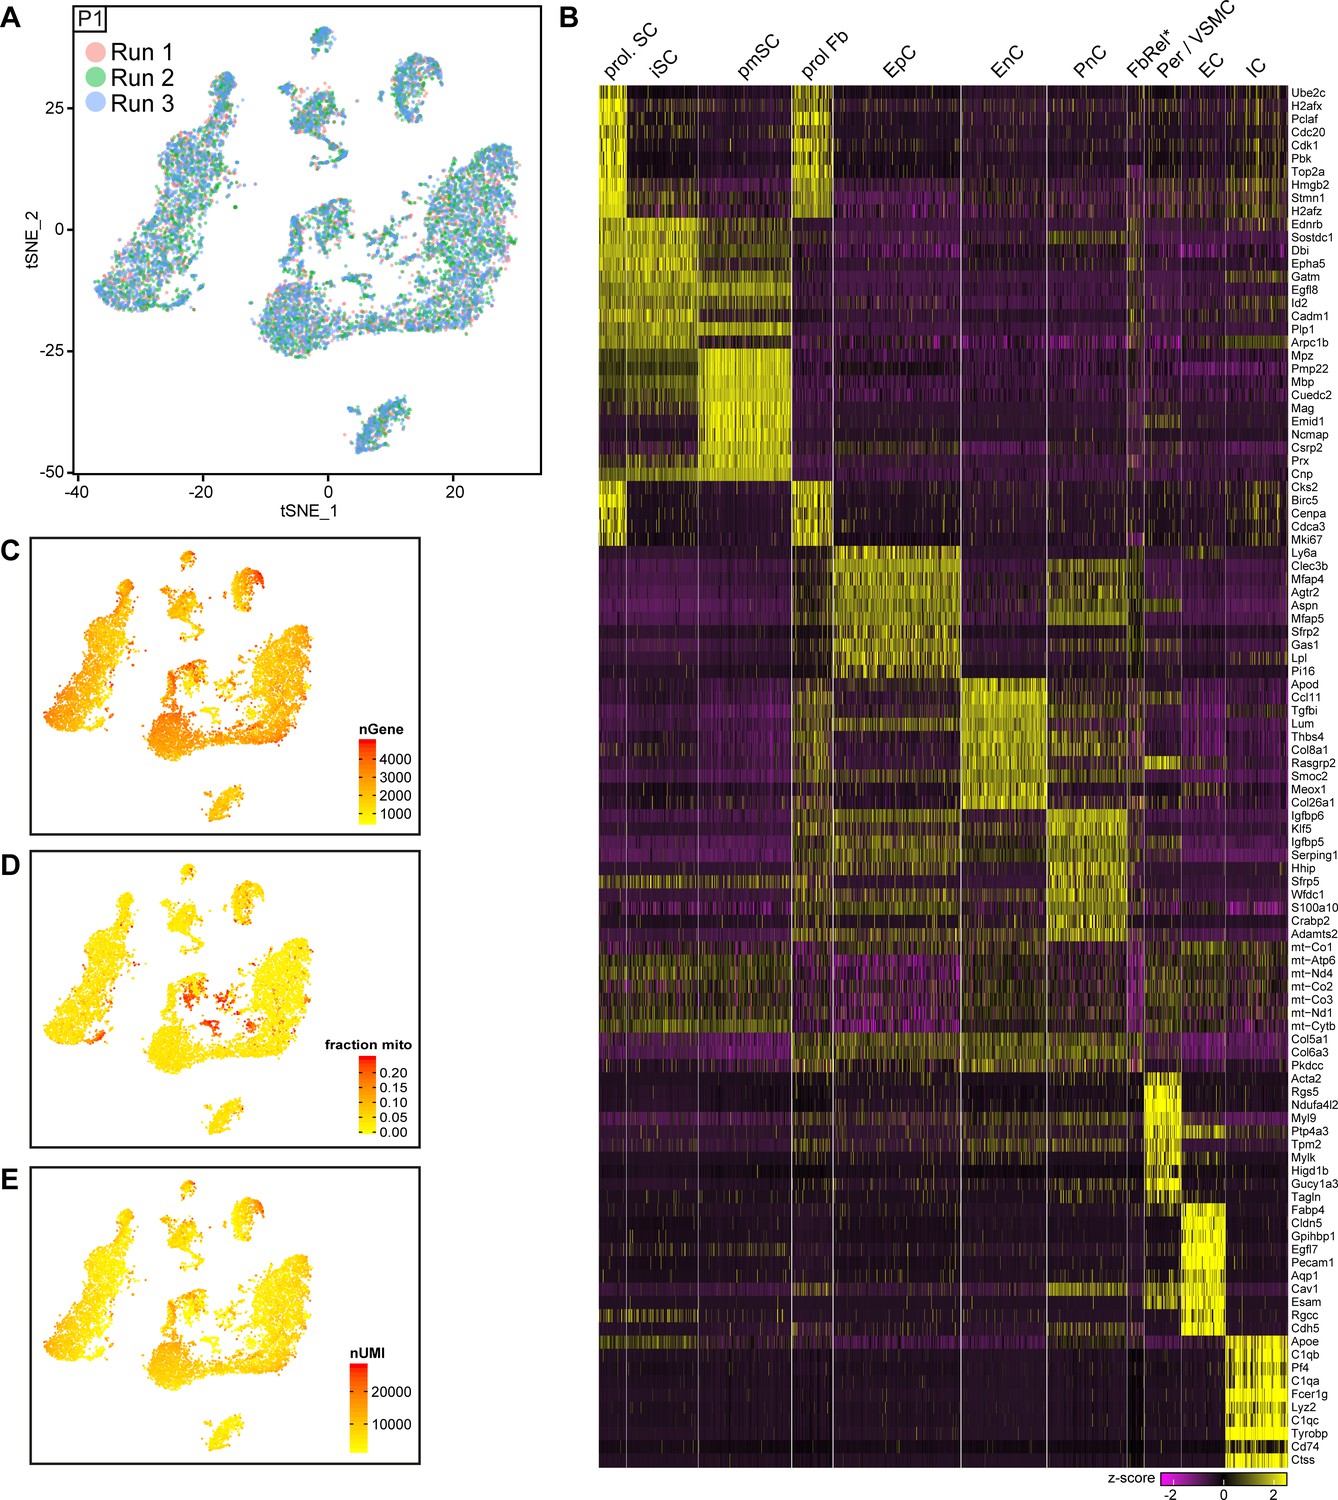
Integrated tSNE plot of nerve cells handled with 10x Genomics at P1, encoding the chromium run that each cell derives from, the most enriched transcripts per cluster, and the gene detection depth per cell.
(A) tSNE depicting nerve cells at P1 handled with 10x Genomics, in which cells are color-coded according to the independent chromium run they were processed with (labeled as run 1, 2, and 3). Cells from all runs can be found in each of the clusters. (B) Heat map depicting row z-scores of the 10 genes with the most enriched transcripts per cluster within the dataset. (C) tSNE plot as shown in (A), color coded for the number of detected genes per cell (nGene). (D) tSNE plot as shown in (A), color coded for the fraction of mitochondrial content per cell. The FbRel cluster is particularly enriched in mitochondrial genes (fraction mito). (E) tSNE plot as shown in (A) color coded for the number of unique molecular identifiers detected per cell (nUMI).
Figure 6—figure supplement 2
Original clusters overlaid with tSNE plots related to single-cell sequencing analysis of sciatic nerve cells handled with 10x Genomics at P1.
(A) tSNE plots overlaid with the clusters generated upon initial data treatment of 10x Genomics single-cell RNA sequencing at P1. The clusters 5 and 11 were merged in a single cluster labeled immune cells (IC) in the final tSNE (see Figure 6A). Default numbering and colors are shown for each cluster.
Tables
Key resources table
| Reagent type (species) or resource | Designation | Source or reference | Identifiers | Additional information |
|---|---|---|---|---|
| Genetic reagent (M. musculus) | GtROSA26Sor < tm1(EYFP)Cos> | Jackson Laboratory | RRID:IMSR_JAX:006148 | PMID:11299042 |
| Genetic reagent (M. musculus) | B6.Cg-Tg(CAG-DsRed*MST)1Nagy/J | Jackson Laboratory | RRID:IMSR_JAX:006051 | PMID:15593332 |
| Genetic reagent (M. musculus) | Tg(MPZ-cre)26Mes/J | Jackson Laboratory | RRID:IMSR_JAX:017927 | PMID:10586237 |
| sequence-based reagent | Genotyping primer: DsRed forward | Jackson Laboratory Protocol 22460 Standard PCR Assay - Tg(DsRed), version 1.3 | 5’-CCCCGTAATGCAGAAGAAGA-3’ | |
| Sequence-based reagent | Genotyping primer: DsRed reverse | Jackson Laboratory Protocol 22460 Standard PCR Assay - Tg(DsRed), version 1.3 | 5’-GGTGATGTCCAGCTTGGAGT-3’ | |
| Sequence-based reagent | Genotyping primer: Cre forward | PMID:30648534 | 5’-ATCGCCAGGCGTTTTCTGAGCATAC-3’ | |
| Sequence-based reagent | Genotyping primer: Cre reverse | PMID:30648534 | 5’-GCCAGATTACGTATATCCTGGCAGC-3’ | |
| Sequence-based reagent | Genotyping primer: Rosa26-loxPstoploxP-YFP forward | PMID:15905512 | 5’-AAAGTCGCTCTGAGTTGTTAT-3’ | |
| Sequence-based reagent | Genotyping primer: Rosa26-loxPstoploxP-YFP wildtype reverse | PMID:15905512 | 5’-GGAGCGGGAGAAATGGATATG-3’ | |
| Sequence-based reagent | Genotyping primer: Rosa26-loxPstoploxP-YFP transgenic reverse | PMID:15905512 | 5’-GCGAAGAGTTTGTCCTCAACC-3’ | |
| Sequence-based reagent | Oligo-dT30VN | PMID:24385147 | 5'-Biot–AAGCAGTGGTATCAACGCAGAGTACT30VN-3' | |
| Sequence-based reagent | Template-switch oligo (TSO) | PMID:24385147 | 5'-Biot-AAGCAGTGGTATCAACGCAGAGTACATrGrG+G-3'(rG = riboguanosine;+G = LNA-modified guanosine) | |
| Sequence-based reagent | ISPCR | PMID:24385147 | 5'-Biot-AAGCAGTGGTATCAACGCAGAGT-3' | |
| Sequence-based reagent | Nextera XT 384 UDIs primer set | Integrated DNA Technologies | ||
| Commercial assay or kit | TruSeq Stranded mRNA Sample Prep Kit | Illumina, San Diego, CA, USA | 20020595 | |
| Commercial assay or kit | SuperScript II Reverse Transcriptase | Thermo Fischer | 18064014 | |
| Commercial assay or kit | KAPA HiFi HotStart ReadyMix | Roche | KK2601 | |
| Commercial assay or kit | Illumina Nextera XT Index Kit | Illumina, San Diego, CA, USA | FC-131–1096 | |
| Commercial assay or kit | Chromium Single Cell 3’ Library and Gel Bead Kit v2 | 10X Genomics | PN-120237 | |
| Commercial assay or kit | Chromium Single Cell A Chip Kit | 10X Genomics | PN-120236 | |
| Commercial assay or kit | Chromium i7 Multiplex Kit | 10X Genomics | PN-120262 | |
| Commercial assay or kit | Trypsin | Sigma Aldrich, St. Louis, MO, USA | Cat#T9201 | |
| Commercial assay or kit | Collagenase type 2 | Worthington Biochemical Corporation, NJ, USA | Cat#LS004174 | |
| Commercial assay or kit | Hyaluronidase | Worthington Biochemical Corporation, NJ, USA | Cat#LS005474 | |
| Software, algorithm | Illustrator version CC | Adobe | ||
| Software, algorithm | STAR Aligner (v2.5.4b; v2.6.1.c) | PMID:23104886 | RRID:SCR_015899 | |
| Software, algorithm | Rsubread (v1.32.4) | PMID:23558742 | RRID:SCR_016945 | |
| Software, algorithm | R package Seurat (V2.3.1) | PMID:29608179; PMID:25867923 | RRID:SCR_016341 | |
| Software, algorithm | Slingshot (v1.0.0) | PMID:29914354 | RRID:SCR_017012 | |
| Software, algorithm | CellRanger (v2.0.2) | 10x Genomics | RRID:SCR_017344 | |
| Software, algorithm | fastICA package (1.2–2) | PMID:10946390 | RRID:SCR_013110 |
Additional files
-
Supplementary file 1
Detected RPKM values in bulk RNA sequencing datasets.
- https://cdn.elifesciences.org/articles/58591/elife-58591-supp1-v1.xls
-
Supplementary file 2
Identity of individual cells in the single-cell RNA sequencing datasets.
- https://cdn.elifesciences.org/articles/58591/elife-58591-supp2-v1.xls
-
Supplementary file 3
Relative enrichment of individual genes per single-cell sequencing cluster.
The file depicts the positive markers of each cell type (cluster) with the average marker gene expression in each cell type (cluster) from the merged Smart-Seq2 samples (related to Figure 4), the 10x P60 runs (related to Figure 5), and the 10x P1 runs (related to Figure 6), each displayed in individual tabs. The significance level (p_val), fold change (avg_logFC), and proportion of cells in the cluster that express the gene (pct.1 and pct.2) are also included. The positive marker identification was done by FindAllMarkers() from Seurat. For each cluster, genes with a p-value below 0.05 are considered differentially enriched.
- https://cdn.elifesciences.org/articles/58591/elife-58591-supp3-v1.xls
-
Transparent reporting form
- https://cdn.elifesciences.org/articles/58591/elife-58591-transrepform-v1.pdf
Download links
A two-part list of links to download the article, or parts of the article, in various formats.
Downloads (link to download the article as PDF)
Open citations (links to open the citations from this article in various online reference manager services)
Cite this article (links to download the citations from this article in formats compatible with various reference manager tools)
Transcriptional profiling of mouse peripheral nerves to the single-cell level to build a sciatic nerve ATlas (SNAT)
eLife 10:e58591.
https://doi.org/10.7554/eLife.58591


