Structural basis for histone variant H3tK27me3 recognition by PHF1 and PHF19
- Department of Biochemistry and Molecular Biology, School of Basic Medical Sciences, Tianjin Medical University, China
- Laboratory for Phyloinformatics, RIKEN Center for Biosystems Dynamics Research, Japan
- Department of Cardiac Surgery, Asahikawa Medical University, Japan
- Structural Genomics Consortium, University of Toronto, Canada
- Division of Chromatin Regulation, National Institute for Basic Biology, Japan
- Department of Basic Biology, School of Life Science, The Graduate University for Advanced Studies (SOKENDAI), Japan
- Centre for Advanced Research and Education, Asahikawa Medical University, Japan
- Department of Physiology, University of Toronto, Canada
Figures
Figure 1
Tudor domains of PHF1 and PHF19 preferentially recognize H3K36me3 and H3tK27me3.
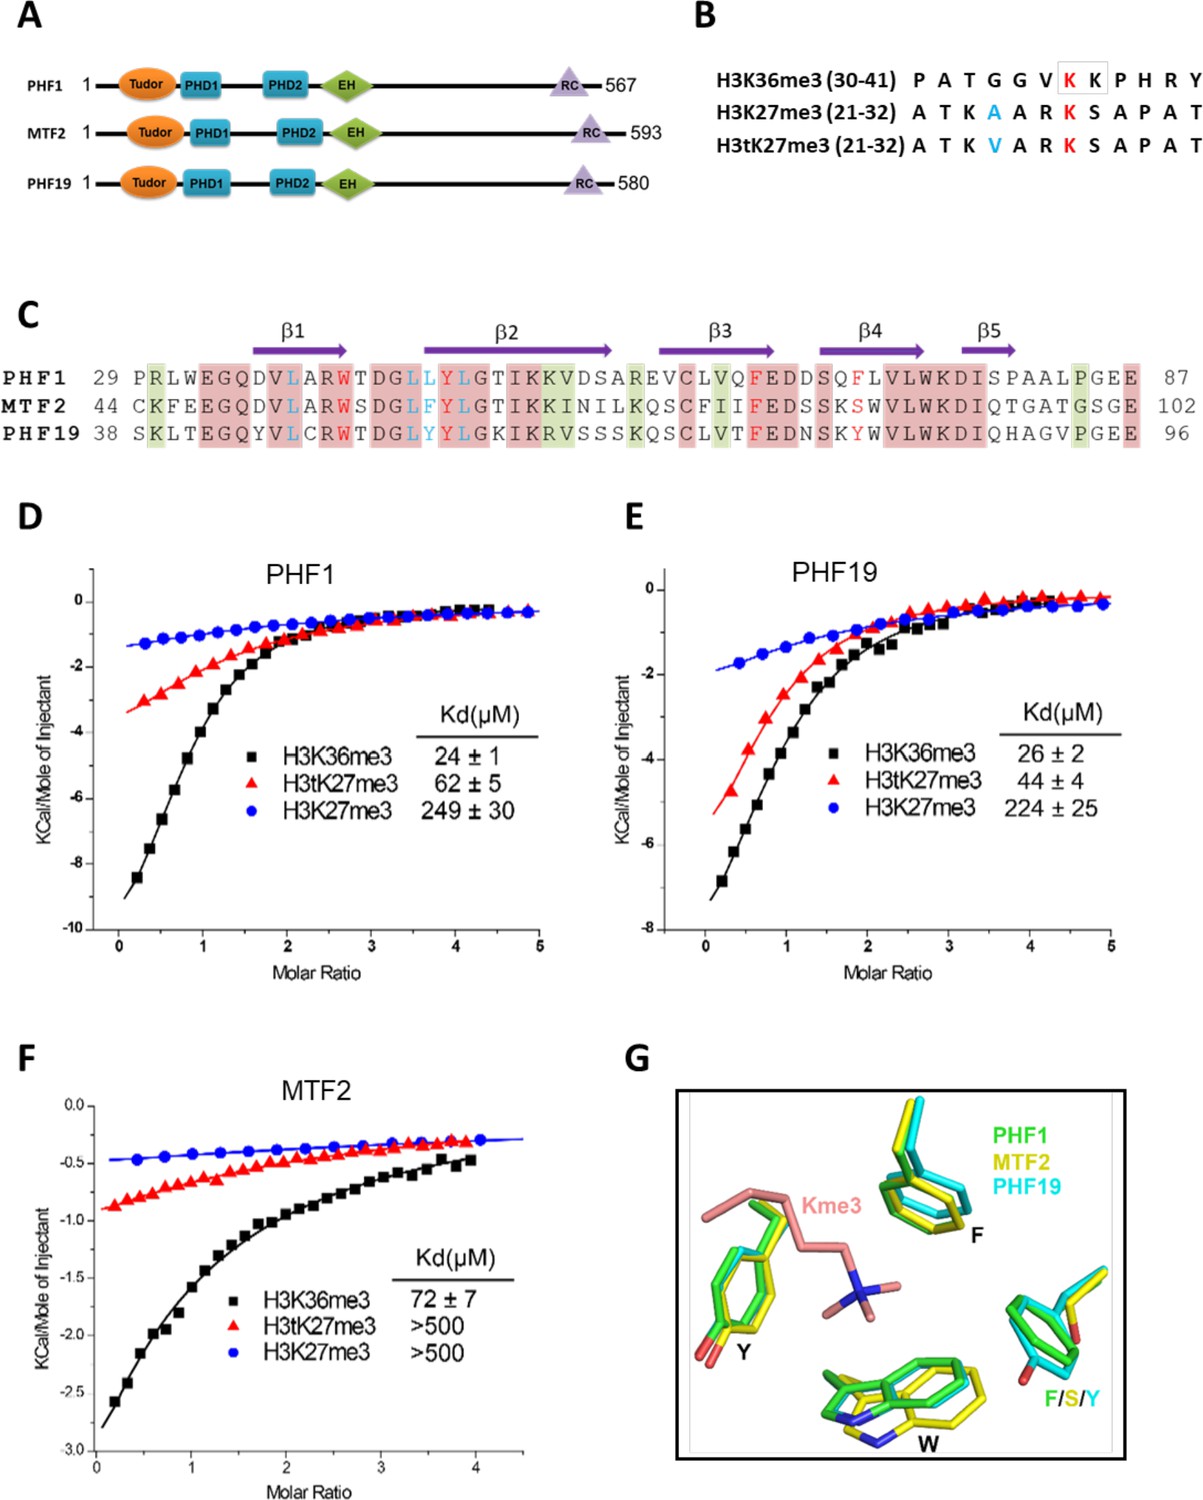
(A) Schematic representation of domain structures of PHF1, MTF2, and PHF19. PHD: plant homeodomain finger. EH: extended homologous domain. (B) Peptide sequences of H3K36me3, H3K27me3, and H3tK27me3. The methylated lysines are colored in red. A24 of histone H3 and V24 of histone H3t are colored in blue. (C) Sequence alignment of the Tudor domains of PHF1, MTF2, and PHF19. The secondary structure elements are shown above the alignment. Identical residues and conserved residues are highlighted in red and olive-green backgrounds, respectively. The residues forming the aromatic cage and the leucyl patch are colored in red and blue, respectively. (D-F) ITC measurements of the interactions of the Tudor domains of PHF1, PHF19, and MTF2 with the H3K36me3, H3tK27me3, and H3K27me3 peptides. (G) Superposition of the aromatic cage residues of PHF1-H3tK27me3 complex (green, this study), MTF2-H3K36me3 (yellow, PDB: 5XFR), and PHF19-H3tK27me3 complex (cyan, this study). The trimethyl-lysine is shown as salmon sticks.
Figure 2
PHF1 is associated with the H3t in vivo.
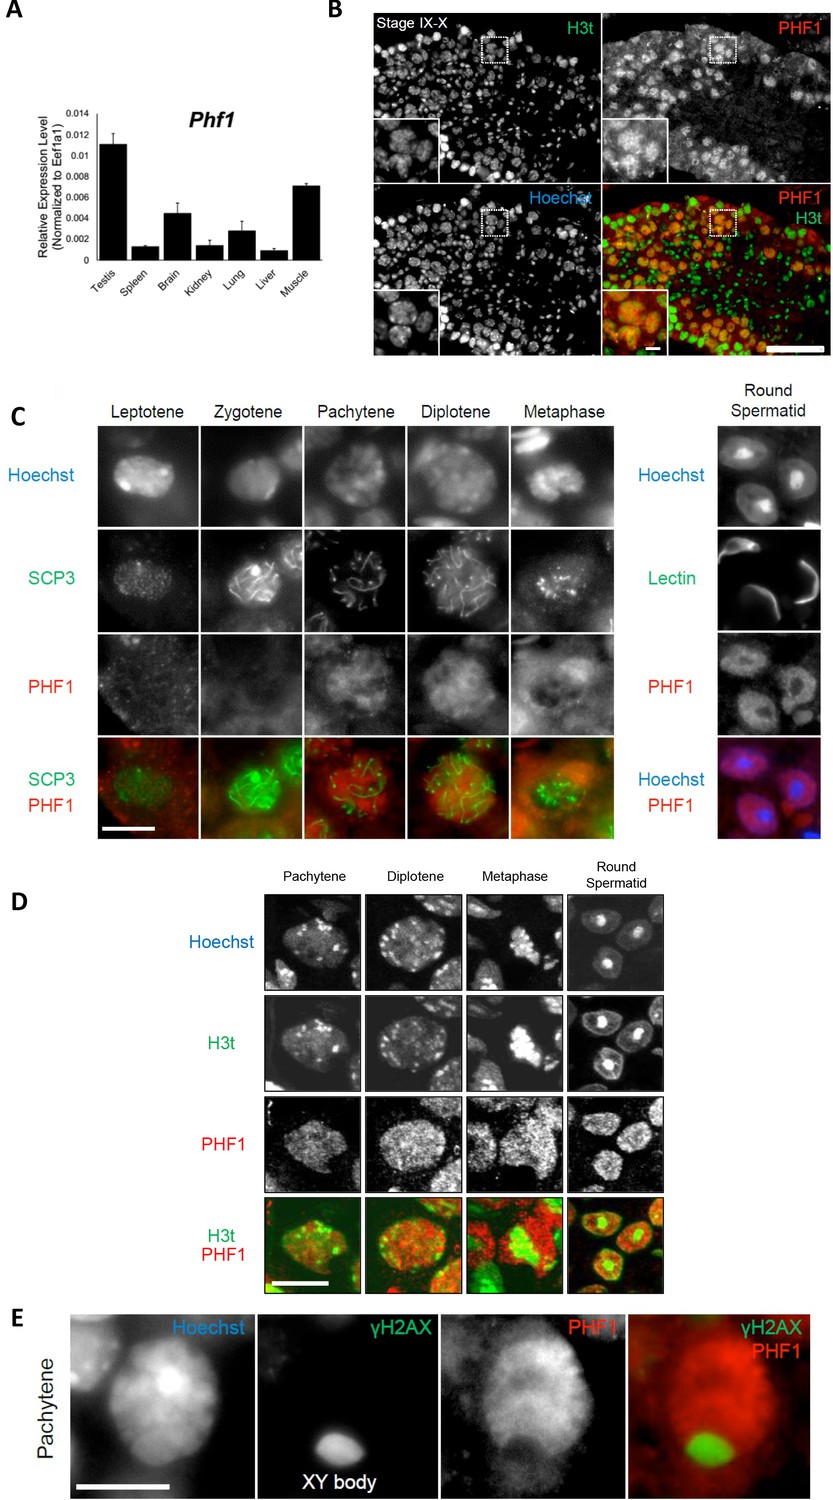
(A) Expression levels of PHF1 in different mouse tissues using the RT-qPCR analysis. (B) Immunostaining of testis sections by antibodies against H3t (green) and PHF1 (red). Seminiferous tubules at stages IX-X are indicated and magnified images of the pachytene stage nuclei are shown in each panel. Scale bars, 100 μm and 10 μm, in magnified image. (C) PHF1 expression during meiosis. Note that PHF1 started to accumulate in the nucleus from the pachytene stage. Scale bar, 10 μm. (D) PHF1 (red) and H3t (green) co-localize from the pachytene until the round spermatid stage. Scale bar, 10 μm. (E) PHF1 was excluded from the XY body. Testis sections were stained with anti-PHF1 (red) and anti–γH2AX (green) antibodies and the pachytene stage nucleus is indicated. H3t is also excluded from the XY body. Scale bar, 10 μm.
Figure 3

PHF1-Tudor could enrich H3t peptides.
(A, B) In vitro GST pull-down assays using GST-tagged PHF1-Tudor proteins and histones prepared from H3t-expressed HEK293T cells. GST proteins from input, bound, and unbound flow-through (FT) fractions were analyzed using SDS-PAGE with Coomassie Brilliant Blue (CBB) staining (A). Input and bound histones were analyzed using western blotting with indicated antibodies (B). (C) MS/MS spectrum of the histone H3t peptide corresponding to residues 19–36. The observed y and b ions and fragment map are shown. (D) Spectral counts of methylated lysine residues in input or pull-down fractions. Control histones (Input) or pooled histones pulled-down with the GST-PHF1-Tudor (pull-down) were digested with LysN proteinase and subjected to LC-MS/MS analysis (detected peptides were summarized in Supplementary file 1). The spectral counts of methylated lysine residues in each fraction are shown. Since short peptides cleaved at unmodified lysine residues could not be efficiently detected in the LC-MS/MS analysis, these data do not accurately reflect their abundance.
Figure 4
Crystal structures of PHF1/19-Tudor domain in complex with H3tK27me3.
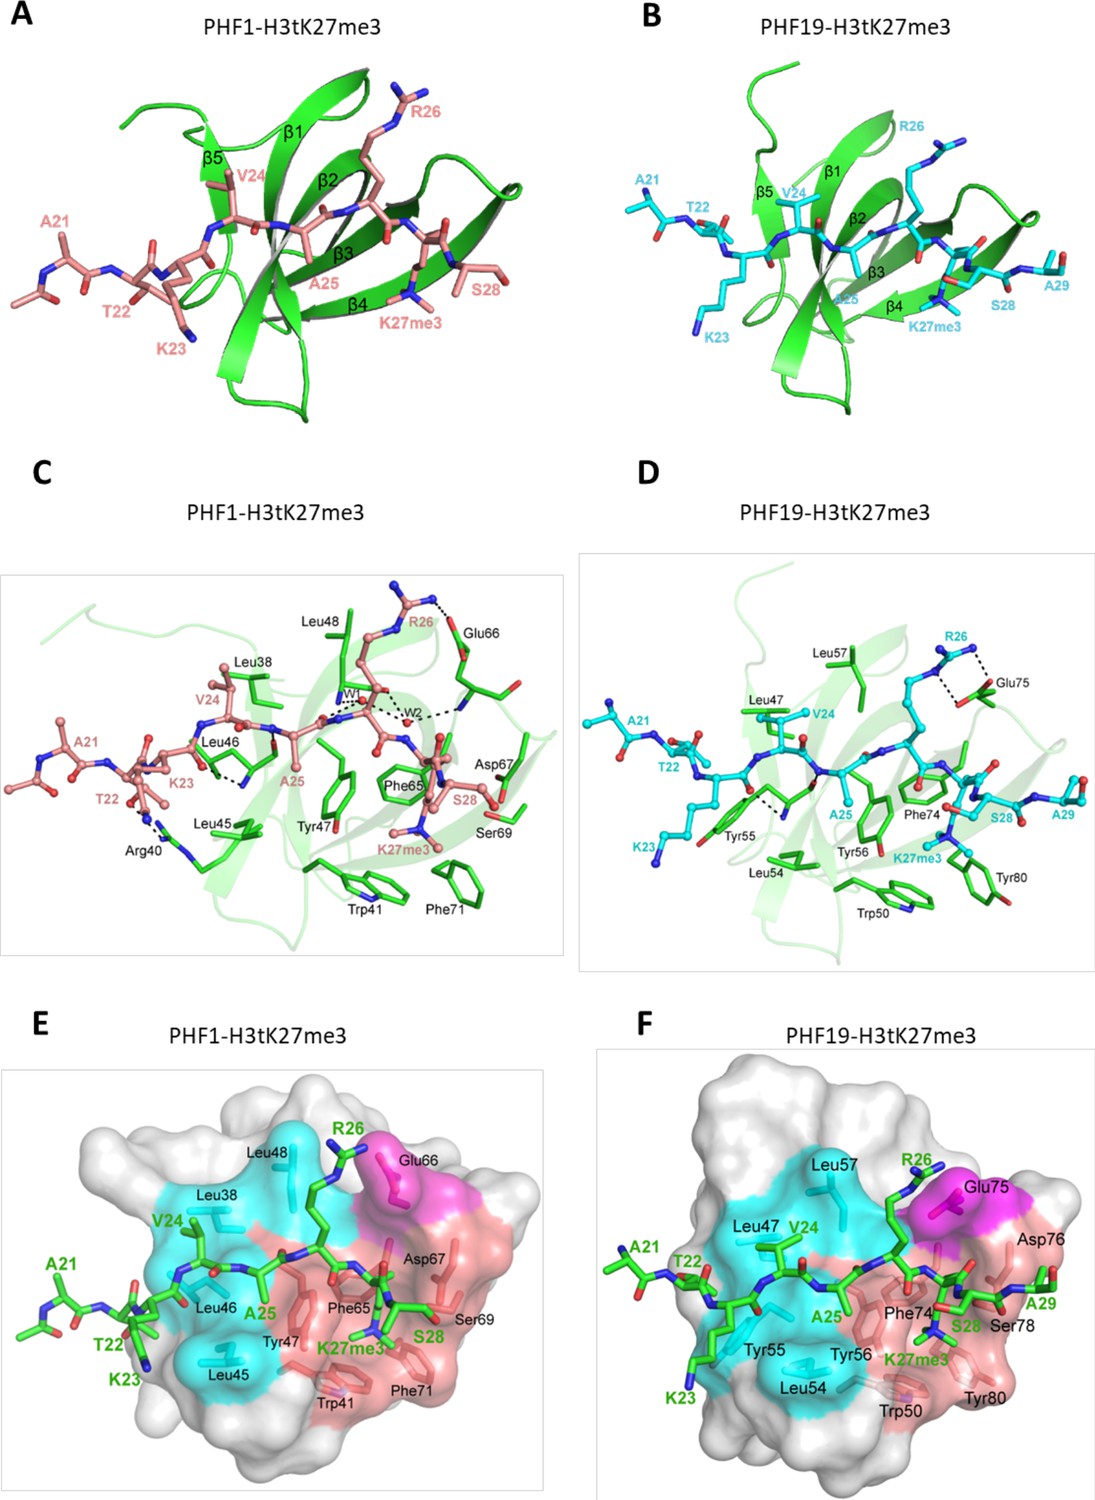
(A) Overall structure of PHF1-Tudor in complex with H3tK27me3. PHF1-Tudor is shown in cartoon representation and colored in green. The H3tK27me3 peptide is colored in salmon and shown as sticks. (B) Overall structure of PHF19-Tudor in complex with H3tK27me3. PHF19-Tudor is shown in cartoon representation and colored in green. The H3tK27me3 peptide is colored in cyan and shown as sticks. (C) Close-up view of the detailed interactions between PHF1-Tudor and the H3tK27me3 peptide. The H3tK27me3 peptide is shown as salmon sticks and the peptide interacting residues in PHF1 are shown as green sticks. The hydrogen bonds are indicated as dash lines and two involved water molecules are shown as spheres. (D) Close-up view of the detailed interactions between PHF19-Tudor and the H3tK27me3 peptide. The H3tK27me3 peptide and the peptide interacting residues in PHF19 are shown as cyan and green sticks, respectively. The hydrogen bonds are indicated as dash lines. (E-F) PHF1-Tudor and PHF19-Tudor are displayed in surface representations with the H3tK27me3 peptide shown as green sticks. The three interaction regions of PHF1 and PHF19: hydrophobic patch, negative groove, and aromatic cage are colored in cyan, magenta, and salmon, respectively. The residues of PHF1/19 involved in the interactions are shown as sticks.
Figure 5
H3tK27me3 and H3K36me3 peptides bound to PHF1/19 within the same binding grooves but in reverse directions.
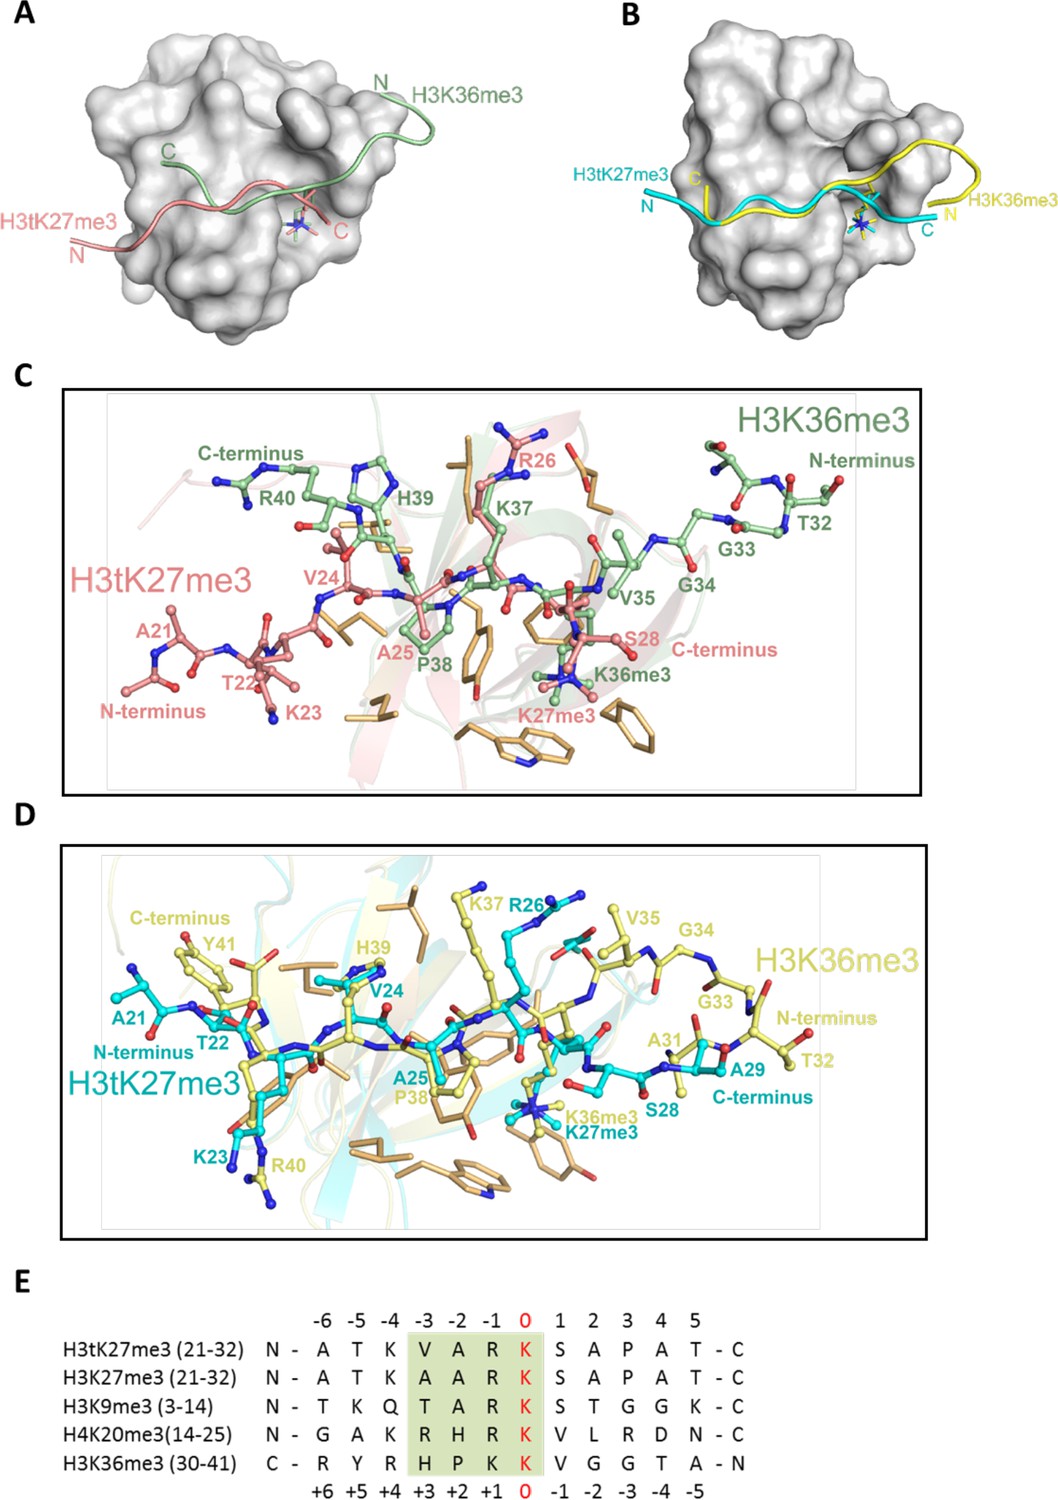
(A) Superposition of the complex structures of PHF1-H3tK27me3 and PHF1-H3K36me3 (PDB: 4HCZ). The PHF1-Tudor is shown in a gray surface representation. The H3tK27me3 and H3K36me3 peptides are shown as salmon and pale green cartoons, respectively. (B) Superposition of the complex structures of PHF19-H3tK27me3 and PHF19-H3K36me3 (PDB: 4BD3). The PHF19-Tudor is shown in a gray surface representation. The H3tK27me3 and H3K36me3 peptides are shown as cyan and yellow cartoons, respectively. (C) Comparison of the detailed interactions of the H3tK27me3 and H3K36me3 peptides with PHF1. The H3tK27me3 and H3K36me3 peptides are shown in salmon and pale green sticks, respectively, and the key interacting residues of PHF1 are shown as light orange sticks. (D) Comparison of the detailed interactions of the H3tK27me3 and H3K36me3 peptides with PHF19. The H3tK27me3 and H3K36me3 peptides are shown in cyan and yellow sticks, respectively, and the key interacting residues of PHF19 are shown as light orange sticks. (E) Multiple sequence alignment of different peptides. The trimethylated lysines in the peptides are defined as position zero. The H3K36me3 sequence is aligned in a reverse direction. The relatively conserved motif is indicated in a green background.
Figure 6

V24 of H3t is an optimal residue for the H3t recognition by the Tudor domain of PHF1/19.
(A) Binding affinities of PHF1 and PHF19 Tudor domain with various peptides determined using ITC. (B) The crystal structure of PHF1 in complex with H3K36me3H39V. The mutant H3K36me3H39V peptide is shown as a stick in light magenta. PHF1 is shown as surface and the hydrophobic patch surrounding V39 is indicated in cyan. Some additional interactions in the H3K36me3-H39V mutant are indicated with dash lines. (C) Structural comparison of PHF1-H3K36me3 (PDB: 4HCZ) and PHF1-H3K36me3-H39V. The four leucines involved in hydrophobic interactions are shown with stick in cyan. The H3K36me3 peptide and H3K36me3-H39V mutant are shown as cartoon in pale green and light magenta, respectively. (D) The sequence alignment of H3t from human, mouse, and rat. The secondary structure elements are shown above the sequence. Identical residues are indicated in aqua and the different residues are colored in red.
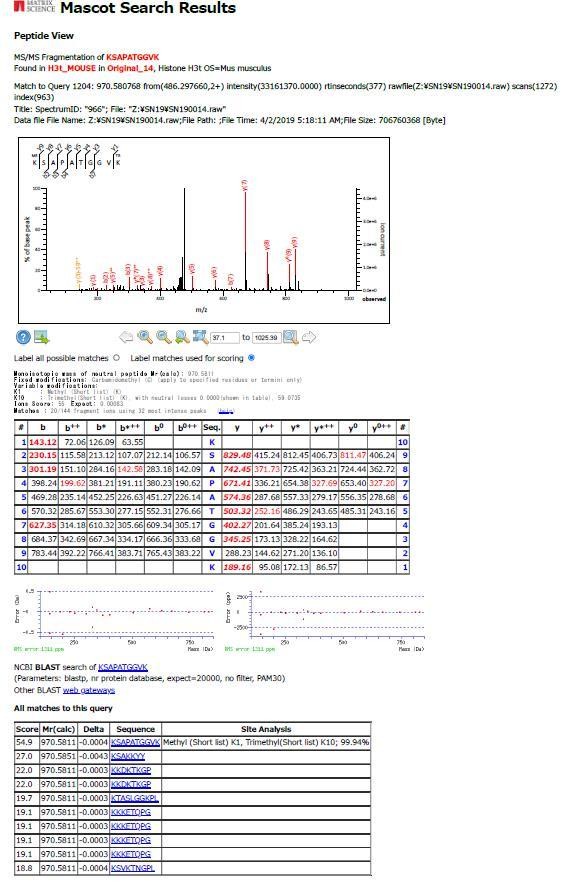
Author response image 1
Tables
Table 1
Binding affinities of PHF1/MTF2 mutants with the H3tK27me3 peptide.
| PHF1 | ITC (µM) |
|---|---|
| W41A | NB |
| Y47A | NB |
| F65A | NB |
| F71A | 192 ± 18 |
| L38A | 125 ± 9 |
| L45A | 178 ± 9 |
| L46A | 127 ± 8 |
| L46Y | 50 ± 5 |
| L48A | 81 ± 2 |
| L38A, L45A, L46A, L48A | >500 |
| E66A | >200 |
| MTF2 | ITC (µM) |
| S86F | 91 ± 21 |
| S86Y | 110 ± 11 |
-
NB indicates no detectable binding.
Table 2
Data collection and refinement statistics.
| PHF1-H3tK27me3 | PHF19-H3tK27me3 | PHF1-H3K36me3-H39V | |
|---|---|---|---|
| PDB ID | 6WAU | 6WAT | 6WAV |
| Data collection | |||
| Space group | P21 | P32 | C2 |
| Cell (a,b,c (Å)) (α, β, γ (°)) | 32.8, 286.8, 123.5 90, 90.7, 90 | 111.5, 111.5, 34.4 90, 90, 120 | 153.0, 65.6, 29.0 90, 97.1, 90 |
| Resolution (Å) | 47.80–1.80 (1.83–1.80) | 55.74–1.71 (1.74–1.71) | 40.07–1.70 (1.73–1.70) |
| Rmerge overall | 0.071 (0.939) | 0.048 (1.314) | 0.048 (0.416) |
| Rmeas overall | 0.082 (1.117) | 0.054 (1.608) | 0.056 (0.487) |
| No. reflections | 207862 (9809) | 51838 (2547) | 29381 (1501) |
| Mean I/sigma | 10.5 (1.3) | 21.6 (0.7) | 16.4 (3.1) |
| CChalf | 0.999 (0.706) | 1.000 (0.190) | 0.998 (0.810) |
| Completeness (%) | 99.2 (93.7) | 99.4 (92.1) | 93.8 (90.9) |
| Multiplicity | 3.8 (3.3) | 5.4 (2.9) | 3.7 (3.6) |
| Model refinement | |||
| Resolution (Å) | 40.76–1.80 | 48.27–1.75 | 32.80–1.70 |
| Reflections/free | 395473/19949 | 48195/2242 | 29359/1455 |
| Rwork/Rfree | 0.215/0.260 | 0.209/0.251 | 0.198/0.242 |
| All (No. atoms/mean B (Å2)) | 33004/39.0 | 3137/30.0 | 2348/20.8 |
| Tudor | 27847/38.7 | 2697/29.6 | 1878/19.5 |
| Peptide | 4169/42.0 | 383/32.2 | 306/26.0 |
| Water | 953/36.5 | 47/30.7 | 132/25.1 |
| Others | 35/31.9 | 10/26.7 | 32/27.4 |
| rmsd bonds (Å)/angles (°) | 0.011/1.1 | 0.012/1.9 | 0.011/1.7 |
-
Values in parentheses are for the highest-resolution shell.
Key resources table
| Reagent type (species) or resource | Designation | Source or reference | Identifiers | Additional information |
|---|---|---|---|---|
| Gene (Mus musculus) | H3.4 histone (H3t) | GenBank | 382523 | |
| Gene (Homo sapiens) | PHF1 | GenBank | 5252 | |
| Strain, strain background (Escherichia coli) | BL21(DE3) | Thermo Fisher | C600003 | |
| Cell line (Homo sapiens) | 293T/17 | ATCC | CRL-11268 | |
| Antibody | Anti-histone H3 (rabbit polyclonal) | abcam | ab1791 | WB (1:2000) |
| Antibody | Anti-histone H3t (mouse monoclonal) | This paper Ueda et al., 2017 | WB (1:1000) IF (1:1000) | |
| Antibody | Anti-PHF1 (rabbit polyclonal) | Abcam | Cat# ab80042 | IF (1:500) |
| Antibody | Anti-SCP3 (mouse monoclonal) | Abcam | 10G11/7 Cat# ab97672 | IF (1:1000) |
| Antibody | Anti-γ H2A.X (mouse monoclonal) | Merck Millipore | Cat# #05–636 | IF (1:1000) |
| Antibody | Lectin PNA tagged with Alexa Fluor 488 | Thermo Fisher | Cat# L21409 | IF (1:1000) |
| Sequence-based reagent | Eef1a1–Fw | Ueda et al., 2017 | PCR primers | CTCTGACTACCCTCCACTTGGTCG |
| Sequence-based reagent | Eef1a1–Rev | Ueda et al., 2017 | PCR primers | ATTAAGACTGGGGTGGCAGGTGTT |
| Sequence-based reagent | Phf1–Fw | This paper | PCR primers | TGAGAAGTGTCGCCATGCTTA |
| Sequence-based reagent | Phf1–Rev | This paper | PCR primers | CATAGGGACCTTTCTTCAGTGC |
| Recombinant DNA reagent | pET28-MHL | SGC, Toronto | 26096 (Genbank accession number: EF456735) | Expression of the Tudor domains of PHF1, MTF2 and PHF19, and their mutants |
| Software, algorithm | Origin 6.1, Origin 7.0 | OriginLab | http://www.originlab.com/ | For ITC curve fitting and calculation of Kd values |
| Software, algorithm | XDS | PMID:20124692 | http://xds.mpimf-heidelberg.mpg.de/ | Processing of X-ray diffraction data |
| Software, algorithm | Pymol | DeLano Scientific LLC | http://www.pymol.org/ | Drawing structure figures |
| Software, algorithm | Coot | PMID:15572765 | http://www2.mrc-lmb.cam.ac.uk/Personal/pemsley/coot/ | Structure model building |
| Software, algorithm | CCP4 | PMID:21460441 | https://www.ccp4.ac.uk/ | Structure determination and refinement |
| Software, algorithm | MASCOT program | Matrix Science | Version 2.6 | |
| Software, algorithm | Proteome discoverer 2.2 | Thermo Fisher | ||
| Other | Hoechst 33342 | Thermo Fisher | Cat# H3570 | IF (1:5000) |
Additional files
-
Supplementary file 1
Summary of H3K27 residue containing H3/H3t peptides detected in the input fraction.
- https://cdn.elifesciences.org/articles/58675/elife-58675-supp1-v3.xlsx
-
Transparent reporting form
- https://cdn.elifesciences.org/articles/58675/elife-58675-transrepform-v3.docx
Download links
A two-part list of links to download the article, or parts of the article, in various formats.
Downloads (link to download the article as PDF)
Open citations (links to open the citations from this article in various online reference manager services)
Cite this article (links to download the citations from this article in formats compatible with various reference manager tools)
Structural basis for histone variant H3tK27me3 recognition by PHF1 and PHF19
eLife 9:e58675.
https://doi.org/10.7554/eLife.58675


