Typical and atypical language brain organization based on intrinsic connectivity and multitask functional asymmetries
- Université de Bordeaux, Institut des Maladies Neurodégénératives, UMR 5293, Groupe d’Imagerie Neurofonctionnelle, France
- CNRS, Institut des Maladies Neurodégéneratives, UMR 5293, Groupe d’Imagerie Neurofonctionnelle, France
- CEA, Institut des Maladies Neurodégéneratives, UMR 5293, Groupe d’Imagerie Neurofonctionnelle, France
- Université de Bordeaux, Institut de Mathématiques de Bordeaux, UMR 5251, France
- Bordeaux INP, Institut de Mathématiques de Bordeaux, UMR 5251, France
- INRIA Bordeaux Sud-Ouest, Institut de Mathématiques de Bordeaux, UMR 5251, Contrôle de Qualité et Fiabilité Dynamique, France
- Centre Hospitalier Universitaire de Bordeaux, France
Figures
Figure 1
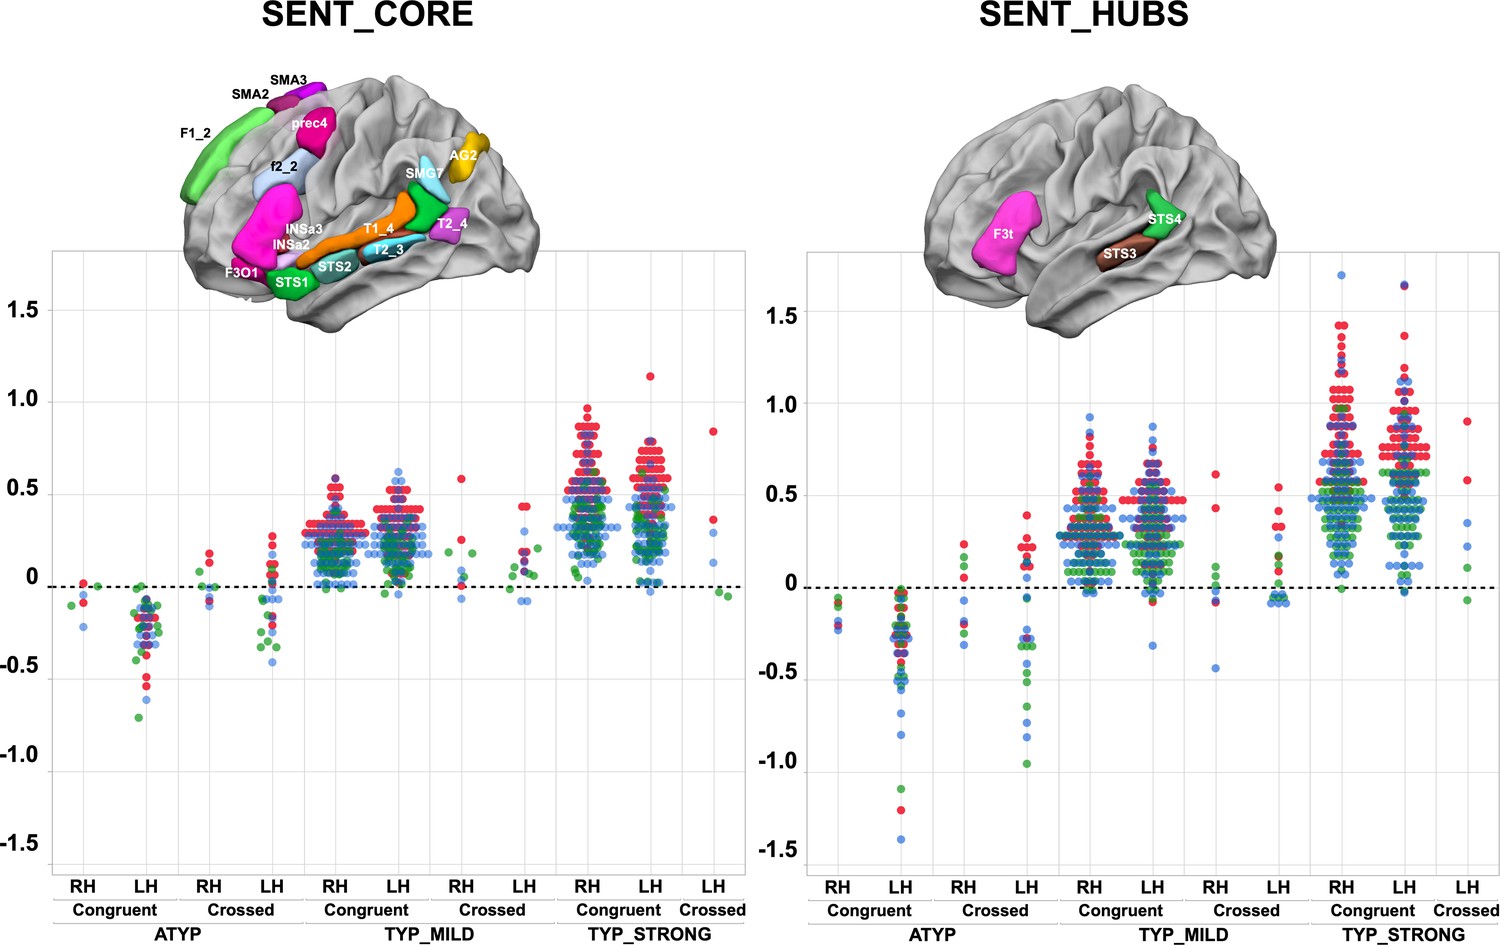
Scatterplots of individual asymmetry values in each task measured as the mean of SENT_CORE and as the mean of the three hubs (SENT_HUBS) for the three groups clustered by hierarchical clustering and stratified according to their status as CONGRUENT or CROSSED and their handedness (right-handers: RH, left-handers: LH) .
The first row depicts the location of the 18 hROIs constituting the SENT_CORE network (left) and the 3 hROIs constituting SENT_HUBS (right). Atypicals (ATYP), typicals with moderate asymmetries (TYP_MILD) and typicals with strong asymmetries (TYP_STRONG) correspond to the three groups resulting from multitask and multimodal hierarchical agglomerative clustering. (PRODSENT-WORD: red, LISNSENT-WORD: green and READSENT-WORD: blue).
-
Figure 1—source data 1
Data source for Figure 1.
- https://cdn.elifesciences.org/articles/58722/elife-58722-fig1-data1-v2.txt
-
Figure 1—source data 2
Detailed information concerning the Figure 1 data source file.
- https://cdn.elifesciences.org/articles/58722/elife-58722-fig1-data2-v2.txt
Figure 2
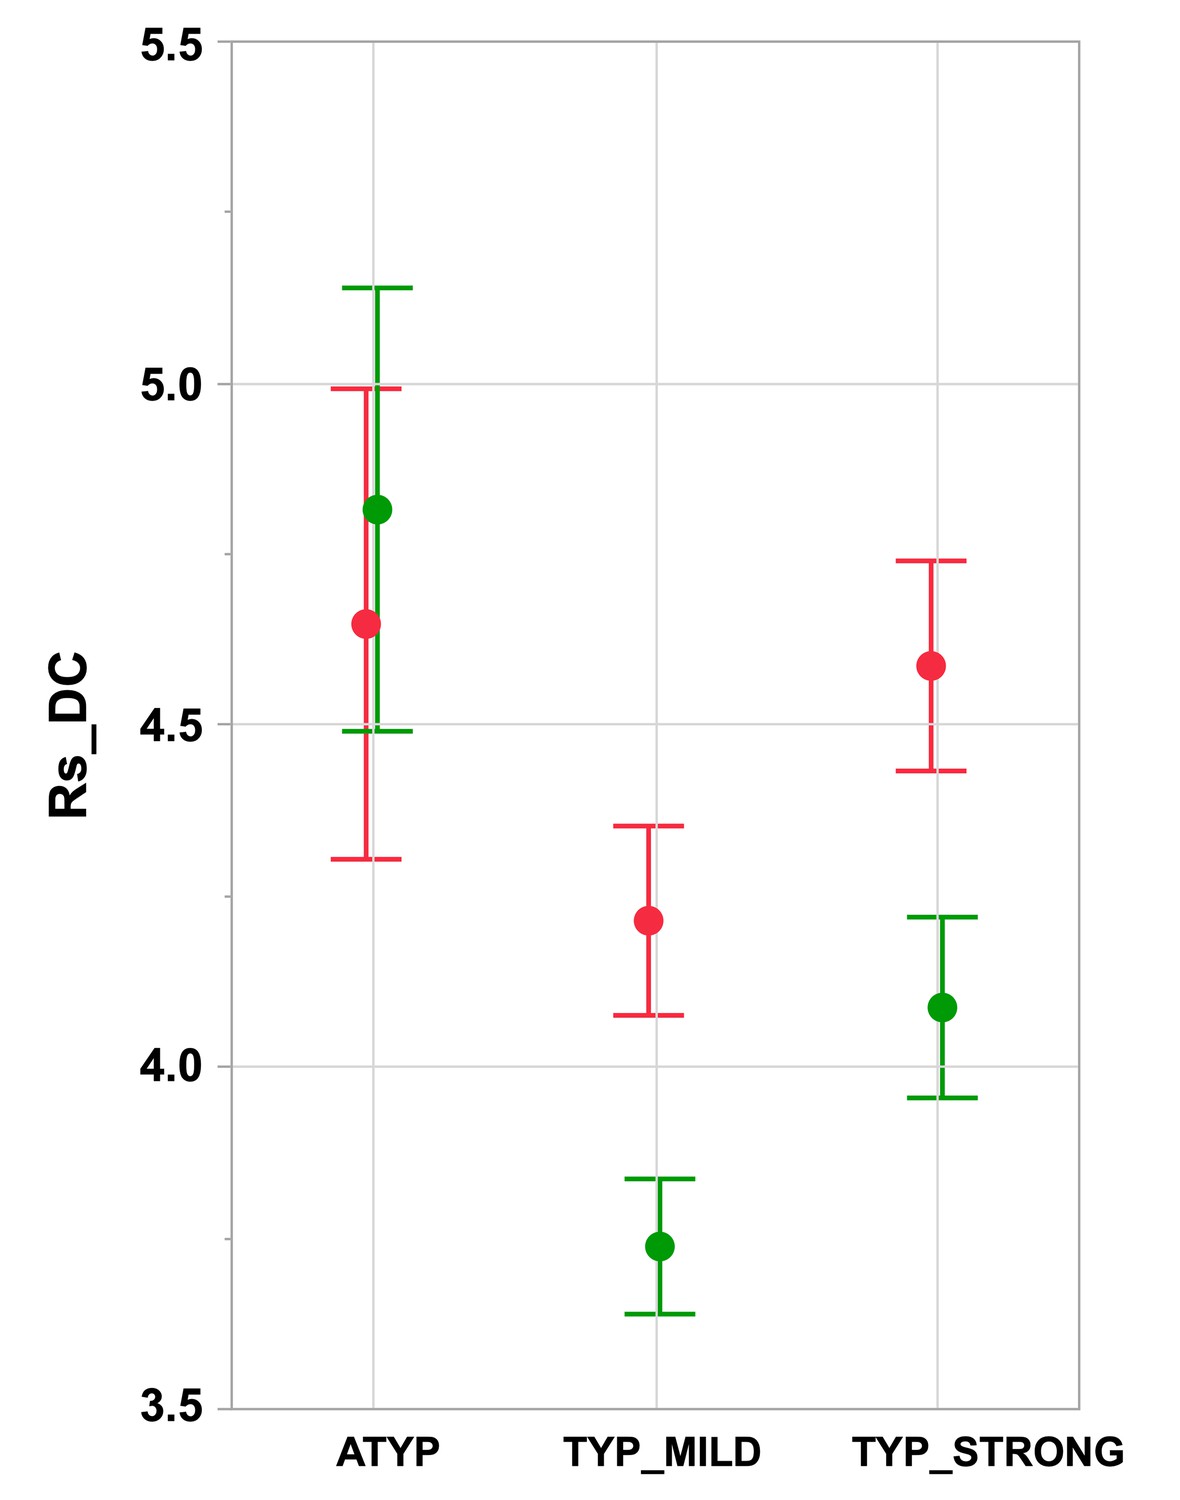
Intrahemispheric mean intrinsic connectivity strength of the SENT_CORE network in the three groups differing in language organization.
Right (green) and left (red) values of the mean resting-state degree connectivity (Rs_DC) of SENT_CORE in the three groups. Significant leftward DC asymmetry is only present in TYP groups (Tukey’s HSD test p<10−4, N TYP_MILD = 132, N TYP_STRONG = 125) and right Rs_DC is higher in the ATYP group (N = 30) than in the TYP_STRONG and TYP_MILD groups (p<10−4, Tukey’s HSD test). Error bars correspond to the 95% confidence intervals.
-
Figure 2—source data 1
Data source for Figure 2.
- https://cdn.elifesciences.org/articles/58722/elife-58722-fig2-data1-v2.txt
-
Figure 2—source data 2
Detailed information concerning the Figure 2 data source file.
- https://cdn.elifesciences.org/articles/58722/elife-58722-fig2-data2-v2.txt
Figure 3
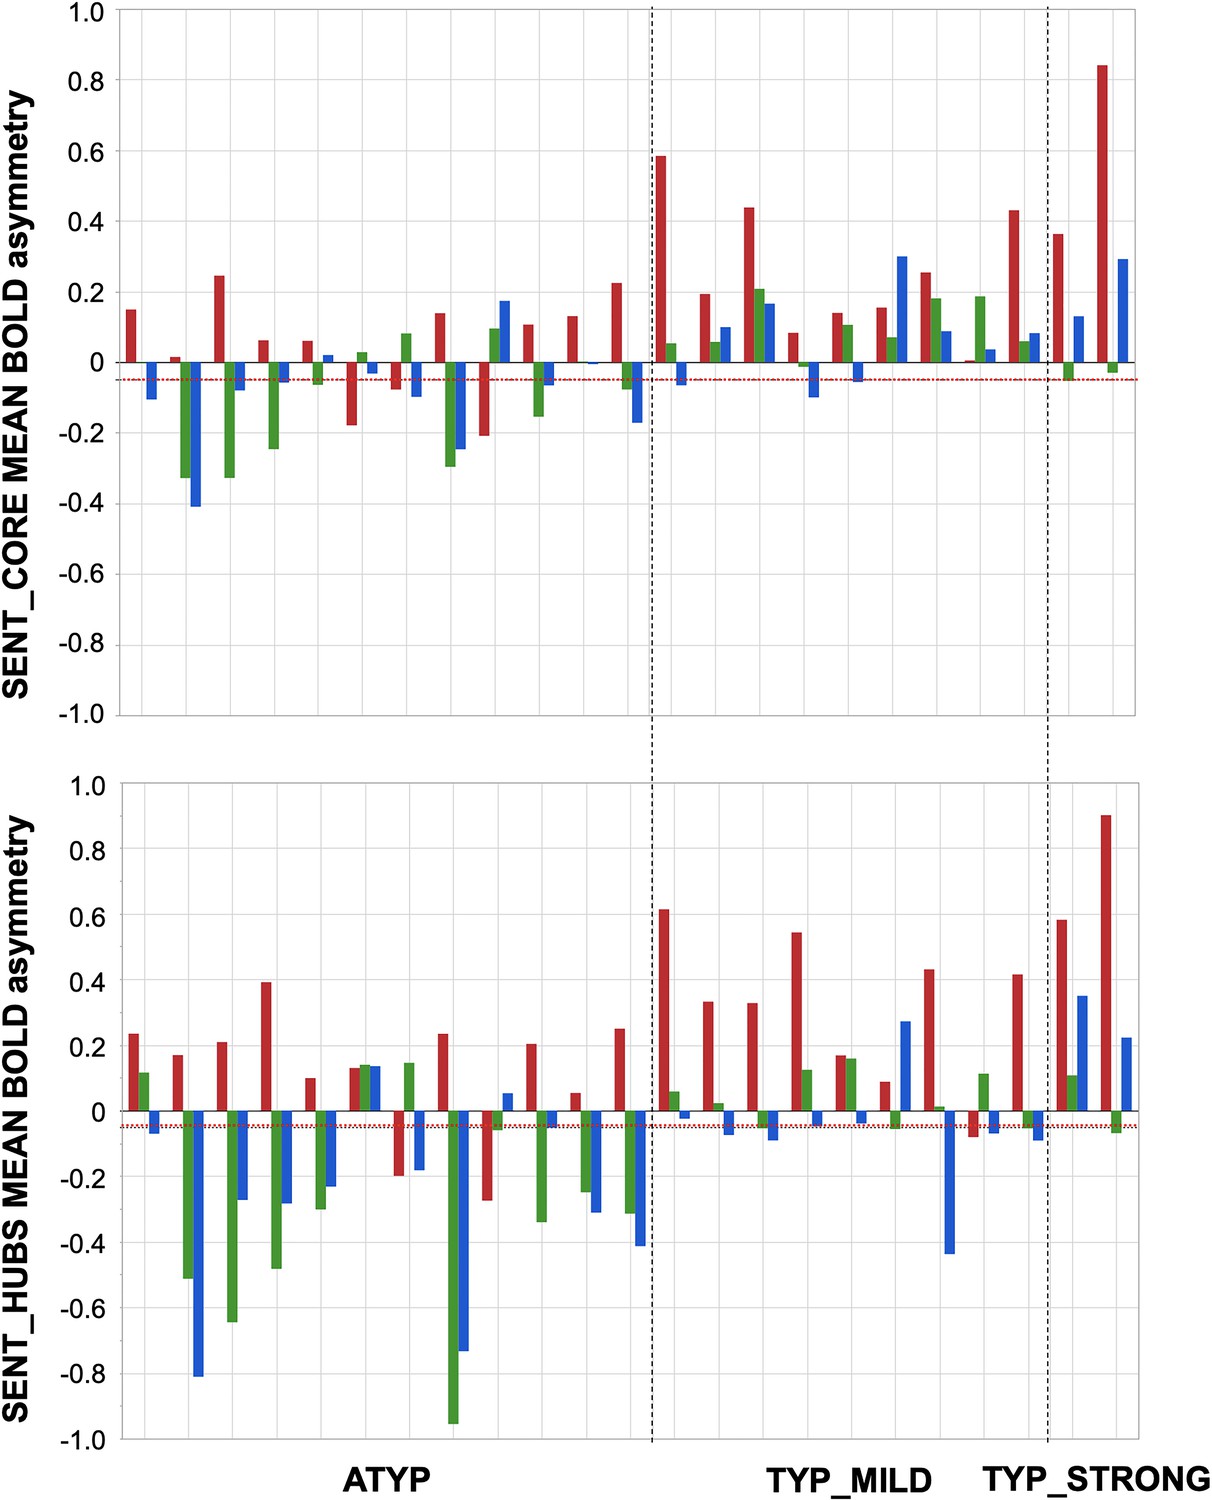
Participants showing dissociations between their three task-related functional asymmetries in each of the three groups classified by language organization.
Individual values of left minus right blood oxygen level-dependent (BOLD) asymmetries measured during PRODSENT-WORD (red), LISNSENT-WORD (green) and READSENT-WORD (blue) in SENT_CORE regions (top) and in SENT_HUBS (bottom). The red dotted line corresponds to the arbitrary threshold of 0.05 in asymmetry strength that was applied to define a rightward asymmetry.
-
Figure 3—source data 1
Data source for Figure 3.
- https://cdn.elifesciences.org/articles/58722/elife-58722-fig3-data1-v2.txt
-
Figure 3—source data 2
Detailed information concerning the Figure 3 data source file.
- https://cdn.elifesciences.org/articles/58722/elife-58722-fig3-data2-v2.txt
Figure 4
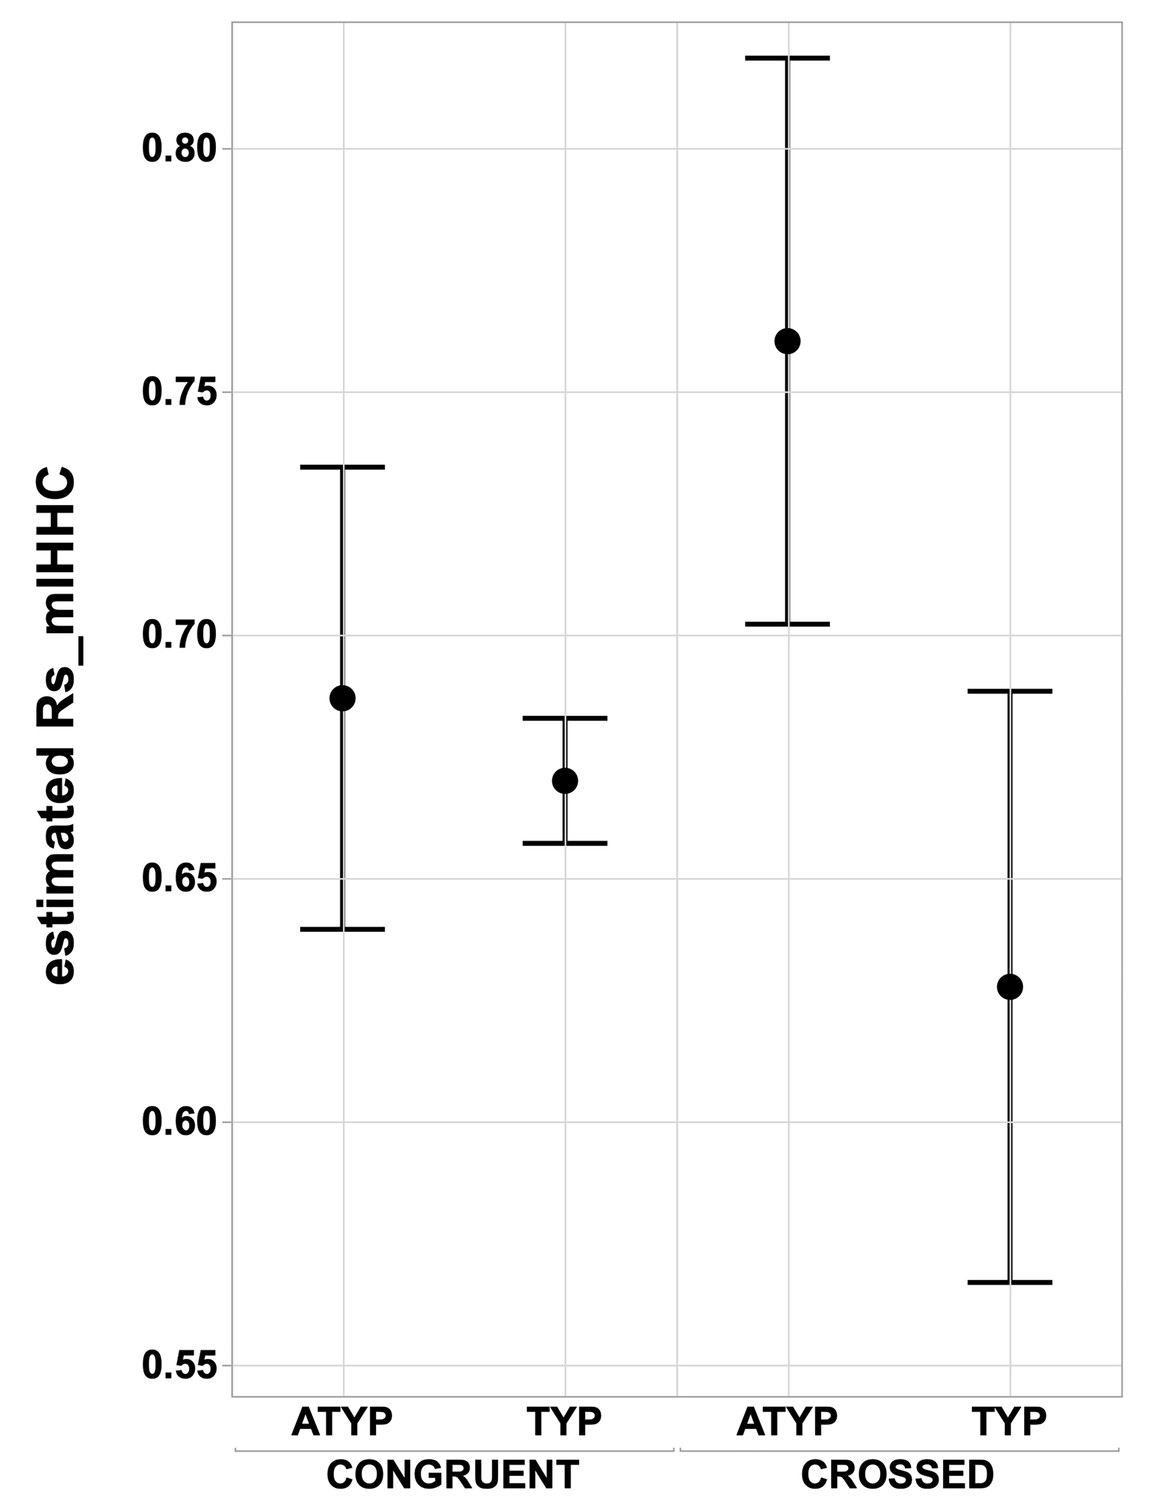
Interhemispheric intrinsic connectivity strength across homotopic regions (Rs_mIHHC) in SENT_CORE in the CONGRUENT and CROSSED TYP and ATYP groups.
The estimated mean interhemispheric homotopic correlation expressed as the Fisher z-transformation of Rs_mIHHC is higher in the CROSSED atypicals group (N = 12) than in the TYP group (merging TYP_MILD and TYP_STRONG, N CROSSED = 11, N CONGRUENT = 246), regarding of whether they are CONGRUENT or CROSSED (both p<0.016, Tukey’s HSD test).
-
Figure 4—source data 1
Data source for Figure 4.
- https://cdn.elifesciences.org/articles/58722/elife-58722-fig4-data1-v2.txt
-
Figure 4—source data 2
Detailed information concerning the Figure 4 data source file.
- https://cdn.elifesciences.org/articles/58722/elife-58722-fig4-data2-v2.txt
Figure 5

Estimated loadings of the four main principal components of cognitive abilities in the three groups having different language lateralization.
The color code for the components is as follows: SPA: blue, MEM: red, PHONO: light orange, and VERB: green. Error bars represent 95% confidence intervals.
-
Figure 5—source data 1
Data source for Figure 5.
- https://cdn.elifesciences.org/articles/58722/elife-58722-fig5-data1-v2.txt
-
Figure 5—source data 2
Detailed information concerning the Figure 5 data source file.
- https://cdn.elifesciences.org/articles/58722/elife-58722-fig5-data2-v2.txt
Figure 6

Alluvial plots comparing the present Multitask Multimodal Hierarchical Classification (MMHC) with two previous classifications only based on the functional asymmetry during production of sentences minus word-list in the same sample of participants: Gaussian Mixture Modeling (GMM) classification on Hemispheric Functional Lateralization Index (HFLI, Mazoyer et al., 2014) and Support Vector Machine (Zago et al., 2017) classification in the right (SVM-R) and left hemisphere (SVM-L).
Each line corresponds to a participant with the following color code: red for multitask multimodal hierarchical classification-atypical (ATYP), blue for multitask multimodal hierarchical classification-TYP_MILD, and green for multitask multimodal hierarchical classification-TYP_STRONG. The Gaussian mixture modeling method identified each individual as either strong_atypical (SA), ambilateral (AMB), or typical (TYP). identified the voxel-based pattern of each hemisphere of an individual as either dominant (DOM) or nondominant (NON DOM).
-
Figure 6—source data 1
Data source for Figure 6.
- https://cdn.elifesciences.org/articles/58722/elife-58722-fig6-data1-v2.txt
-
Figure 6—source data 2
Detailed information concerning the Figure 6 data source file.
- https://cdn.elifesciences.org/articles/58722/elife-58722-fig6-data2-v2.txt
Figure 7
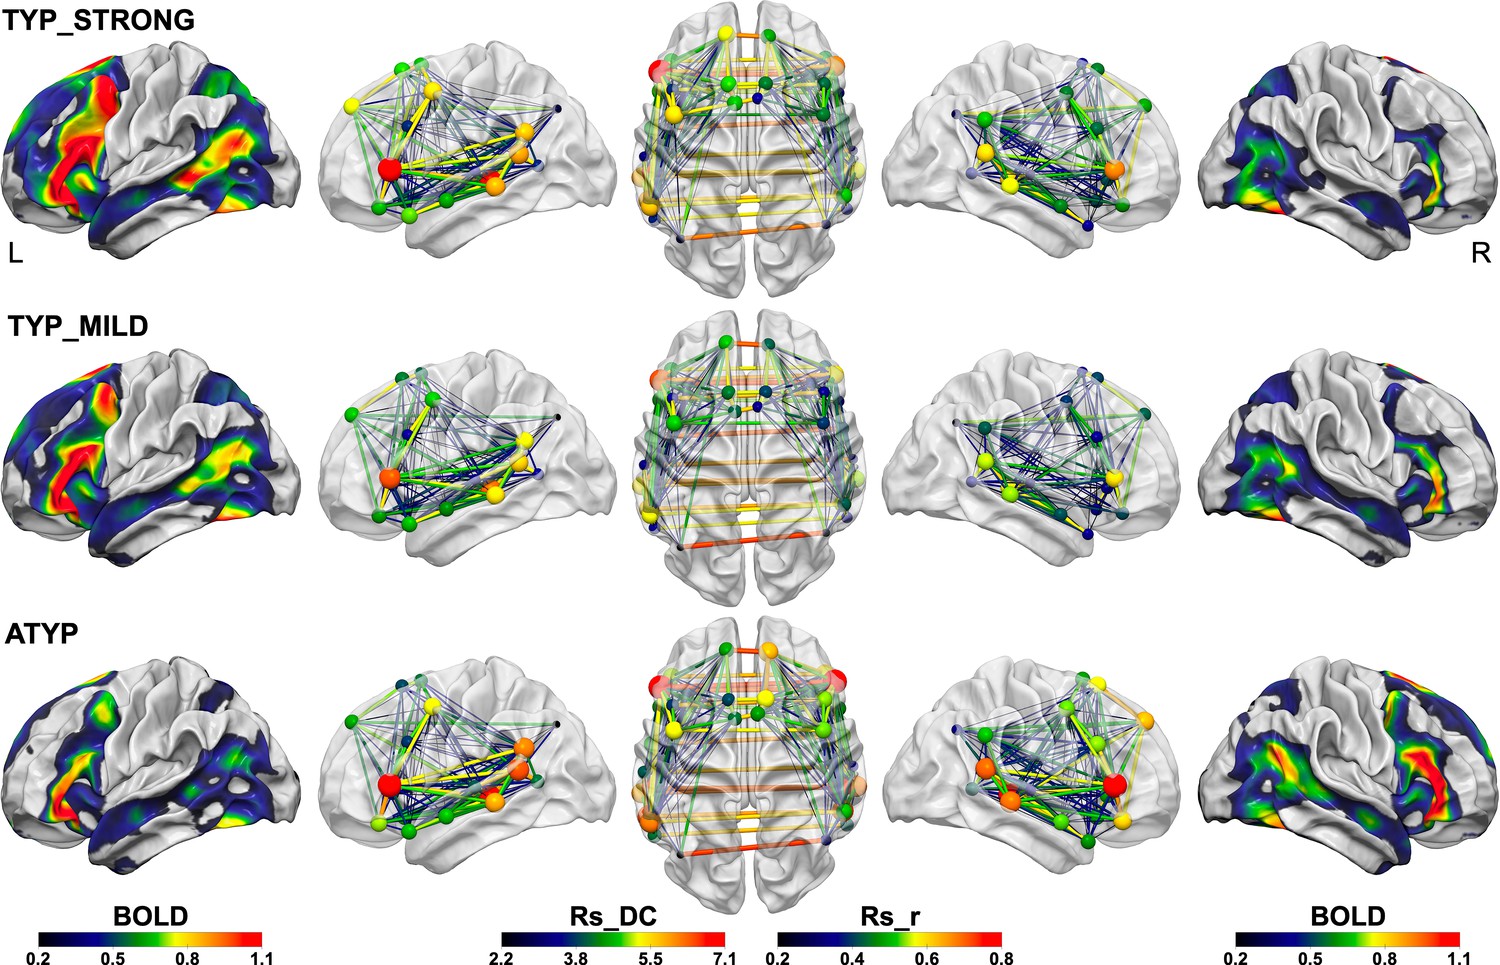
Summary figure illustrating the different SENT_CORE intra- and inter-hemispheric organizations observed in the three groups identified by hierarchical clustering.
The left column shows the group mean activation maps during PRODSENT-WORD (BOLD activation amplitude is given by color scale) of the left hemisphere and the right column the mean activation map of the right hemisphere superimposed on the white matter surface rendering of the BIL and GIN template obtained with the Surf Ice software (https://www.nitrc.org/projects/surfice/). The second, third and fourth columns show the left lateral, superior and right lateral views of the SENT_CORE intrinsic connectivity network, each region of the network being represented by a sphere located at the mass center of its MNI coordinates. For each SENT_CORE region, a colored sphere indicate the group average region degree centrality of intrinsic connectivity (the Rs_DC value is given by color scale, and sphere size is proportional to value), whereas a colored line indicates the strength of the Pearson intrinsic correlation coefficient between two SENT_CORE regions (the Rs_r value is given by color scale, and line thickness is proportional to value).
Author response image 1
Tables
Table 1
Characteristics of the three groups after hierarchical clustering on the variables that served at the classification and also on absolute values of task-induced asymmetries.
SENT_CORE network asymmetry (left minus right) was calculated as the volumetric mean of the 18 hROIs in each contrast while hub asymmetry was calculated as the volumetric mean of the 3 hROIs classified as hubs in 145 right-handers (RH)(inferior frontal gyrus: F3t, and two regions of the superior temporal sulcus: STS3 and STS4). mIHHC corresponds to the averaged resting-state Inter Hemispheric Homotopic Correlation across the 18hROIs composing SENT_CORE (Rs_mIHHC). Resting-state Degree Connectivity (Rs_DC) was calculated in the SENT_CORE network in each hemisphere. Mean Rs_DC corresponds to the mean of the left and right SENT_CORE Rs_DC. The standard deviations are between brackets.
| TYP_STRONG N = 125 | TYP_MILD N = 132 | ATYP N = 30 | |
|---|---|---|---|
| Task-induced variables | |||
| SENT_CORE asymmetry | |||
| PRODSENT-WORD | 0.557 (0.17) | 0.296 (0.12) | −0.114 (0.19) |
| LISNSENT-WORD | 0.299 (0.13) | 0.167 (0.09) | −0.155 (0.17) |
| READSENT-WORD | 0.351 (0.18) | 0.217 (0.14) | −0.177 (0.15) |
| SENT_HUBS asymmetry | |||
| PRODSENT-WORD | 0.80 (0.23) | 0.391 (0.18) | −0.119 (0.30) |
| LISNSENT-WORD | 0.42 (0.19) | 0.210 (0.15) | −0.291 (0.28) |
| READSENT-WORD | 0.51 (0.29) | 0.287 (0.23) | −0.358 (0.30) |
| SENT_CORE absolute asymmetry | |||
| PRODSENT-WORD | 0.557 (0.17) | 0.295 (0.12) | 0.190 (0.12) |
| LISNSENT-WORD | 0.300 (0.12) | 0.168 (0.08) | 0.169 (0.12) |
| READSENT-WORD | 0.351 (0.18) | 0.221 (0.13) | 0.189 (0.13) |
| SENT_HUBS absolute asymmetry | |||
| PRODSENT-WORD | 0.803 (0.23) | 0.393 (0.17) | 0.250 (0.20) |
| LISNSENT-WORD | 0.430 (0.19) | 0.214 (0.14) | 0.318 (0.25) |
| READSENT-WORD | 0.515 (0.30) | 0.307 (0.20) | 0.370 (0.28) |
| Resting-state variables | |||
| Rs_mIHHC | 0.571 (0.07) | 0.578 (0.07) | 0.610 (0.06) |
| mean Rs_DC | 8.670 (1.42) | 7.949 (1.24) | 9.460 (1.60) |
| Rs_DC asymmetry | 0.500 (0.77) | 0.478 (0.64) | −0167 (0.78) |
-
Table 1—source data 1
Data source for Table 1.
- https://cdn.elifesciences.org/articles/58722/elife-58722-table1-data1-v2.txt
-
Table 1—source data 2
Detailed information concerning the Table 1 data source file.
- https://cdn.elifesciences.org/articles/58722/elife-58722-table1-data2-v2.txt
Table 2
Measures related to task execution in the three groups varying in hemispheric lateralization.
Mean (SD) of response times and self-reports of task difficulty rated on a 1 to 5 scale are shown for each fMRI run (Sentence production: PROD, sentence listening: LISN, sentence reading: READ). In addition, sample mean (SD) of the average number of words per sentence recalled during the debriefing of the PROD run is shown.
| TYP_STRONG N = 125 | TYP_MILD N = 132 | ATYP N = 30 | |
|---|---|---|---|
| Task difficulty | |||
| LISN | 1.12 (0.40) | 1.14 (0.45) | 1.25 (0.80) |
| READ | 1.17 (0.40) | 1.23 (0.55) | 1.20 (0.43) |
| PROD | 2.74 (1.07) | 2.69 (1.06) | 2.88 (1.10) |
| Response time (ms) | |||
| LISN | 388.8 (134) | 386.3 (126) | 396.9 (96) |
| READ | 3733.3 (579) | 3731.8 (560) | 3755.8 (552) |
| PROD | 5600.0 (850) | 5631.2 (968) | 5645.5 (1095) |
| Number of words per sentence | |||
| PROD | 12.36 (2.03) | 12.37 (1.87) | 12.36 (2.55) |
-
Table 2—source data 1
Data source for Table 2.
- https://cdn.elifesciences.org/articles/58722/elife-58722-table2-data1-v2.txt
-
Table 2—source data 2
Detailed information concerning the Table 2 data source file.
- https://cdn.elifesciences.org/articles/58722/elife-58722-table2-data2-v2.txt
Table 3
Gray and white matter hemispheric volumes and their left minus right asymmetry (mean and (SD), in cc) as well as midsagittal corpus callosum volume (mean and (SD), in cc), in subgroups of individuals according to their multitask multimodal hierarchical classification and the absence/presence of dissociated task-related functional asymmetries.
TYP: participants classified with multitask multimodal hierarchical classification as either TYP_STRONG or TYP_MILD, that is showing TYP left functional lateralization; ATYP: participants classified with multitask multimodal hierarchical classification as ATYPICAL, that is showing atypical right functional lateralization. CROSSED: participants with at least one dissociation of functional lateralization among the three language tasks; CONGRUENT: participants with no dissociation.
| TYP | ATYP | |||
|---|---|---|---|---|
| Congruent N = 246 | Crossed N = 11 | Congruent N = 18 | Crossed N = 12 | |
| Gray Matter | ||||
| Left | 327.00 (32) | 337.59 (47) | 337.42 (35) | 317.30 (16) |
| Right | 315.64 (32) | 325.72 (48) | 327.77 (33) | 306.48 (15) |
| Asymmetries | 11.35 (4.00) | 11.87 (4.50) | 9.65 (5.03) | 10.82 (3.82) |
| White Matter | ||||
| Left | 216.67 (26) | 221.92 (36) | 222.43 (26) | 208.61 (15) |
| Right | 213.38 (25) | 217.82 (35) | 220.22 (25) | 206.38 (14) |
| Asymmetries | 3.33 (2.19) | 4.11 (1.74) | 2.22 (2.41) | 2.23 (2.03) |
| Corpus Callosum | 5.31 (0.85) | 5.21 (0.67) | 5.45 (0.90) | 5.48 (0.74) |
-
Table 3—source data 1
Data source for Table 3.
- https://cdn.elifesciences.org/articles/58722/elife-58722-table3-data1-v2.txt
-
Table 3—source data 2
Detailed information concerning the Table 3 data source file.
- https://cdn.elifesciences.org/articles/58722/elife-58722-table3-data2-v2.txt
Table 4
Mean (SD, in cc) of scores at the different tests of the cognitive battery in the three groups differing in their language organization as defined by a multitask multimodal hierarchical classification.
| TYP_STRONG N = 125 | TYP_MILD N = 132 | ATYP N = 30 | |
|---|---|---|---|
| Verbal tests | |||
| Rey: word learning | 65.98 (7.57) | 65.07 (7.51) | 64.73 (7.57) |
| Pseudo-words learning | 36.52 (10.44) | 34.64 (11.16) | 34.47 (9.68) |
| Verbal fluency | 48.19 (9.82) | 46.55 (10.01) | 47.63 (8.85) |
| Reading span test | 4.07 (1.08) | 3.91 (1.11) | 4.25 (1.11) |
| Listening span test | 4.85 (1.06) | 4.57 (1.14) | 4.63 (1.21) |
| Vocabulary | 28.39 (3.78) | 27.80 (3.74) | 28.07 (4.42) |
| Rhyming | 68.38 (4.56) | 67.17 (6.11) | 65.93 (5.62) |
| Visuo-spatial tests | |||
| Mental Rotation Test | 11.08 (4.27) | 10.70 (4.60) | 10.17 (4.63) |
| Corsi block | 5.99 (1.06) | 5.72 (1.04) | 5.73 (0.94) |
| Maze | 6.68 (2.66) | 6.09 (2.32) | 4.42 (2.39) |
| Raven matrix | 111.78 (9.70) | 109.82 (10.47) | 106.00 (9.48) |
-
Table 4—source data 1
Data source for Table 4.
- https://cdn.elifesciences.org/articles/58722/elife-58722-table4-data1-v2.txt
-
Table 4—source data 2
Detailed information concerning the Table 4 data source file.
- https://cdn.elifesciences.org/articles/58722/elife-58722-table4-data2-v2.txt
Additional files
Download links
A two-part list of links to download the article, or parts of the article, in various formats.
Downloads (link to download the article as PDF)
Open citations (links to open the citations from this article in various online reference manager services)
Cite this article (links to download the citations from this article in formats compatible with various reference manager tools)
Typical and atypical language brain organization based on intrinsic connectivity and multitask functional asymmetries
eLife 9:e58722.
https://doi.org/10.7554/eLife.58722


