Screening of healthcare workers for SARS-CoV-2 highlights the role of asymptomatic carriage in COVID-19 transmission
- Department of Infectious Diseases, Cambridge University NHS Hospitals Foundation Trust, United Kingdom
- Clinical Microbiology and Public Health Laboratory, Public Health England, United Kingdom
- Wellcome Sanger Institute, United Kingdom
- Department of Medicine, University of Cambridge, United Kingdom
- Cambridge Institute of Therapeutic Immunology and Infectious Disease (CITIID), Jeffrey Cheah Biomedical Centre, Cambridge Biomedical Campus, University of Cambridge, United Kingdom
- Academic Department of Medical Genetics, University of Cambridge, United Kingdom
- Occupational Health and Wellbeing, Cambridge University Hospitals NHS Foundation Trust, United Kingdom
- Department of Microbiology, Cambridge University NHS Hospitals Foundation Trust, United Kingdom
- Division of Virology, Department of Pathology, University of Cambridge, United Kingdom
- National Institutes for Health Research Cambridge, Clinical Research Facility, United Kingdom
- Cambridge University Hospitals NHS Foundation Trust, United Kingdom
- Statistical Laboratory, Centre for Mathematical Sciences, United Kingdom
- National Institutes for Health Research Cambridge Biomedical Research Centre, United Kingdom
- NHS Blood and Transplant, United Kingdom
Figures
Figure 1 with 1 supplement
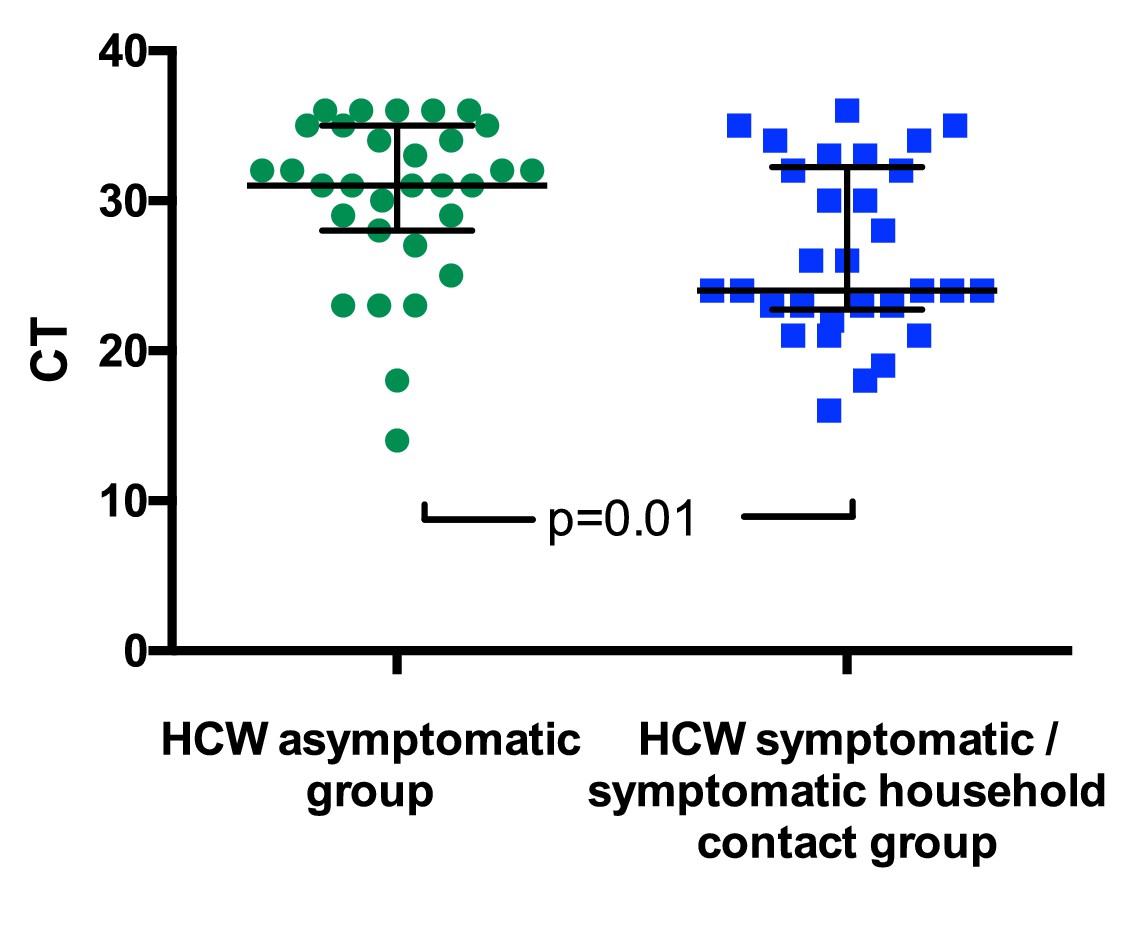
SARS-CoV-2 RNA CT (cycle threshold) values for those individuals who tested positive shown according to HCW group.
HCW asymptomatic screening group (green circles); HCW symptomatic or symptomatic household contact screening groups (blue squares). A Mann Whitney test was used to compare the two groups. Bars: median + / - interquartile range. Note that lower CT values correspond to earlier detection of the viral RNA in the RT-PCR process and therefore identify swabs with higher numbers of copies of the viral genome.
Figure 1—figure supplement 1
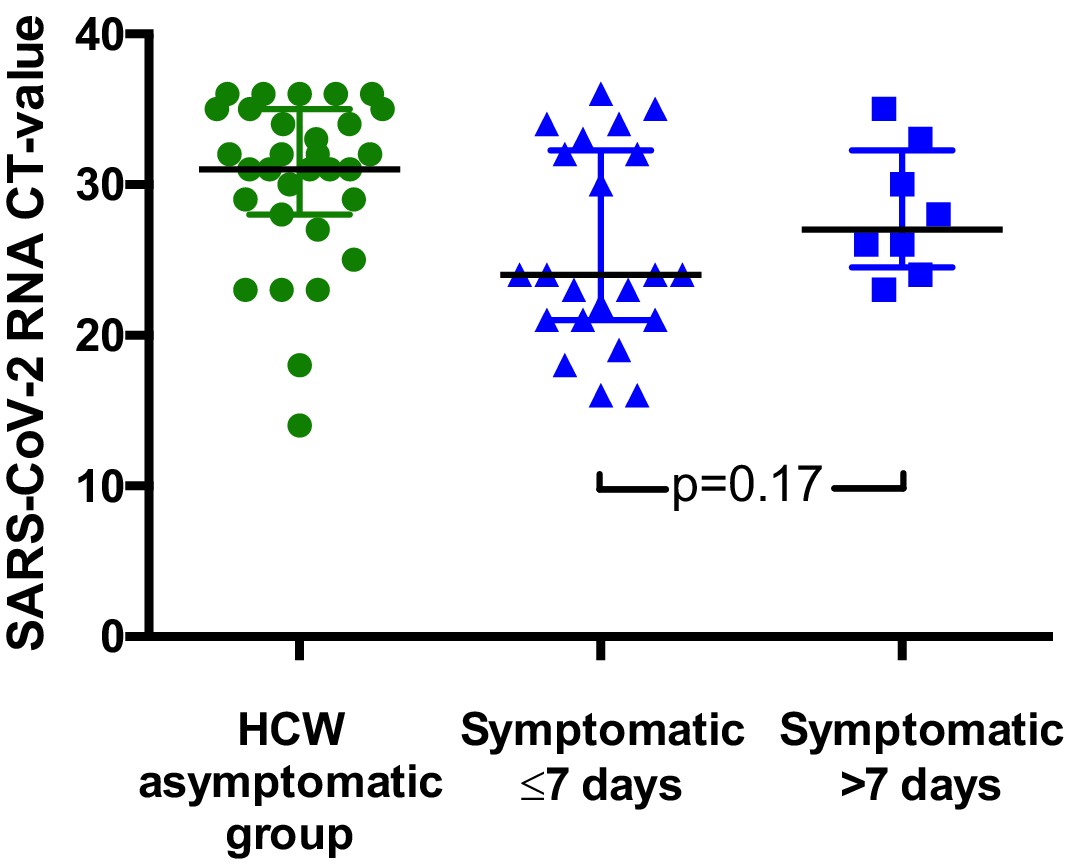
SARS-CoV-2 RNA CT values for HCWs testing positive according to presence and duration of symptoms.
Results from the HCW symptomatic and HCW symptomatic contact groups are considered together in this figure. Individual CT values are shown, along with median and interquartile range for each group. (A). (B).
Figure 2
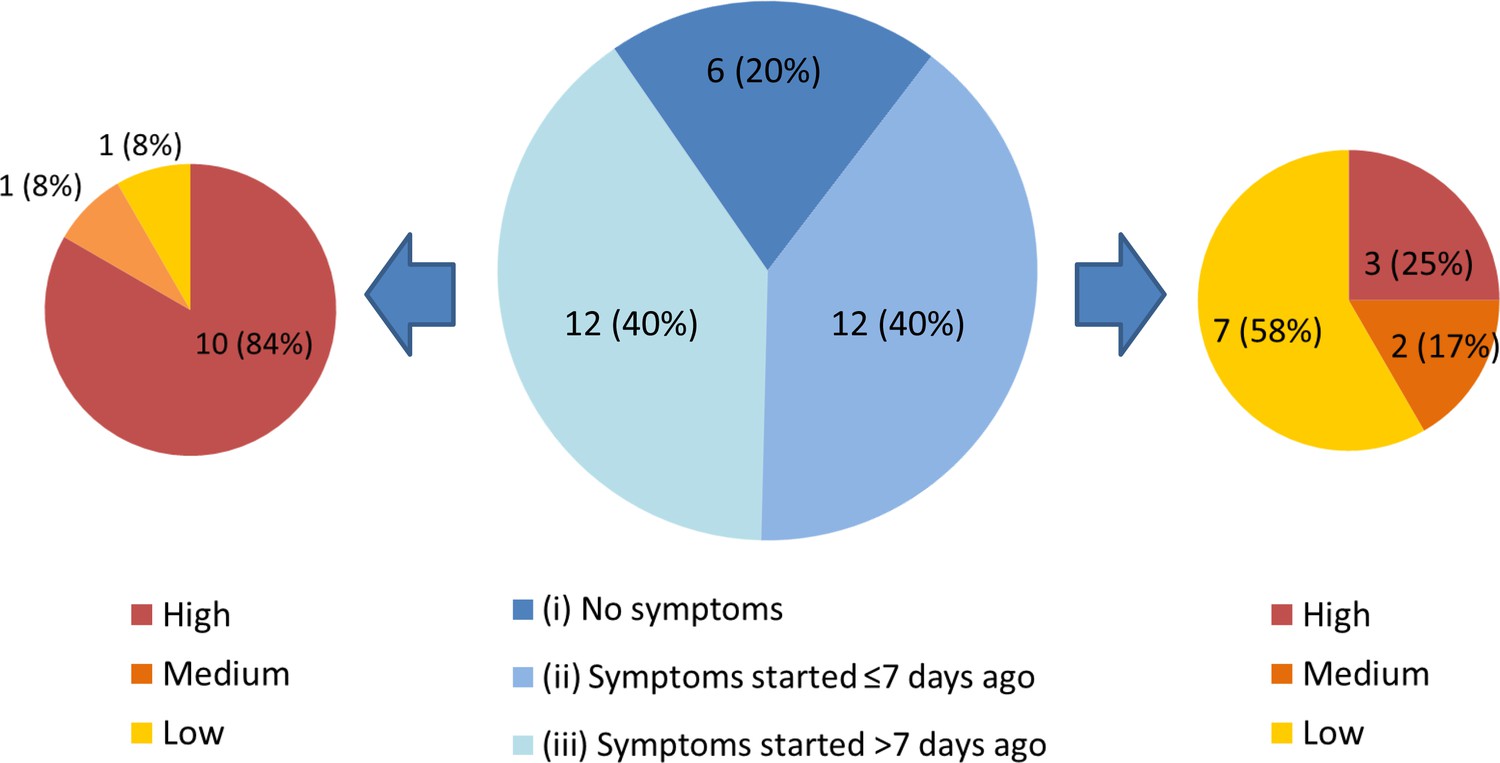
Three subgroups of staff testing SARS-CoV-2 positive from the HCW asymptomatic screening group.
(central pie chart, described in detail in the main text). n = number of individuals (% percentage of total). The peripheral pie charts show number and percentage of individuals in groups (ii – right pie chart) and (iii – left pie chart) with low, medium and high COVID-19 probability symptoms upon retrospective analysis.
Figure 3
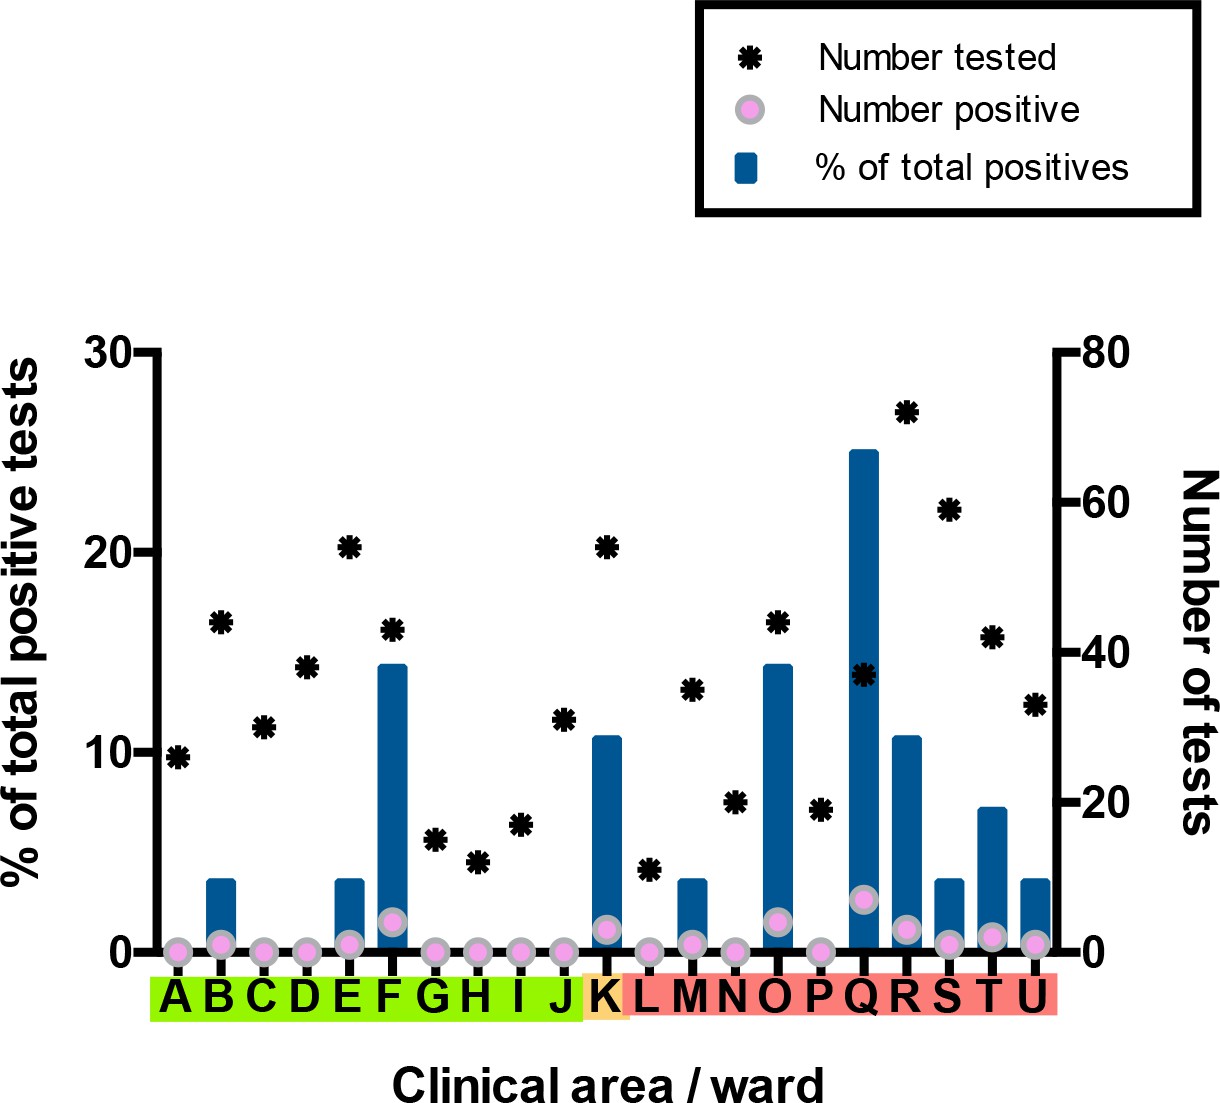
Distribution of SARS-CoV-2 positive cases across 21 clinical areas, detected by ward-based asymptomatic screening.
(underlying data shown in ‘Source Data’). Wards are coloured (‘green’, ‘amber’, ‘red’) according to risk of anticipated exposure to COVID-19 (Table 4). HCWs working across >1 ward were counted for each area. The left-hand y-axis shows the percentage of positive results from a given ward compared to the total positive results from the HCW asymptomatic screening group (blue bars). The right-hand y-axis shows the total number of SARS-CoV-2 tests (stars) and the number positive (pink circles). Additional asymptomatic screening tests were subsequently performed in an intensified manner on ward F and ward Q after identification of clusters of positive cases on these wards (Figure 4). Asymptomatic screening tests were also performed for a number of individuals from other clinical areas on an opportunistic basis; none of these individuals tested positive. Results of these additional tests are included in summary totals in Table 1, but not in this figure.
Figure 4 with 2 supplements

All SARS-CoV-2 positive HCW identified in Wards F and Q, stratified by their mechanism of identification.
Individuals testing positive for SARS-CoV-2 in the ‘HCW asymptomatic screening group’ were identified by the asymptomatic screening programme. Individuals testing positive in the ‘HCW symptomatic/symptomatic household contact groups’ were identified by self-presentation after developing symptoms. Individuals testing positive in the ‘Reactive screening group’ were identified by an intensified screening programme after initial positive clusters had been recognised.
Figure 4—figure supplement 1

Further details of sequencing data.
(A) Comparisons of sequencing success rate vs Ct of HCW samples. Samples with CT less than 33 typically yielded genomes > 90% coverage at a minimum depth of 20x. (B) Lineage assignment of SARS CoV-2 genomes from HCW positive samples. Lineage assignments were generated using the PANGOLIN utility using a comparison against all currently circulating reference lineages.
Figure 4—figure supplement 2

Phylogenetic tree of 34 healthcare worker (HCW) SARS-CoV-2 genomes.
Branch tips are coloured by HCW base ward. 34/35 sequenced genomes passed the filter of <2990 (~10%) N. A SARS-CoV-2 genome collected in Wuhan in December 2019 was selected to root the tree, visualised initially on Nextstrain (https://nextstrain.org/) and the fasta file was downloaded from GISAID (ID: EPI ISL 402123) (https://www.gisaid.org/). Multiple sequence alignment of consensus fasta files was performed using MAFFT with default settings (Katoh K. MAFFT version 7. https://mafft.cbrc.jp/alignment/software/). The alignment was manually inspected using AliView (University U. AliView. https://ormbunkar.se/aliview/). A maximum likelihood tree was produced using IQ-TREE software (http://www.iqtree.org/) with ModelFinder Plus option (-m MFP), which chooses the nucleotide substitution model that minimises Bayesian information criterion (BIC) score. The model ‘chosen’ was TPM2u+F (details: http://www.iqtree.org/doc/Substitution-Models). The tree was manually inspected in FigTree (http://tree.bio.ed.ac.uk/software/figtree/), rooted on the 2019 Wuhan sample, ordered by descending node and exported as a Newick file. The tree was visualised in the online software Microreact (https://microreact.org/showcase) in a private account, exported as a png image, which is shown here. Due to low genetic diversity in the virus (very recent introduction) genomic similarity alone cannot be used to infer transmission chains, as viruses can be identical by chance. Achieving higher resolution on transmission chains requires integrating clinical and detailed epidemiological data with genomic data from HCW and patients to uncover plausible transmission pathways.
Tables
Table 1
Clinical criteria for estimating pre-test probability of COVID-19.
| COVID-19 probability criteria | |
|---|---|
| Major | Fever (>37.8 °C) |
| New persistent cough | |
| Unprotected close contact with a confirmed case* | |
| Minor | Hoarse voice |
| Non-persistent cough | |
| Sore throat | |
| Nasal discharge or congestion | |
| Shortness of breath | |
| Wheeze | |
| Headache | |
| Muscle aches | |
| Nausea and/or vomiting and/or diarrhoea | |
| Loss of sense of taste or smell | |
-
*Unprotected close contact defined as either face-to-face contact or spending more than 15 min within 2 metres of an infected person, without wearing appropriate personal protective equipment (PPE).
Table 2
Categories of pre-test probability of COVID-19, according to the presence of clinical features shown in Table 1.
| Stratification of COVID-19 probability | Implications for exclusion from work | |
|---|---|---|
| High probability | ≥2 major symptoms or ≥1 major symptom and ≥ 2 minor symptoms | Self-isolate for 7 days from the date of onset, regardless of the test result. Only return to work if afebrile for 48 hr and symptoms have improved*. Household contacts should self-quarantine for 14 days from the date of symptom onset in the index case, regardless of the test result. If they develop symptoms, they should self-isolate for 7 days from the date of onset, and only return to work if afebrile for 48 hr and symptoms have improved*. |
| Medium probability | 1 major symptom or 0 major symptoms and ≥ 3 minor symptoms | Test result positive: self-isolate for 7 days from the date of onset, and only return to work if afebrile for 48 hr and symptoms have improved*. Household contacts should self-quarantine for 14 days from the date of index case symptom onset. If they develop symptoms, they should self-isolate for 7 days from the date of onset, and only return to work if afebrile for 48 hr and symptoms have improved*. Test result negative: repeat testing at 48 hr from the initial swab. If repeat testing is positive, follow the advice detailed above. If repeat testing is negative, return to work, unless symptoms worsen. Self-quarantine not required for household contacts. |
| Low probability | 0 major symptoms and 1–2 minor symptoms | Test result positive: self-isolate for 7 days from the date of test, and only return to work if afebrile for 48 hr and symptoms have improved*. Household contacts should self-quarantine for 14 days from the date of test. If they develop symptoms, they should self-isolate for 7 days from the date of onset, and only return to work if afebrile for 48 hr and symptoms have improved*. Test result negative: return to work, unless symptoms worsen. Self-quarantine not required for household contacts. |
| Asymptomatic | 0 major symptoms and 0 minor symptoms | Test result positive: self-isolate for 7 days from the date of test. If symptoms develop after the test, self-isolation should occur for 7 days from the date of onset, and return to work should only occur if afebrile for 48 hr and symptoms have improved*. Household contacts should self-quarantine for 14 days from the date of the test. If they develop symptoms, they should self-isolate for 7 days from the date of onset, and only return to work if afebrile for 48 hr and symptoms have improved*. Test result negative: continue working, unless symptoms develop. Self-quarantine not required for household contacts. |
-
*Residual cough in the absence of other symptoms should not preclude returning to work.
Table 3
Total number of SARS-CoV-2 tests performed in each screening group categorised according to the highest risk ward of potential exposure.
| Clinical area | |||||
|---|---|---|---|---|---|
| Green | Amber | Red | Unknown | Total | |
| HCW asymptomatic screening group | 7/454 (1.5%) | 4/78 (5.1%) | 20/466 (4.3%) | 0/34 (0%) | 31/1032 (3%) |
| HCW symptomatic screening group | 8/66 (12.1%) | 1/9 (11.1%) | 17/88 (19.3%) | 0/6 (0%) | 26/169 (15.4%) |
| HCW symptomatic household contacts | 2/14 (14.3%) | 0/1 (0%) | 0/14 (0%) | 2/23 (8.7%) | 4/52 (7.7%) |
| Unknown | 0/4 (0%) | 0/0 | 0/7 (0%) | 0/4 (0%) | 0/15 (0%) |
| All | 17/538 (3.2%) | 5/88 (5.7%) | 37/575 (6.4%) | 2/67 (3%) | 61/1268 (4.8%) |
Table 4
The hospital’s traffic-light colouring system for categorising wards according to anticipated COVID-19 exposure risk.
Different types of PPE were used in each (Table 5).
| Red (high risk) | Amber (medium risk) | Green (low risk) |
|---|---|---|
| Areas with confirmed SARS-CoV-2 RT-PCR positive patients, or patients with very high clinical suspicion of COVID-19 | Areas with patients awaiting SARS-CoV-2 RT-PCR test results, or that have been exposed and may be incubating infection | Areas with no known SARS-CoV-2 RT-PCR positive patients, and none with clinically suspected COVID-19 |
Table 5
PPE protocols (‘Scenarios’) and their relation to ward category.
| PPE ‘Scenarios’ | ||||
|---|---|---|---|---|
| Scenario 0 | Scenario 1 | Scenario 2 | Scenario 3 | |
| Area description | All clinical areas without any known or suspected COVID-19 cases | Designated ward, triage and assessment-based care with suspected or confirmed COVID-19 patients | Cohorted areas where aerosol-generating procedures are carried out frequently with suspected or confirmed COVID-19 patients | Operating theatres where procedures are performed with suspected or confirmed COVID-19 patients |
| PPE description | Fluid resistant face mask at all times, apron and non-sterile gloves for patient contact (within two metres) | Surgical scrubs, fluid resistant face mask, theatre cap, eye protection, apron and non-sterile gloves | Water repellent gown, FFP3 mask, eye protection, theatre cap, surgical gloves, with an apron and non-sterile gloves in addition for patient contact (within two metres) | Water repellent gown, FFP3 mask, eye protection, theatre cap and surgical gloves |
| Ward categories | Green wards, for example designated areas of emergency department and medical admissions unit. Medical, surgical and haematology wards/outpatient clinics. | Amber + red wards, for example designated areas of emergency department and medical admissions unit. Designated CoVID-19 confirmed wards. | Amber + red wards, for example intensive care unit, respiratory units with non-invasive ventilation facilities. | All operating theatres, including facilities for bronchoscopy and endoscopy. |
Table 6
Details of each SARS-CoV-2 positive isolate from all HCWs and household contacts in the study.
| Patient ID | Type | HCW_ward | Ct value | Seq Attempted | Seq_ID | % Sequence Coverage | Average Seq Depth | PANGOLIN lineage |
|---|---|---|---|---|---|---|---|---|
| C1 | Symptomatic Contact | HCW Contact | 23.9 | Y | CAMB-7FBB0 | 99.61 | 2048.5 | B.1 |
| C3 | Symptomatic Contact | HCW Contact | 23 | N | Not available | |||
| H3 | Asymptomatic | B | 31 | Y | CAMB-7C0C3 | 98.61 | 835.084 | B.1 |
| H54 | Symptomatic | B | 35 | |||||
| H12 | Symptomatic | C | 16 | Y | CAMB-7FB92 | 99.60 | 3312.22 | B.1 |
| H19 | Asymptomatic | E | 27 | Y | CAMB-7FC26 | 99.61 | 3632.26 | B.1.1 |
| C2 | Asymptomatic | F | 15.5 | Y | CAMB-7FC08 | 99.60 | 3157.08 | B.1 |
| H17 | Asymptomatic | F | 33.6 | Y | CAMB-7FBFC | 99.61 | 1167.76 | B.1 |
| H20 | Asymptomatic | F | 18 | Y | CAMB-7FC35 | 99.61 | 1350.65 | B.1 |
| H21 | Asymptomatic | F | 22.8 | Y | CAMB-7FC44 | 99.60 | 3584.79 | B.1 |
| H22 | Symptomatic | F | 24 | Y | CAMB-7FC53 | 99.60 | 3692.14 | B.1.7 |
| H23 | Asymptomatic | F | 32.7 | Y | CAMB-7FC62 | 99.60 | 1610.33 | B.2.1 |
| H35 | Symptomatic | F | 36 | Y | CAMB-8221F | 73.00 | 104.391 | B.1 |
| H36 | Asymptomatic | F | 29 | Y | CAMB-8222E | 98.59 | 1882.65 | B.1.7 |
| H53 | Symptomatic Contact | HCW Contact | 23 | |||||
| H38 | Asymptomatic | K | 36 | N | Not available | |||
| H39 | Asymptomatic | K | 31 | N | Not available | |||
| H28 | Symptomatic | K/R/L/T/OTHER | 18 | Y | CAMB-7FD32 | 99.60 | 3770.36 | B.1.11 |
| H11 | Asymptomatic | M | 32 | Y | CAMB-7FB83 | 99.60 | 1044.43 | B.1 |
| H32 | Symptomatic | N | 33 | Y | CAMB-81007 | 97.62 | 1196.53 | B.1 |
| H47 | Symptomatic | N | 32 | N | Not available | |||
| H31 | Asymptomatic | O | 29 | Y | CAMB-80FFC | 99.59 | 2286.08 | B.1 |
| H45 | Asymptomatic | O | 36 | N | Not available | |||
| H51 | Symptomatic | O | 33 | |||||
| H57 | Symptomatic Contact | O | 23 | |||||
| H1 | Asymptomatic | OTHER | 23 | Y | CAMB-7C0A5 | 98.61 | 2277.92 | B.1 |
| H6 | Symptomatic | OTHER | 30 | Y | CAMB-7FB29 | 98.75 | 1317.43 | B.1 |
| H7 | Symptomatic | OTHER | 26 | Y | CAMB-7FB47 | 99.61 | 3599.59 | B.1 |
| H10 | Symptomatic | OTHER | 22 | Y | CAMB-7FB74 | 99.60 | 187.059 | B.1 |
| H14 | Symptomatic | OTHER | 34 | Y | CAMB-7FBCF | 99.61 | 1066.74 | B.1 |
| H16 | Asymptomatic | OTHER | 27.8 | Y | CAMB-7FBED | 99.60 | 796.874 | B.1 |
| H24 | Symptomatic | OTHER | 21 | Y | CAMB-7FC80 | 98.62 | 916.884 | B.1 |
| H25 | Symptomatic | OTHER | 21 | Y | CAMB-7FC9F | 99.60 | 1505.09 | B.1 |
| H33 | Symptomatic | OTHER | 35 | Y | CAMB-81016 | 90.92 | 233.779 | B.1 |
| H40 | Symptomatic | OTHER | 23 | N | Not available | |||
| H46 | Asymptomatic | OTHER | 36 | N | Not available | |||
| H55 | Symptomatic | Other | 26 | |||||
| H56 | Asymptomatic | Other | 32 | |||||
| H30 | Asymptomatic | OTHER/K/O/F | 31 | Y | CAMB-80FDE | 98.61 | 1773.74 | B.1 |
| H5 | Symptomatic | Q | 24 | Y | CAMB-7C1A2 | 97.75 | 2342.24 | B.1 |
| H8 | Symptomatic | Q | 14 | Y | CAMB-7FB56 | 99.60 | 2452.25 | B.1 |
| H18 | Asymptomatic | Q | 30 | Y | CAMB-7FC17 | 99.60 | 2585.89 | B.1 |
| H29 | Asymptomatic | Q | 31 | Y | CAMB-80AFB | 99.60 | 2028.31 | B.1 |
| H42 | Asymptomatic | Q | 35 | N | Not available | |||
| H44 | Asymptomatic | Q | 28 | N | Not available | |||
| H48 | Asymptomatic | Q | 36 | N | Not available | |||
| H49 | Asymptomatic | Q | 35 | N | Not available | |||
| H4 | Symptomatic | R | 24 | Y | CAMB-7C0D2 | 98.74 | 2083.89 | B.1 |
| H9 | Symptomatic | R | 19 | Y | CAMB-7FB65 | 99.61 | 3288.11 | B.1 |
| H13 | Symptomatic | R | 21 | Y | CAMB-7FBA1 | 99.60 | 3307.61 | B.1 |
| H27 | Asymptomatic | R | 25 | Y | CAMB-7FCBD | 98.61 | 1085.78 | B.1 |
| H34 | Symptomatic | R | 30 | Y | CAMB-81025 | 99.60 | 1997.98 | B.1 |
| H37 | Asymptomatic | R | 35 | N | Not available | |||
| H52 | Asymptomatic | R | 34 | |||||
| H58 | Symptomatic | R/S/A/Q/P/L/N/M/K/Other | 24 | |||||
| H15 | Symptomatic | S/N | 32 | Y | CAMB-7FBDE | 99.60 | 2246.43 | B.1.7 |
| H41 | Asymptomatic | S/Q | 31 | N | Not available | |||
| H2 | Asymptomatic | T | 36 | Y | CAMB-7C0B4 | 93.55 | 293.223 | B.1 |
| H26 | Asymptomatic | T | 32 | Y | CAMB-7FCAE | 0.03 | 0.189437 | Not available |
| H50 | Symptomatic | T | 34 | N | Not available | |||
| H43 | Asymptomatic | U | 32 | N | Not available |
Table 7
Distribution of positive SARS-CoV-2 tests amongst symptomatic individuals with a positive test result, categorised according to test group and COVID-19 symptom-based probability criteria (as defined in Table 2).
| Distribution of COVID-19 clinical probability scores for individuals with a positive SARS-CoV-2 test result | ||||
|---|---|---|---|---|
| High | Medium | Low | Total | |
| HCW symptomatic screening group | 22/26 (85%) | 3/26 (11%) | 1/26 (4%) | 26/26 (100%) |
| HCW symptomatic household contacts | 3/4 (75%) | 0/4 (0%) | 1/4 (25%) | 4/4 (100%) |
Additional files
-
Source data 1
Asymptomatic SARS-CoV-2 screening programme source data.
- https://cdn.elifesciences.org/articles/58728/elife-58728-data1-v2.xlsx
-
Transparent reporting form
- https://cdn.elifesciences.org/articles/58728/elife-58728-transrepform-v2.docx
Download links
A two-part list of links to download the article, or parts of the article, in various formats.
Downloads (link to download the article as PDF)
Open citations (links to open the citations from this article in various online reference manager services)
Cite this article (links to download the citations from this article in formats compatible with various reference manager tools)
Screening of healthcare workers for SARS-CoV-2 highlights the role of asymptomatic carriage in COVID-19 transmission
eLife 9:e58728.
https://doi.org/10.7554/eLife.58728


