Early analysis of the Australian COVID-19 epidemic
- Centre for Epidemiology and Biostatistics, Melbourne School of Population and Global Health, The University of Melbourne, Australia
- Victorian Infectious Diseases Reference Laboratory Epidemiology Unit at The Peter Doherty Institute for Infection and Immunity, The University of Melbourne and Royal Melbourne Hospital, Australia
- Australian Institute of Tropical Health and Medicine, James Cook University, Australia
- Telethon Kids Institute and Curtin University, Australia
- Defence Science and Technology, Department of Defence, Australia
- Kirby Institute for Infection and Immunity, University of New South Wales, Australia
- School of Mathematics and Statistics, University of New South Wales, Australia
- School of Public Health and Community Medicine, University of New South Wales, Australia
- Centre for the Mathematical Modelling of Infectious Diseases, Department of Infectious Disease Epidemiology, London School of Hygiene and Tropical Medicine, United Kingdom
- Infection and Immunity Theme, Murdoch Children’s Research Institute, The Royal Children’s Hospital, Australia
- School of Mathematics and Statistics, The University of Melbourne, Australia
Figures
Figure 1 with 2 supplements
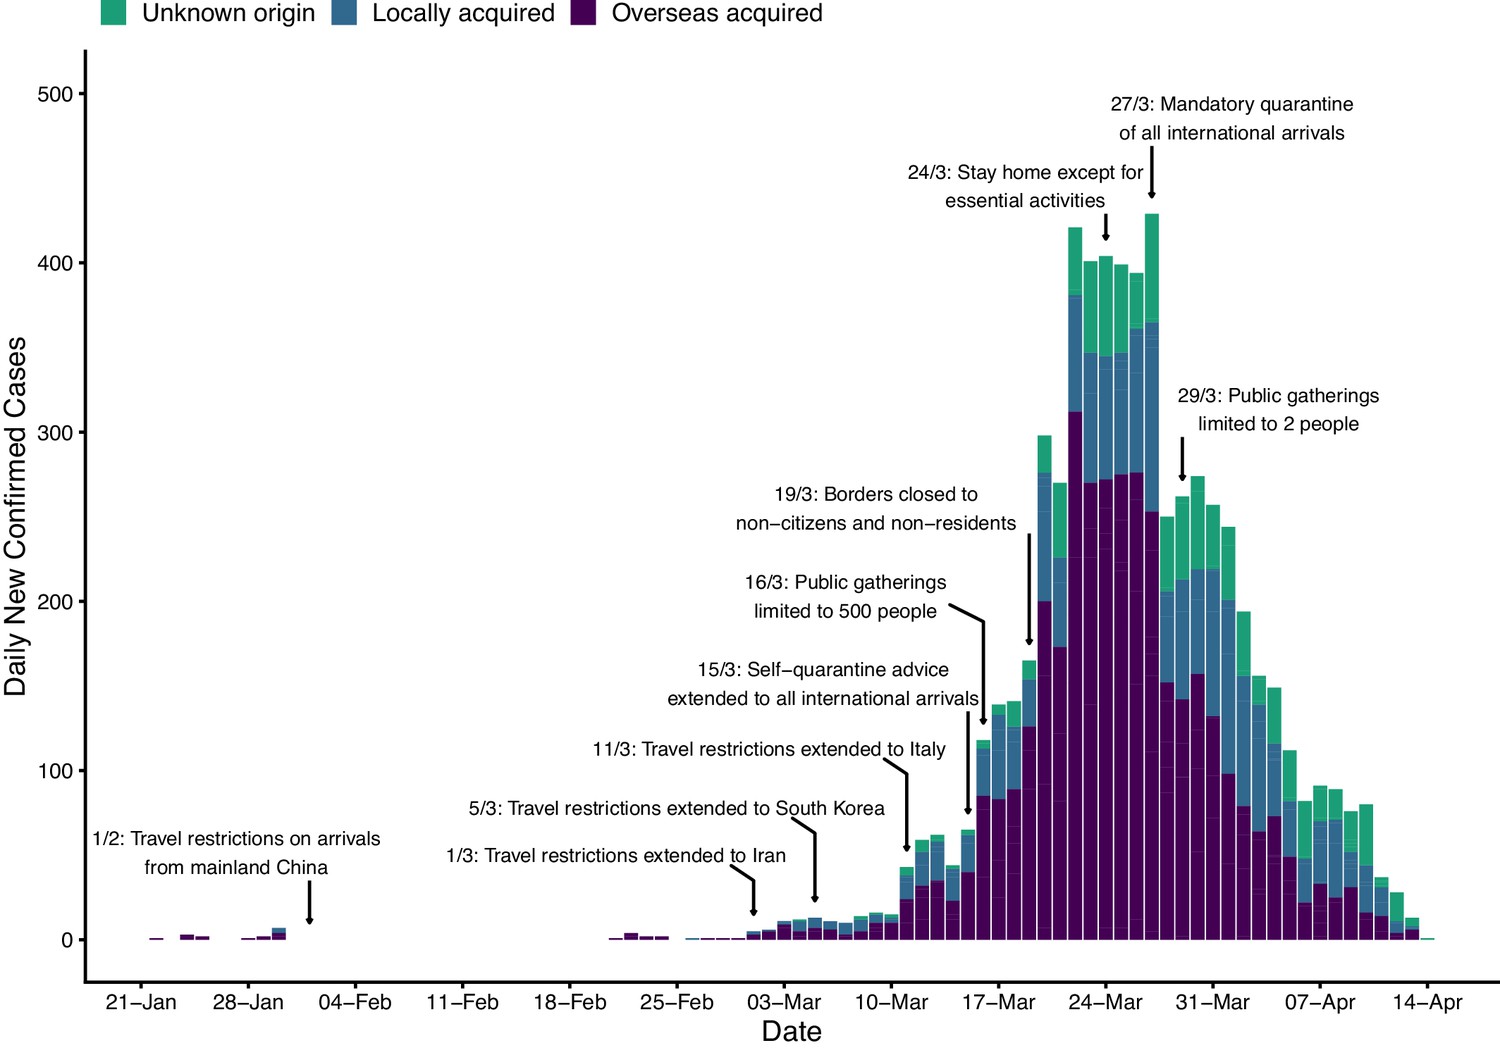
Time series of new daily confirmed cases of COVID-19 in Australia by import status (purple = overseas acquired, blue = locally acquired, green = unknown origin) from 22 January 2020 (first case detected) to 13 April 2020.
Dates of selected key border and social distancing measures implemented by Australian authorities are indicated by annotations above the plotted case counts. These measures were in addition to case targeted interventions (case isolation and contact quarantine) and further border measures, including enhanced testing and provision of advice, on arrivals from other selected countries, based on a risk-assessment tool developed in early February (Shearer et al., 2020). Note that Australian citizens and residents (and their dependants) were exempt from travel restrictions, but upon returning to Australia were required to quarantine for 14 days from the date of arrival. A full timeline of social distancing and border measures is provided in Figure 1—figure supplement 2.
Figure 1—figure supplement 1
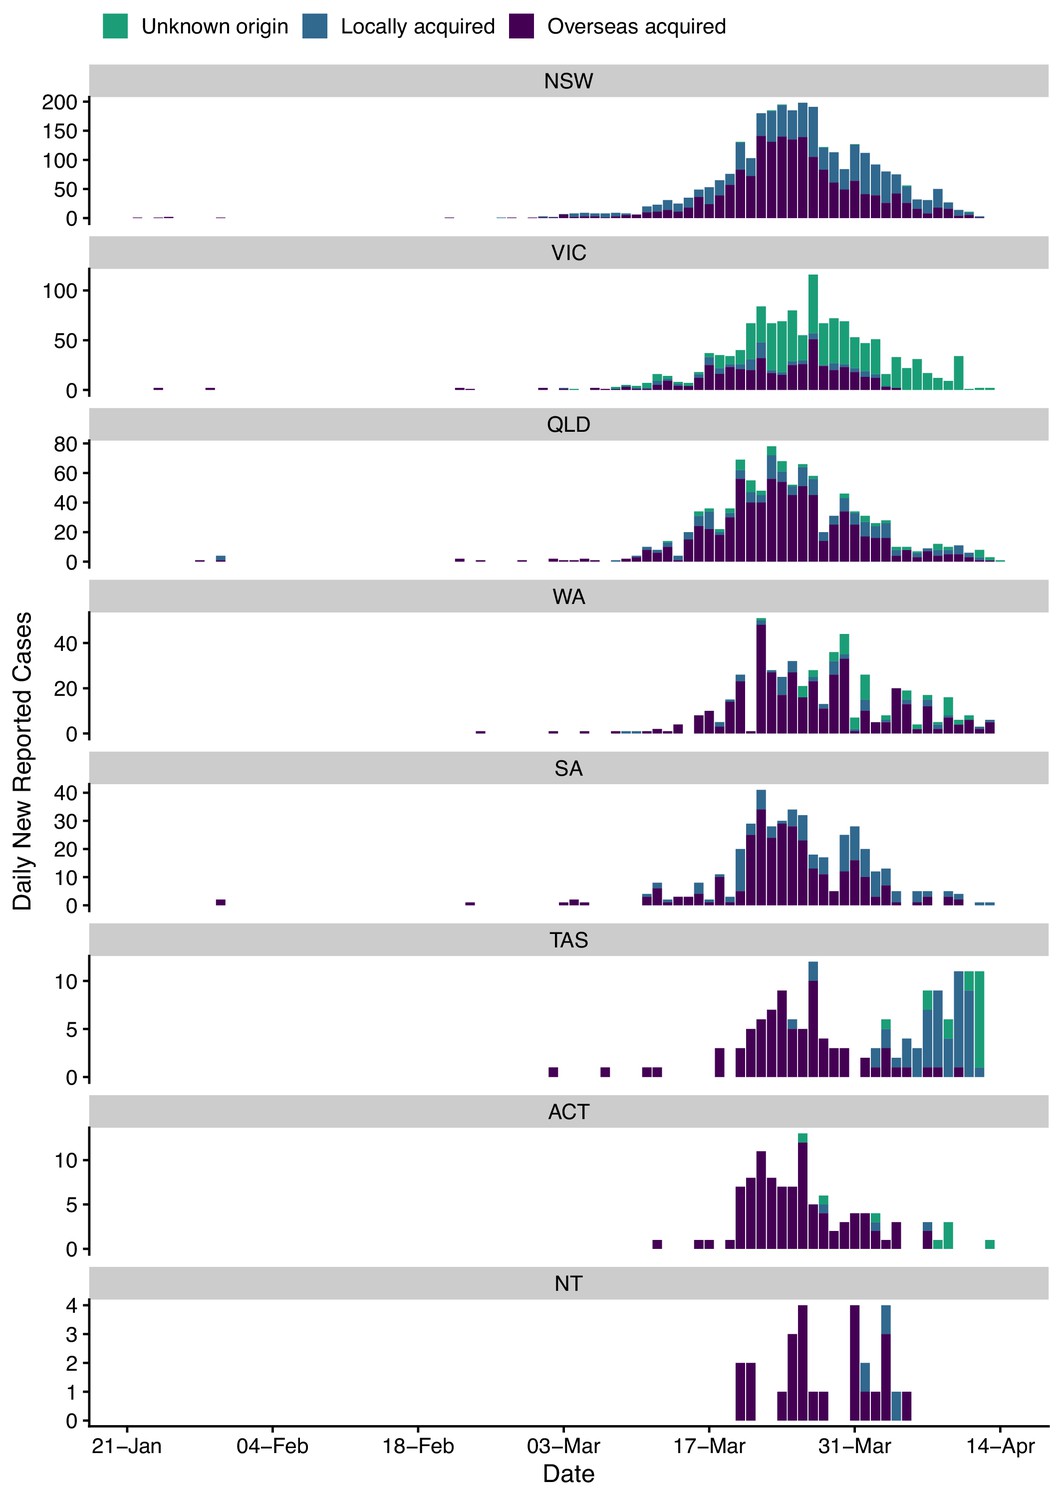
Time series of new daily confirmed cases of COVID-19 in each Australian state/territory by import status (purple = overseas acquired, blue = locally acquired, green = unknown origin) from 22 January 2020 (first case detected) to 13 April 2020.
Details on the epidemiological characteristics of locally and overseas acquired infections are available in the Australian Department of Health fortnightly epidemiological reports (Australian Government Department of Health, 2020e).
Figure 1—figure supplement 2
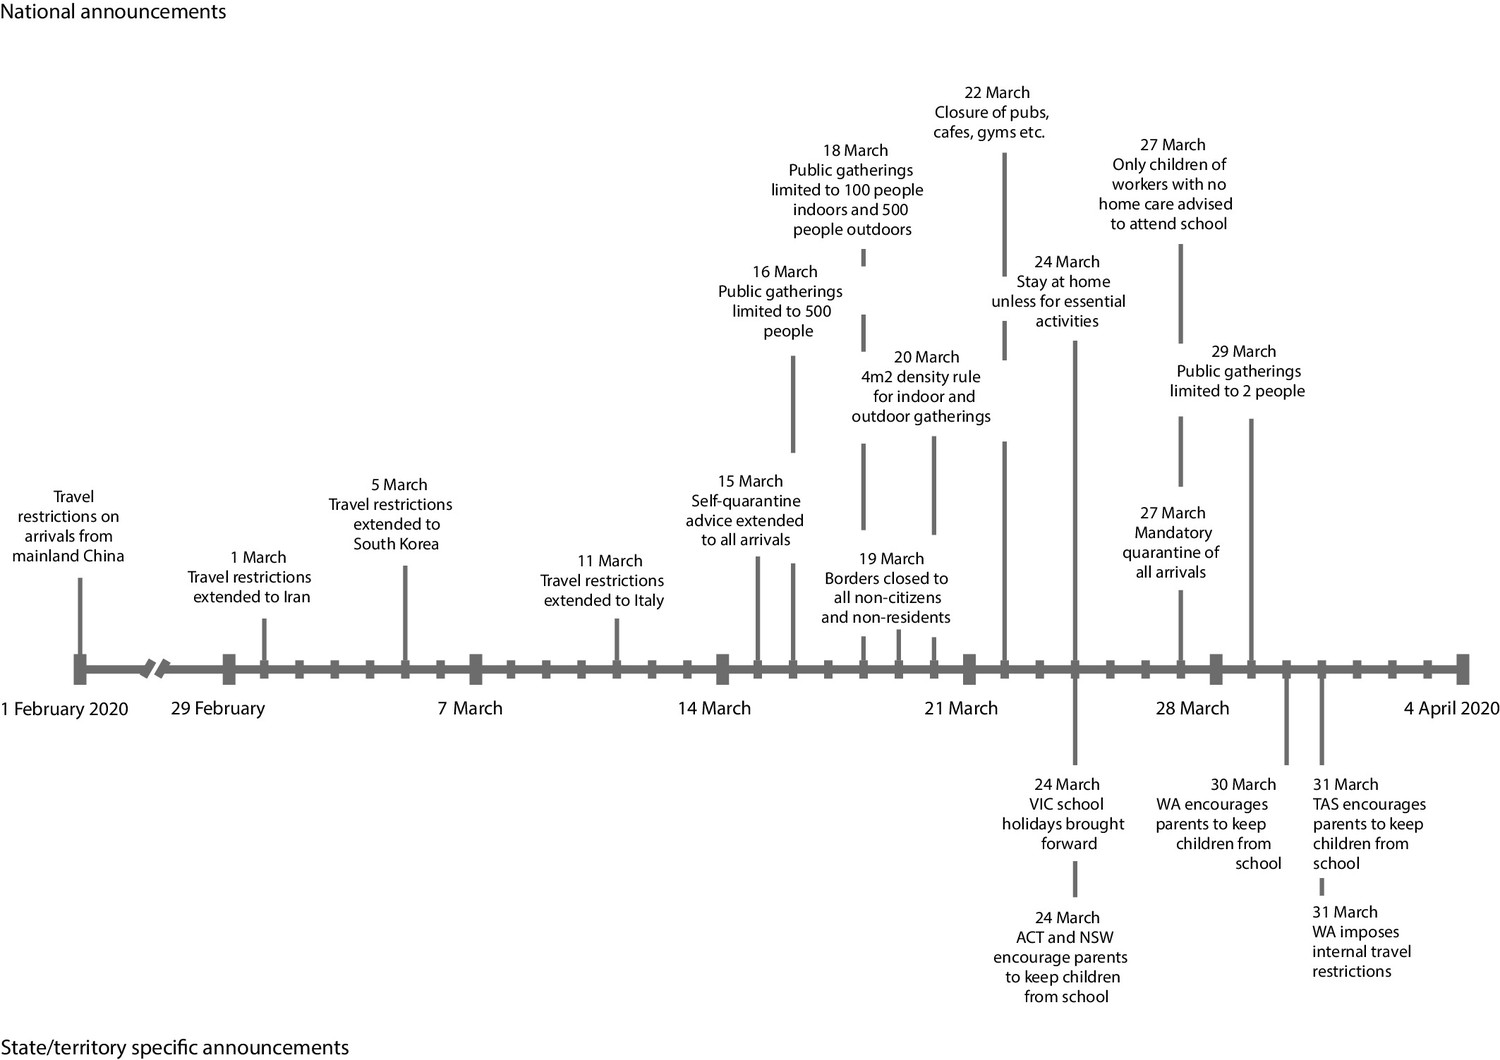
Timeline of border and social distancing measures implemented in Australia up to 4 April 2020.
These measures were in addition to case targeted interventions, specifically case isolation and quarantine of their contacts. Contact tracing was initiated from 29 January 2020 and was performed by public health officials. Note 1: Between 1 February and 15 March, further border measures were introduced, including enhanced testing and provision of advice on arrivals from other selected countries, based on a risk-assessment tool developed in early February (Shearer et al., 2020). Note 2: Australian citizens and residents (and their dependants) were exempt from travel restrictions but upon returning to Australia were required to quarantine for 14 days from the date of arrival. Note 3: School attendance is reported to have reduce substantially following government recommendations to keep children from school (National Centre for Immunisation Research and Surveillance, 2020), and in some cases, prior to these announcements (Carey, 2020). It should also be noted that school holidays in some states/territories overlapped with the restriction periods (late March and early April). Note 4: The use of face masks by the general public was not recommended at any time during the analysis period. Note 5: Personal hygiene measures and the ‘1.5 m distancing rule’ were promoted to the general public through television, print, radio and social media campaigns commissioned by national and state governments.
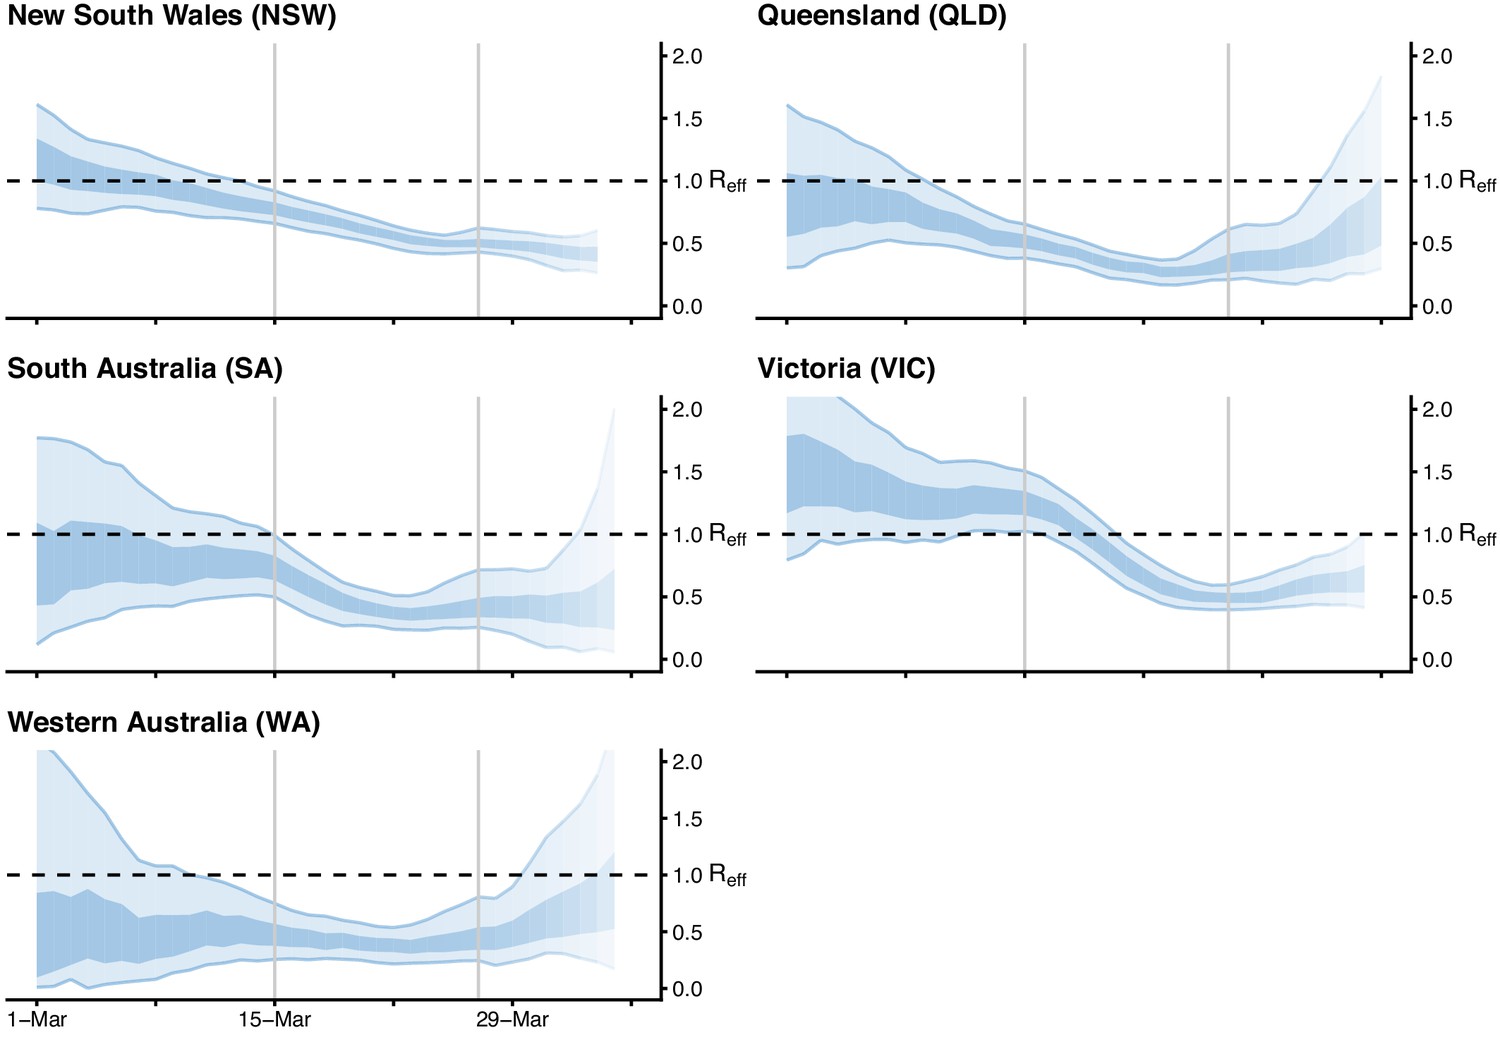
Figure 2 with 3 supplements
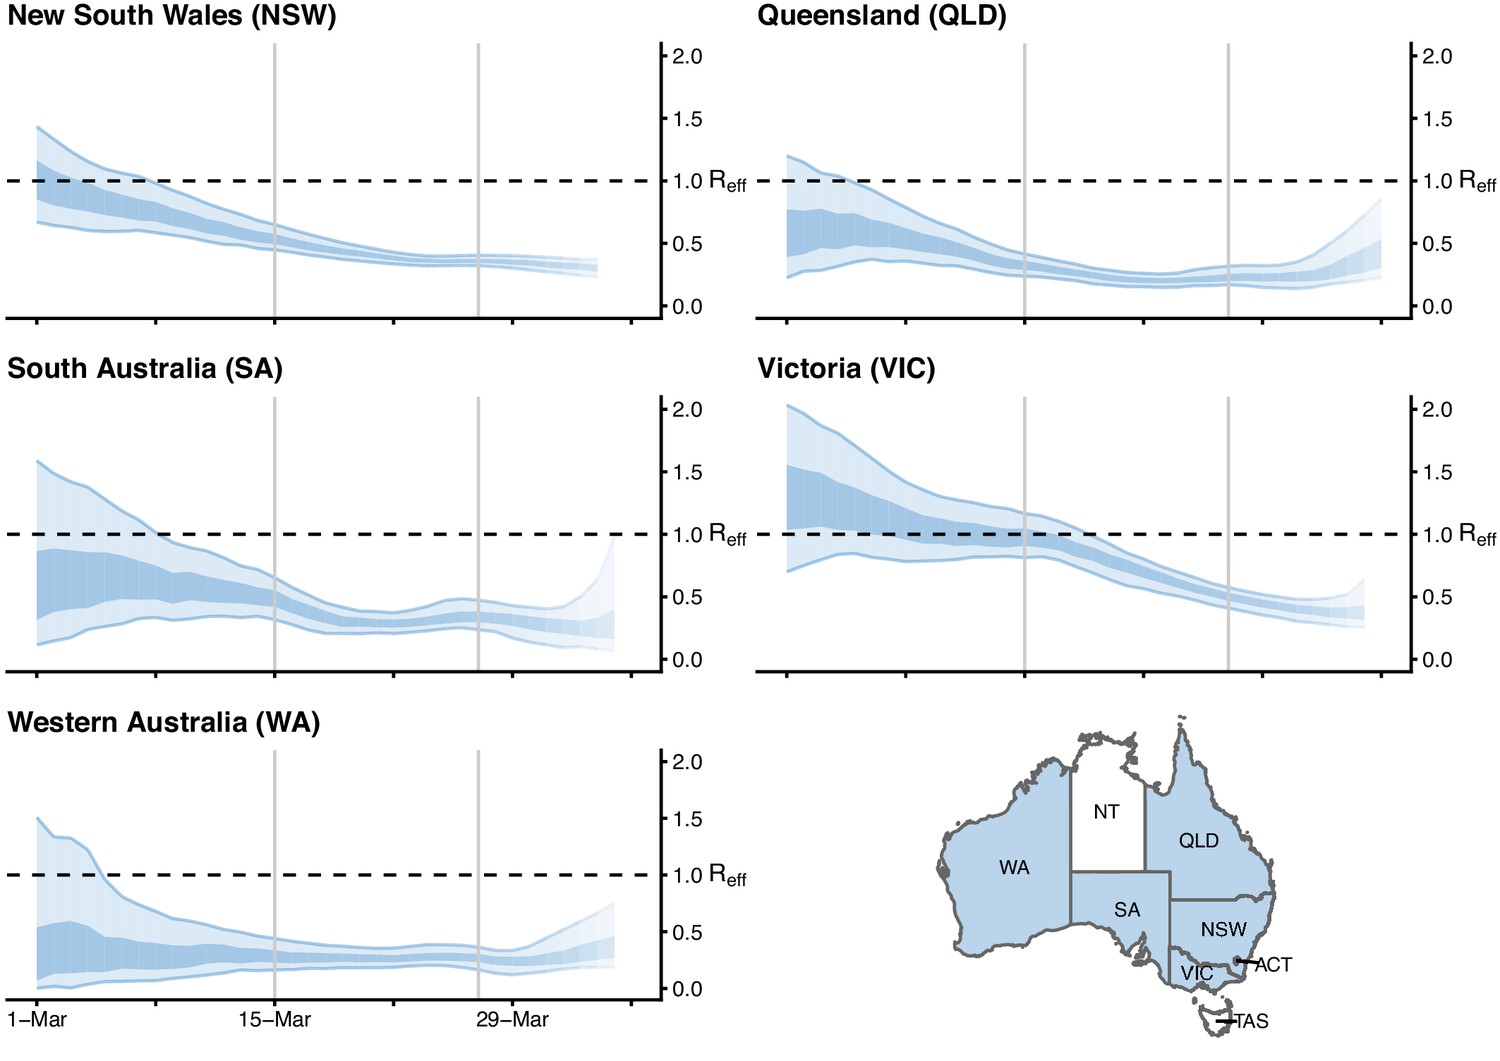
Time-varying estimate of the effective reproduction number () of COVID-19 by Australian state (light blue ribbon = 90% credible interval; dark blue ribbon = 50% credible interval) from 1 March to 5 April 2020, based on data up to and including 13 April 2020.
Confidence in the estimated values is indicated by shading with reduced shading corresponding to reduced confidence. The horizontal dashed line indicates the target value of 1 for the effective reproduction number required for control. Not presented are the Australian Capital Territory (ACT), Northern Territory (NT) and Tasmania (TAS), as these states/territories had insufficient local transmission. The uncertainty in the estimates represent variability in a population-level average as a result of imperfect data, rather than individual-level heterogeneity in transmission (i.e., the variation in the number of secondary cases generated by each case).
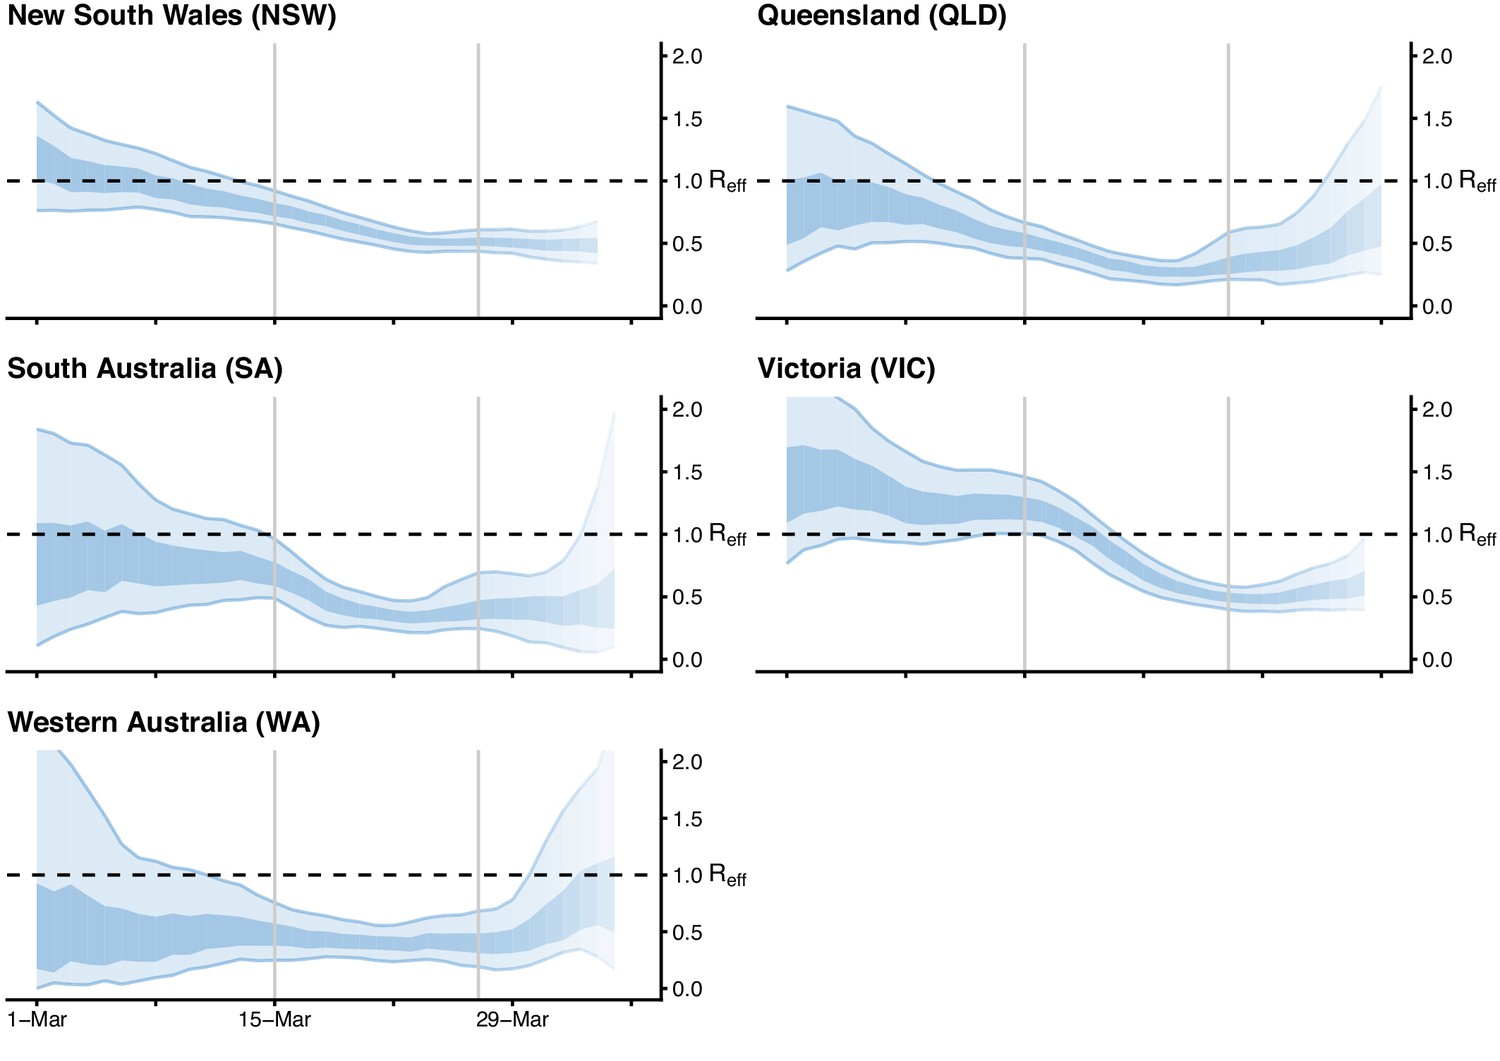
Figure 2—figure supplement 1
Sensitivity analysis 1 of 3.
Time-varying estimate of the effective reproduction number () of COVID-19 by Australian state (light blue ribbon = 90% credible interval; dark blue ribbon = 50% credible interval) from 1 March to 5 April 2020, based on data up to and including 13 April 2020. Confidence in the estimated values is indicated by shading, with reduced shading corresponding to reduced confidence. The horizontal dashed line indicates the target value of 1 for the effective reproduction number required for control. Results are produced assuming stepwise changes in the relative infectiousness of locally acquired to imported cases according to quarantine requirements for returning travellers introduced on 15 and 27 March (indicated by vertical grey lines). We assumed that 90%, 50%, and 1% of imported cases contributed to transmission prior to 15 March, between 15 and 27 March (inclusive), and after 27 March, respectively.
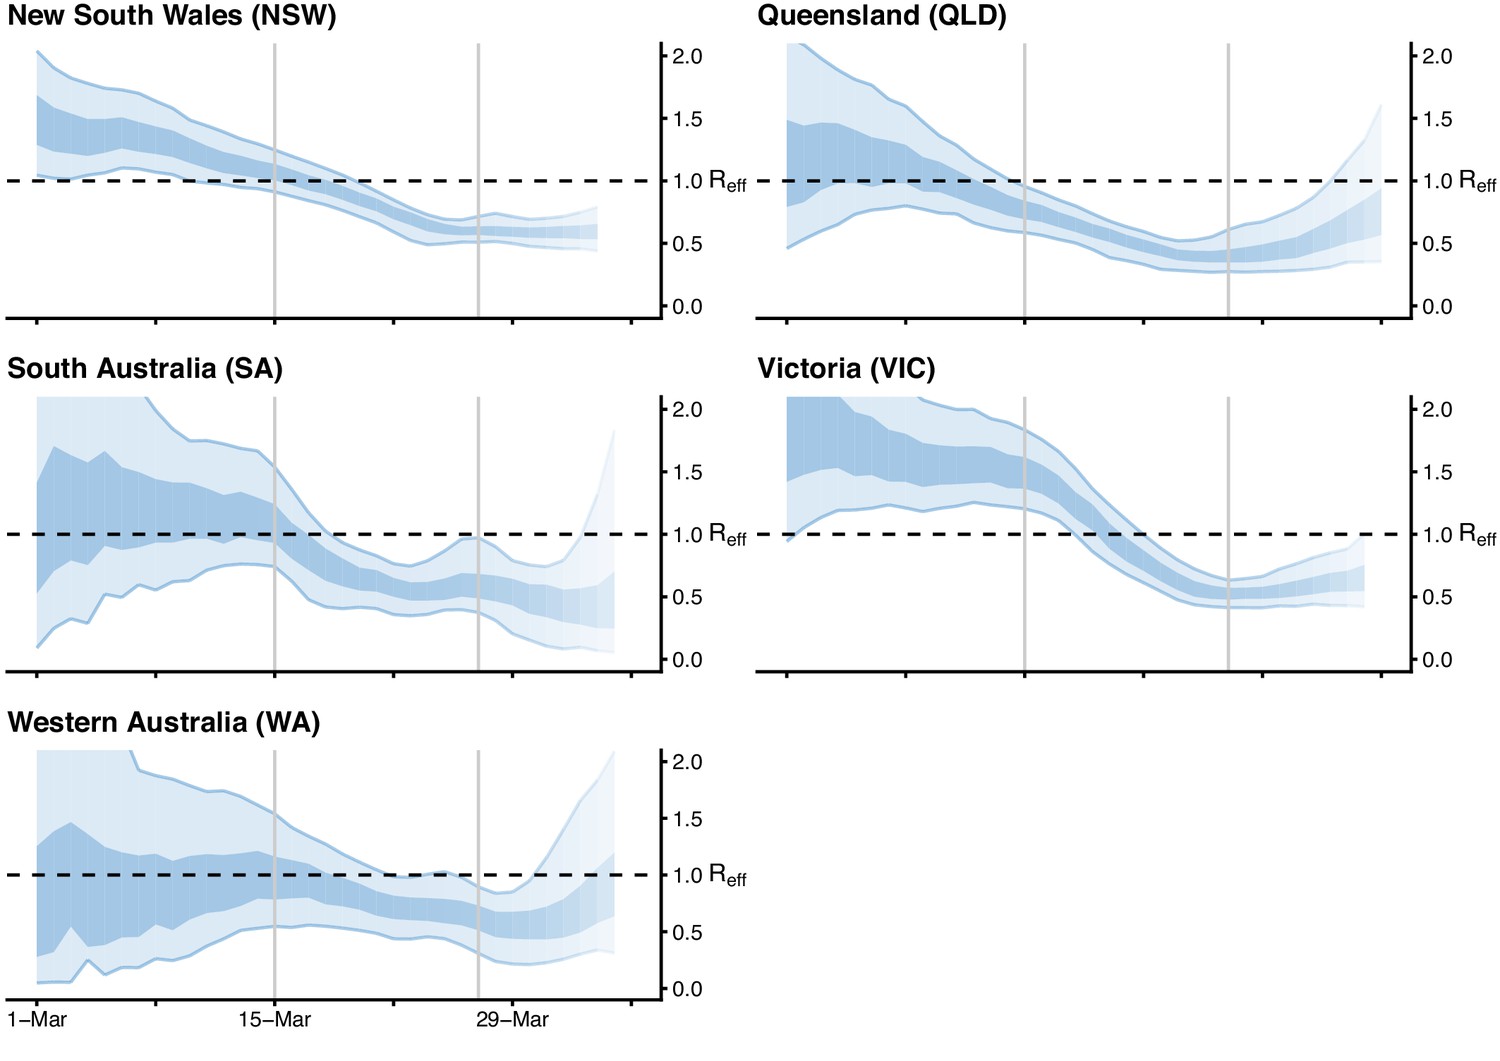
Figure 2—figure supplement 2
Sensitivity analysis 2 of 3.
Time-varying estimate of the effective reproduction number () of COVID-19 by Australian state (light blue ribbon = 90% credible interval; dark blue ribbon = 50% credible interval) from 1 March to 5 April 2020, based on data up to and including 13 April 2020. Confidence in the estimated values is indicated by shading, with reduced shading corresponding to reduced confidence. The horizontal dashed line indicates the target value of 1 for the effective reproduction number required for control. Results are produced assuming stepwise changes in the relative infectiousness of locally acquired to imported cases according to quarantine requirements for returning travellers introduced on 15 and 27 March (indicated by vertical grey lines). We assumed that 80%, 50%, and 1% of imported cases contributed to transmission prior to 15 March, between 15 and 27 March (inclusive), and after 27 March, respectively.
Figure 2—figure supplement 3
Sensitivity analysis 3 of 3.
Time-varying estimate of the effective reproduction number () of COVID-19 by Australian state (light blue ribbon = 90% credible interval; dark blue ribbon = 50% credible interval) from 1 March to 5 April 2020, based on data up to and including 13 April 2020. Confidence in the estimated values is indicated by shading, with reduced shading corresponding to reduced confidence. The horizontal dashed line indicates the target value of 1 for the effective reproduction number required for control. Results are produced assuming stepwise changes in the relative infectiousness of locally acquired to imported cases according to quarantine requirements for returning travellers introduced on 15 and 27 March (indicated by vertical grey lines). We assumed 50%, 20%, and 1% of imported cases contributed to transmission prior to 15 March, between 15 and 27 March (inclusive), and after 27 March, respectively.
Figure 3 with 1 supplement
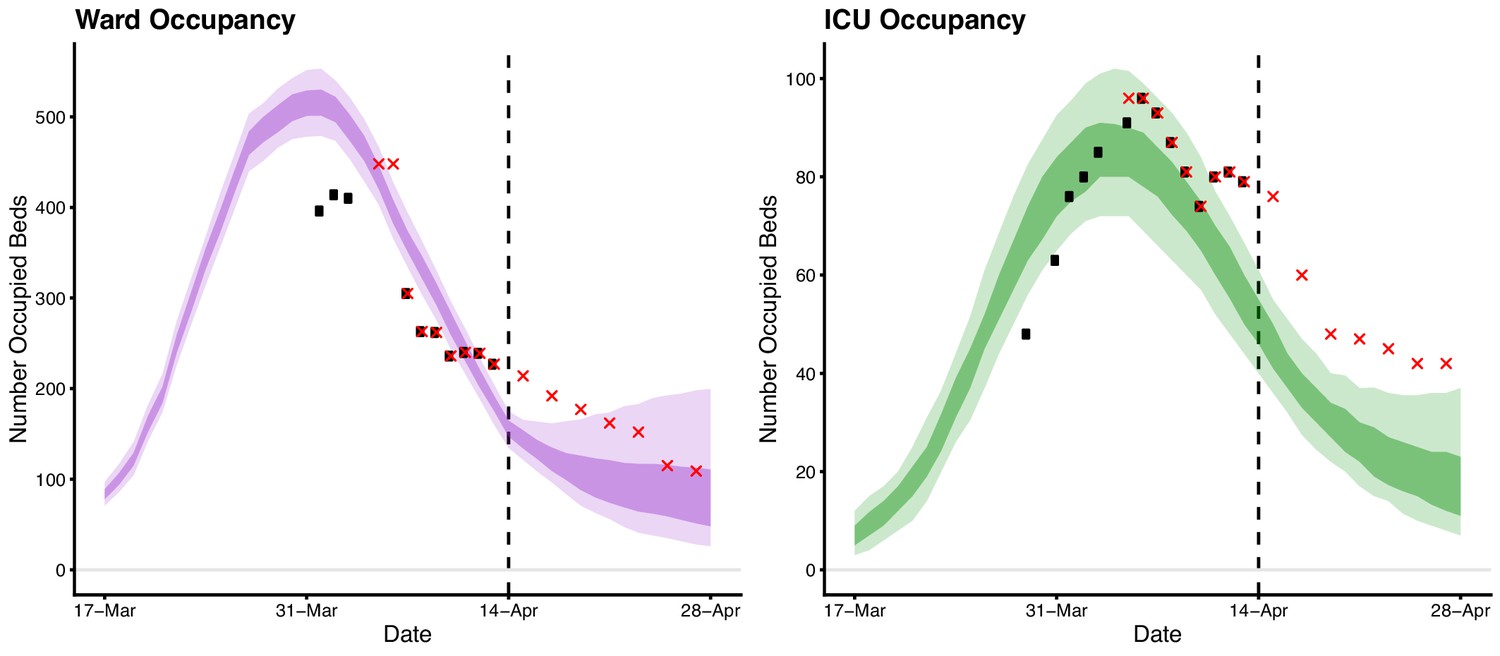
Forecasted daily hospital ward (left) and intensive care unit (right) occupancy (dark ribbons = 50% confidence intervals; light ribbons = 95% confidence intervals) from 17 March to 28 April.
Occupancy = the number of beds occupied by COVID-19 patients on a given day. Black dots indicate the reported ward and ICU occupancy available from the Australian national COVID-19 database at the time. These data were retrospectively updated where complete data were available (red crosses). Australian health system ward and ICU bed capacities are estimated to be over 25,000 and 1,100, respectively, under the assumption that 50% of total capacity could possibly be dedicated to COVID-19 patients (Australian Institute of Health and Welfare, 2019). The forecasted daily case counts are shown in Figure 3—figure supplement 1.
Figure 3—figure supplement 1
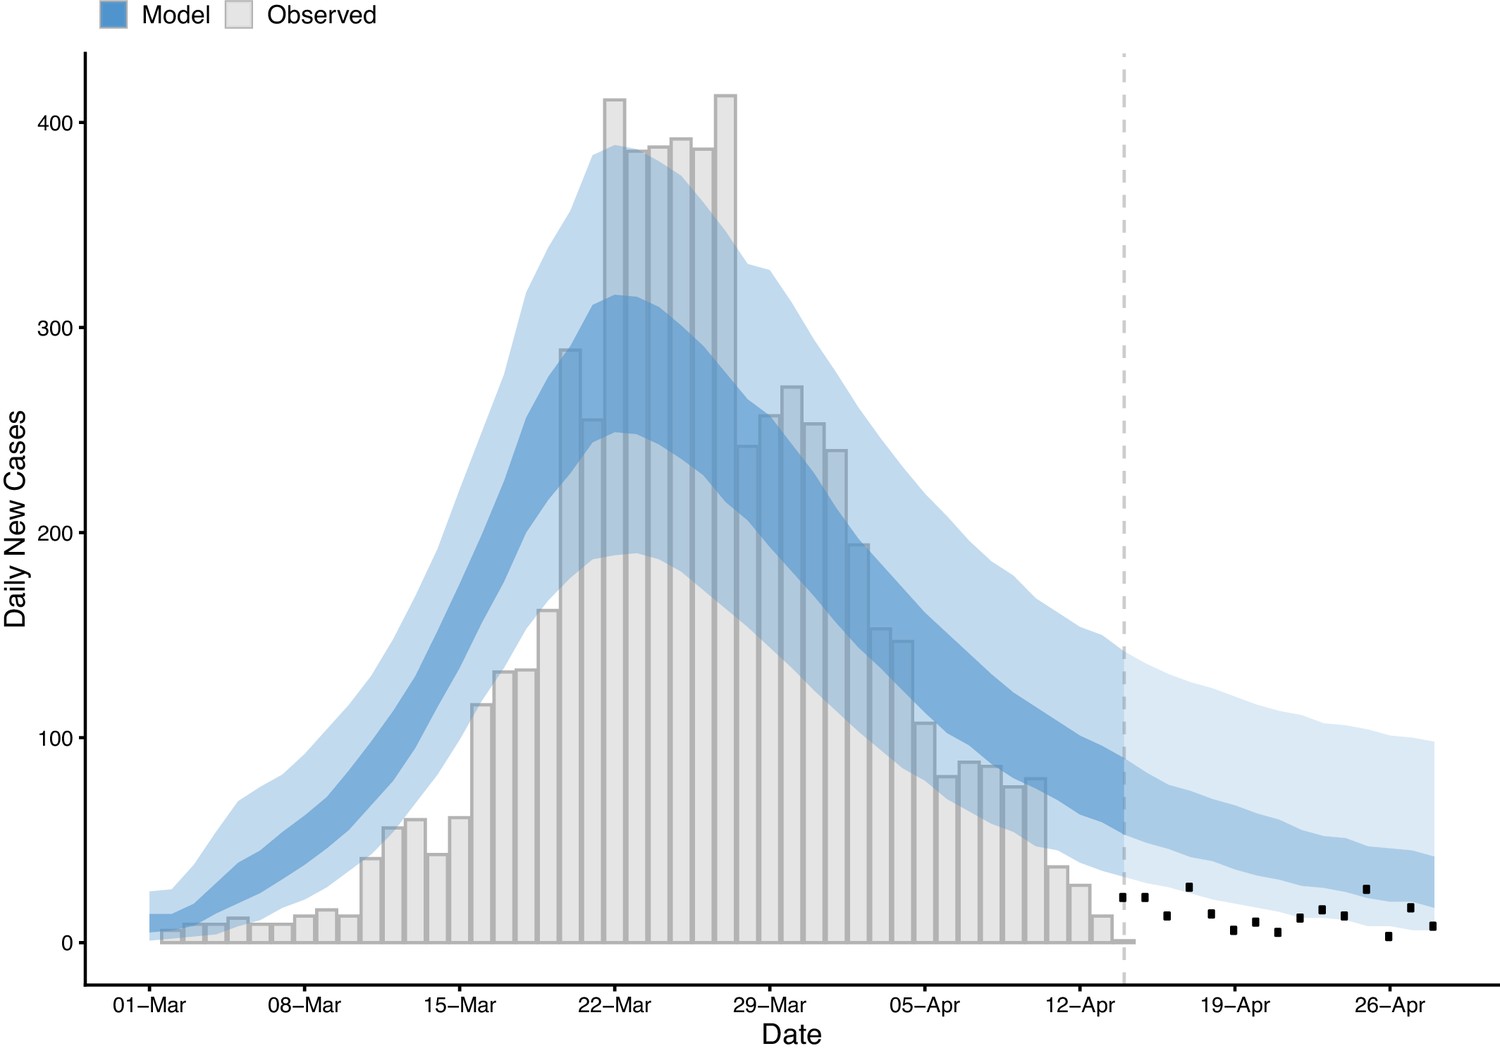
Time series of new daily confirmed cases of COVID-19 in Australia from 1 March to 13 April 2020 (grey bars) overlaid by daily case counts estimated from the forecasting model up to April 13 and projected forward from 14 to 28 April inclusive.
Inner shading = 50% confidence intervals. Outer shading = 95% confidence intervals. Note that forecasting model estimates prior to 13 April — the last recorded data point at the time of analysis (indicated by the dashed grey line) — use data up to and including the previous day. Black dots show the number of new daily cases of COVID-19 reported from 14 to 28 April.
Tables
Table 1
Age-specific proportions of confirmed cases extracted from the Australian national COVID-19 database and age-specific estimates of the probability of hospitalisation and ICU admission for confirmed cases.
| Age | Proportion of cases | Pr(hospitalisation | confirmed case) | Pr(ICU admission | confirmed case) |
|---|---|---|---|
| 0-9 | 0.0102 | 0.1475 | 0.0000 |
| 10-18 | 0.0186 | 0.1081 | 0.0090 |
| 19-29 | 0.2258 | 0.0504 | 0.0007 |
| 30-39 | 0.1587 | 0.0865 | 0.0074 |
| 40-49 | 0.1291 | 0.0947 | 0.0208 |
| 50-59 | 0.1550 | 0.1112 | 0.0173 |
| 60-69 | 0.1686 | 0.1529 | 0.0318 |
| 70-79 | 0.1050 | 0.2440 | 0.0558 |
| 80+ | 0.0290 | 0.3815 | 0.0462 |
Table 2
Percentage of imported cases assumed to be contributing to transmission over three intervention phases for each sensitivity analysis.
We assume two step changes in the effectiveness of quarantine of overseas arrivals, resulting in three intervention phases: prior to 15 March (self-quarantine of arrivals from selected countries); 15–27 March inclusive (self-quarantine of arrivals from all countries); and 27 March onward (mandatory quarantine of overseas arrivals from all countries).
| Imported cases contributing to transmission | |||
|---|---|---|---|
| Sensitivity analysis | Prior to 15 March | 15–27 March | 27 March– |
| 1 | 90% | 50% | 1% |
| 2 | 80% | 50% | 1% |
| 3 | 50% | 20% | 1% |
-
The results of these three analyses are shown in Figure 2—figure supplements 1, 2 and 3, respectively.
Table 3
SEEIIR forecasting model parameters.
| Parameter | Definition | Value/Prior distribution |
|---|---|---|
| σ | Inverse of the mean incubation period | |
| γ | Inverse of the mean infectious period | |
| τ | Time of first exposure (days since 2020-01-01) | |
| Probability of observing a case | 0.8 | |
| k | Dispersion parameter on Negative-Binomial | 100 |
| observation model |
Additional files
-
Source code 1
Analysis code.
- https://cdn.elifesciences.org/articles/58785/elife-58785-code1-v2.zip
-
Transparent reporting form
- https://cdn.elifesciences.org/articles/58785/elife-58785-transrepform-v2.docx
Download links
A two-part list of links to download the article, or parts of the article, in various formats.
Downloads (link to download the article as PDF)
Open citations (links to open the citations from this article in various online reference manager services)
Cite this article (links to download the citations from this article in formats compatible with various reference manager tools)
Early analysis of the Australian COVID-19 epidemic
eLife 9:e58785.
https://doi.org/10.7554/eLife.58785


