Gene autoregulation by 3’ UTR-derived bacterial small RNAs
- Friedrich Schiller University Jena, Institute of Microbiology, Germany
- Faculty of Biology I, Ludwig-Maximilians-University of Munich, Germany
- TH Köln - University of Applied Sciences, Institute of Information Science, Germany
- ZB MED - Information Centre for Life Sciences, Germany
- Microverse Cluster, Friedrich Schiller University Jena, Germany
Figures
Figure 1 with 6 supplements
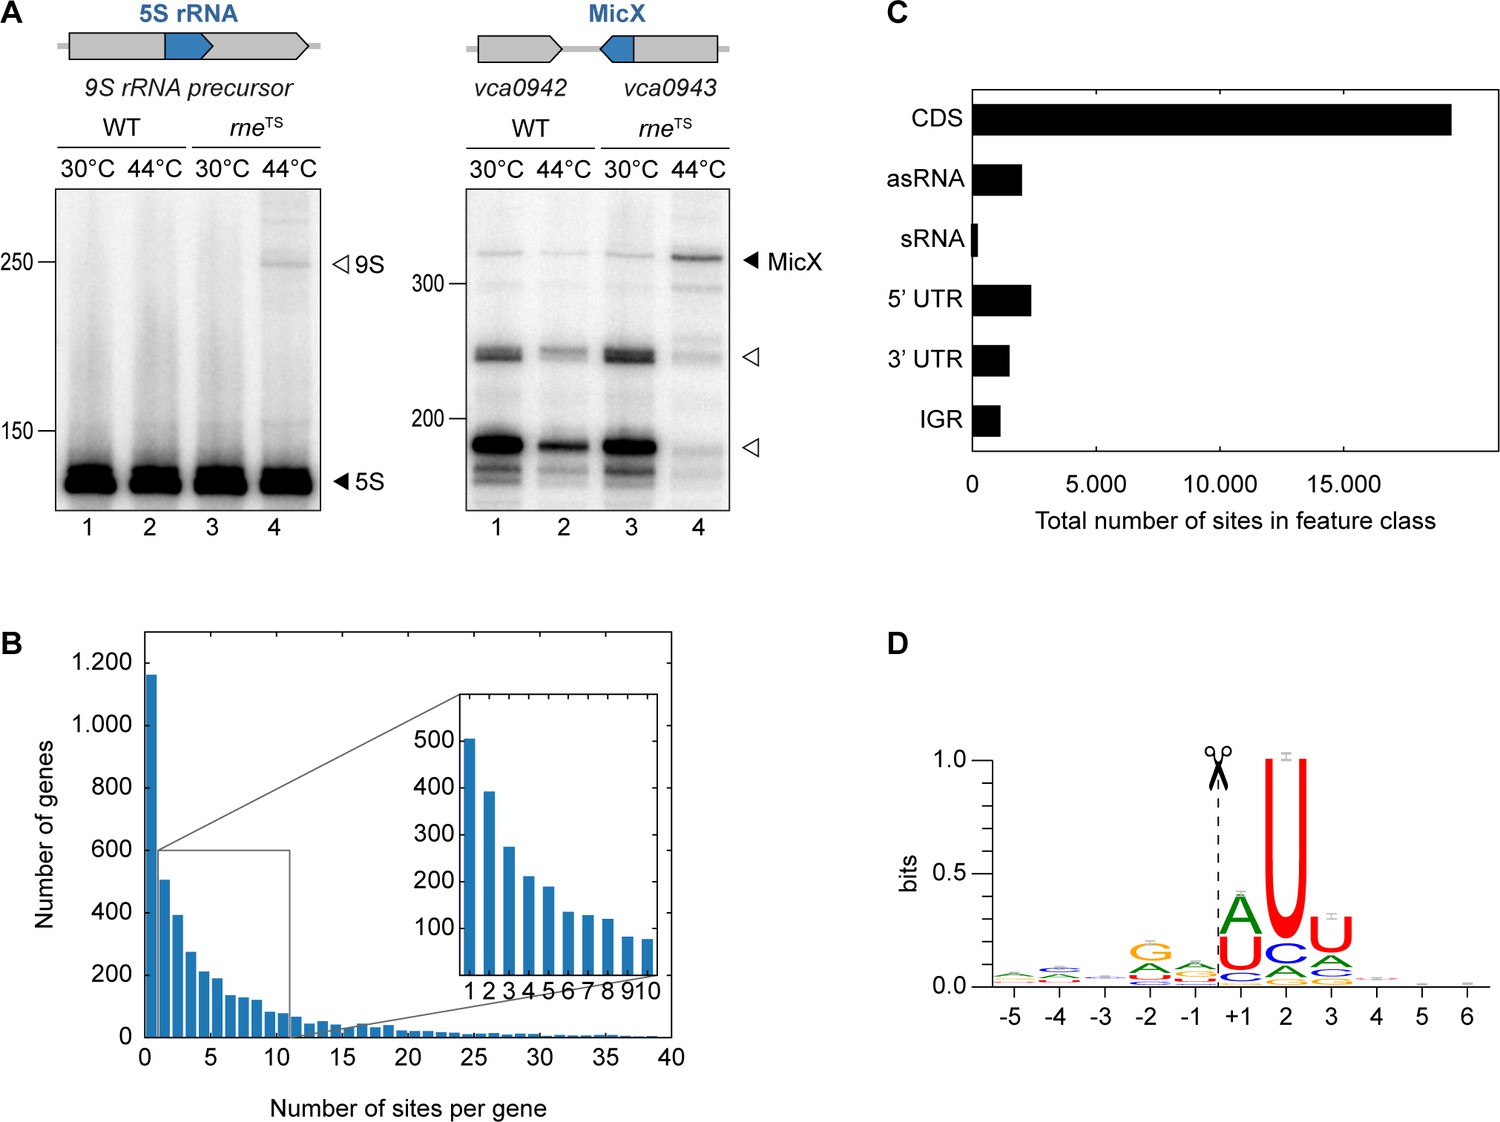
TIER-seq analysis of V. cholerae.
(A) V. cholerae wild-type and rneTS strains were grown at 30°C to stationary phase (OD600 of 2.0). Cultures were divided in half and continuously grown at either 30°C or 44°C for 60 min. Cleavage patterns of 5S rRNA and 3’ UTR-derived MicX were analyzed on Northern blots. Closed triangles indicate mature 5S or full-length MicX, open triangles indicate the 9S precursor or MicX processing products. (B, C, D) Biological triplicates of V. cholerae wild-type and rneTS strains were grown at 30°C to late exponential phase (OD600 of 1.0). Cultures were divided in half and continuously grown at either 30°C or 44°C for 60 min. Isolated RNA was subjected to RNA-seq and RNase E cleavage sites were determined as described in the materials and methods section. (B) Number of cleavage sites detected per gene. (C) Classification of RNase E sites by their genomic location. (D) The RNase E consensus motif based on all detected cleavage sites. The total height of the error bar is twice the small sample correction.
-
Figure 1—source data 1
Full Northern blot images for the corresponding detail sections shown in Figure 1 and RNase E cleavage site counts within genes or transcript categories.
- https://cdn.elifesciences.org/articles/58836/elife-58836-fig1-data1-v1.docx
Figure 1—figure supplement 1
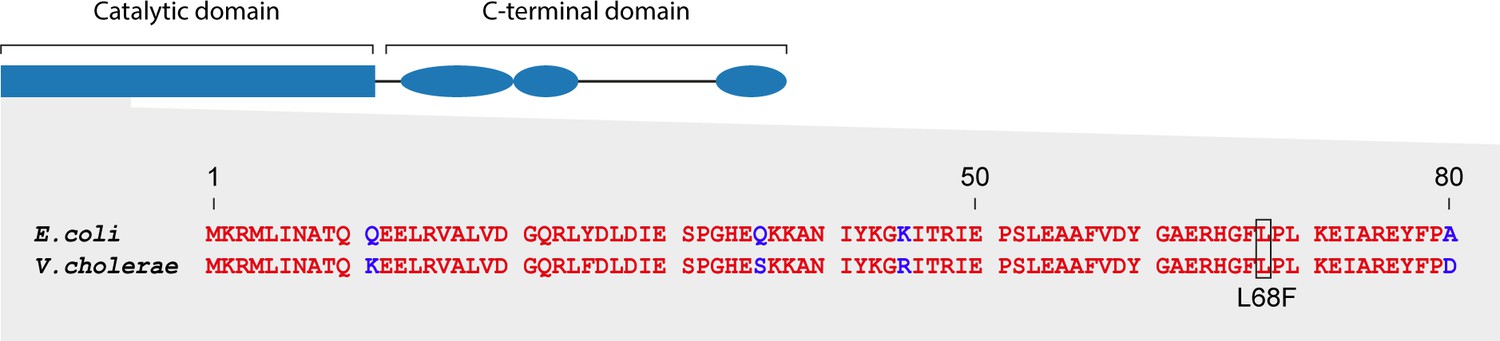
Conservation of RNase E between E. coli and V. cholerae.
Sequence alignment of the first 80 N-terminal amino acids of RNase E from E. coli and V. cholerae. The temperature-sensitive rne-3071 mutation changing a leucine to phenylalanine at position 68 is indicated.
Figure 1—figure supplement 2

TIER-Seq read mapping statistics.
TIER-seq was performed as described in Figure 1. (A) Total number of raw cDNA reads obtained for all samples, showing the fractions of uniquely aligned reads (dark green), multiply aligned reads (light green) or unaligned reads (grey). R1-R3 indicate the biological triplicates. (B) Similarity of 5’ ends profiles of uniquely aligned reads, obtained by comparison of all detected 5’ end positions between the respective cDNA libraries. Colored rectangles show the Pearson correlation coefficient corresponding to the scale bar on the right. (C) Global analysis of 5’ profiles at the permissive (30°C, left) and non-permissive temperature (44°C, right). Plots show average coverage levels of 5’ read ends and the respective log2 fold change in wild-type samples compared to rneTS samples. Candidate RNase E cleavage sites were determined as positions enriched ≥3 fold in the wild-type (p-value<0.05) and are shown in dark blue.
-
Figure 1—figure supplement 2—source data 1
Number of obtained sequencing reads and Pearson correlation coefficients for library comparisons.
- https://cdn.elifesciences.org/articles/58836/elife-58836-fig1-figsupp2-data1-v1.docx
Figure 1—figure supplement 3
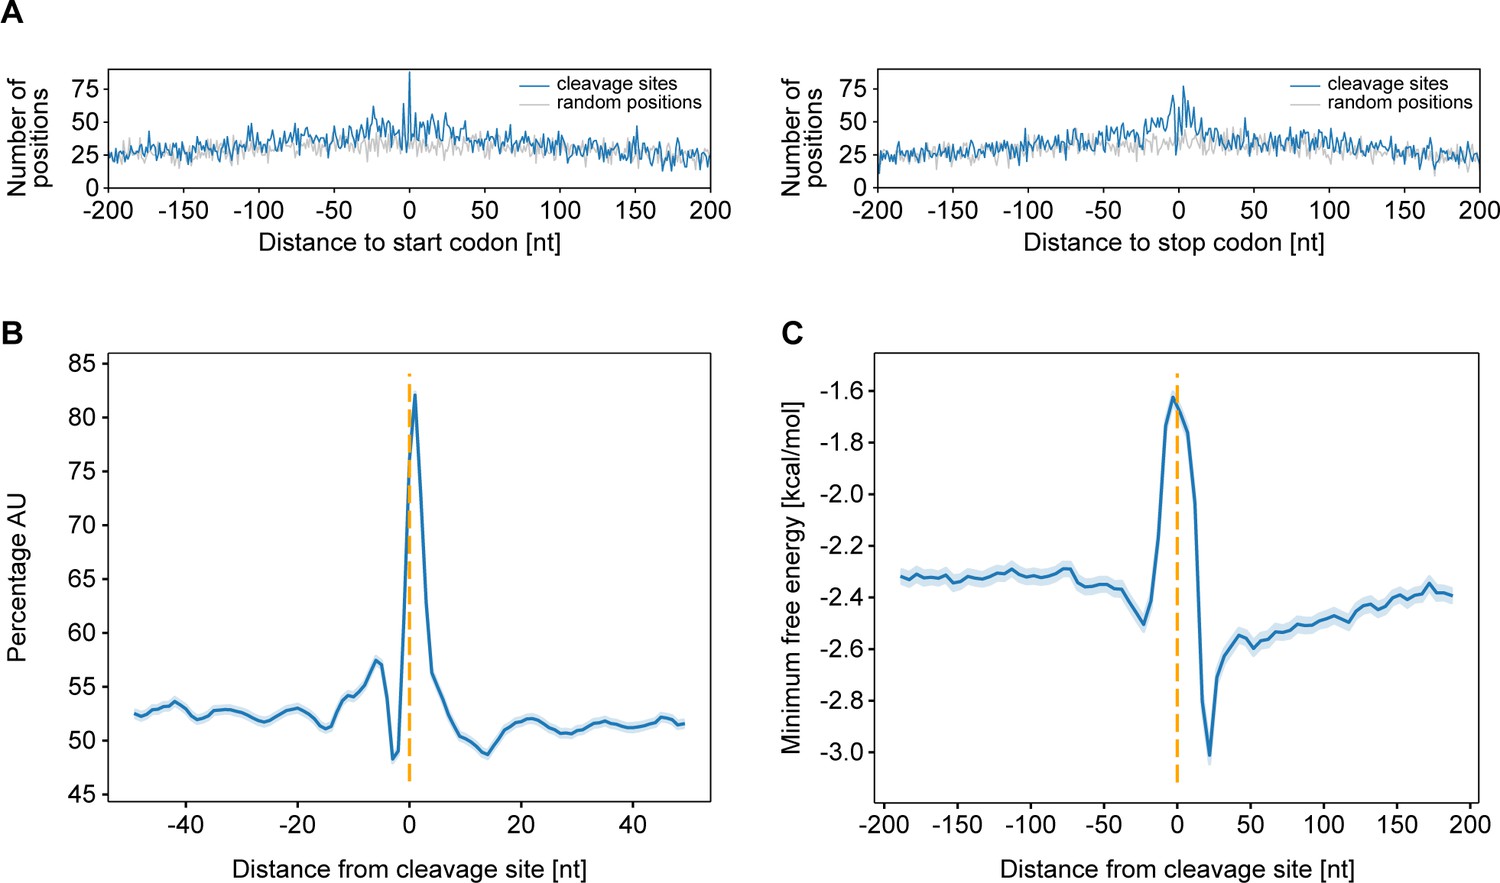
Position and characteristics of RNase E cleavage sites.
TIER-seq was performed as described in Figure 1. (A) Frequency of RNase E sites or the same number of randomly selected genome positions dependent on their relative position to start codons (left) and stop codons (right). (B) AU content around the RNase E cleavage sites. The 95% confidence interval is indicated in light blue. (C) Degree of RNA structure around RNase E cleavage sites. Minimal folding energy (MFE) was calculated in five nt steps for each 25 nt window. The 95% confidence interval is indicated in light blue.
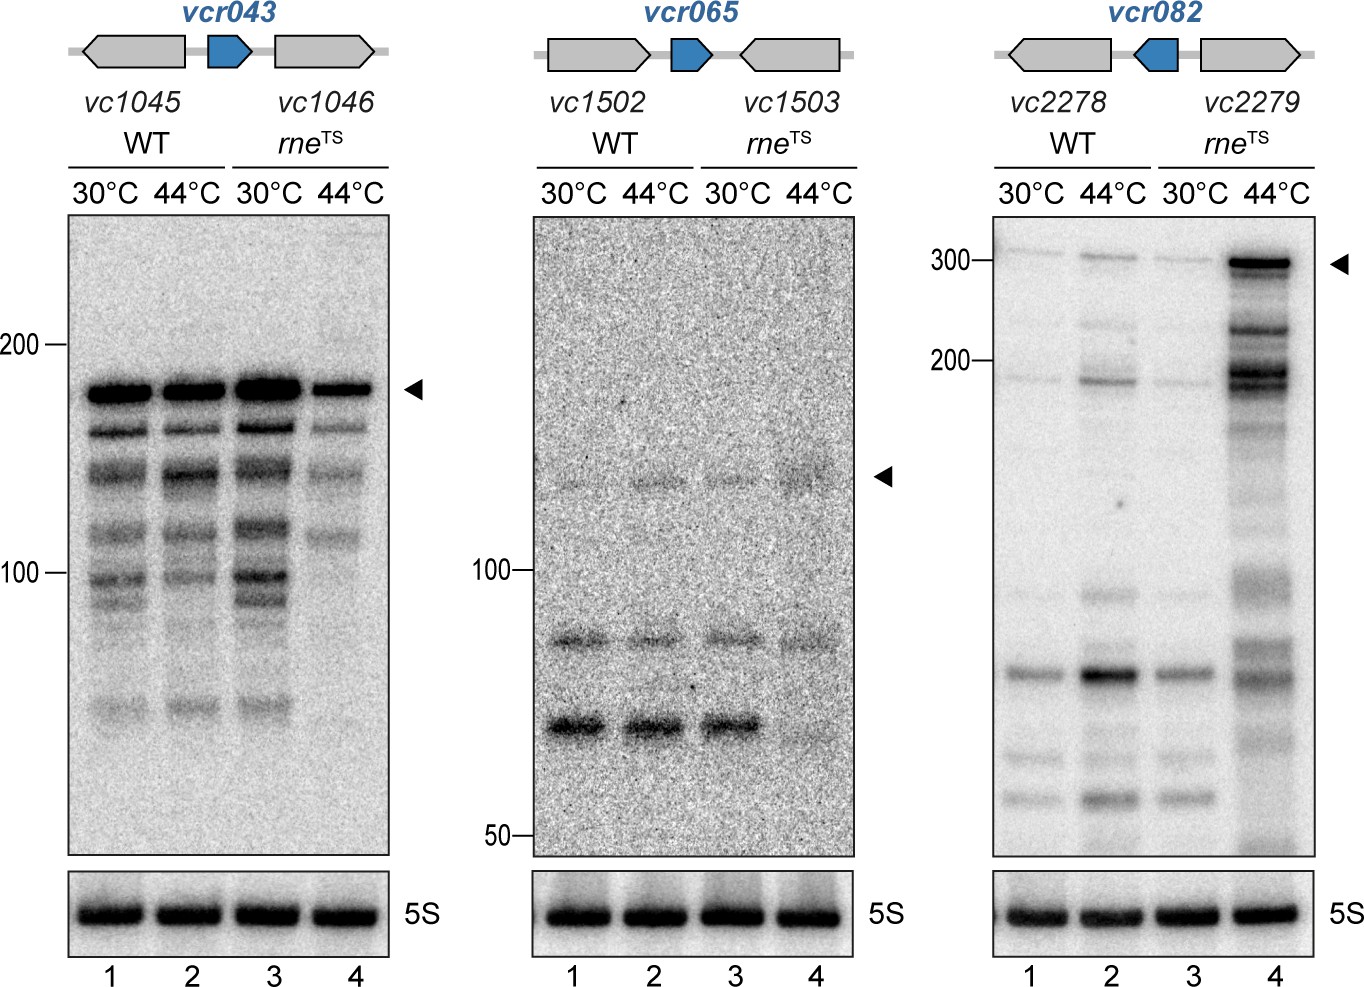
Figure 1—figure supplement 4
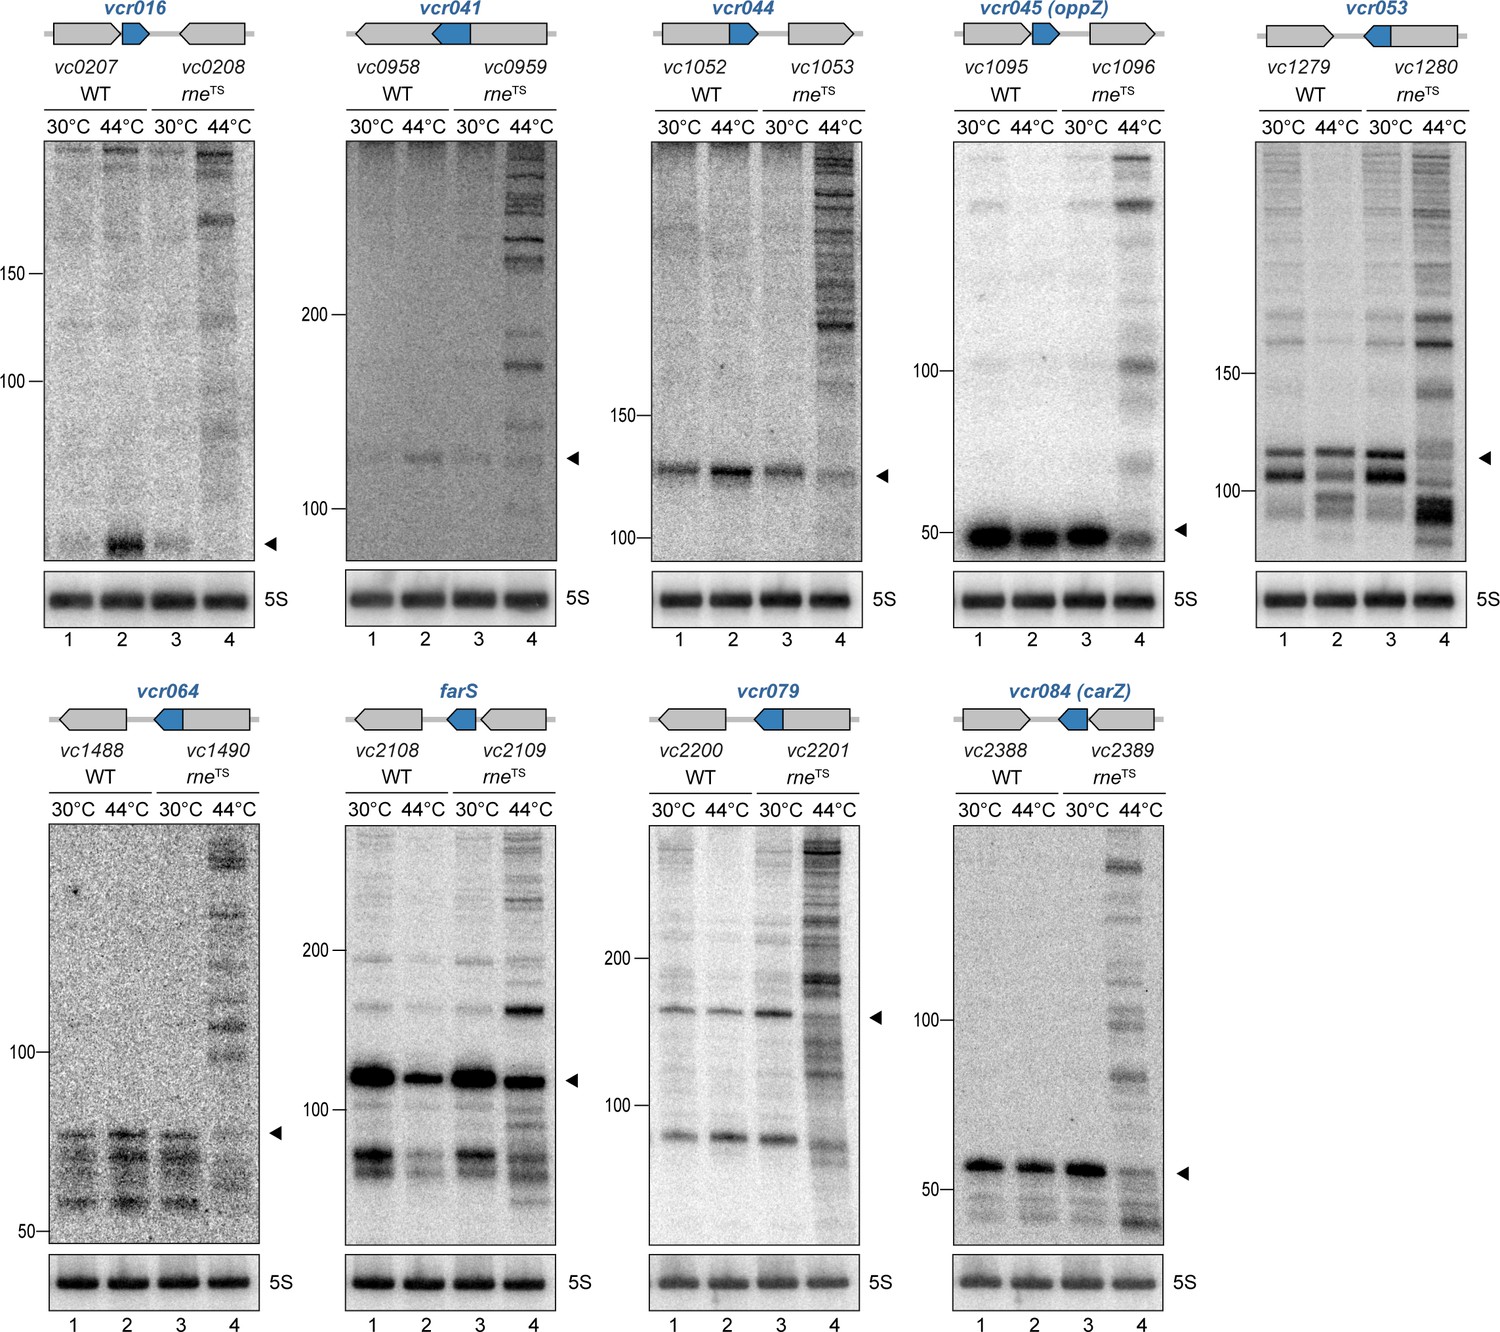
RNase E-mediated maturation of sRNAs from 3’ UTRs.
V. cholerae wild-type and rneTS strains were grown at 30°C to stationary phase (OD600 of 2.0). Cultures were divided in half and continuously grown at either 30°C or 44°C for 30 min. Cleavage patterns of 3’ UTR-derived sRNAs were monitored on Northern blots. The genomic locations and relative orientations are shown above the gels. Genes are shown in gray; sRNAs are shown in blue. Filled triangles indicate the size of mature sRNAs. 5S rRNA served as loading control.
-
Figure 1—figure supplement 4—source data 1
Full Northern blot images for the corresponding detail sections shown in Figure 1—figure supplement 4.
- https://cdn.elifesciences.org/articles/58836/elife-58836-fig1-figsupp4-data1-v1.docx
Figure 1—figure supplement 5
RNase E-mediated maturation of sRNAs from IGRs.
V. cholerae wild-type and rneTS strains were grown at 30°C to stationary phase (OD600 of 2.0). Cultures were divided in half and continuously grown at either 30°C or 44°C for 30 min. Cleavage patterns of intergenic sRNAs were monitored on Northern blots. The genomic locations and relative orientations are shown above the gels. Genes are shown in gray; sRNAs are shown in blue. Filled triangles indicate the size of unprocessed sRNAs. 5S rRNA served as loading control.
-
Figure 1—figure supplement 5—source data 1
Full Northern blot images for the corresponding detail sections shown in Figure 1—figure supplement 5.
- https://cdn.elifesciences.org/articles/58836/elife-58836-fig1-figsupp5-data1-v1.docx
Figure 1—figure supplement 6
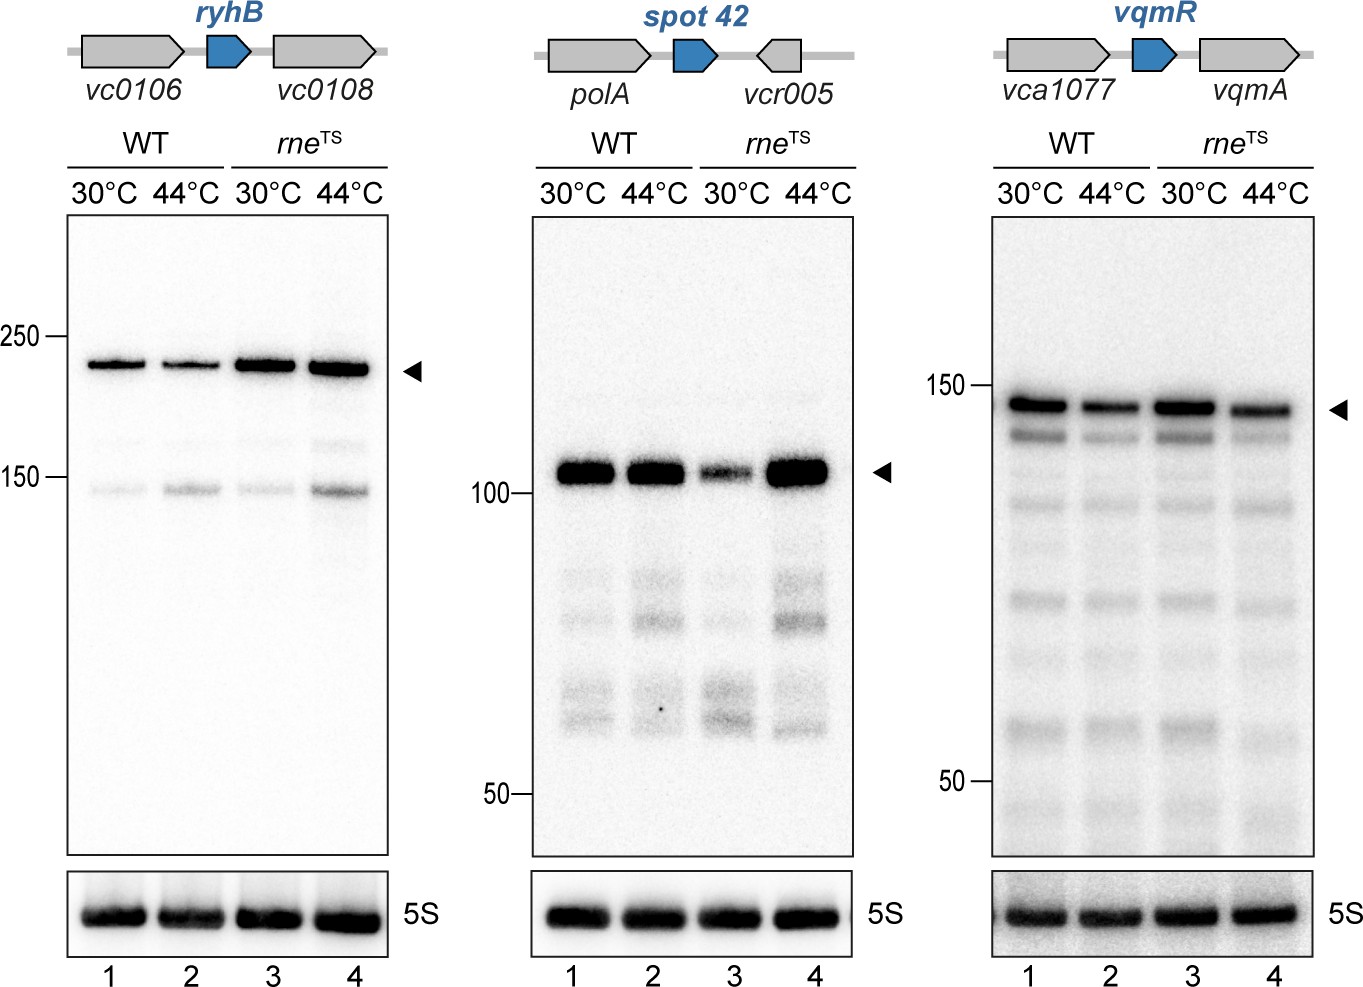
Expression of RNase E-independent sRNAs.
V. cholerae wild-type and rneTS strains were grown at 30°C to early exponential phase (OD600 of 0.2; RyhB and Spot 42) or to stationary phase (OD600 of 2.0; VqmR). Cultures were divided in half and continuously grown at either 30°C or 44°C for 30 min. Cleavage patterns of sRNAs without detectable RNase E cleavage sites were monitored on Northern blots. The genomic locations and relative orientations are shown above the gels. Genes are shown in gray; sRNAs are shown in blue. Filled triangles indicate the size of full-length sRNAs. 5S rRNA served as loading control.
-
Figure 1—figure supplement 6—source data 1
Full Northern blot images for the corresponding detail sections shown in Figure 1—figure supplement 6.
- https://cdn.elifesciences.org/articles/58836/elife-58836-fig1-figsupp6-data1-v1.docx
Figure 2 with 2 supplements
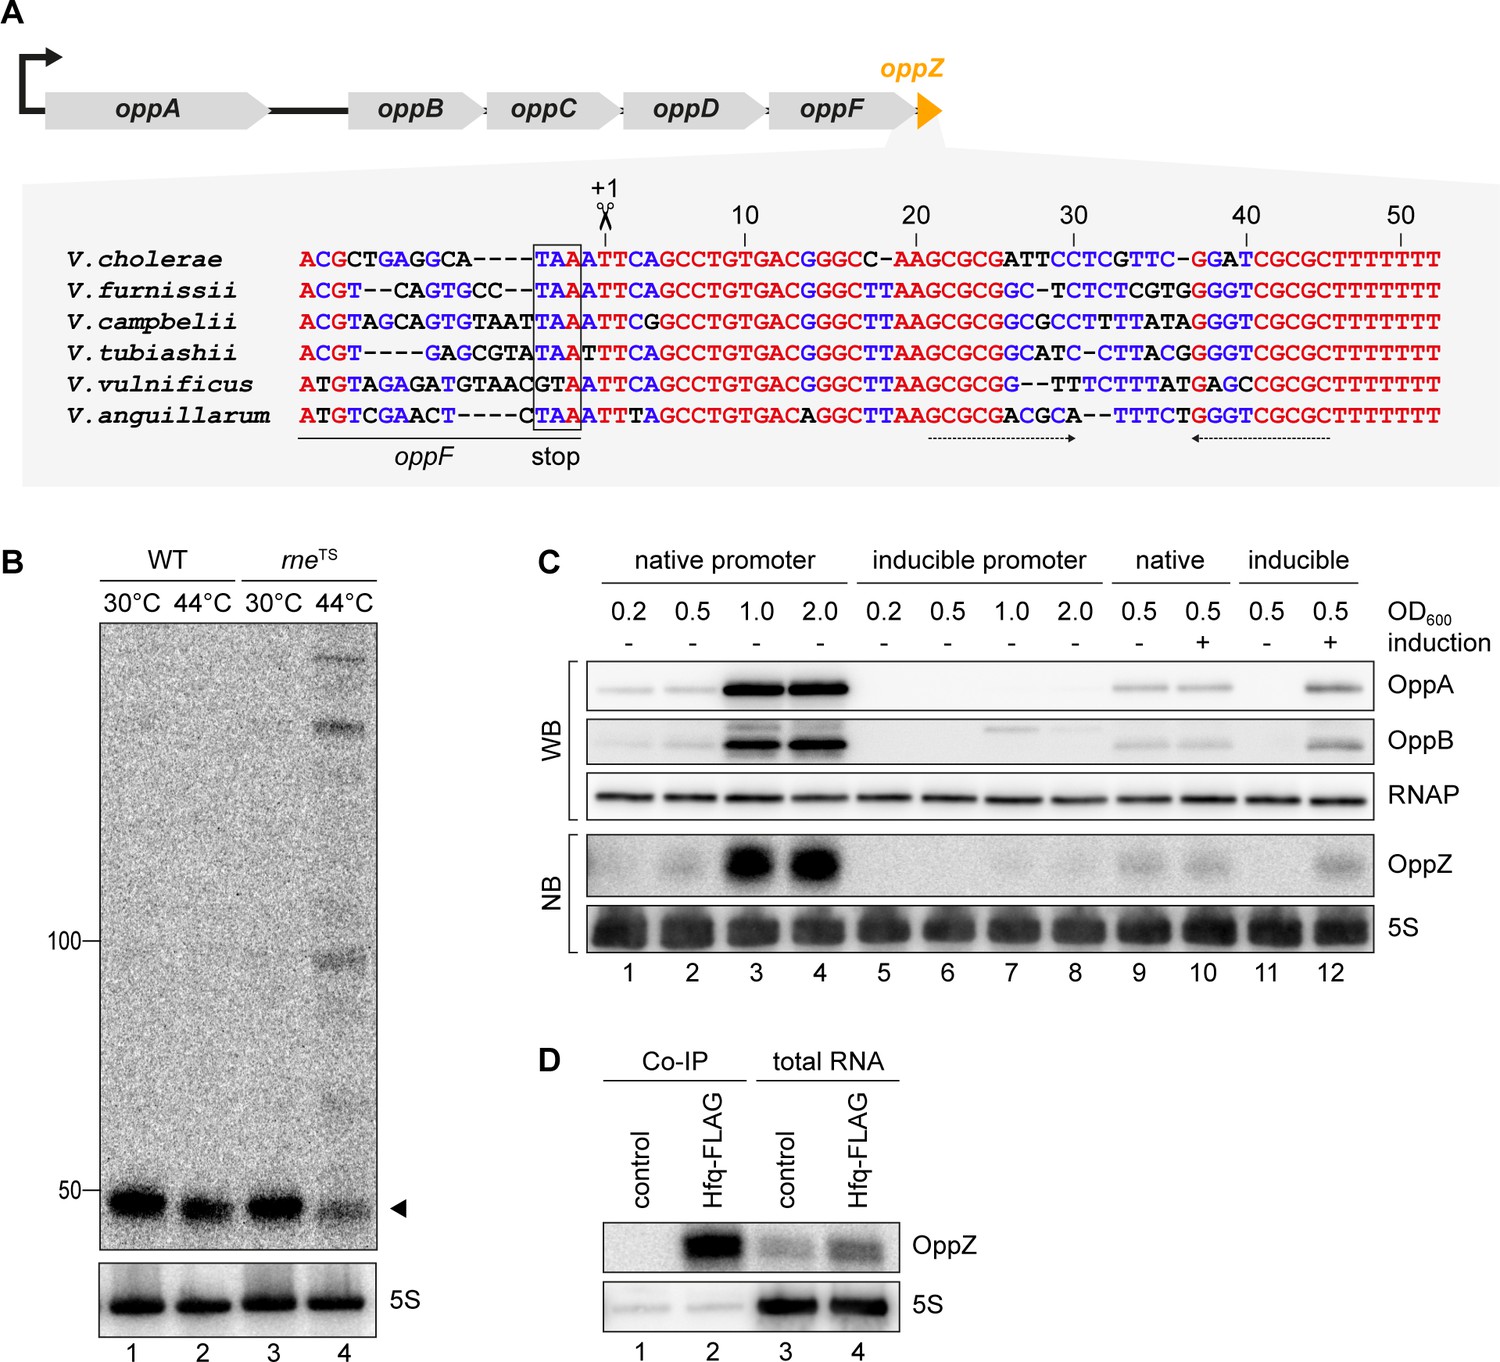
OppZ is produced from the oppABCDF 3’ end.
(A) Top: Genomic organization of oppABCDF and oppZ. Bottom: Alignment of oppZ sequences, including the last codons of oppF, from various Vibrio species. The oppF stop codon, the RNase E cleavage site and the Rho-independent terminator are indicated. (B) V. cholerae wild-type and rneTS strains were grown at 30°C to stationary phase (OD600 of 2.0). Cultures were divided in half and continuously grown at either 30°C or 44°C for 30 min. OppZ synthesis was analyzed by Northern blot with 5S rRNA as loading control. The triangle indicates the size of mature OppZ. (C) Protein and RNA samples were obtained from V. cholerae oppA::3XFLAG oppB::3XFLAG strains carrying either the native oppA promoter or the inducible pBAD promoter upstream of oppA. Samples were collected at the indicated OD600 and tested for OppA and OppB production by Western blot and for OppZ expression by Northern blot. RNAP and 5S rRNA served as loading controls for Western and Northern blots, respectively. Lanes 1–8: Growth without L-arabinose. Lanes 9–12: Growth with either H2O (-) or L-arabinose (+) (0.2% final conc.). (D) V. cholerae wild-type (control) and hfq::3XFLAG (Hfq-FLAG) strains were grown to stationary phase (OD600 of 2.0), lysed, and subjected to immunoprecipitation using the anti-FLAG antibody. RNA samples of lysate (total RNA) and co-immunoprecipitated fractions were analyzed on Northern blots. 5S rRNA served as loading control.
-
Figure 2—source data 1
Full Northern and Western blot images for the corresponding detail sections shown in Figure 2.
- https://cdn.elifesciences.org/articles/58836/elife-58836-fig2-data1-v1.docx
Figure 2—figure supplement 1
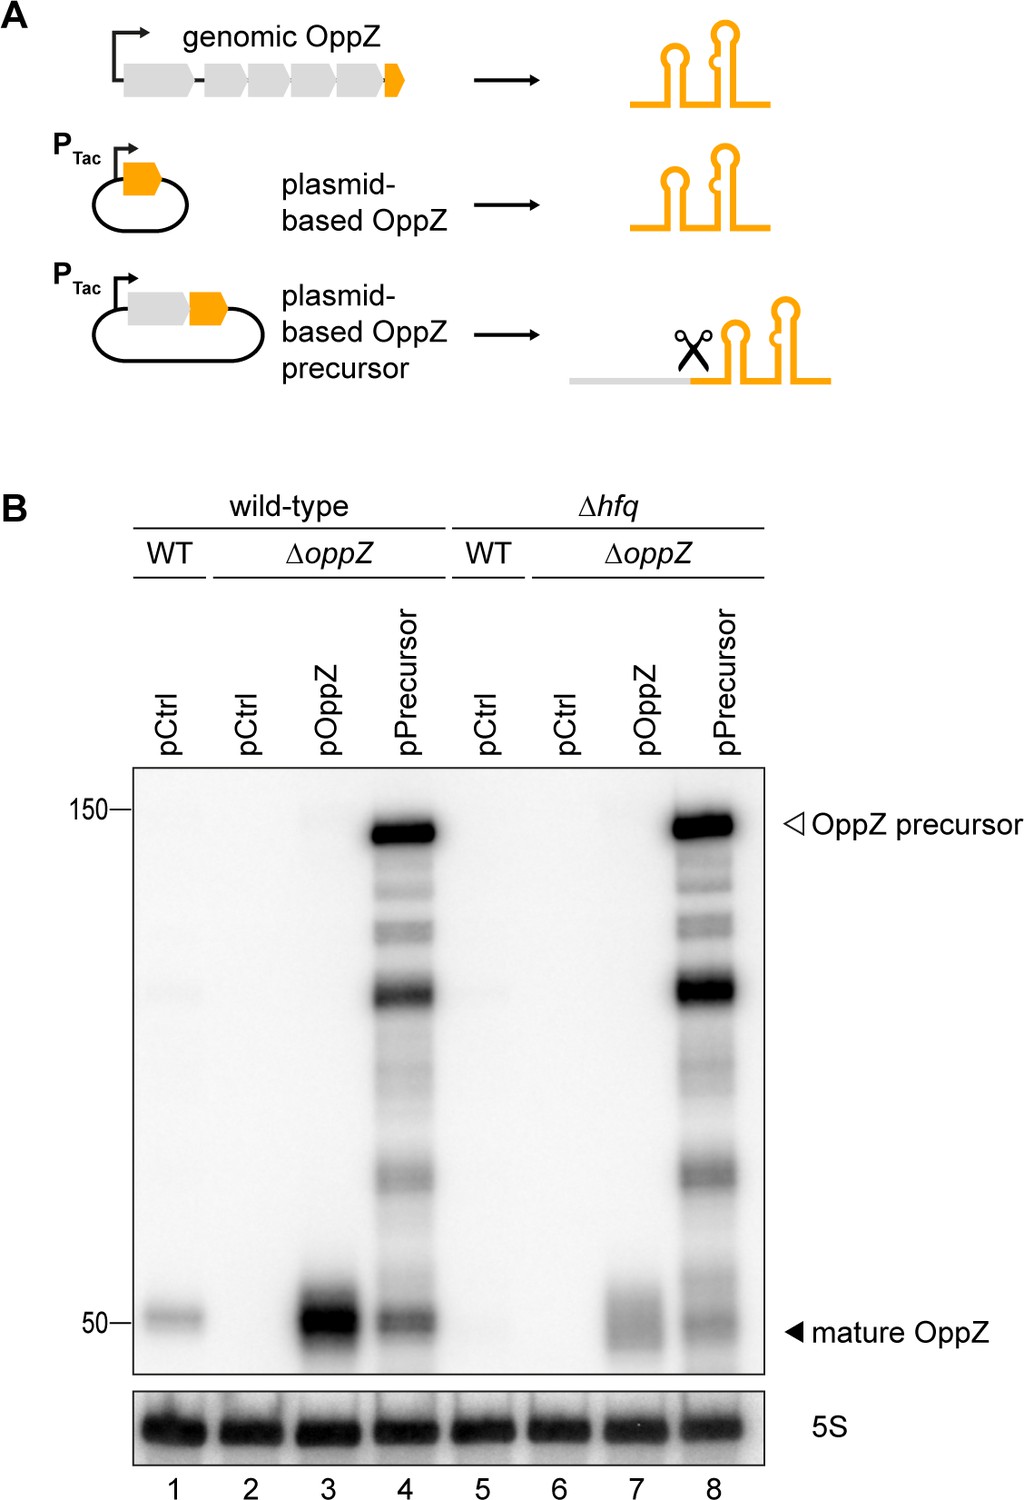
Hfq dependence of OppZ processing.
(A) Schematic description of the analyzed OppZ variants. OppZ was produced natively from the genomic opp locus, expressed as mature sRNA from a plasmid (pOppZ) or cleaved from a plasmid-encoded precursor transcript including the 3’ end of oppF (pPrecursor). Expression of both plasmid-based oppZ variants was driven by a constitutive promoter. (B) V. cholerae wild-type, ΔoppZ, Δhfq or Δhfq ΔoppZ strains carrying oppA::3XFLAG oppB::3XFLAG genes and a control plasmid or the indicated OppZ expression plasmid were grown to stationary phase (OD600 of 2.0). RNA samples were collected and OppZ processing was analyzed by Northern blot. 5S rRNA served as loading control.
-
Figure 2—figure supplement 1—source data 1
Full Northern blot images for the corresponding detail sections shown in Figure 2—figure supplement 1.
- https://cdn.elifesciences.org/articles/58836/elife-58836-fig2-figsupp1-data1-v1.docx
Figure 2—figure supplement 2
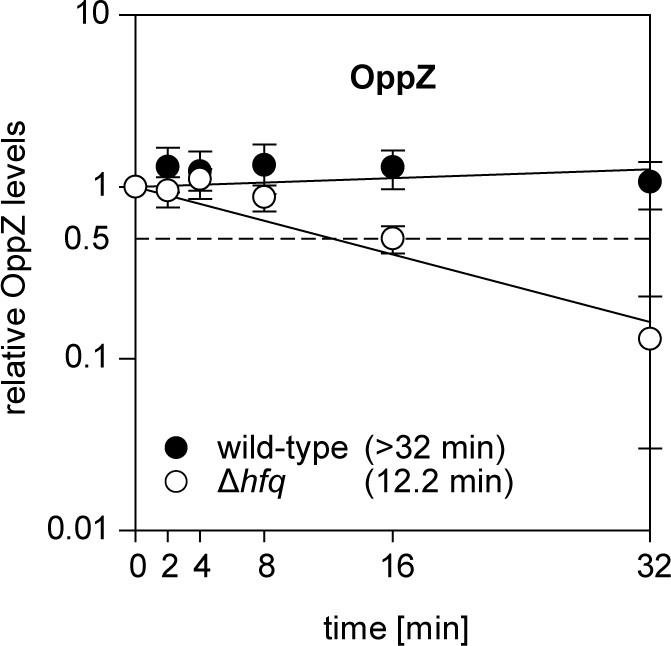
Hfq dependence of OppZ stability.
V. cholerae wild-type and Δhfq strains were grown to early stationary phase (OD600 of 1.5) and treated with rifampicin to terminate transcription. RNA samples were obtained at the indicated time points and OppZ transcript levels were monitored by Northern blot and normalized to 5S rRNA levels as loading control. Error bars represent the SD of three biological replicates.
-
Figure 2—figure supplement 2—source data 1
Quantification of OppZ levels in wild-type and Δhfq cells from Northern blots.
- https://cdn.elifesciences.org/articles/58836/elife-58836-fig2-figsupp2-data1-v1.docx
Figure 3 with 3 supplements
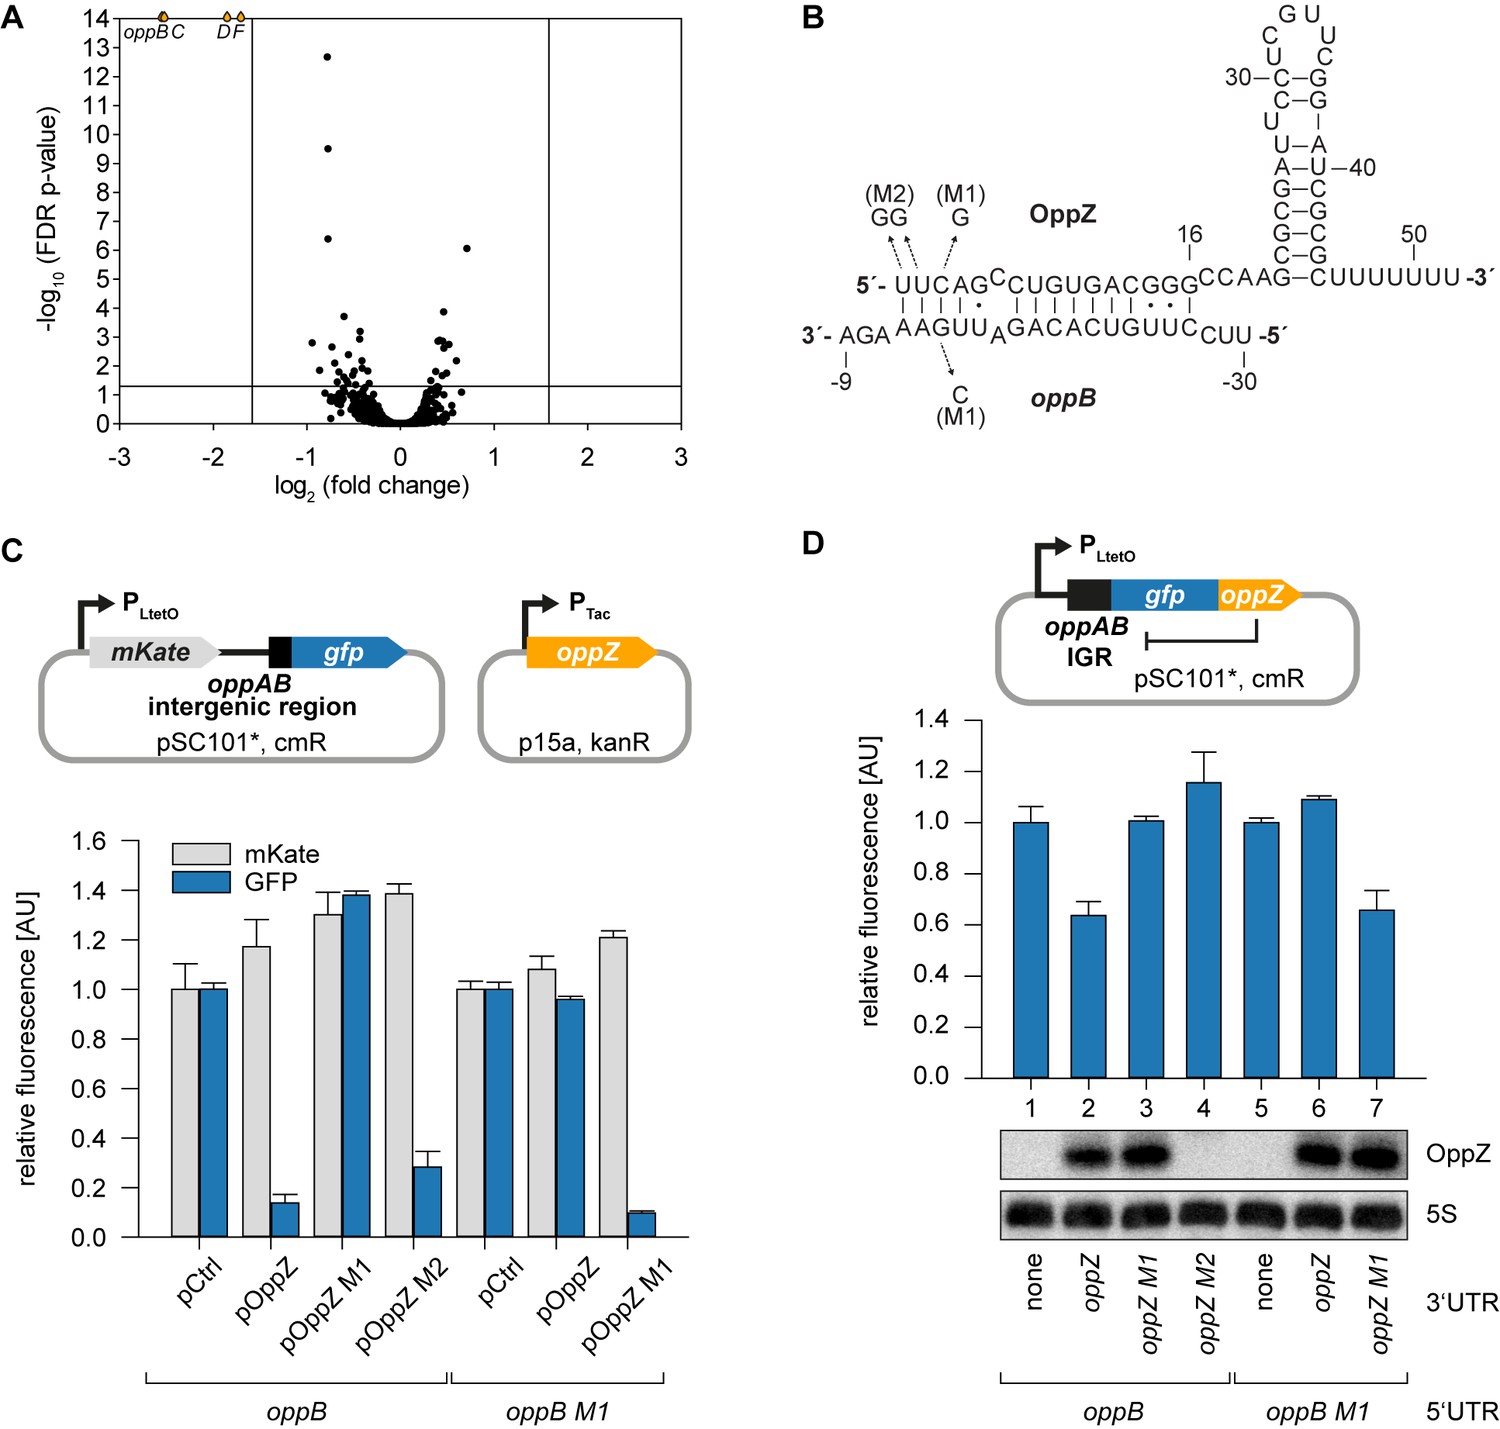
Feedback autoregulation at the suboperonic level.
(A) Volcano plot of genome-wide transcript changes in response to inducible OppZ over-expression. Lines indicate cut-offs for differentially regulated genes at 3-fold regulation and FDR-adjusted p-value≤0.05. Genes with an FDR-adjusted p-value<10−14 are indicated as droplets at the top border of the graph. (B) Predicted OppZ secondary structure and base-pairing to oppB. Arrows indicate the mutations tested in (C) and (D). (C) E. coli strains carrying a translational reporter plasmid with the oppAB intergenic region placed between mKate2 and gfp were co-transformed with a control plasmid or the indicated OppZ expression plasmids. Transcription of the reporter and oppZ were driven by constitutive promoters. Cells were grown to OD600 = 1.0 and fluorophore production was measured. mKate and GFP levels of strains carrying the control plasmid were set to 1. Error bars represent the SD of three biological replicates. (D) Single-plasmid regulation was measured by inserting the indicated oppZ variant into the 3’ UTR of a translational oppB::gfp fusion. Expression was driven from a constitutive promoter. E. coli strains carrying the respective plasmids were grown to OD600 = 1.0 and GFP production was measured. Fluorophore levels from control fusions without an sRNA gene were set to one and error bars represent the SD of three biological replicates. OppZ expression was tested by Northern blot; 5S rRNA served as loading control.
-
Figure 3—source data 1
Full Northern blot images for the corresponding detail sections shown in Figure 3 and raw data for fluorescence measurements.
- https://cdn.elifesciences.org/articles/58836/elife-58836-fig3-data1-v1.docx
Figure 3—figure supplement 1
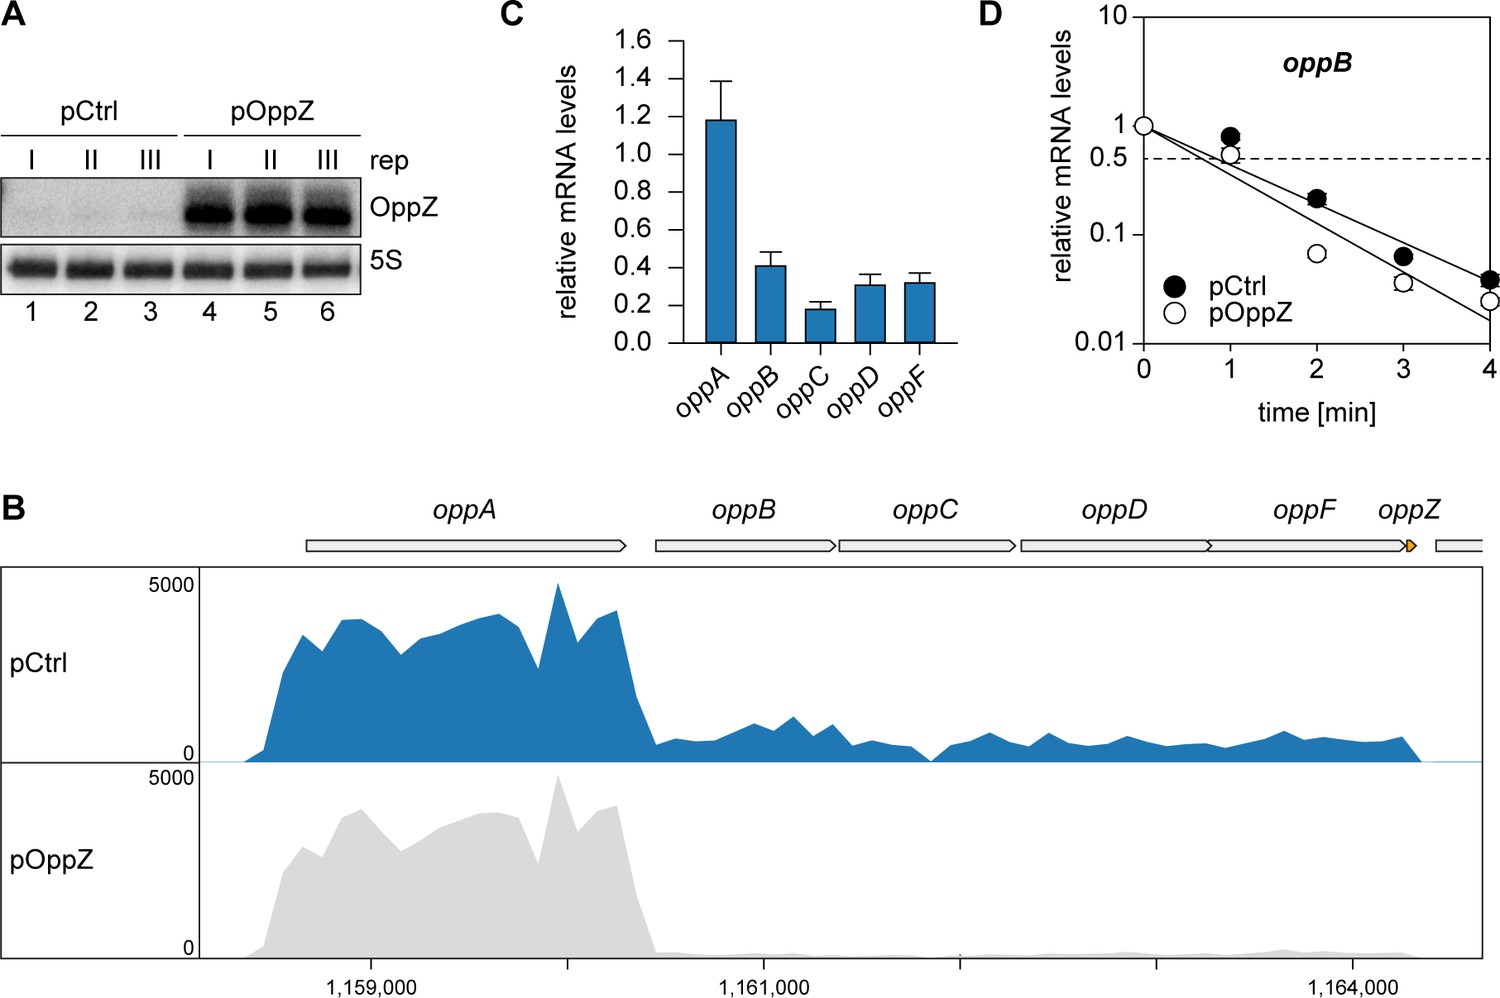
Pulse expression of OppZ reduces oppBCDF transcript levels.
(A) V. cholerae carrying pBAD1K-oppZ (pOppZ) or a control plasmid (pCtrl) were grown in biological triplicates to exponential phase (OD600 of 0.5) and oppZ expression was induced by L-arabinose (0.2% final conc.). RNA samples were collected after 15 min and analyzed for OppZ levels by Northern blot; 5S rRNA served as loading control. (B) Samples from (A) were subjected to RNA-seq and average coverage of the opp operon is shown for one representative replicate. (C) V. cholerae ΔoppZ carrying pBAD1K-oppZ or a control plasmid were grown to late exponential phase (OD600 of 1.0) and oppZ expression was induced by L-arabinose (0.2% final conc.) for 15 min. mRNA levels of oppABCDF were analyzed by qRT-PCR. Bars show mRNA levels upon OppZ induction compared to the control; error bars represent the SD of three biological replicates. (D) V. cholerae ΔoppZ strains carrying either pBAD1K-ctrl (pCtrl) or pBAD1K-oppZ (pOppZ) were grown to late exponential phase (OD600 of 1.0) and treated with L-arabinose (0.2% final conc.) to induce sRNA expression. After 15 min of induction, rifampicin was added to terminate transcription. RNA samples were obtained at the indicated time points and oppB transcript levels were monitored by qRT-PCR. Error bars represent the SD of three biological replicates.
-
Figure 3—figure supplement 1—source data 1
Full Northern blot images for the corresponding detail sections shown in Figure 3—figure supplement 1 and raw data for transcript changes as determined by qRT-PCR.
- https://cdn.elifesciences.org/articles/58836/elife-58836-fig3-figsupp1-data1-v1.docx
Figure 3—figure supplement 2
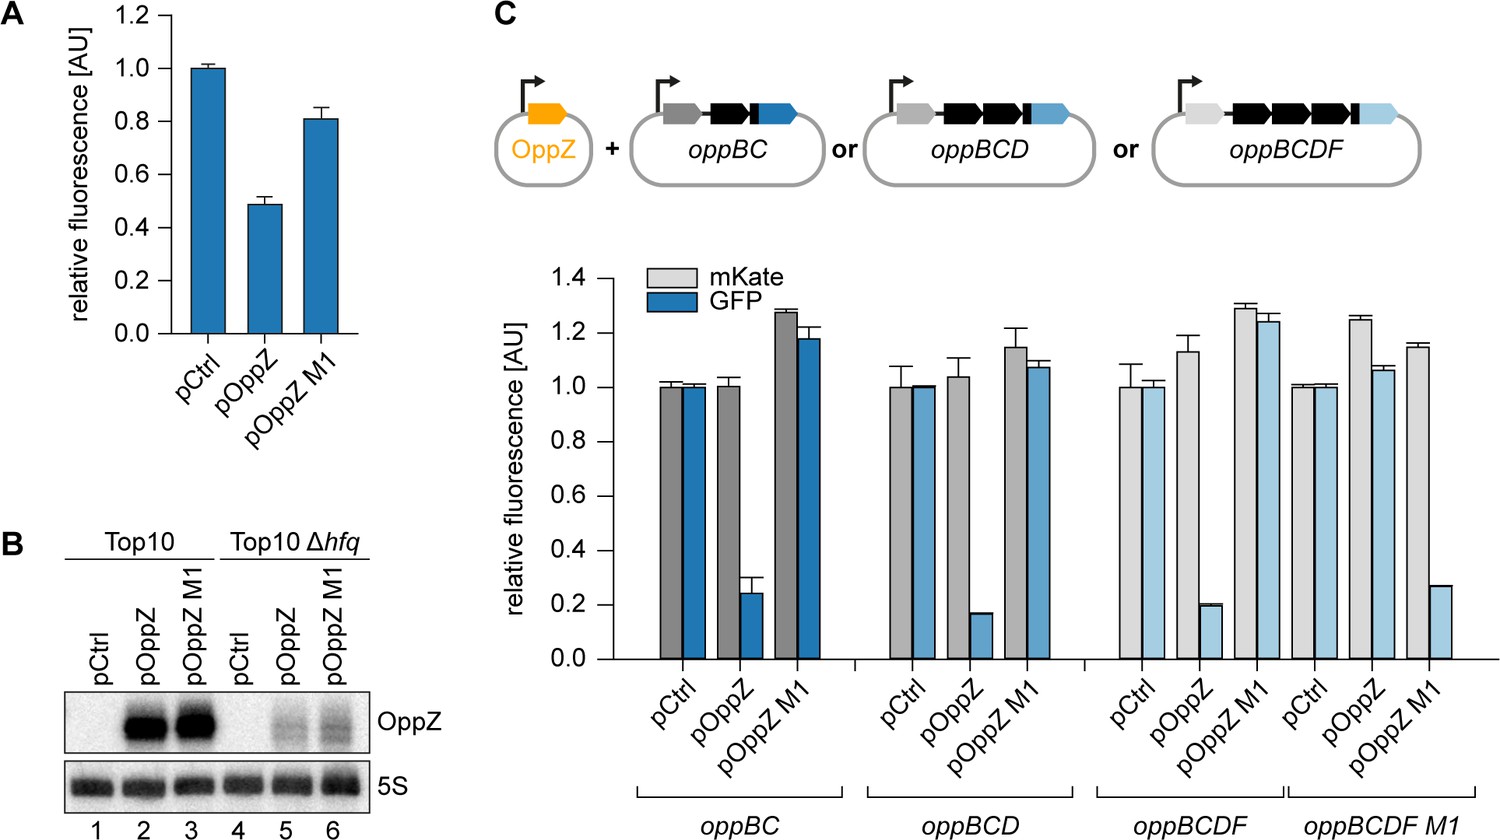
Hfq-dependent, post-transcriptional repression of OppBCDF by OppZ.
(A) E. coli Δhfq strains carrying the translational oppB-gfp reporter plasmid and either a control plasmid or the indicated OppZ expression plasmids were grown to OD600 = 1.0 and fluorophore production was measured. GFP levels of the control strain were set to 1. Error bars represent the SD of three biological replicates. (B) E. coli wild-type or Δhfq strains carrying the translational oppB-gfp reporter plasmid and either a control plasmid or the indicated OppZ expression plasmids were grown to OD600 = 1.0. RNA samples were analyzed for OppZ levels by Northern blot; 5S rRNA served as loading control. (C) E. coli strains carrying translational reporter plasmids with the indicated parts of the opp operon placed between mKate2 and gfp were co-transformed with a control plasmid or the respective OppZ expression plasmids. Transcription of the reporter and oppZ were driven by constitutive promoters. Cells were grown to OD600 = 1.0 and fluorophore production was measured. mKate and GFP levels of strains carrying the control plasmid were set to 1. Error bars represent the SD of three biological replicates.
-
Figure 3—figure supplement 2—source data 1
Full Northern blot images for the corresponding detail sections shown in Figure 3—figure supplement 2 and raw data for fluorescence measurements.
- https://cdn.elifesciences.org/articles/58836/elife-58836-fig3-figsupp2-data1-v1.docx
Figure 3—figure supplement 3
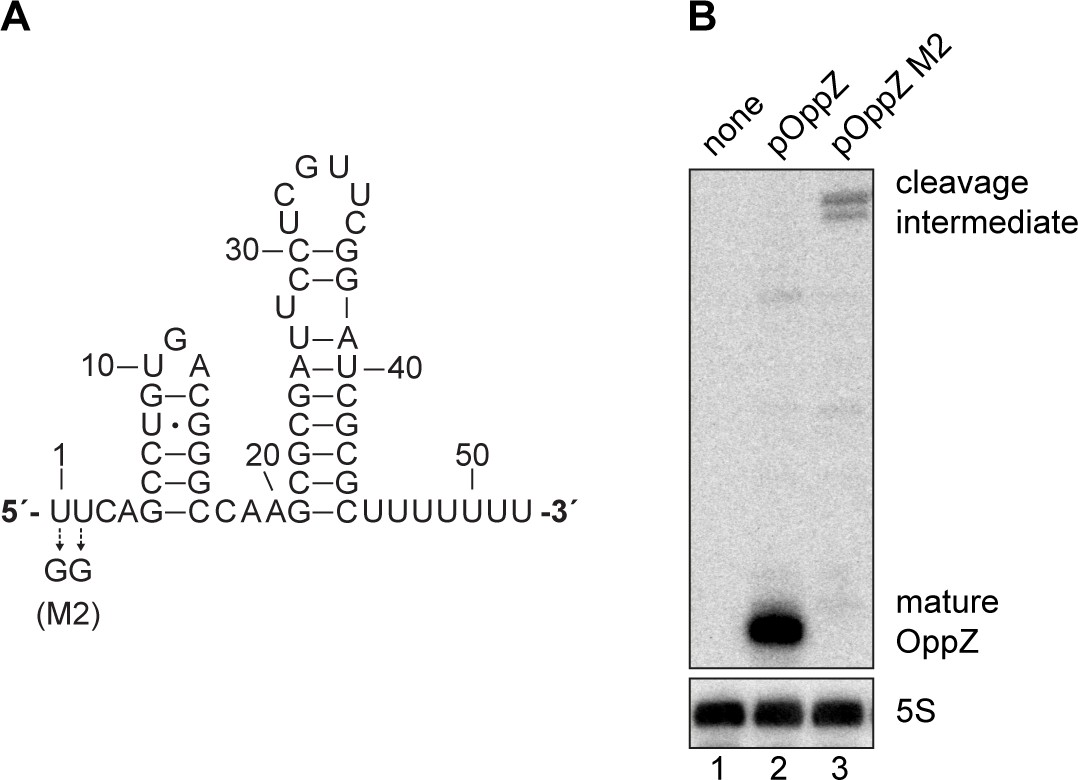
Mutational analysis of the RNase E site in oppZ.
(A) Predicted structure of the OppZ sRNA. The M2 mutation blocking cleavage by RNase E is indicated. (B) E. coli strains carrying the empty pXG10-SF plasmid or derivatives with the indicated oppZ gene in the 3’ UTR of gfp were grown to OD600 = 1.0. RNA samples were analyzed for OppZ processing by Northern blot; 5S rRNA served as loading control.
-
Figure 3—figure supplement 3—source data 1
Full Northern blot images for the corresponding detail sections shown in Figure 3—figure supplement 3.
- https://cdn.elifesciences.org/articles/58836/elife-58836-fig3-figsupp3-data1-v1.docx
Figure 4 with 1 supplement
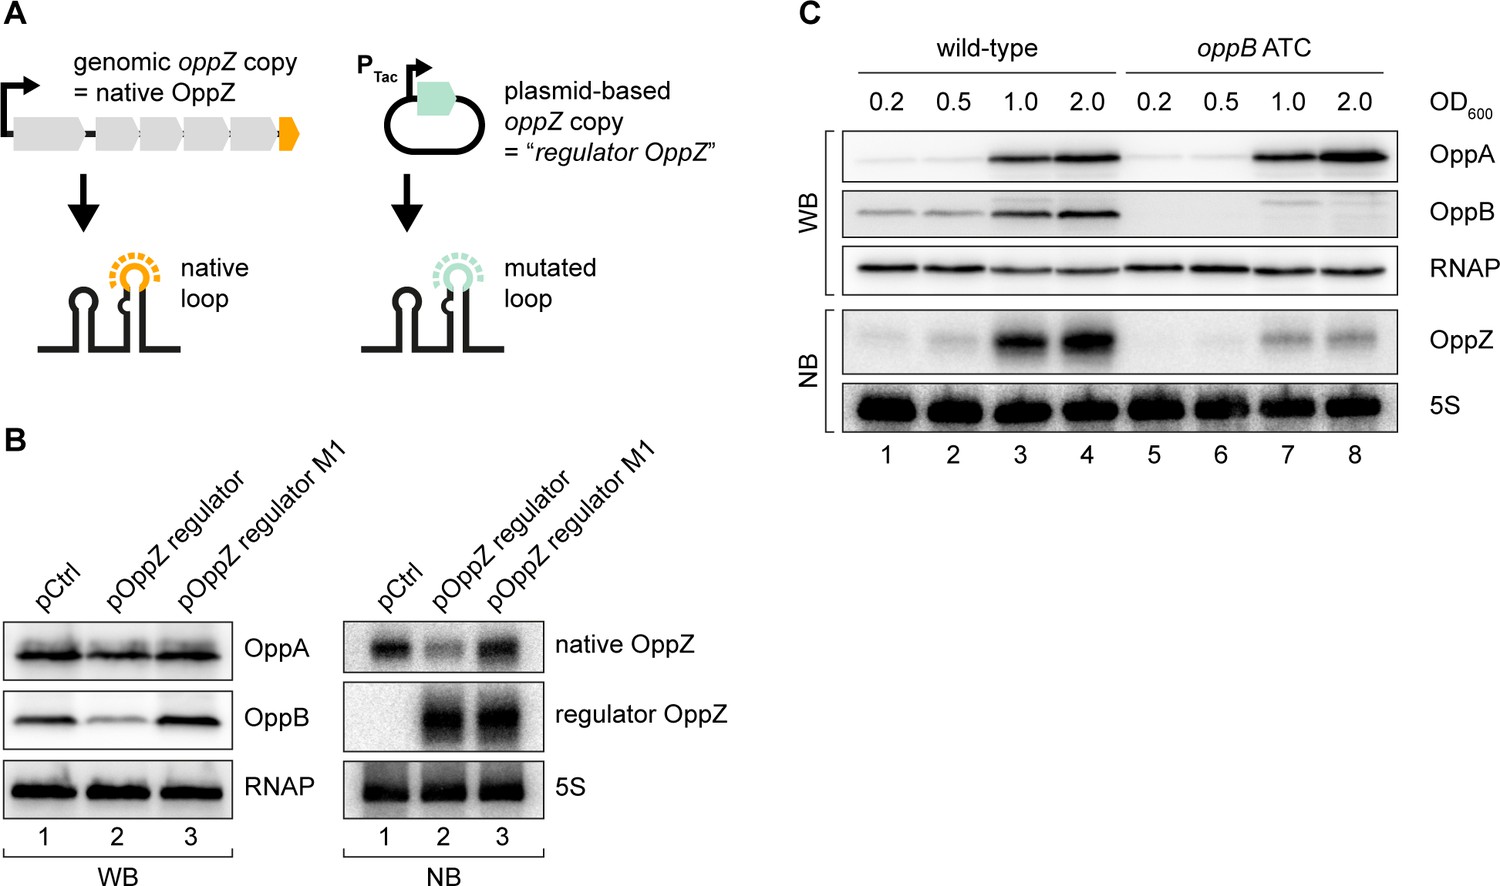
Translational control of OppZ synthesis.
(A) Schematic of the analyzed OppZ variants containing the native stem loop sequence (produced from the genomic oppZ locus) or a mutated stem loop sequence (‘regulator OppZ’ produced from a plasmid-based constitutive promoter). (B) V. cholerae oppA::3XFLAG oppB::3XFLAG carrying a control plasmid (pCMW-1) or a plasmid expressing regulator OppZ (pMD194, pMD195) were grown to stationary phase (OD600 of 2.0). OppA and OppB production were tested by Western blot and expression of native OppZ and regulator OppZ was monitored on Northern blot using oligonucleotides binding to the respective loop sequence variants. RNAP and 5S rRNA served as loading controls for Western blot and Northern blot, respectively. (C) The oppB start codon was mutated to ATC in an oppA::3XFLAG oppB::3XFLAG background. V. cholerae strains with wild-type or mutated oppB start codon were grown in LB medium. Protein and RNA samples were collected at the indicated OD600 and tested for OppA and OppB production by Western blot and for OppZ expression by Northern blot. RNAP and 5S rRNA served as loading controls for Western and Northern blots, respectively.
-
Figure 4—source data 1
Full Northern and Western blot images for the corresponding detail sections shown in Figure 4.
- https://cdn.elifesciences.org/articles/58836/elife-58836-fig4-data1-v1.docx
Figure 4—figure supplement 1
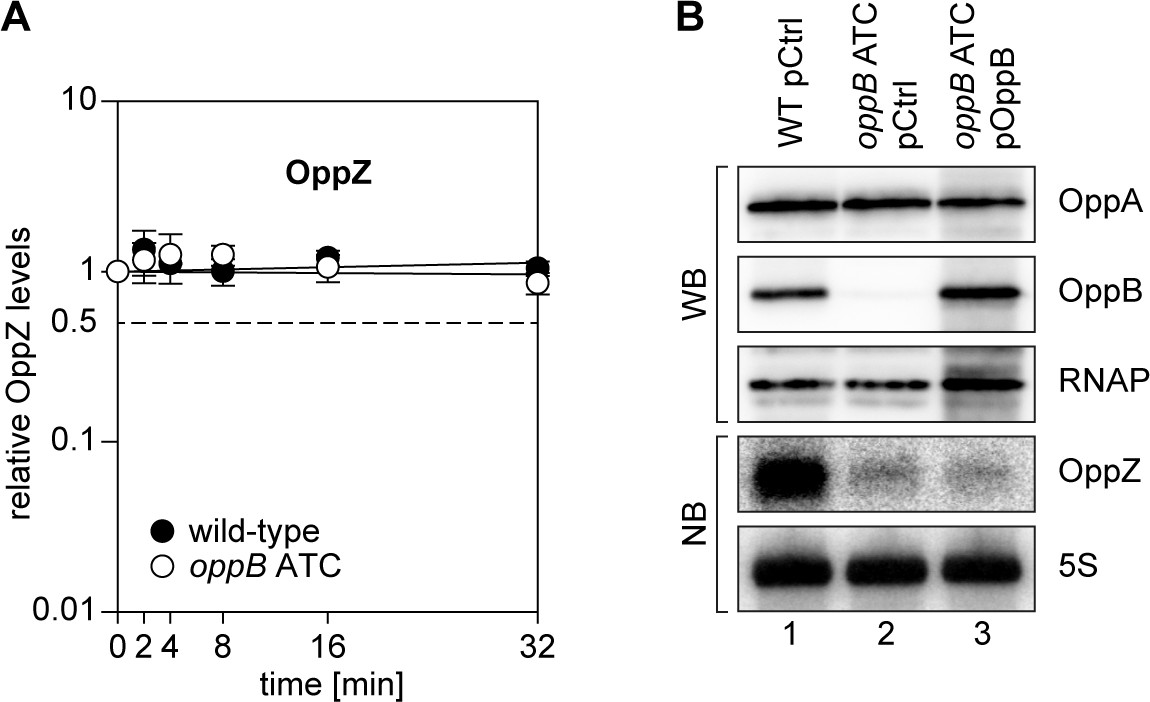
Translational control of OppZ synthesis.
(A) V. cholerae wild-type and oppB ATC strains were grown to stationary phase (OD600 of 2.0) and treated with rifampicin to terminate transcription. RNA samples were obtained at the indicated time points and OppZ transcript levels were monitored by Northern blot and normalized to 5S rRNA levels as loading control. Error bars represent the SD of three biological replicates. (B) V. cholerae wild-type and oppB ATC strains carrying either a control plasmid (pCtrl) or an inducible oppB complementation plasmid (pOppB) were grown to late exponential phase (OD600 of 1.0) and oppB expression was induced by the addition of L-arabinose (0.2% final conc.). Protein and RNA samples were obtained after 60 min and tested for OppA and OppB production by Western blot and for OppZ expression by Northern blot. RNAP and 5S rRNA served as loading controls for Western and Northern blots, respectively.
-
Figure 4—figure supplement 1—source data 1
Quantification of OppZ levels in wild-type and oppB ATC cells from Northern blots and full blot images for the corresponding detail sections shown in Figure 4—figure supplement 1.
- https://cdn.elifesciences.org/articles/58836/elife-58836-fig4-figsupp1-data1-v1.docx
Figure 5
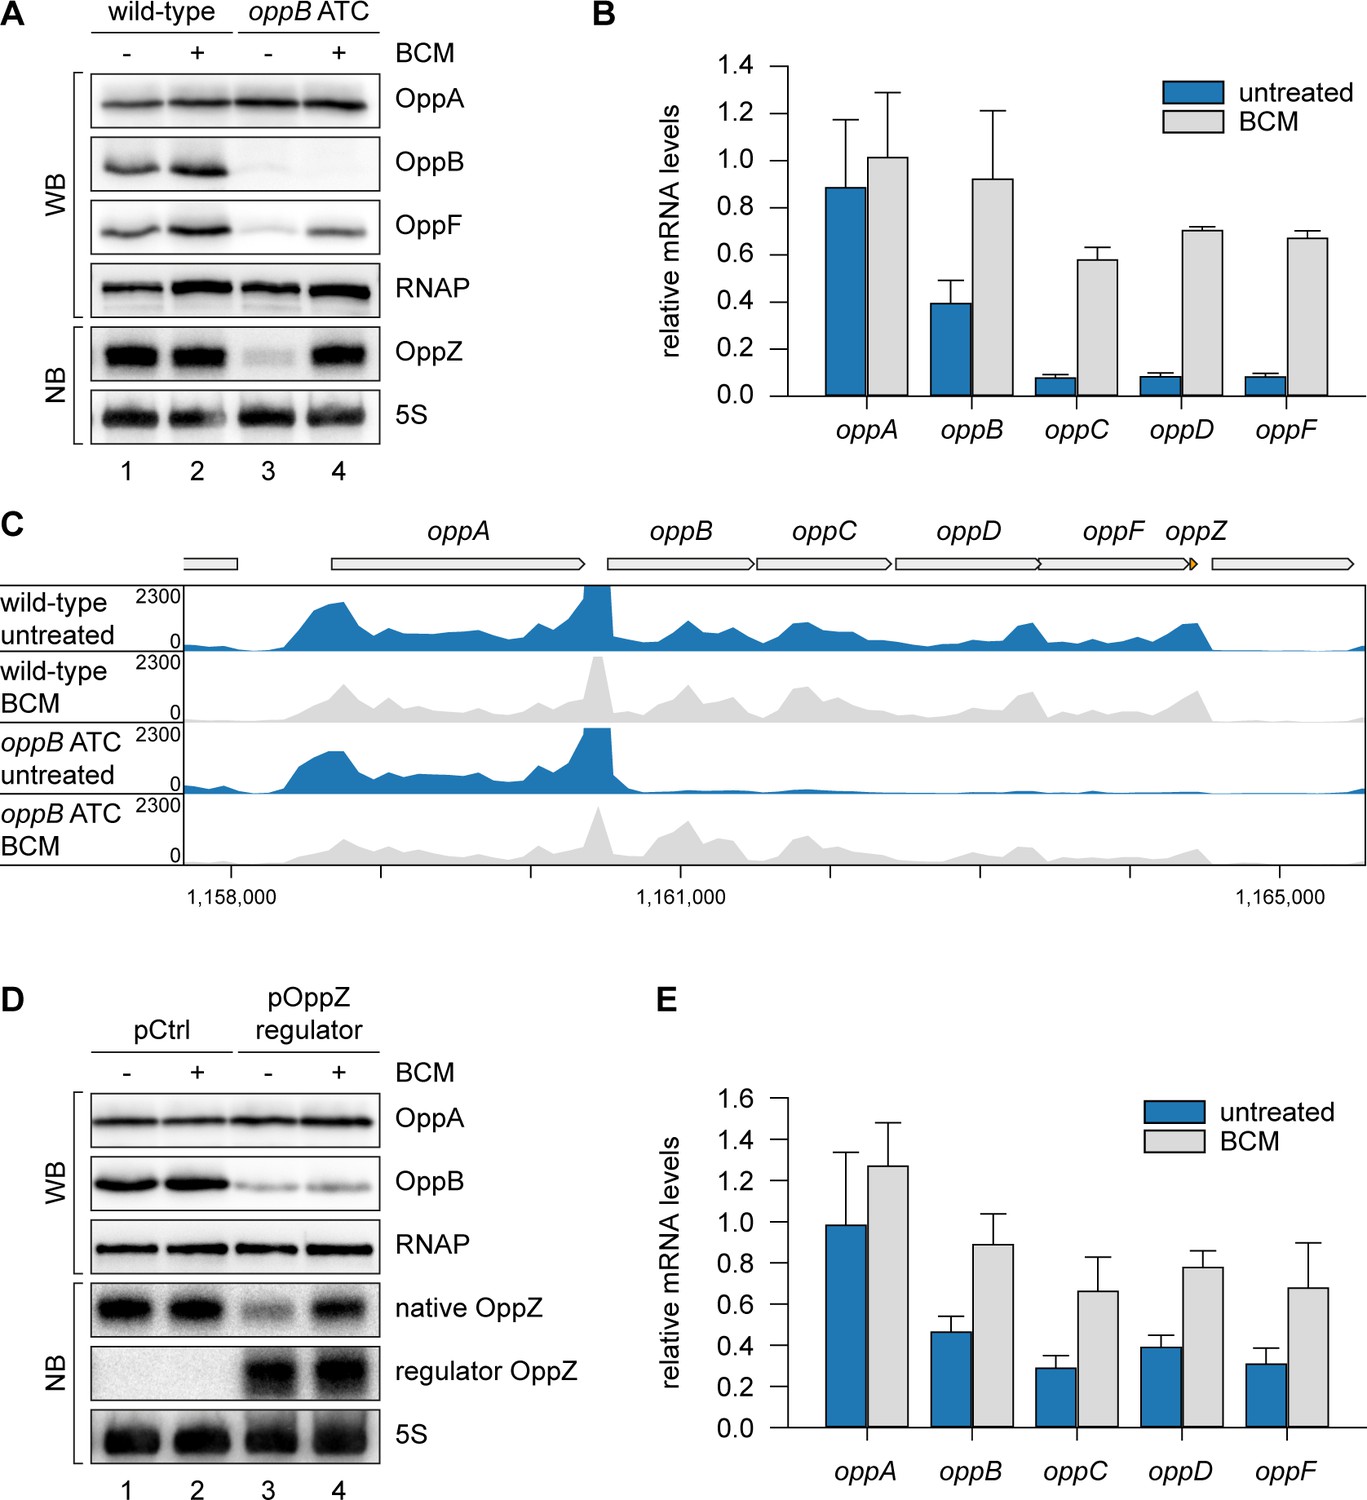
OppZ promotes transcription termination through Rho.
(A) V. cholerae oppA::3XFLAG oppB::3XFLAG oppF::3XFLAG strains with wild-type or mutated oppB start codon were grown to early stationary phase (OD600 of 1.5). Cultures were divided in half and treated with either H2O or BCM (25 µg/ml final conc.) for 2 hr before protein and RNA samples were collected. OppA, OppB and OppF production were tested by Western blot and OppZ expression was monitored by Northern blot. RNAP and 5S rRNA served as loading controls for Western and Northern blots, respectively. (B) Biological triplicates of V. cholerae oppA::3XFLAG oppB::3XFLAG strains with wild-type or mutated oppB start codon were treated with BCM as described in (A). oppABCDF expression in the oppB start codon mutant compared to the wild-type control was analyzed by qRT-PCR. Error bars represent the SD of three biological replicates. (C) Triplicate samples from (B) were subjected to Term-seq and average coverage of the opp operon is shown for one representative replicate. The coverage cut-off was set at the maximum coverage of annotated genes. (D) V. cholerae oppA::3XFLAG oppB::3XFLAG strains carrying a control plasmid (pMD397) or a plasmid expressing regulator OppZ (pMD398) were treated with BCM as described in (A). OppA and OppB production were tested by Western blot and expression of native OppZ and regulator OppZ was monitored on Northern blot using oligonucleotides binding to the respective loop sequence variants. RNAP and 5S rRNA served as loading controls for Western and Northern blots, respectively. (E) Levels of oppABCDF in the experiment described in (D) were analyzed by qRT-PCR. Error bars represent the SD of three biological replicates.
-
Figure 5—source data 1
Full blot images for the corresponding detail sections shown in Figure 5 and raw data for transcript changes as determined by qRT-PCR.
- https://cdn.elifesciences.org/articles/58836/elife-58836-fig5-data1-v1.docx
Figure 6
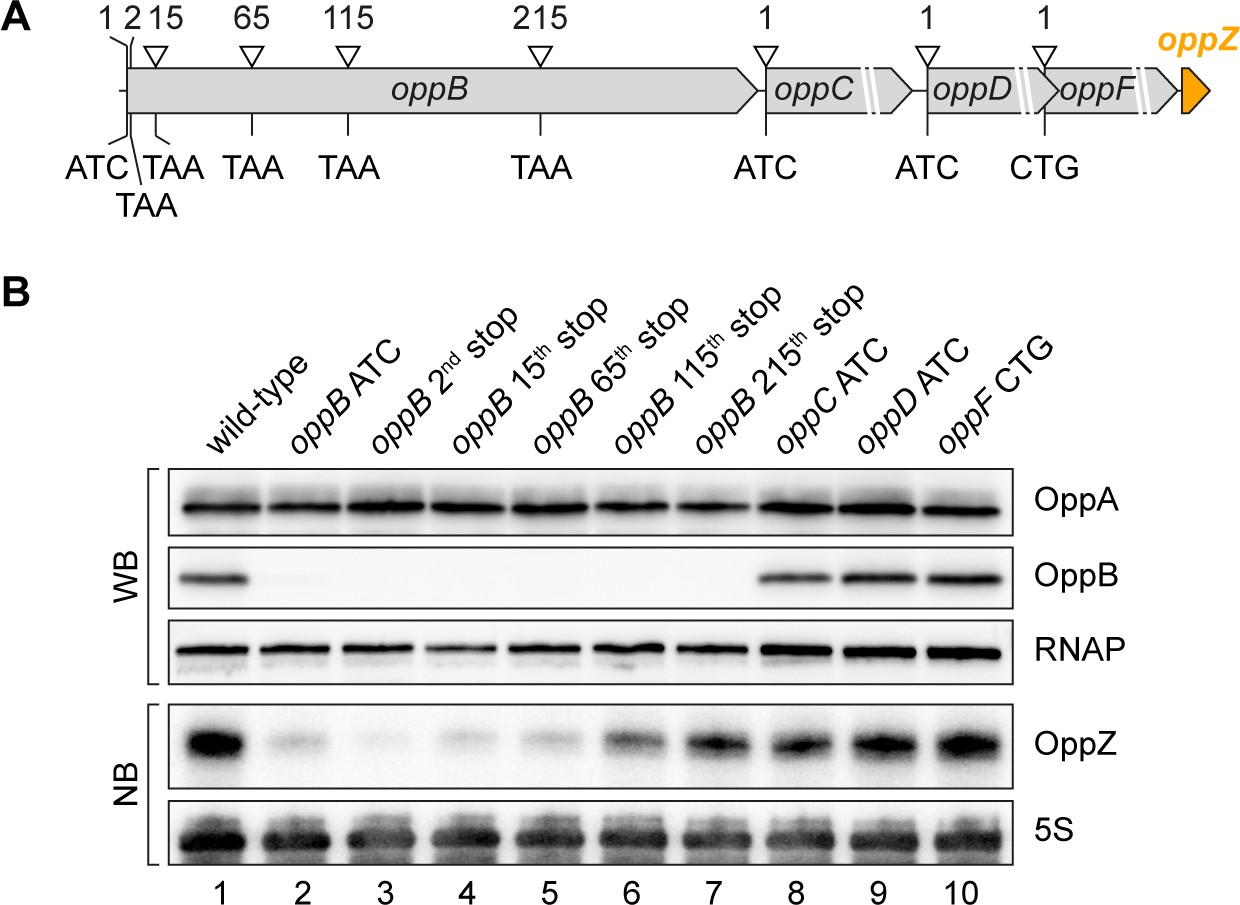
Influence of OppBCDF translation on OppZ expression.
(A) The depicted mutations were individually inserted into the opp locus to inactivate the start codons of oppB, oppC, oppD or oppF or to insert STOP codons at the positions 2, 15, 65, 115 or 215 of oppB. (B) V. cholerae oppA::3XFLAG oppB::3XFLAG strains with the described opp mutations were grown: wild-type (lane 1), the oppB start codon mutated (lane 2), a STOP codon inserted at the 2nd, 15th, 65th, 115th or 215th codon of oppB (lanes 3–7) or mutated start codons of oppC, oppD or oppF (lanes 8–10). At stationary phase (OD600 of 2.0), protein and RNA samples were collected and tested for OppA and OppB production by Western blot and for OppZ expression by Northern blot. RNAP and 5S rRNA served as loading controls for Western and Northern blots, respectively.
-
Figure 6—source data 1
Full Northern and Western blot images for the corresponding detail sections shown in Figure 6.
- https://cdn.elifesciences.org/articles/58836/elife-58836-fig6-data1-v1.docx
Figure 7 with 2 supplements
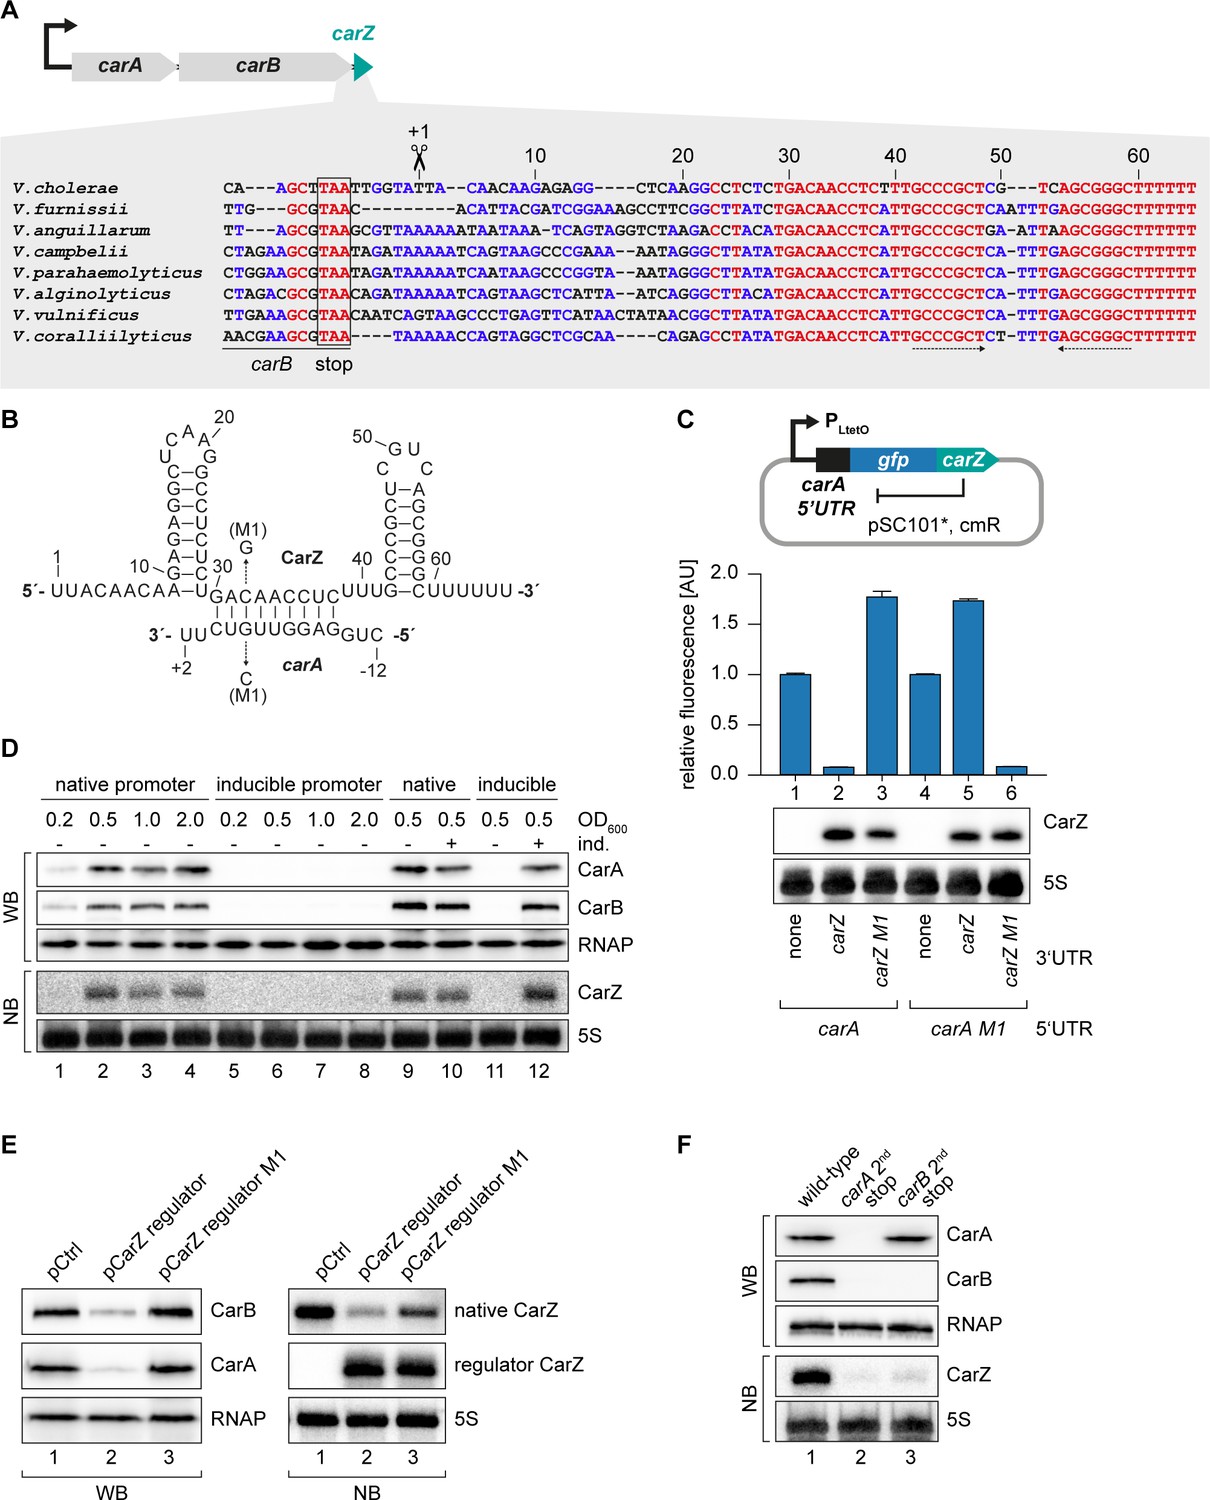
CarZ is another autoregulatory sRNA from V. cholerae.
(A) Top: Genomic context of carAB and carZ. Bottom: Alignment of carZ sequences, including the last codons of carB, from various Vibrio species. The carB stop codon, the RNase E cleavage site and the Rho-independent terminator are indicated. (B) Predicted CarZ secondary structure and base-pairing to carA. Arrows indicate the single nucleotide mutations tested in (C). (C) Single-plasmid feedback regulation of carA by CarZ was measured by inserting the indicated carZ variant into the 3’ UTR of a translational carA::gfp fusion. Expression was driven from a constitutive promoter. E. coli strains carrying the respective plasmids were grown to OD600 = 1.0 and GFP production was measured. Fluorophore levels from control fusions without an sRNA gene were set to one and error bars represent the SD of three biological replicates. CarZ expression was tested by Northern blot; 5S rRNA served as loading control. (D) Protein and RNA samples were obtained from V. cholerae carA::3XFLAG carB::3XFLAG carrying either the native carA promoter or the inducible pBAD promoter upstream of carA. Samples were collected at the indicated OD600 and tested for CarA and CarB production by Western blot and for CarZ expression by Northern blot. RNAP and 5S rRNA served as loading controls for Western and Northern blots, respectively. Lanes 1–8: Growth without L-arabinose. Lanes 9–12: Growth with either H2O (-) or L-arabinose (+) (0.2% final conc.). (E) V. cholerae carA::3XFLAG carB::3XFLAG strains carrying a control plasmid or a plasmid expressing a CarZ variant with a mutated stem loop (regulator CarZ) were grown to late exponential phase (OD600 of 1.0). CarA and CarB production were tested by Western blot and expression of native CarZ or regulator CarZ was monitored on Northern blot using oligonucleotides binding to the respective loop sequence variants. RNAP and 5S rRNA served as loading controls for Western blot and Northern blot, respectively. (F) V. cholerae carA::3XFLAG carB::3XFLAG strains with the following carA or carB mutations were grown: wild-type (lane 1) or a STOP codon inserted at the 2nd codon of carA (lane 2) or carB (lane 3), respectively. At late exponential phase (OD600 of 1.0), protein and RNA samples were collected and tested for CarA and CarB production by Western blot and for CarZ expression by Northern blot. RNAP and 5S rRNA served as loading controls for Western and Northern blots, respectively.
-
Figure 7—source data 1
Full blot images for the corresponding detail sections shown in Figure 7 and raw data for fluorescence measurements.
- https://cdn.elifesciences.org/articles/58836/elife-58836-fig7-data1-v1.docx
Figure 7—figure supplement 1
Hfq-dependent, post-transcriptional repression of CarA and CarB by CarZ.
(A) Predicted CarZ secondary structure and base-pairing to carA. Arrows indicate the single nucleotide mutations tested in (B). (B) E. coli strains carrying translational reporter plasmids for carA::gfp or carAB::gfp were co-transformed with a control plasmid or the indicated CarZ expression plasmids. Transcription of the reporter and carZ were driven by constitutive promoters. Cells were grown to OD600 = 1.0 and fluorophore production was measured. GFP levels of strains carrying the control plasmid were set to 1. Error bars represent the SD of three biological replicates. (C) V. cholerae wild-type (control) and hfq::3XFLAG (Hfq-FLAG) strains were grown to stationary phase (OD600 of 2.0), lysed, and subjected to immunoprecipitation using the anti-FLAG antibody. RNA samples of lysate (total RNA) and co-immunoprecipitated fractions were analyzed on Northern blots. 5S rRNA served as loading control. (D) E. coli Δhfq strains carrying the translational carA::gfp reporter plasmid and either a control plasmid or the indicated CarZ expression plasmids were grown to OD600 = 1.0 and fluorophore production was measured. GFP levels of the control strain were set to 1. Error bars represent the SD of three biological replicates. (E) E. coli wild-type or Δhfq strains carrying the translational carA::gfp reporter plasmid and either a control plasmid or the indicated CarZ expression plasmids were grown to OD600 = 1.0. RNA samples were analyzed for CarZ levels by Northern blot; 5S rRNA served as loading control.
-
Figure 7—figure supplement 1—source data 1
Full Northern blot images for the corresponding detail sections shown in Figure 4—figure supplement 1 and raw data for fluorescence measurements.
- https://cdn.elifesciences.org/articles/58836/elife-58836-fig7-figsupp1-data1-v1.docx
Figure 7—figure supplement 2
CarZ induces carAB degradation.
(A, B) V. cholerae ΔcarZ strains carrying either pBAD1K-ctrl (pCtrl) or pBAD1K-carZ (pCarZ) were grown to late exponential phase (OD600 of 1.0) and treated with L-arabinose (0.2% final conc.) to induce sRNA expression. After 15 min of induction, rifampicin was added to terminate transcription. RNA samples were obtained at the indicated time points and transcript levels of carA (A) and carB (B) were monitored by qRT-PCR. Error bars represent the SD of three biological replicates.
-
Figure 7—figure supplement 2—source data 1
Raw data for transcript changes as determined by qRT-PCR.
- https://cdn.elifesciences.org/articles/58836/elife-58836-fig7-figsupp2-data1-v1.docx
Figure 8 with 1 supplement

Modified kinetics of gene induction by autoregulatory OppZ.
(A) Expression of the opp operon including the oppA::3XFLAG and oppB::3XFLAG genes and the native oppZ gene (lanes 1–6) or an oppZ deletion (lanes 7–12) was induced from the pBAD promoter at late exponential phase (OD600 of 1.0) by the addition of L-arabinose (0.2% final conc.). Protein and RNA samples were obtained at the indicated time points and tested for OppA and OppB production by Western blot and for OppZ expression by Northern blot. RNAP and 5S rRNA served as loading controls for Western and Northern blots, respectively. (B, C) Quantification of OppA (B) or OppB (C) levels from the experiment in (A); error bars represent the SD of three biological replicates. Data are presented as fold regulation of OppA or OppB in ΔoppZ compared to the wild-type. Dashed lines in (C) indicate the time points of half-maximum OppB expression.
-
Figure 8—source data 1
Quantification of OppAB protein levels from Western blots and full blot images for the corresponding detail sections shown in Figure 8.
- https://cdn.elifesciences.org/articles/58836/elife-58836-fig8-data1-v1.docx
Figure 8—figure supplement 1
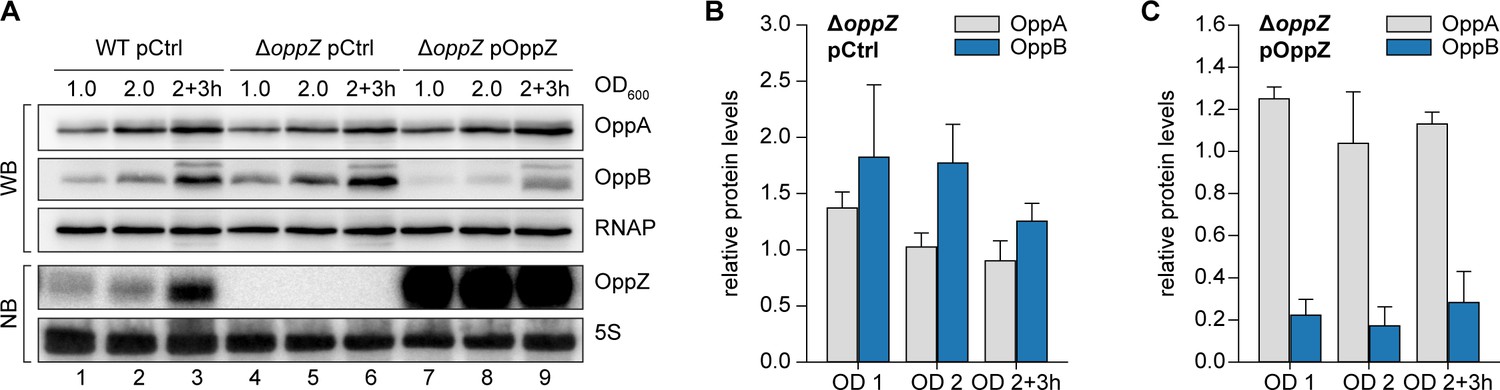
OppZ-dependent repression of OppA and OppB protein levels.
(A) V. cholerae wild-type and ΔoppZ strains carrying the oppA::3XFLAG and oppB::3XFLAG genes and either a control plasmid or a constitutive OppZ expression plasmid were grown to obtain protein and RNA samples at the indicated OD600. OppA and OppB production were analyzed by Western blot and OppZ expression was tested by Northern blot. RNAP and 5S rRNA served as loading controls for Western and Northern blots, respectively. (B) Quantification of (A), bars show fold regulation of OppA and OppB in ΔoppZ compared to the wild-type; error bars represent the SD of four biological replicates. (C) Quantification of (A), bars show fold regulation of OppA and OppB upon OppZ overexpression in the ΔoppZ background compared to the wild-type control; error bars represent the SD of four biological replicates.
-
Figure 8—figure supplement 1—source data 1
Quantification of OppAB protein levels from Western blots and full blot images for the corresponding detail sections shown in Figure 8—figure supplement 1.
- https://cdn.elifesciences.org/articles/58836/elife-58836-fig8-figsupp1-data1-v1.docx
Figure 9
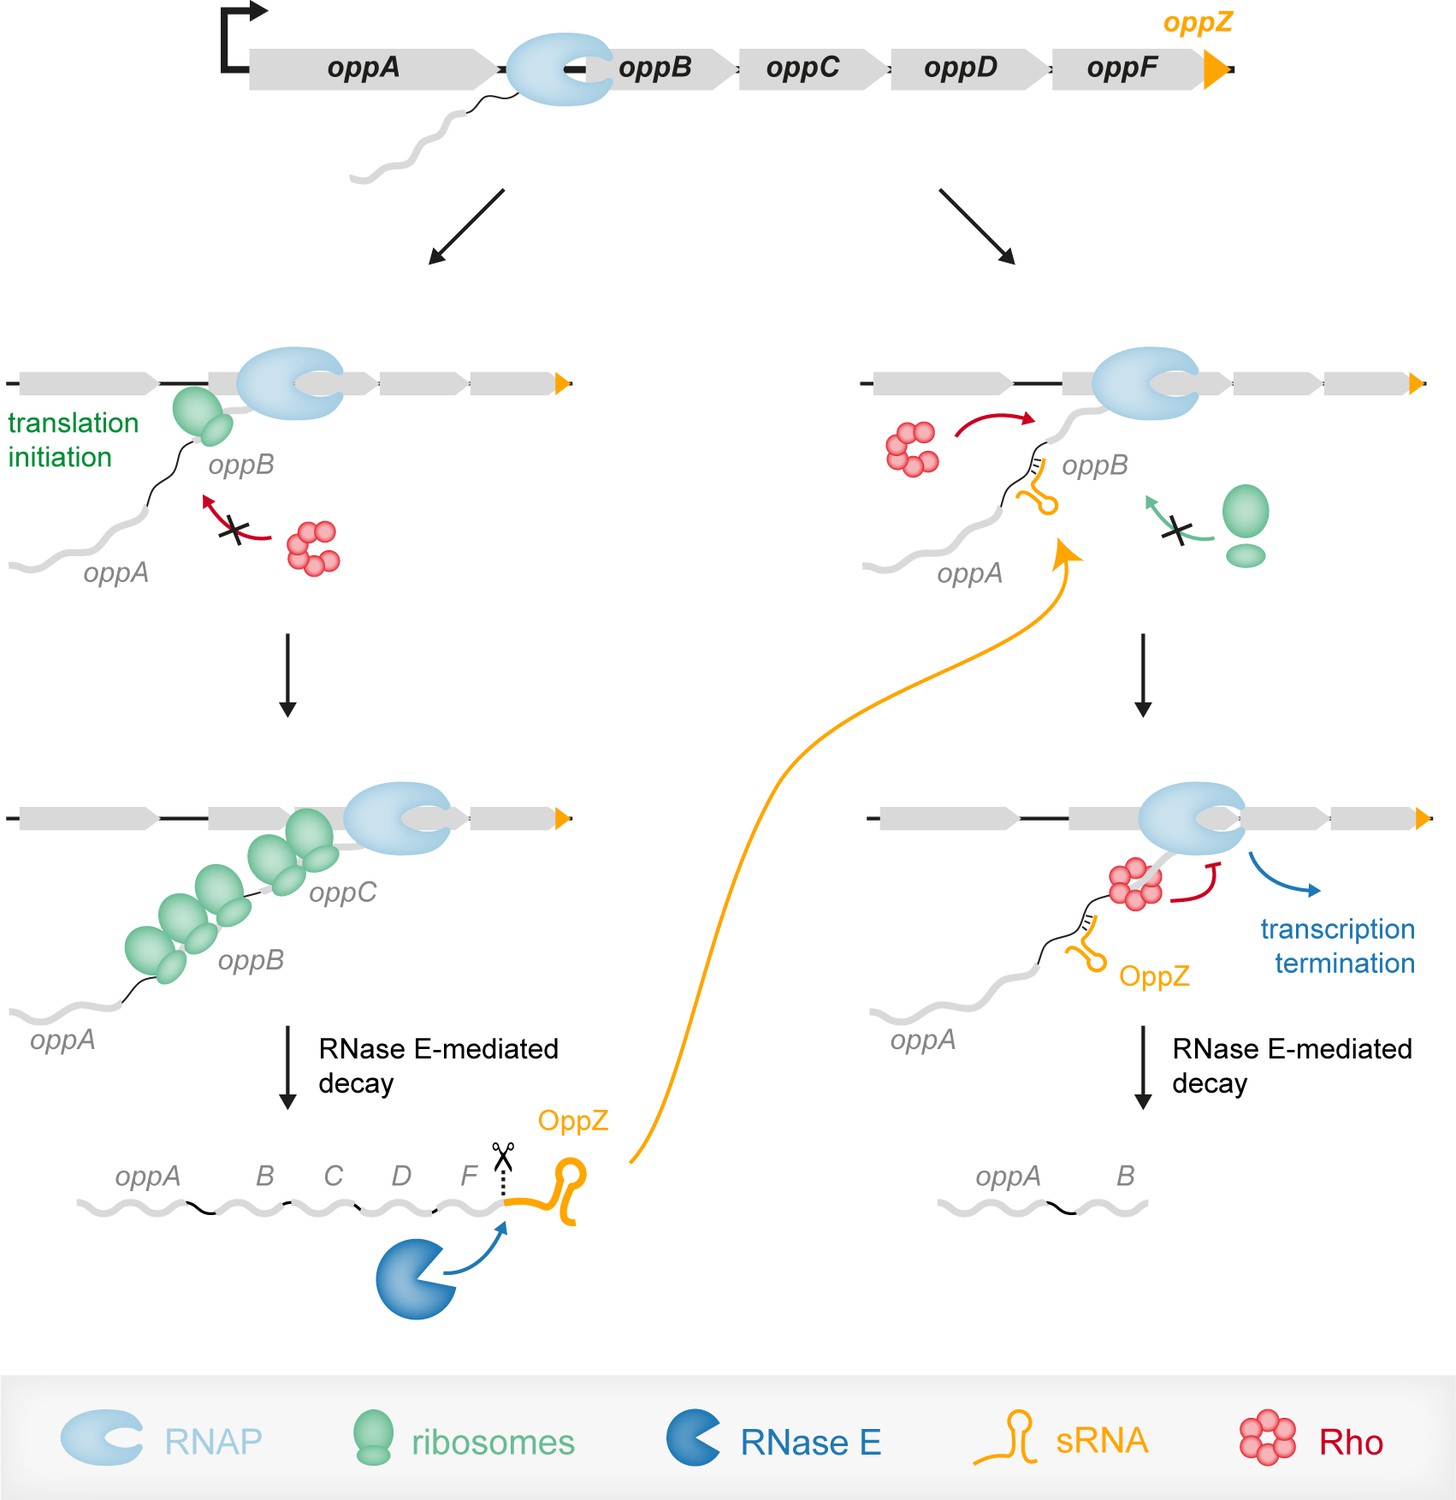
Model of the OppZ-dependent mechanism of opp regulation.
Transcription of the oppABCDF operon initiates upstream of oppA and in the absence of OppZ (left) involves all genes of the operon as well as OppZ. In this scenario, all cistrons of the operon are translated. In the presence of OppZ (right), the sRNA blocks translation of oppB and the ribosome-free mRNA is recognized by termination factor Rho. Rho catches up with the transcribing RNAP and terminates transcription pre-maturely within oppB. Consequently, oppBCDF are not translated and OppZ is not produced.
Tables
Key resources table
| Reagent type (species) or resource | Designation | Source or reference | Identifiers | Additional information |
|---|---|---|---|---|
| Strain, strain background (Escherichia coli) | See Supplementary file 4 | This study | See Supplementary file 4 | |
| Strain, strain background (Vibrio cholerae) | See Supplementary file 4 | This study | See Supplementary file 4 | |
| Recombinant DNA reagent (plasmids) | See Supplementary file 4 | This study | See Supplementary file 4 | |
| Sequence-based reagent (oligonucleotides) | See Supplementary file 4 | This study | See Supplementary file 4 | |
| Antibody | ANTI-FLAG M2 antibody (mouse monoclonal) | Sigma-Aldrich | Cat#F1804; RRID:AB_262044 | (Western blot 1:1.000) |
| Antibody | RNA Polymerase alpha antibody 4RA2 (rabbit monoclonal) | BioLegend | Cat#WP003; RRID:AB_2687386 | (1:10.000) |
| Antibody | anti-mouse IgG HRP (goat polyclonal) | ThermoFischer | Cat#31430; RRID:AB_228307 | (1:10.000) |
| Antibody | anti-rabbit IgG HRP (goat polyclonal) | ThermoFischer | Cat#A16104; RRID:AB_2534776 | (1:10.000) |
| Commercial assay or kit | TURBO DNA-free Kit | Invitrogen | Cat#AM1907 | |
| Commercial assay or kit | NEBNext Ultra II Directional RNA Library Prep Kit for Illumina | NEB | Cat#E7760 | |
| Commercial assay or kit | Ribo-Zero rRNA Removal Kit (Gram-Negative Bacteria) | Illumina | Cat#MRZGN126 | |
| Chemical compound, drug | Protein G Sepharose | Sigma-Aldrich | Cat##P3296 | |
| Chemical compound, drug | Bicyclomycin (BCM) | SantaCruz Biotech. | Cat#sc-391755; CAS ID: 38129-37-2 | |
| Software, algorithm | MultAlin | Corpet, 1988 (PMID:2849754) | http://multalin.toulouse.inra.fr/multalin | |
| Software, algorithm | RNAhybrid | Rehmsmeier et al., 2004 (PMID:15383676) | http://bibiserv2.cebitec.uni-bielefeld.de RRID:SCR_003252 | |
| Software, algorithm | CLC Genomics Workbench | Qiagen | https://qiagenbioinformatics.com RRID:SCR_011853 | |
| Software, algorithm | SigmaPlot | SYSTAT | https://systatsoftware.com RRID:SCR_003210 | |
| Software, algorithm | GelQuantNET | biochemlabsolutions | http://biochemlabsolutions.com/GelQuantNET.html RRID:SCR_015703 | |
| Software, algorithm | BIO-1D | VILBER | http://vilber.de/en/products/analysis-software | |
| Software, algorithm | ImageJ | Schneider et al., 2012 (PMID:22930834) | https://imagej.nih.gov/ij/ RRID:SCR_003070 | |
| Software, algorithm | cutadapt | Martin, 2011 | https://doi.org/10.14806/ej.17.1.200 | |
| Software, algorithm | READemption | Förstner et al., 2014 (PMID:25123900) | https://doi.org/10.5281/zenodo.591469 | |
| Software, algorithm | DESeq2 | Love et al., 2014 (PMID:25516281) | http://www.bioconductor.org/packages/release/bioc/html/DESeq2.html | |
| Software, algorithm | RNAfold | Lorenz et al., 2011 (PMID:22115189) | http://www.tbi.univie.ac.at/RNA | |
| Software, algorithm | WebLogo | Crooks et al., 2004 (PMID:15173120) | http://weblogo.threeplusone.com/ | |
| Software, algorithm | BEDTools | Quinlan and Hall, 2010 (PMID:20110278) | http://code.google.com/p/bedtools |
Additional files
-
Supplementary file 1
TIER-seq sites in Vibrio cholerae.
- https://cdn.elifesciences.org/articles/58836/elife-58836-supp1-v1.xlsx
-
Supplementary file 2
RNase E-mediated maturation of sRNAs.
- https://cdn.elifesciences.org/articles/58836/elife-58836-supp2-v1.xlsx
-
Supplementary file 3
BCM-sensitive transcripts in Vibrio cholerae.
- https://cdn.elifesciences.org/articles/58836/elife-58836-supp3-v1.xlsx
-
Supplementary file 4
Bacterial strains, plasmids and DNA oligonucleotides.
- https://cdn.elifesciences.org/articles/58836/elife-58836-supp4-v1.docx
-
Transparent reporting form
- https://cdn.elifesciences.org/articles/58836/elife-58836-transrepform-v1.docx
Download links
A two-part list of links to download the article, or parts of the article, in various formats.
Downloads (link to download the article as PDF)
Open citations (links to open the citations from this article in various online reference manager services)
Cite this article (links to download the citations from this article in formats compatible with various reference manager tools)
Gene autoregulation by 3’ UTR-derived bacterial small RNAs
eLife 9:e58836.
https://doi.org/10.7554/eLife.58836


