Human primed ILCPs support endothelial activation through NF-κB signaling
- Department of Oncology, Ludwig Institute for Cancer Research - University of Lausanne, Switzerland
- Department of Earth Science, Environment and Life, University of Genova, Italy
- Department of Laboratory and Service, Histological and Anatomical Pathology, E.O. Galliera Hospital, Italy
- Department of Urology, University Hospital of Lausanne (CHUV), Switzerland
- Department of Experimental Medicine and Centre of Excellence for Biomedical Research, University of Genova, Italy
- Department of Biochemistry, University of Lausanne, Switzerland
- Department of Oncology, University of Lausanne, Switzerland
Figures
Figure 1 with 2 supplements
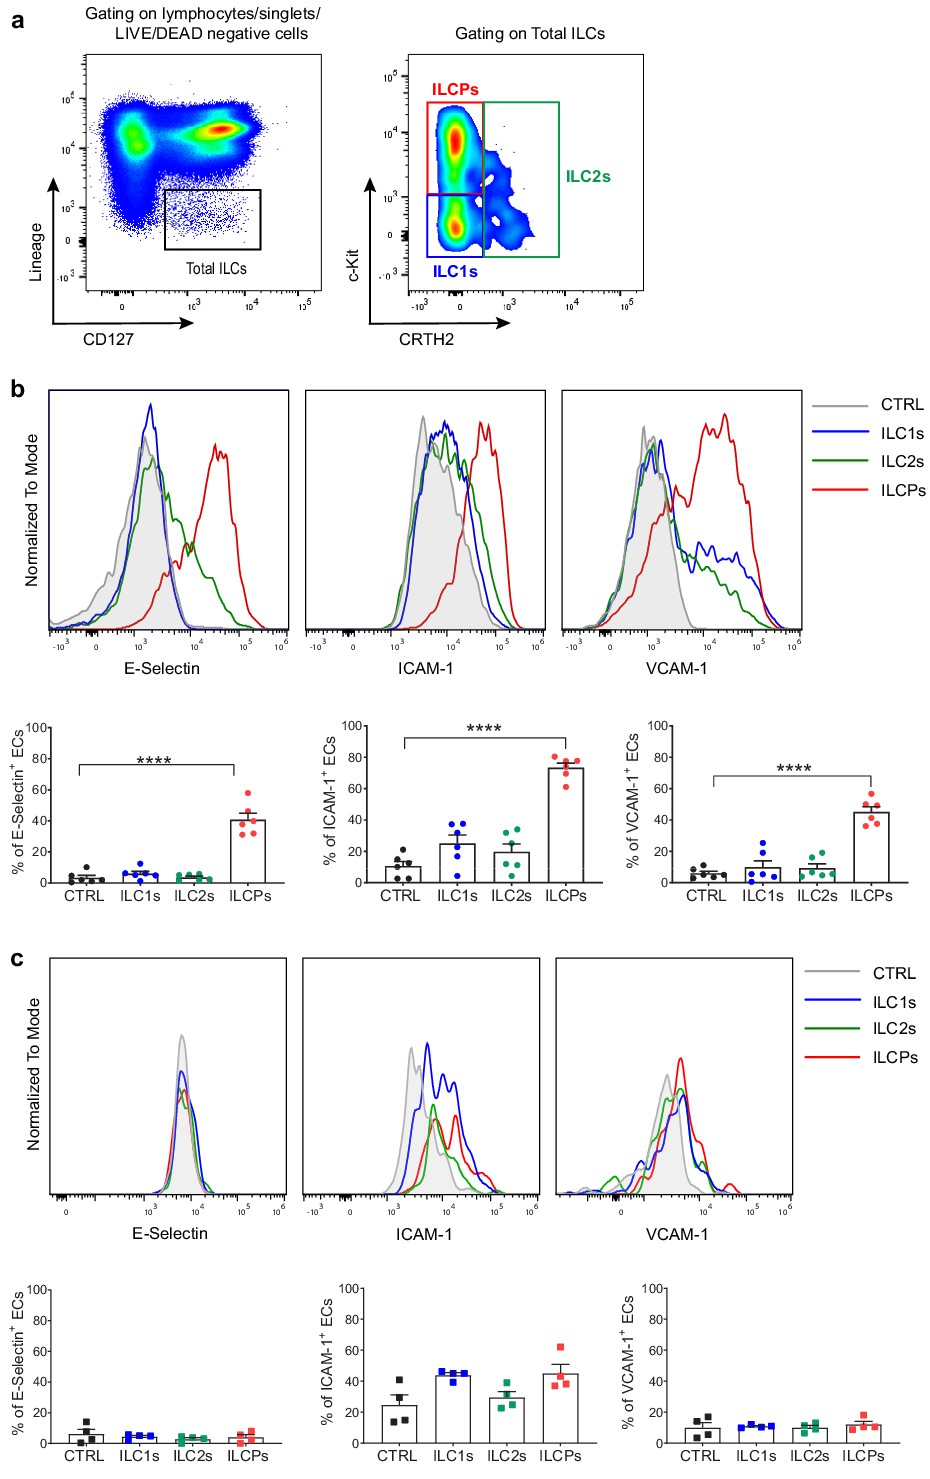
In vitro-expanded innate lymphoid cell precursors (ILCPs) induce adhesion molecule expression in endothelial cells (ECs).
(a) Circulating human ILCs are identified as lineage negative CD127+ cells; within this population, we discriminate ILC1s as c-Kit- CRTH2-, ILC2s as CRTH2+ c-Kit+/-, and ILCPs as c-Kit+ CRTH2- cells. HUVEC cells were co-cultured for 3 hr at 1:1 ratio in direct contact with either in vitro-expanded (b) or directly ex vivo-sorted (c) ILC1s, ILC2s, and ILCPs. Untreated ECs were employed as negative control (CTRL). ECs were harvested and analyzed for cell-surface adhesion molecule expression by flow cytometry. Graphs show representative histograms (panels b and c, top) and the summary (panels b and c, bottom) of the induction of the indicated adhesion molecules on the EC surface (n = 6). Ordinary one-way ANOVA–Tukey’s multiple comparison test (panel b); Ordinary one-way ANOVA–Friedman test (panel c).
-
Figure 1—source data 1
Raw data of panels b and c.
- https://cdn.elifesciences.org/articles/58838/elife-58838-fig1-data1-v2.xlsx
Figure 1—figure supplement 1
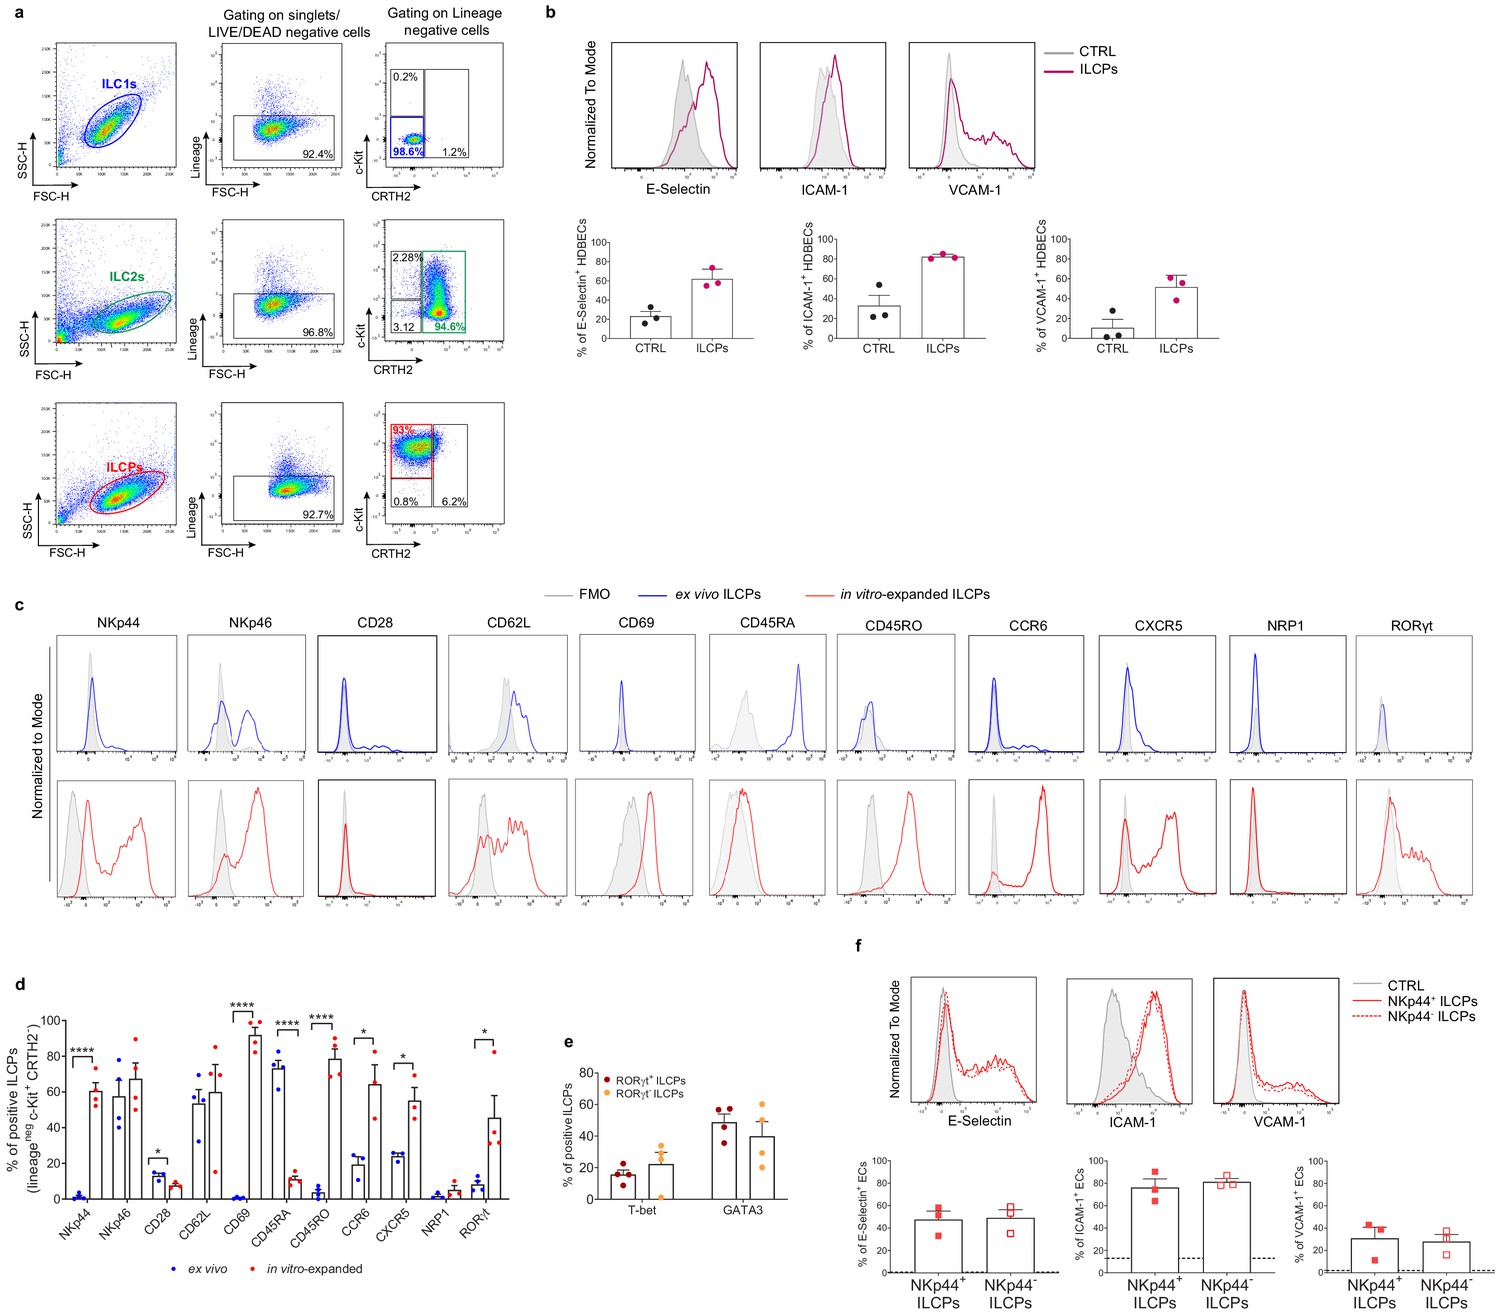
Human innate lymphoid cell precursors (ILCPs) acquire an activated phenotype in vitro.
(a) Following ex vivo sorting and in vitro expansion, the individual ILC subsets were subjected to purity checks before use in functional assays with endothelial cells (ECs). ILC1s were re-sorted as Lin-c-Kit-CRTH2-, ILC2s as Lin-c-Kit-/+CRTH2+, and ILCPs as Lin-c-Kit+CRTH2- cells. (b) HDBECs were co-cultured for 3 hr at 1:1 ratio in direct contact with in vitro-expanded ILCPs. Untreated HDBECs were employed as negative control (CTRL). ECs were harvested and analyzed for cell-surface adhesion molecule expression by flow cytometry. Graphs show representative histograms (top) and the summary (bottom) of the induction of the indicated adhesion molecules on the EC surface (n = 3). (c) Representative histograms showing the expression of NKp44, NKp46, CD28, CD62L, CD69, CD45RA, CD45RO, CCR6, CXCR5, NRP1, and RORγt by ex vivo- and in vitro-expanded ILCPs. (d) The graphs show the summary of the results obtained in four different donors. (e) Expression of T-bet and GATA3 in RORγt+ vs RORγt- ILCPs. (f) HUVEC cells were co-cultured for 3 hr at 1:1 ratio in direct contact with in vitro-expanded NKp44+ ILCPs and NKp44- ILCPs. Untreated ECs were employed as negative control (CTRL). ECs were harvested and analyzed for cell-surface adhesion molecule expression by flow cytometry. Graphs show representative histograms (top) and the summary (bottom) of the induction of the indicated adhesion molecules on the EC surface (n = 3). The black dotted lines indicate the level of average expression of adhesion molecules by untreated ECs. Statistical tests used: Paired t-test (panels b and f); Multiple t-tests (panels d and e).
-
Figure 1—figure supplement 1—source data 1
Raw data of panels b and d–f.
- https://cdn.elifesciences.org/articles/58838/elife-58838-fig1-figsupp1-data1-v2.xlsx
Figure 1—figure supplement 2
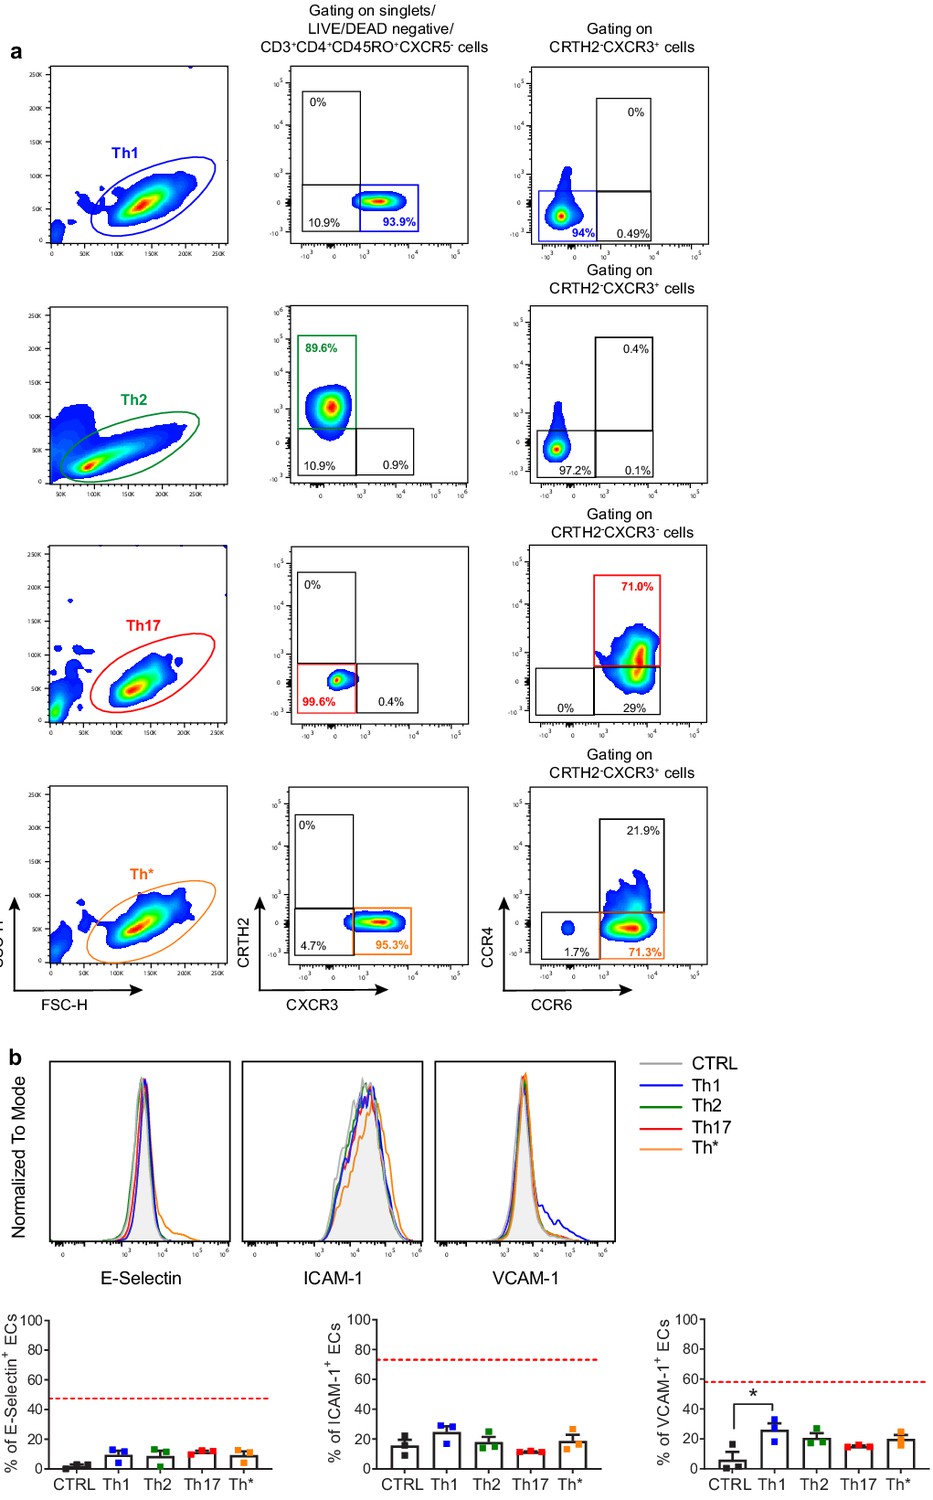
In vitro-expanded Th subsets fail to activate endothelial cells (ECs).
(a) Circulating human naïve CD4+ T cell subsets were isolated from the peripheral blood of HDs as CD3+ CD4+ CD45RA+ cells and in vitro-expanded for 2 weeks in the presence of 100 U/mL rhIL-2, 1 μg/mL of PHA, and irradiated allogenic feeder cells (1:10 T cell-feeder cell ratio). Individual CD4+ T cell subsets were re-sorted by FACS as follows: Th1 as CRTH2- CXCR3+ CCR6- cells; Th* as CRTH2- CXCR3+ CCR6+ cells; Th2 as CRTH2+ cells; and Th17 as CRTH2- CXCR3- CCR4+ CCR6+ cells. (b) HUVEC cells were co-cultured for 3 hr at 1:1 ratio in direct contact with in vitro-expanded Th1, Th2, Th17, and Th* or left untreated (CTRL). ECs were harvested and analyzed for cell-surface adhesion molecule expression by flow cytometry. Graphs show representative histograms (top) and the summary (bottom) of the induction of the indicated adhesion molecules on the EC surface (n = 3). The red dotted lines indicate the level of average expression of adhesion molecules by innate lymphoid cell precursor (ILCP)-exposed ECs. Statistical test used: Kruskal–Wallis test (panel b).
-
Figure 1—figure supplement 2—source data 1
Raw data of panel b.
- https://cdn.elifesciences.org/articles/58838/elife-58838-fig1-figsupp2-data1-v2.xlsx
Figure 2 with 1 supplement
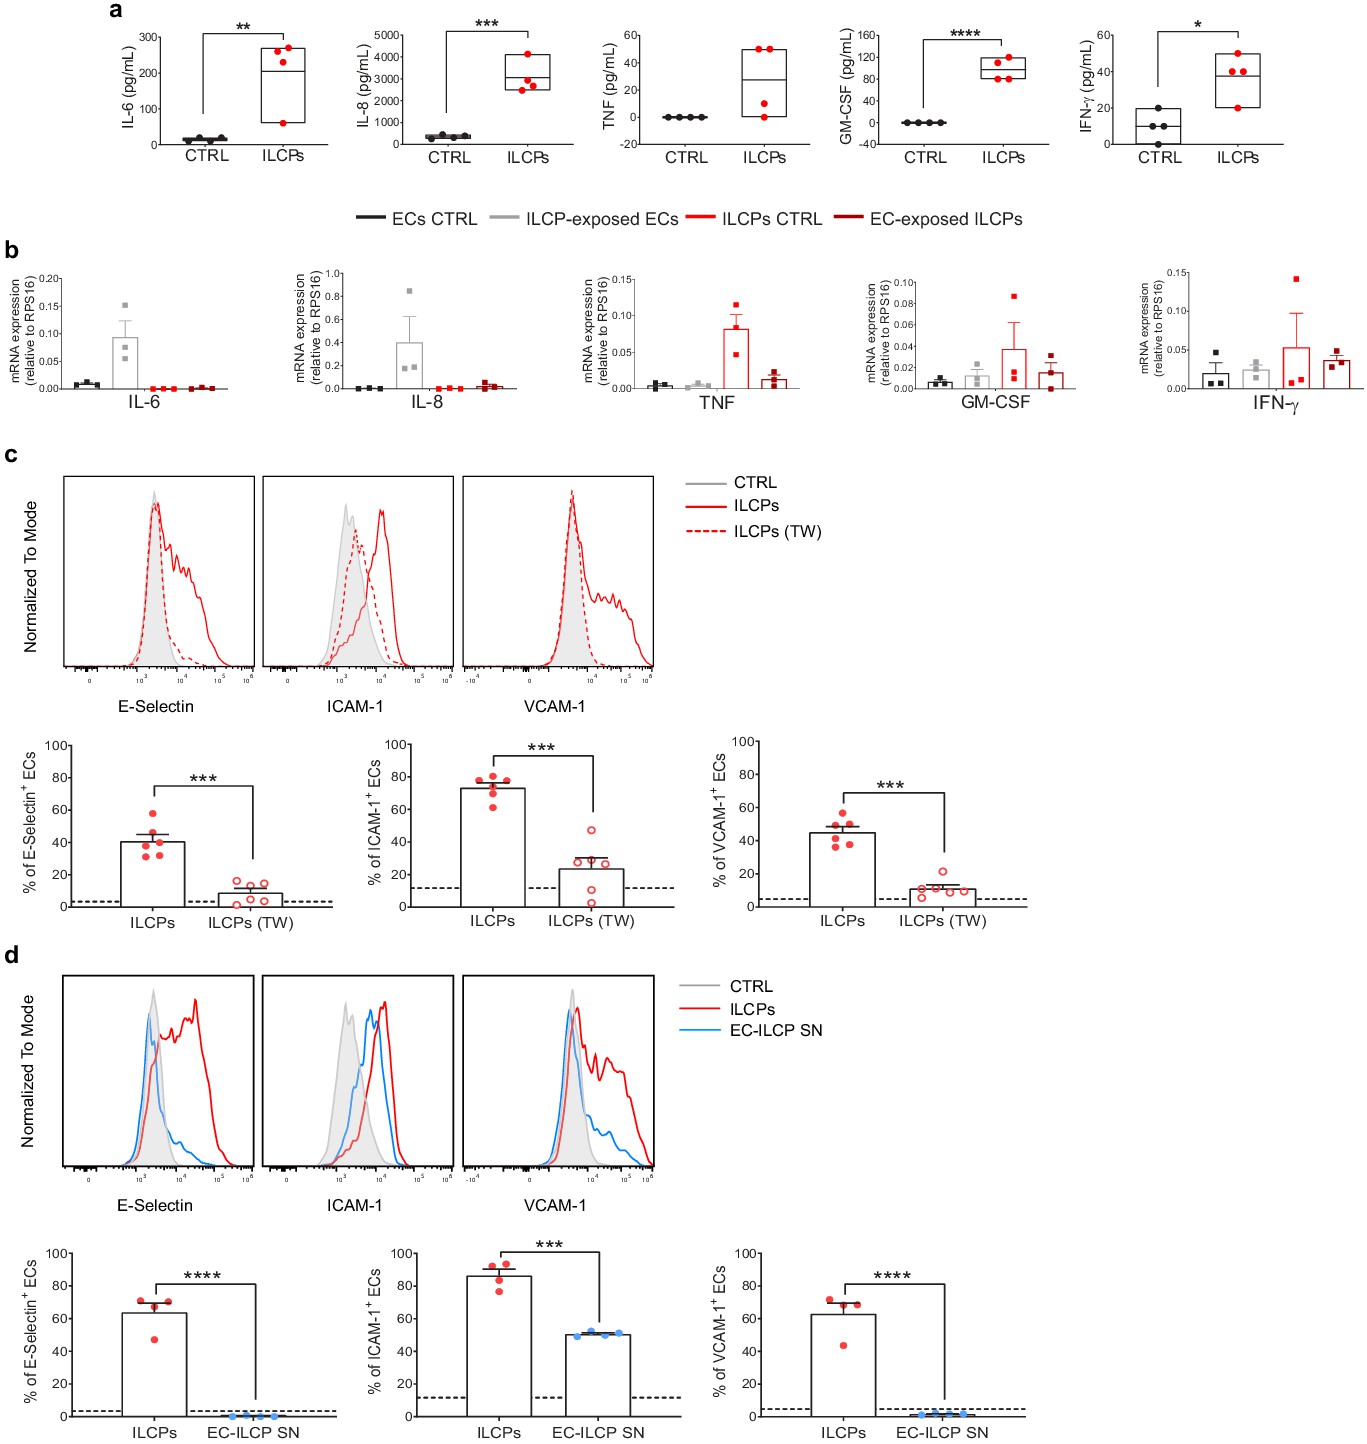
Human innate lymphoid cell precursors (ILCPs) activate ECs primarily in a contact-dependent mechanism in vitro.
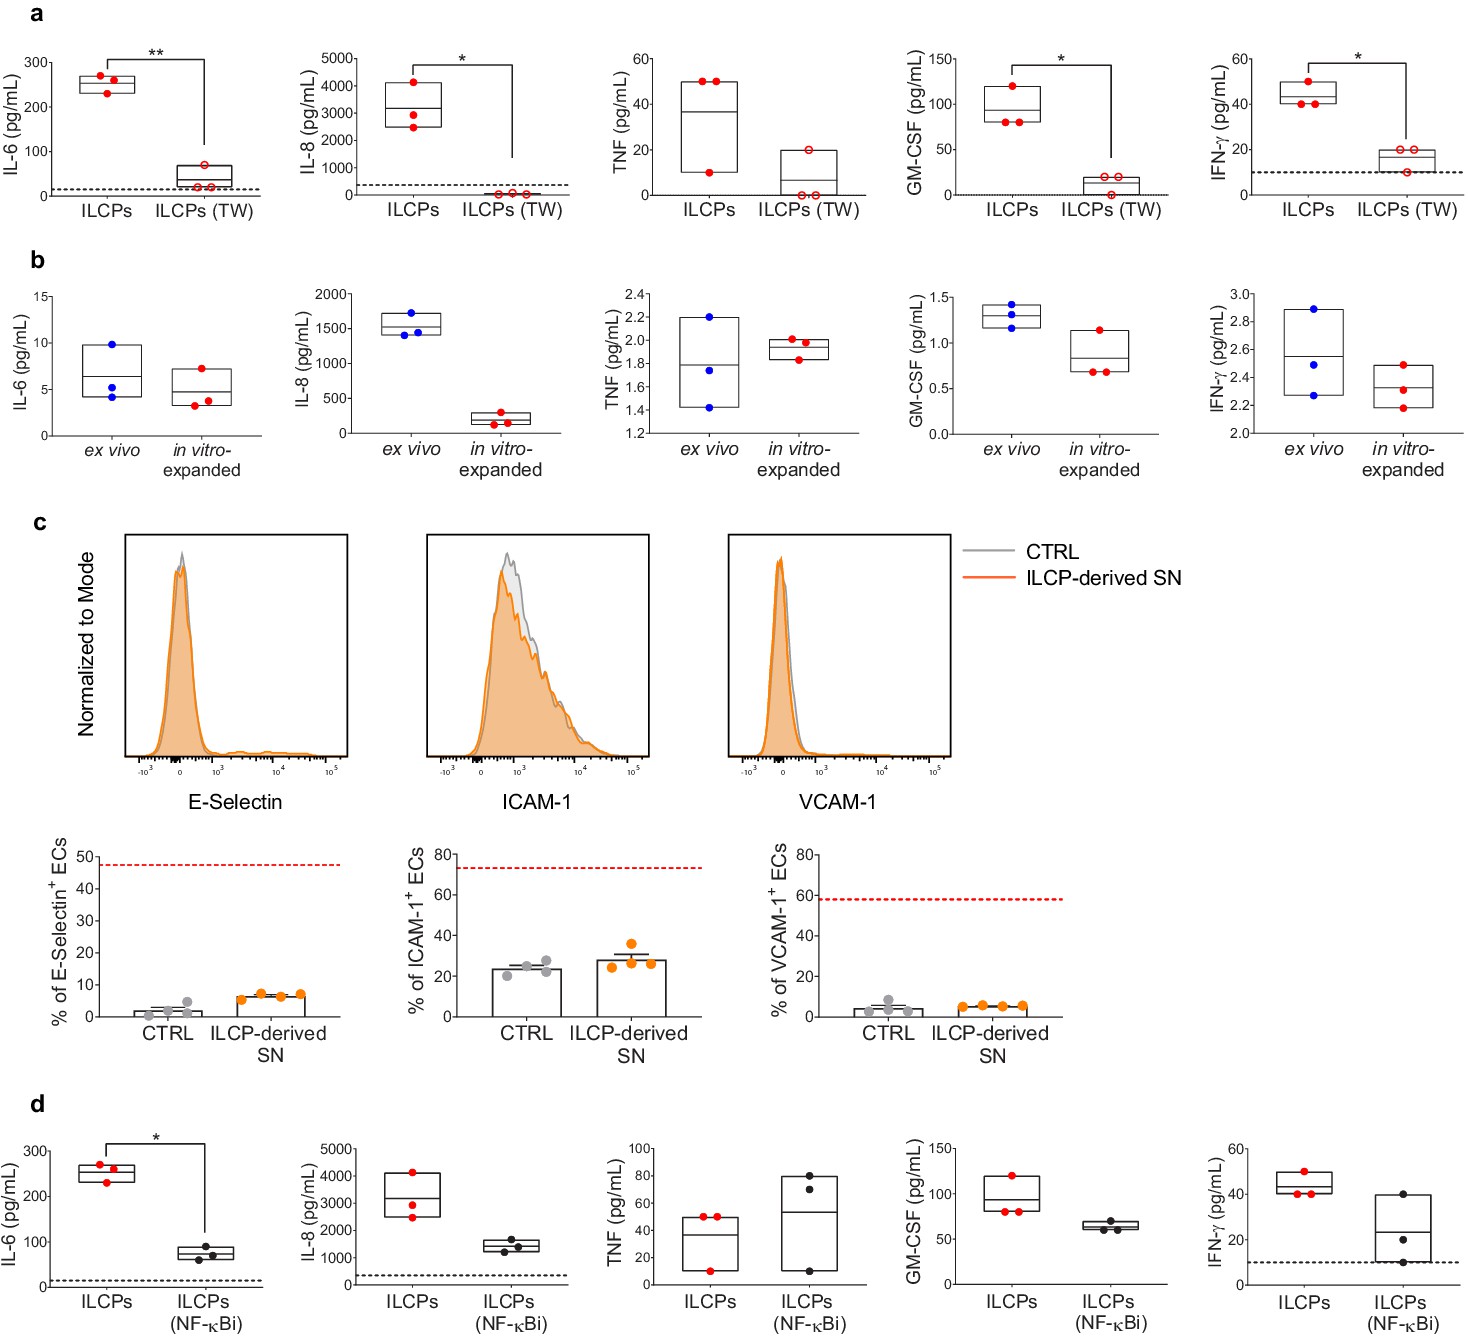
(a) The supernatant of the 3 hr co-culture experiments between ECs and ILCPs was analyzed for its cytokine contents (n = 4). The composition of the supernatant of ECs in EC growth medium was used as negative control (CTRL). (b) The expression of IL-6, IL-8, GM-CSF, TNF, and IFN-γ was analyzed by qPCR in ECs and ILCPs after being cultured for 3 hr at 1:1 ratio and FACS-sorted according to CD31 expression. Untreated ECs and ILCPs were employed as controls (CTRL). (c) HUVEC cells were co-cultured for 3 hr at 1:1 ratio in direct contact with in vitro-expanded ILCPs either in the absence (red dots) or presence (red circles) of a transwell (TW) insert (0.4 μm pore polycarbonate filter) or (d) in the presence of pre-conditioned media coming from previous EC–ILCP 3 hr co-cultures. ECs were harvested and analyzed for cell-surface adhesion molecule expression by flow cytometry (n = 6). The dotted lines indicate the level of average expression of adhesion molecules by unstimulated ECs. Statistical tests used: Unpaired t-test (panels a and d); paired t-test (panel c).
-
Figure 2—source data 1
Raw data of panels a–d.
- https://cdn.elifesciences.org/articles/58838/elife-58838-fig2-data1-v2.xlsx
Figure 2—figure supplement 1
Human innate lymphoid cell precursors (ILCPs) activate endothelial cells (ECs) primarily in a contact-dependent manner in vitro.
The supernatant of the 3 hr co-culture experiments between ECs and ILCPs, with (ILCPs TW) and without transwell (ILCPs) (a), and with (ILCPs NF-κBi) or without (ILCPs) NF-κB pre-inhibition in ECs (d) was analyzed for its cytokine content (n = 3). EC growth medium was used as negative control (black dotted lines). (b) The supernatant of ex vivo-sorted ILCPs, cultured for 24 hr in the presence of 100 U/mL of IL-2 in RPMI 8% HS, and of ILCPs at the end of the in vitro expansion protocol was analyzed for its cytokine content (n = 3). (c) HUVEC cells were co-cultured for 3 hr in the presence of pre-conditioned media coming from previous ILCPs at the end of the expansion protocol. ECs were harvested and analyzed for cell-surface adhesion molecule expression by flow cytometry (n = 4). The red dotted lines indicate the level of average expression of adhesion molecules by ILCP-exposed ECs. Statistical test used: Paired t-test (panels a, c, and d): Unpaired t-test (panel b).
-
Figure 2—figure supplement 1—source data 1
Raw data of panels a–d.
- https://cdn.elifesciences.org/articles/58838/elife-58838-fig2-figsupp1-data1-v2.xlsx
Figure 3
Innate lymphoid cell precursors (ILCPs) induce adhesion molecules expression on the endothelial cell (EC) surface via NF-κB pathway activation.
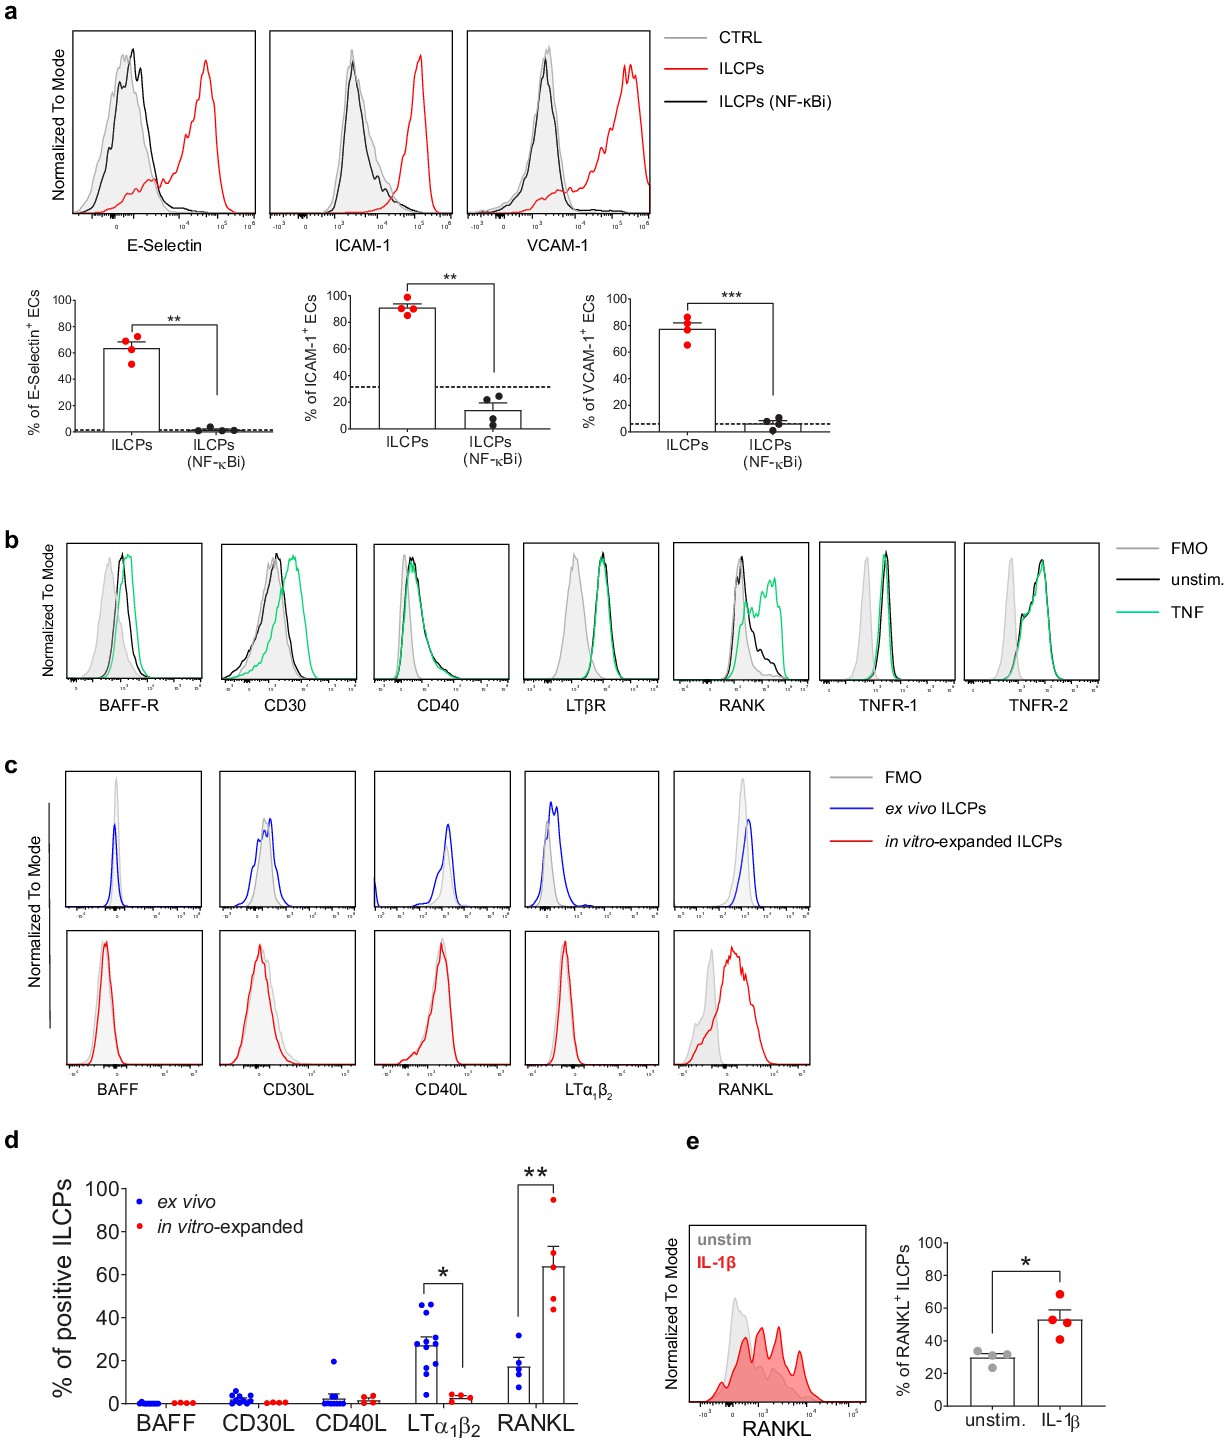
(a) HUVEC cells were treated during 1 hr with 2.5 μM of a specific inhibitor of both canonical and alternative NF-κB pathways (BAY 11–7082, Adipogen) and then exposed to ILCPs at 1:1 ratio for 3 hr. ECs were harvested and analyzed for cell-surface adhesion molecule expression by flow cytometry (n = 4). The black dotted line indicates the level of average expression by untreated ECs. (b) HUVEC cells were tested for the expression of NF-κB activating receptors, either at steady-state (black line) or following 3 hr in vitro stimulation with 20 ng/mL of TNF (green line). (c and d) The respective activating ligands were analyzed on both ex vivo- and in vitro-expanded ILCPs. Graphs show representative histograms (panel c) and the summary (panel d) of the analysis performed on HDs (n = 4–11). (e) In vitro-expanded ILCPs were stimulated during 24 hr in the presence of 20 ng/mL of IL-1β or left untreated and stained for surface RANKL (n = 4). Statistical tests used: Paired t-test (panels a and e); Multiple t-tests (panel d).
-
Figure 3—source data 1
Raw data of panels a, d, and e.
- https://cdn.elifesciences.org/articles/58838/elife-58838-fig3-data1-v2.xlsx
Figure 4 with 1 supplement

Innate lymphoid cell precursor (ILCP)-mediated upregulation of adhesion molecules on ECs involves the engagement of TNFR1, TNFR2, and RANK.
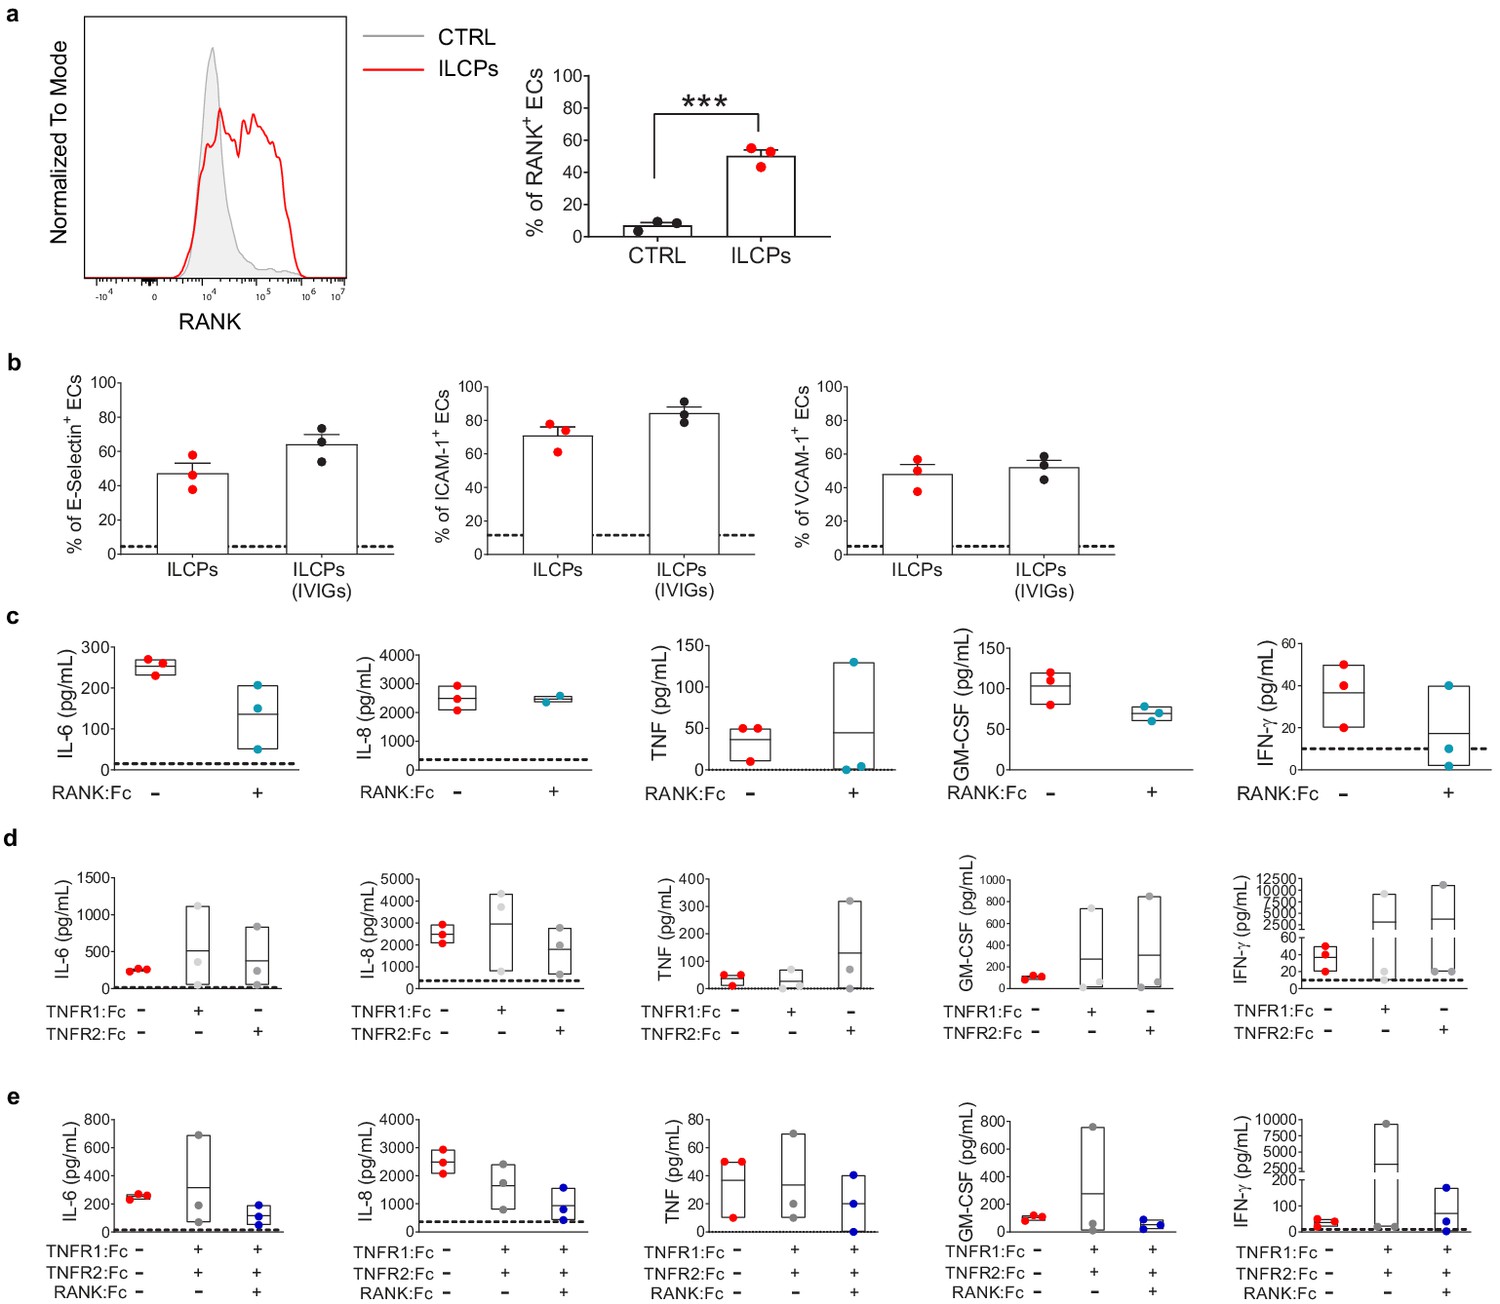
ILCPs were incubated overnight in the presence of 10 U/mL of rhIL-2 and an additional pre-incubation of 30 min (prior co-culture with ECs) was performed in the presence of 5 μg/mL of RANK:Fc (a), of 2 μg/mL of TNFR1:Fc, 5 μg/mL of TNFR2:Fc, and 5 μg/mL of RANK:Fc, either alone or in combination (b and c). ECs were harvested and analyzed for cell-surface adhesion molecule expression by flow cytometry (n = 3). The dotted lines indicate the level of average expression of adhesion molecules by unstimulated ECs. Statistical test used: Paired t-test.
-
Figure 4—source data 1
Raw data of panels a–c.
- https://cdn.elifesciences.org/articles/58838/elife-58838-fig4-data1-v2.xlsx
Figure 4—figure supplement 1
Innate lymphoid cell precursor (ILCP)-mediated modulation of RANK expression on endothelial cell (EC) surface.
(a) HUVEC cells were co-cultured for 3 hr at 1:1 ratio in direct contact with in vitro-expanded ILCPs. Untreated ECs were employed as negative control (CTRL). ECs were harvested and analyzed for cell-surface RANK expression by flow cytometry. Graphs show a representative histogram (left) and the summary (right) of the induction of RANK expression on the EC surface by ILCPs isolated from three different donors. (b) ILCPs were incubated for an overnight in the presence of 10 U/mL of rhIL-2 and an additional pre-incubation of 30 min (prior co-culture with ECs) was performed in the presence of 2 μg/mL of IVIGs, or left untreated. ECs were harvested and analyzed for cell-surface adhesion molecule expression by flow cytometry (n = 3). The dotted lines indicate the level of average expression of adhesion molecules by unstimulated ECs. (c–e) The supernatant of the 3 hr co-culture experiments between ECs and ILCPs pre-incubated with Fc fusion proteins were analyzed for cytokine content (n = 3). The dotted lines indicate the average level of cytokines produced by unstimulated ECs. Paired t-tests.
-
Figure 4—figure supplement 1—source data 1
Raw data of panels a–d.
- https://cdn.elifesciences.org/articles/58838/elife-58838-fig4-figsupp1-data1-v2.xlsx
Figure 5
Innate lymphoid cell precursor (ILCP)-exposed endothelial cells (ECs) favor the adhesion of freshly isolated PBMCs in vitro.
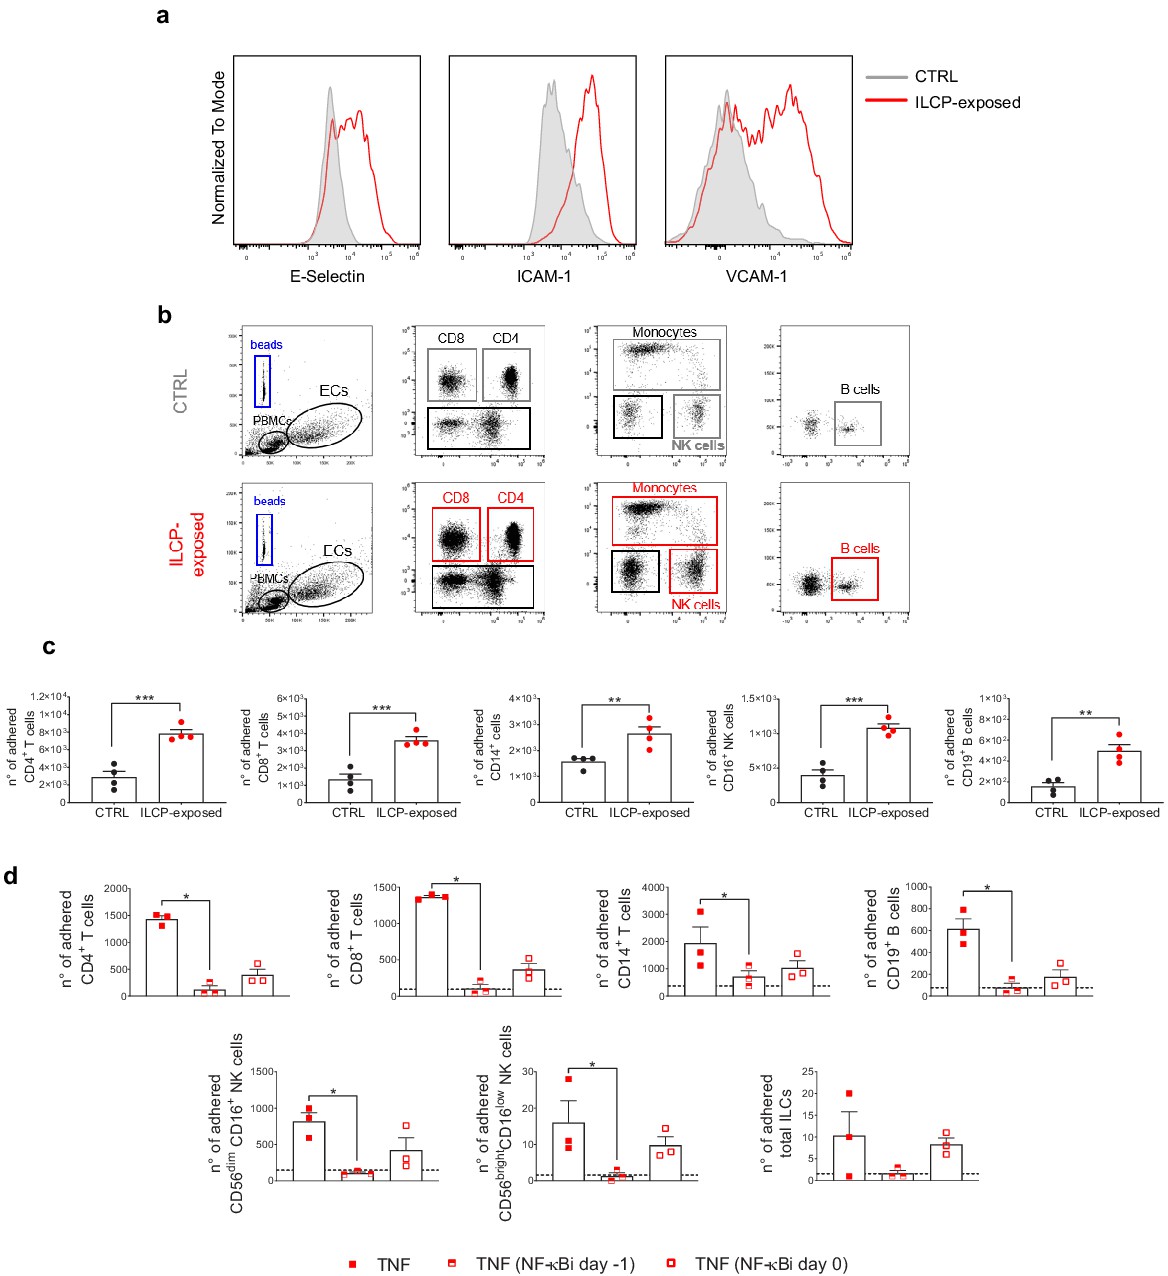
HUVEC cells were co-cultured for 3 hr at 1:1 ratio in direct contact with in vitro-expanded ILCPs or left untreated (CTRL). ECs were harvested, FACS isolated to remove adhered ILCPs, and re-seeded. (a) The graphs show the level of expression of adhesion molecules by ILCP-exposed ECs after the sorting and before performing the static adhesion assay, compared to untreated ECs (gray). Graphs show representative dot plots (b) and the summary (c) of the number of adhered CD3, CD4, CD8, CD14, CD16, and CD19 expressing cells assessed by flow cytometry with the use of CountBright Absolute Counting Beads (blue gate in the dot plots). (d) The day before the assay, HUVEC cells were cultured for 3 hr in the presence of 20 ng/mL of TNF and treated during 1 hr with 2.5 μM NF-κB inhibitor BAY 11–7082 (Adipogen), either before the TNF treatment (half-full red square dots) or directly on the day of the assay (empty red square dots), before incubation with total PBMCs at 1:4 ratio for 30 min. The graphs show the summary of the number of adhered CD3, CD4, CD8, CD14,, CD56dimCD16+, CD56brightCD16low, CD19 expressing cells, and ILCs assessed by flow cytometry with the use of CountBright Absolute Counting Beads. Statistical test used: Unpaired t-test (panels c and d).
-
Figure 5—source data 1
Raw data of panels c and d.
- https://cdn.elifesciences.org/articles/58838/elife-58838-fig5-data1-v2.xlsx
Figure 6 with 1 supplement
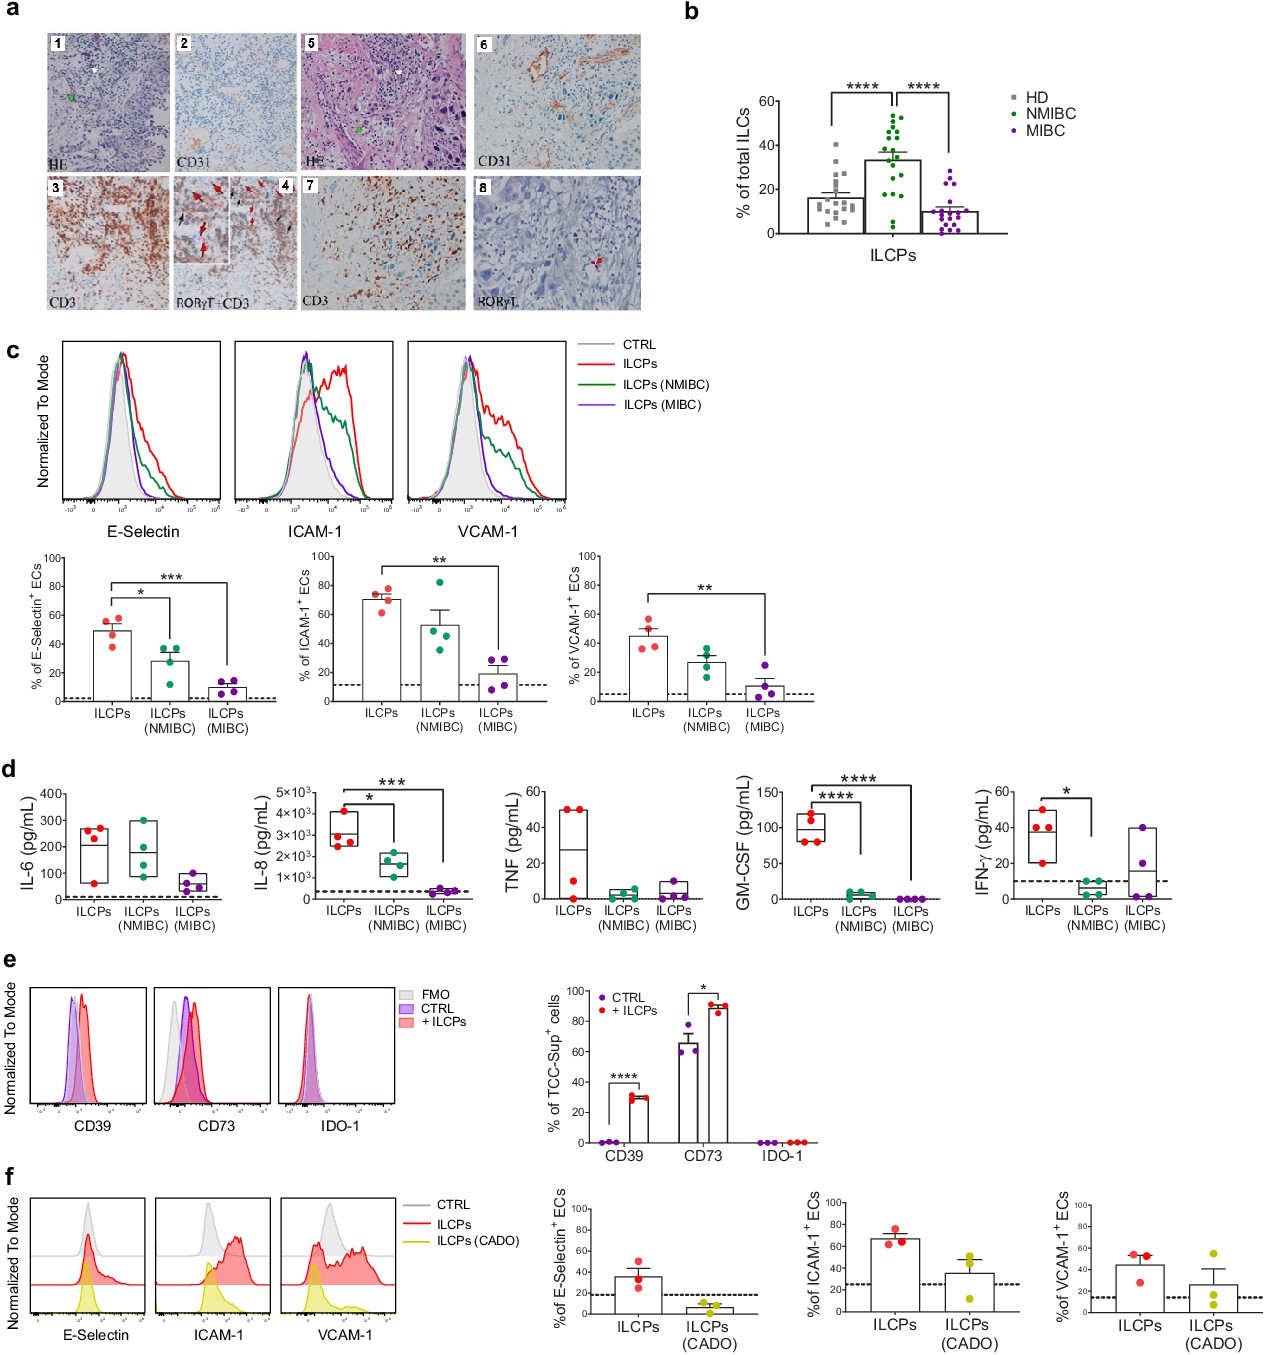
Innate lymphoid cell precursors (ILCPs) are found in proximity of blood vessels in low-grade, but barely detected in high-grade, bladder cancer tumor samples and are functionally impaired by co-cultures with bladder carcinoma cells.
(a, Panels 1–4) Low-grade transitional bladder cell carcinoma. (a, Panel 1) In the subepithelial connective, blood vessels (green arrow) and inflammatory lymphocytic infiltrate are observed (white arrow) (hematoxylin-eosin staining, 20× magnification). (a, Panel 2) Immunohistochemical CD31 signal showing intense positive endothelial cells (ECs) of blood vessels (20× magnification). (Panel 3) Immunohistochemical detection of CD3+ cells at level of inflammatory lymphocytic infiltrate (brown signal) (20× magnification). (a, Panel 4) Combined staining with antibody to RORγt and CD3. Black arrows indicate RORγt+/CD3+ cells; red arrows indicate RORγt+/CD3- cells (red signal) (20× magnification). On the upper left a magnified insert of the main image. Data are representative of five independent experiments. (a, Panels 5–8) High-grade bladder cell carcinoma. (a, Panel 5) In the subepithelial connective, blood vessels (green arrow) and inflammatory lymphocytic infiltrate are observed (white arrow) (hematoxylin-eosin staining, 20× magnification). (a, Panel 6) Immunohistochemical CD31 signal showing intense positive ECs of blood vessels (20× magnification). (a, Panel 7) Immunohistochemical detection of CD3+ cells at level of inflammatory lymphocytic infiltrate (brown signal) (20× magnification). (a, Panel 8) Immunohistochemical detection of RORγt+ cells at level of inflammatory lymphocytic infiltrate (red signal, red arrow) (20× magnification). Data are representative of three independent experiments. (b) Flow cytometry characterization of ILCP distribution in the PB of NMIBC and MIBC patients, compared to HDs, expressed as percentage of total ILCs (n = 20). (c) Graphs show representative histograms (panel c, top) and the summary (panel c, bottom) of the induction of adhesion molecules by ILCPs upon different culture conditions, represented as percentage of ECs expressing the indicated adhesion molecules. The dotted lines represent the level of expression of the adhesion molecules in untreated ECs (n = 4). (d) The supernatants of the 3 hr co-culture experiments between ECs and ILCPs, pre-incubated or not for an overnight with bladder carcinoma cell lines, were analyzed for cytokine content (n = 4). The dotted lines indicate the average level of cytokines produced by unstimulated ECs. (e) The expression of CD39, CD73, and IDO-1 in MIBC cells (TCC-Sup) after overnight co-culture with in vitro-expanded ILCPs was assessed by flow cytometry. Untreated TCC-Sup cells (purple bar) were used as controls (CTRL) (n = 3). (f) Graphs show representative histograms (panel f, left) and the summary (panel f, right) of the induction of adhesion molecules by ILCPs pre-treated with 50 μM of 2-Chloroadenosine (a stabilized form of adenosine), represented as percentage of ECs expressing the indicated adhesion molecules. The dotted lines represent the level of expression of the adhesion molecules in untreated ECs (n = 3). Statistical tests used: Ordinary one-way ANOVA, Tukey’s multiple comparison tests (panels b, c, and d); Multiple t-tests (panel f).
-
Figure 6—source data 1
Raw data of panels b–f.
- https://cdn.elifesciences.org/articles/58838/elife-58838-fig6-data1-v2.xlsx
Figure 6—figure supplement 1
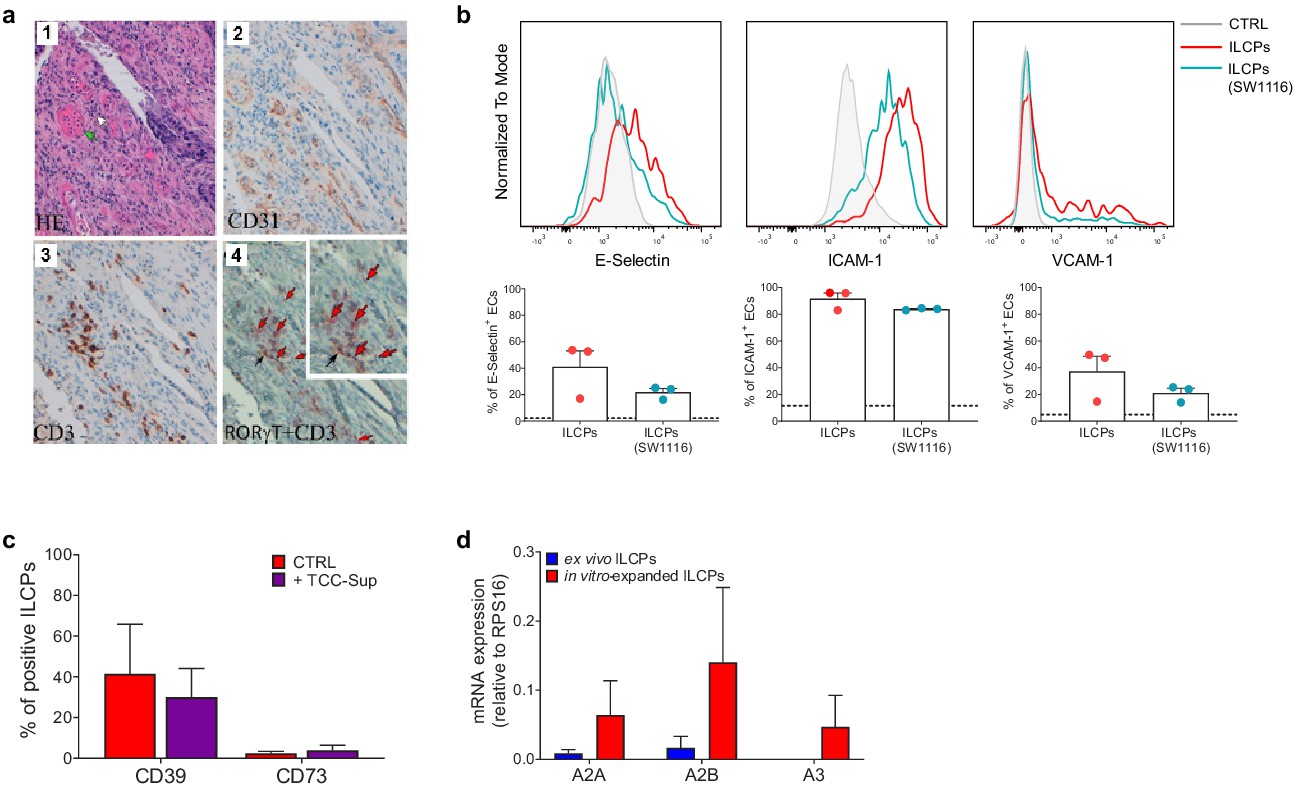
Innate lymphoid cell precursors (ILCPs) are found in proximity of blood vessels in low-grade colon adenocarcinoma and are impaired by co-cultures with colon adenocarcinoma cells.
(a, Panels 1–4) Low-grade invasive colon adenocarcinoma. (a, Panel 1) In the stroma, blood vessels (green arrow) and lymphocytic inflammatory infiltrate (white arrow) are observed (hematoxylin-eosin staining, 20× magnification). (a, Panel 2) CD31 immunohistochemistry shows an intense signal in the endothelial cells (ECs) of blood vessels (20× magnification). (a, Panel 3) Immunohistochemical detection of CD3+ cells at level of inflammatory lymphocytic infiltrate (brown signal) (20× magnification). (a, Panel 4) Combined staining with antibody to RORγt and CD3. Black arrows indicate RORγt+/CD3+ cells; red arrows indicate RORγt+/CD3- cells (20× magnification). On the upper right a magnified insert of the main image. Data are representative of five independent experiments. (b) Graphs show representative histograms (top) and the summary (bottom) of the induction of adhesion molecules by steady-state ILCPs (red) or by ILCPs pre-exposed to SW1116 colon cancer cells (marine blue), represented as percentage of ECs expressing the indicated adhesion molecules. The dotted lines represent the level of expression of the adhesion molecules in untreated ECs (n = 3). (c) The expression of CD39 and CD73 in in vitro-expanded ILCPs after overnight co-culture with TCC-Sup cells was assessed by flow cytometry. Untreated ILCPs (red bar) were used as controls (CTRL) (n = 3). (d) The expression of adenosine receptors A2A, A2B, and A3 was analyzed by qPCR in ex vivo- and in in vitro-expanded ILCPs (n = 3).
-
Figure 6—figure supplement 1—source data 1
Raw data of panels b–d.
- https://cdn.elifesciences.org/articles/58838/elife-58838-fig6-figsupp1-data1-v2.xlsx
Author response image 1

Ex vivo and in vitro-expanded ILCPs were plated at 100cell/10μL density in RPMI-8%HS with 100U/mL of IL-2 and stimulated for 48h with 20ng/mL of IL-1β and IL-23.
The cell-free supernatant was collected and analyzed for its cytokine content with the LEGENDplex technology (Biolegend) (n=3).
Author response image 2
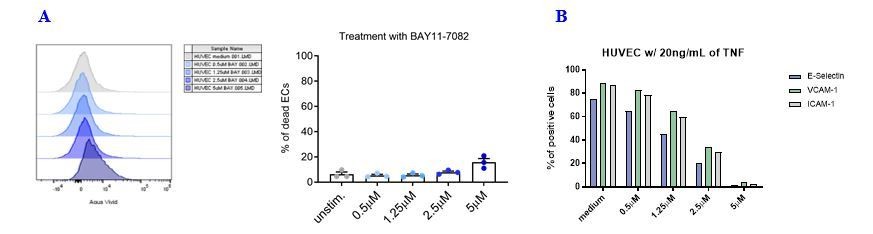
Effects of the NF-kB inhibitor BAY11-7082 on HUVEC cell viability and adhesion molecule expression.
(A) HUVEC cell monolayers were treated during 1 h with different concentrations of the NF-κB inhibitor BAY11-7082 in complete EGM, or left untreated. First, the viability of ECs following treatment with NF-κB inhibitor was assessed by flow cytometry with LIVE/DEAD staining. (B) Following NF-κB inhibition, EC monolayers were treated with 20 ng/mL of TNF during 3 h. Then, ECs were harvested and analyzed for cell-surface adhesion molecule expression by flow cytometry. The graph shows the induction of the indicated adhesion molecules on the endothelial cell surface.
Tables
Key resources table
| Reagent type (species) or resource | Designation | Source or reference | Identifiers | Additional information |
|---|---|---|---|---|
| Cell line (Homo sapiens) | HUVEC (normal, adult, single donor) | Lonza | Cat# LZ-CC-2517 | Primary cell line |
| Cell line (Homo sapiens) | HDBEC (normal, adult, single donor) | Promocell. | Cat# C-12225 | Primary cell line |
| Cell line (Homo sapiens) | BU68.08 | This paper | Primary cell line generated in L. Derré Lab from TaG2 stage cancer patient | |
| Cell line (Homo sapiens) | TCC-Sup | RRID:CVCL_1738 | Primary cell line Gift of G.N- Thalmann, Inselspital, Bern, Switzerland | |
| Cell line (Homo sapiens) | SW1116 | ATCC | RRID:CVCL_0544 | |
| Biological sample (Homo sapiens) | Peripheral blood (adult, healthy donors) | Interregional Blood Transfusion SRC (Route de la Corniche 2, 1066 Epalinges) | 9 mL Li Heparin tubes | |
| Antibody | Alexa 488 anti-human CXCR3 (mouse monoclonal) | Biolegend | RRID:AB_10962442 | FACS/FC (1:50) |
| Antibody | FITC anti-human CD3 (mouse monoclonal) | Biolegend | RRID:AB_2562046 | FACS/FC (1:100) |
| Antibody | FITC anti-human CD4 (mouse monoclonal) | Biolegend | RRID:AB_2562052 | FACS/FC (1:100) |
| Antibody | FITC anti-human CD8 (mouse monoclonal) | Biolegend | RRID:AB_1877178 | FACS/FC (1:100) |
| Antibody | FITC anti-human CD14 (mouse monoclonal) | Biolegend | RRID:AB_2571929 | FACS/FC (1:100) |
| Antibody | FITC anti-human CD15 (mouse monoclonal) | Biolegend | RRID: AB_314196 | FACS/FC (1:100) |
| Antibody | FITC anti-human CD16 (mouse monoclonal) | Biolegend | RRID:AB_314206 | FACS/FC (1:100) |
| Antibody | FITC anti-human CD19 (mouse monoclonal) | Biolegend | RRID:AB_2750099 | FACS/FC (1:100) |
| Antibody | FITC anti-human CD20 (mouse monoclonal) | Biolegend | RRID:AB_314252 | FACS/FC (1:100) |
| Antibody | FITC anti-human CD31 (mouse monoclonal) | Biolegend | RRID:AB_314330 | FC (1:100) |
| Antibody | FITC anti-human CD33 (mouse monoclonal) | Biolegend | RRID:AB_314344 | FACS/FC (1:25) |
| Antibody | FITC anti-human CD34 (mouse monoclonal) | Biolegend | RRID:AB_1732005 | FACS/FC (1:50) |
| Antibody | FITC anti-human CD94 (mouse monoclonal) | Miltenyi | RRID:AB_2659623 | FACS/FC (1:25) |
| Antibody | FITC anti-human CD203c (mouse monoclonal) | Biolegend | RRID:AB_11218991 | FACS/FC (1:100) |
| Antibody | FITC anti-human FεcRI (mouse monoclonal) | Biolegend | RRID:AB_1227653 | FACS/FC (1:50) |
| Antibody | PE anti-human BAFF (mouse monoclonal) | Biolegend | RRID:AB_830752 | FC (1:50) |
| Antibody | PE anti-human CD4 (mouse monoclonal) | Biolegend | RRID:AB_2562053 | FACS/FC (1:50) |
| Antibody | PE anti-human CD62E (mouse monoclonal) | Biolegend | RRID:AB_536008 | FC (1:100) |
| Antibody | PE anti-human CRTH2 (mouse monoclonal) | Biolegend | RRID:AB_10900060 | FACS/FC (1:100) |
| Antibody | PE anti-human IDO-1 (mouse monoclonal) | Invitrogen | RRID:AB_2572712 | FC (1:50) Intracellular |
| Antibody | PE anti-human RANK (mouse monoclonal) | R and D | RRID:AB_10643566 | FC (1:100) |
| Antibody | PE anti-human RANKL (mouse monoclonal) | Biolegend | RRID:AB_2256265 | FC (1:50) |
| Antibody | PE anti-human RORγt (mouse monoclonal) | BD | RRID:AB_2686896 | FC (1:25) Intracellular |
| Antibody | PE-CF594 anti-human CD14 (mouse monoclonal) | BD | RRID:AB_11153663 | FC (1:400) |
| Antibody | PE-CF594 anti-human T-bet (mouse monoclonal) | BD | RRID:AB_2737621 | FC (1:25) Intracellular |
| Antibody | PE-Dazzle anti-human CD39 (mouse monoclonal) | Biolegend | RRID:AB_2564318 | FC (1:200) |
| Antibody | PerCP-Cy5.5 anti-human CCR4 (mouse monoclonal) | Biolegend | RRID:AB_2562391 | FACS/FC (1:100) |
| Antibody | PerCP-Cy5.5 anti-human CD28 | Biolegend | RRID:AB_2073718 | FC (1:100) |
| Antibody | PerCP-Cy5.5 anti-human NKp44 (mouse monoclonal) | Biolegend | RRID:AB_2616752 | FC (1:25) |
| Antibody | PE-Cy5 anti-human CD106 (mouse monoclonal) | Biolegend | RRID:AB_2214227 | FC (1:100) |
| Antibody | PE-Cy7 anti- human CCR6 (mouse monoclonal) | Biolegend | RRID:AB_10916518 | FACS/FC (1:100) |
| Antibody | PE-Cy7 anti-human CD4 (mouse monoclonal) | BC | Cat # 737660 Clone 7975048 | FC (1:400) |
| Antibody | PE-Cy7 anti-human CD62E (mouse monoclonal) | Biolegend | RRID:AB_2800891 | FC (1:50) |
| Antibody | PE-Cy7 anti-human NKp46 | BD | RRID:AB_10894195 | FC (1:50) |
| Antibody | APC anti-human CD3 (mouse monoclonal) | BC | RRID:AB_130788 | FC (1:100) |
| Antibody | APC anti-human CD30L (mouse monoclonal) | R and D | RRID:AB_416825 | FC (1:100) |
| Antibody | APC anti-human c-Kit (mouse monoclonal) | BD | RRID:AB_398461 | FACS/FC (1:50) |
| Antibody | APC anti-human GATA3 (mouse monoclonal) | Biolegend | RRID:AB_2562725 | FC (1:50) Intracellular |
| Antibody | Alexa Fluor 700 anti-human CD4 (mouse monoclonal) | Biolegend | RRID:AB_493743 | FACS/FC (1:400) |
| Antibody | Alexa Fluor 700 anti-human CD16 (mouse monoclonal) | Biolegend | RRID:AB_2278418 | FC (1:100) |
| Antibody | Alexa Fluor 700 anti-human CD45RA (mouse monoclonal) | BD | RRID:AB_1727496 | FACS/FC (1:100) |
| Antibody | APC-Cy7 anti-human CXCR5 (mouse monoclonal) | Biolegend | RRID:AB_2562593 | FC (1:100) |
| Antibody | APC-H7 anti-human CD19 (mouse monoclonal) | BD | RRID:AB_1645728 | FC (1:100) |
| Antibody | APC/Fire750 anti-human CD45RO (mouse monoclonal) | Biolegend | RRID:AB_2616717 | FACS/FC (1:100) |
| Antibody | eFluor450 anti-human CD73 (mouse monoclonal) | eBioscience | RRID:AB_11041811 | FC (1:200) |
| Antibody | Pacific Blue anti-human CD54 (mouse monoclonal) | Biolegend | RRID:AB_10900234 | FC (1:100) |
| Antibody | BV421 anti-human CXCR5 (mouse monoclonal) | Biolegend | RRID:AB_2562302 | FACS/ FC (1:100) |
| Antibody | BV421 anti-human CD127 (mouse monoclonal) | Biolegend | RRID:AB_10960140 | FACS/FC (1:100) |
| Antibody | BV421 anti-human NRP1 (mouse monoclonal) | Biolegend | RRID:AB_2562361 | FC (1:100) |
| Antibody | BV650 anti-human CCR6 (mouse monoclonal) | Biolegend | RRID:AB_2562235 | FC (1:100) |
| Antibody | BV650 anti-human CD62L (mouse monoclonal) | Biolegend | RRID:AB_2561461 | FC (1:100) |
| Antibody | BV650 anti-human CD69 (mouse monoclonal) | Biolegend | RRID:AB_2563158 | FC (1:100) |
| Antibody | BV711 anti-human CD40L (mouse monoclonal) | Biolegend | RRID:AB_2563845 | FC (1:100) |
| Antibody | Purified anti-LTα/β | Abcam | RRID:AB_2050404 | FC (1:25) |
| Antibody | Alexa 647 goat anti-mouse IgG (H+L) secondary antibody | Invitrogen | RRID:AB_2535804 | FC (1:800) |
| Antibody | Anti-human CD31 (mouse monoclonal) | Cell Marque | RRID:AB_629040 | IH (1:20) |
| Antibody | Anti-human CD3 (mouse monoclonal) | Ventana | Clone 2GV6 | IH (1:20) |
| Antibody | Anti-human RORγt (mouse monoclonal) | Millipore | RRID:AB_11205416 | IH (1:20) |
| Peptide, recombinant protein | rhIL-1β | PeproTech | Cat# 200-01B | |
| Peptide, recombinant protein | rhIL-2 | PeproTech | Cat# 200–02 | |
| Peptide, recombinant protein | rhIL-12 | PeproTech | Cat# 200–12 | |
| Peptide, recombinant protein | rhIL-21 | PeproTech | Cat# 200–21 | |
| Peptide, recombinant protein | rhTNF | PeproTech | Cat# 300-01A | |
| Peptide, recombinant protein | hrTNFR1:Fc | This paper | Provided by PS | |
| Peptide, recombinant protein | hrTNFR2:Fc | This paper | Provided by PS | |
| Peptide, recombinant protein | hrRANK:Fc | Adipogen | Cat# AG-40B-0018-C050 | |
| Chemical compound, drug | BAY 11–7082 | Adipogen | Cat# AG-CR1-0013-M010 | |
| Chemical compound, drug | 2-Chloroadenosine | Sigma | Cat# C5134 | |
| Sequenced-based reagent | hA2A_F | NCBI Nucleotide | PCR primers | CTCCGGTACAATGGCTTGGT |
| Sequenced-based reagent | hA2A_R | NCBI Nucleotide | PCR primers | TGGTTCTTGCCCTCCTTTGG |
| Sequenced-based reagent | hA2B_F | NCBI Nucleotide | PCR primers | ATGCCAACAGCTTGAATGGAT |
| Sequenced-based reagent | hA2B_R | NCBI Nucleotide | PCR primers | GAGGTCACCTTCCTGGCAAC |
| Sequenced-based reagent | hA3_F | NCBI Nucleotide | PCR primers | TTGACCAAAAGGAGGAGAAGT |
| Sequenced-based reagent | hA3_R | NCBI Nucleotide | PCR primers | AGTCACATCTGTTCAGTAGGAG |
| Sequenced-based reagent | hIL-6_F | NCBI Nucleotide | PCR primers | GGATTCAATGAGGAGACTTGC |
| Sequenced-based reagent | hIL-6_R | NCBI Nucleotide | PCR primers | GTTGGGTCAGGGGTGGTTAT |
| Sequenced-based reagent | hIL-8_F | NCBI Nucleotide | PCR primers | AGCTCTGTGTGAAGGTGCAG |
| Sequenced-based reagent | hIL-8_R | NCBI Nucleotide | PCR primers | TGGGGTGGAAAGGTTTGGAG |
| Sequenced-based reagent | hGM-CSF_F | NCBI Nucleotide | PCR primers | GCCTCAGCTACGTTCAAGG |
| Sequenced-based reagent | hGM-CSF_R | NCBI Nucleotide | PCR primers | CATAGGAGTTAGGTCCCCACA |
| Sequenced-based reagent | hIFN-γ_F | NCBI Nucleotide | PCR primers | TGCCTTCCCTGTTTTAGCTGC |
| Sequenced-based reagent | hIFN-γ_R | NCBI Nucleotide | PCR primers | TCGGTAACTGACTTGAATGTC |
| Sequenced-based reagent | hTNF_F | NCBI Nucleotide | PCR primers | GAGGCCAAGCCCTGGTATG |
| Sequenced-based reagent | hTNF_R | NCBI Nucleotide | PCR primers | CGGGCCGATTGATCTCAGC |
| Commercial assay or kit | LIVE/DEAD Fixable Aqua Dead Cell Stain Kit | Thermo Fisher | Cat# L34957 | FC (1:500) |
| Commercial assay or kit | Foxp3 / Transcription Factor Staining Buffer Set | eBioscience | Cat# 00-5523-00 | |
| Commercial assay or kit | KAPA SYBR FAST qPCR KITs | KAPA Biosystems | Cat# 4385612 | |
| Software, algorithm | Eco Real-Time PCR System Software | Illumina | Cat# EC-101–1001 | |
| Software, algorithm | EcoStudy Software | Illumina | EcoStudy 5.0.4883 | |
| Software, algorithm | FlowJo | TreeStar | RRID:SCR_008520 | |
| Software, algorithm | Prism | GraphPad | RRID:SCR_002798 | |
| Other | CountBright Absolute Counting Beads | Thermo Fisher | Cat# C36950 | |
| Other | EGM Endothelial Growth Medium BulletKit | Lonza | Cat# LZ-CC-3124 |
Additional files
Download links
A two-part list of links to download the article, or parts of the article, in various formats.
Downloads (link to download the article as PDF)
Open citations (links to open the citations from this article in various online reference manager services)
Cite this article (links to download the citations from this article in formats compatible with various reference manager tools)
Human primed ILCPs support endothelial activation through NF-κB signaling
eLife 10:e58838.
https://doi.org/10.7554/eLife.58838


