Integrative analysis of large-scale loss-of-function screens identifies robust cancer-associated genetic interactions
- Breast Cancer Now Toby Robins Research Centre and Cancer Research UK Gene Function Laboratory, Institute of Cancer Research, United Kingdom
- School of Computer Science and Systems Biology Ireland, University College Dublin, Ireland
Figures
Figure 1
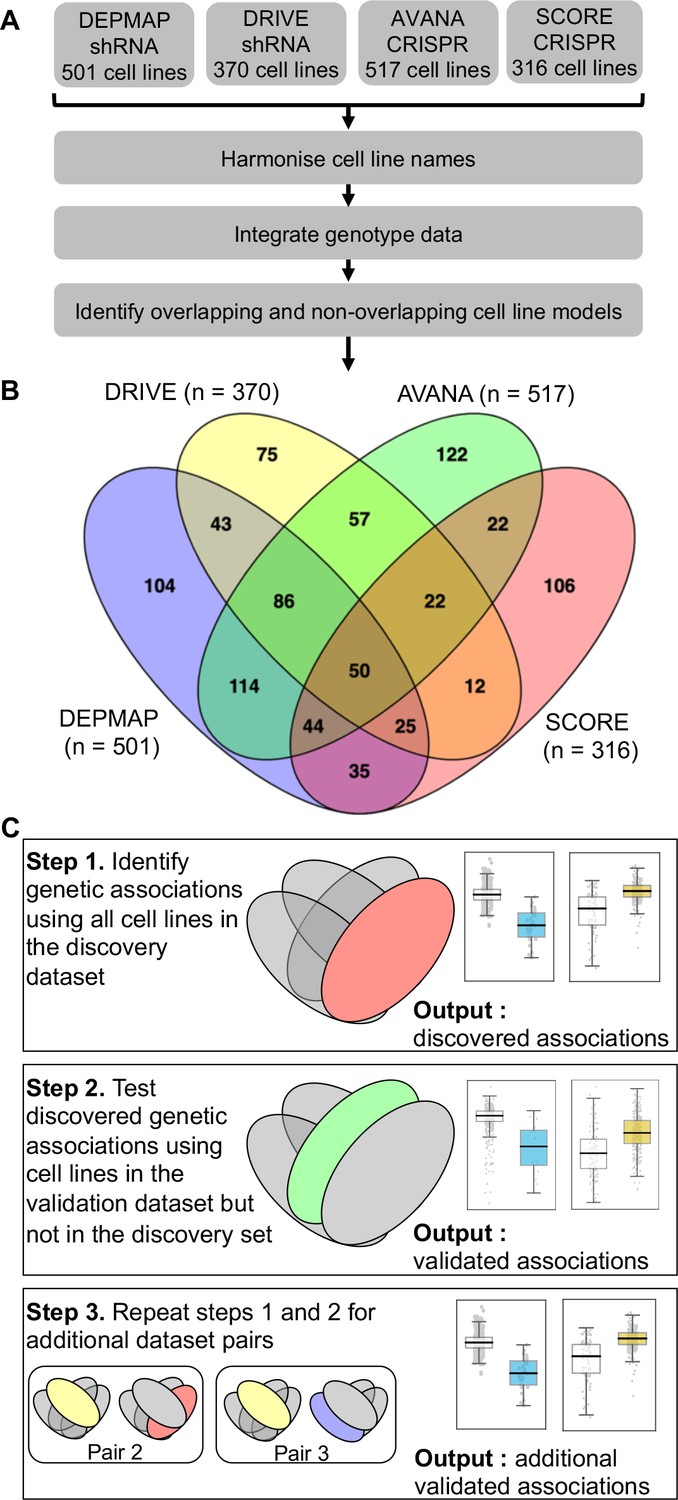
Identifying robust genetic interactions using partially overlapping loss-of-function screens.
(A) Workflow showing the integration of four different loss-of-function screen datasets. (B) Venn diagram showing the overlap of cell lines between the four datasets analysed in this study. (C) Workflow showing how robust genetic interactions are identified using discovery and validation sets.
Figure 2 with 1 supplement
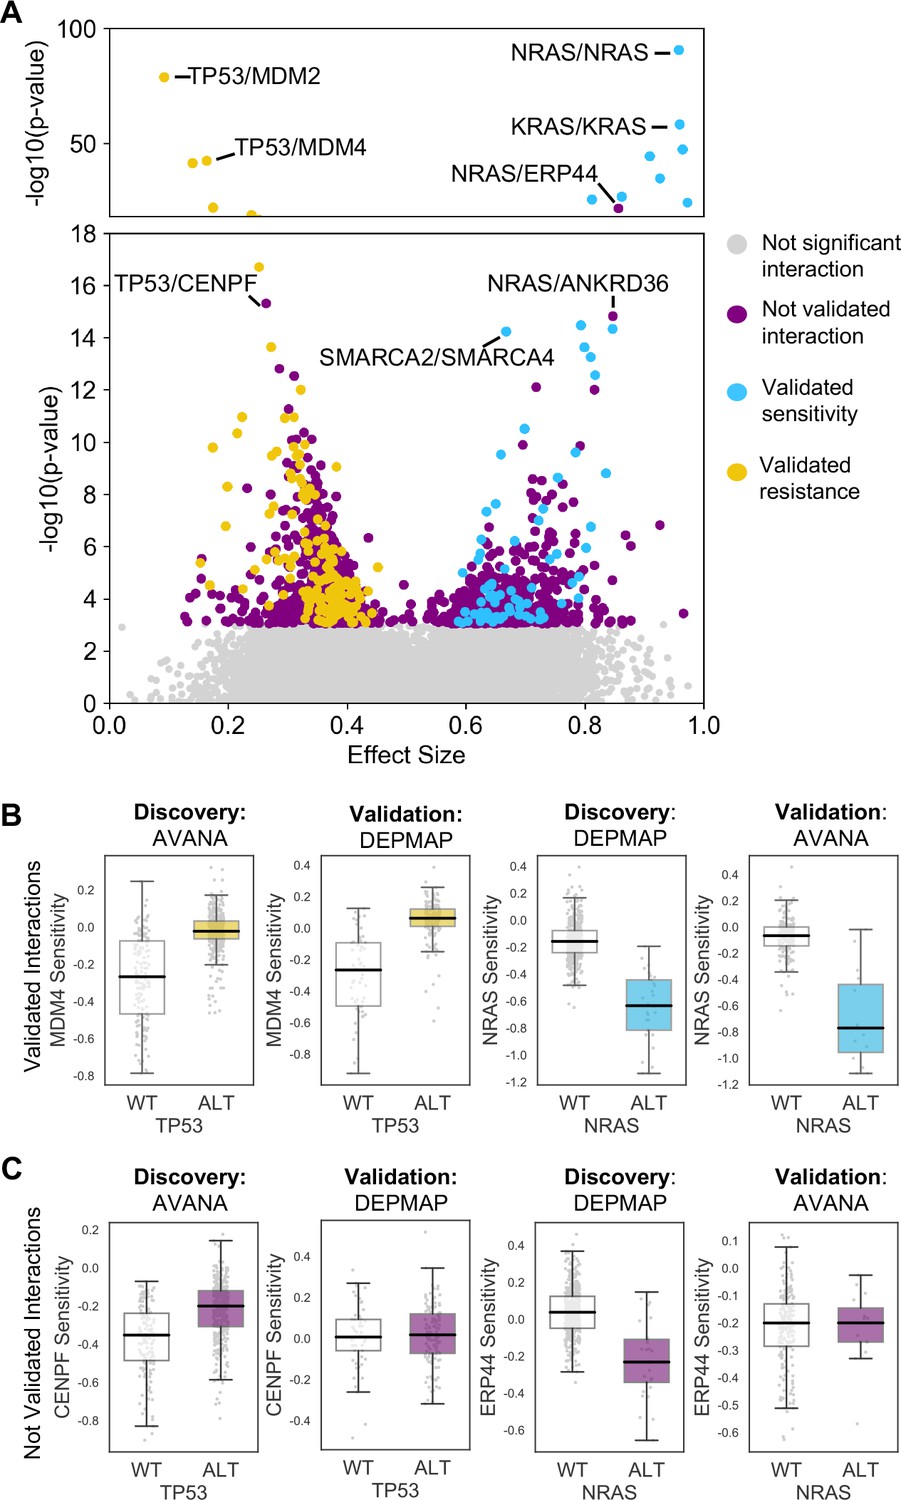
Discovered and validated genetic dependencies.
(A) Scatterplot showing the genetic dependencies identified across all datasets. Each individual point represents a gene pair, the x-axis shows the common language effect size, and the y-axis shows the -log10 p-value from the discovery dataset. Selected gene pairs are highlighted – the driver gene is listed first, followed by the associated dependency. Each gene pair may have been tested in multiple discovery studies, only the interaction with the most significant discovery p-value is shown. Scatterplots for individual studies are presented in Figure 2—figure supplement 1. (B) Tukey boxplots showing examples of robust genetic dependencies, including an increased resistance of TP53 mutant tumour cell lines to MDM4 inhibition and increased sensitivity of NRAS mutant tumour cell lines to NRAS inhibition. In each box plot the top and bottom of the box represents the third and first quartiles and the box band represents the median; whiskers extend to 1.5 times the interquartile distance from the box. WT = wild type, ALT = altered. Throughout blue is used to indicate increased sensitivity (synthetic lethality or oncogene addiction), yellow to indicate resistance to inhibition of the target gene. (C) Boxplots showing examples of genetic dependencies discovered but not validated, including an increased resistance of TP53 mutant cell lines to CENPF inhibition and increased sensitivity of NRAS mutant cell lines to ERP44 inhibition.
Figure 2—figure supplement 1
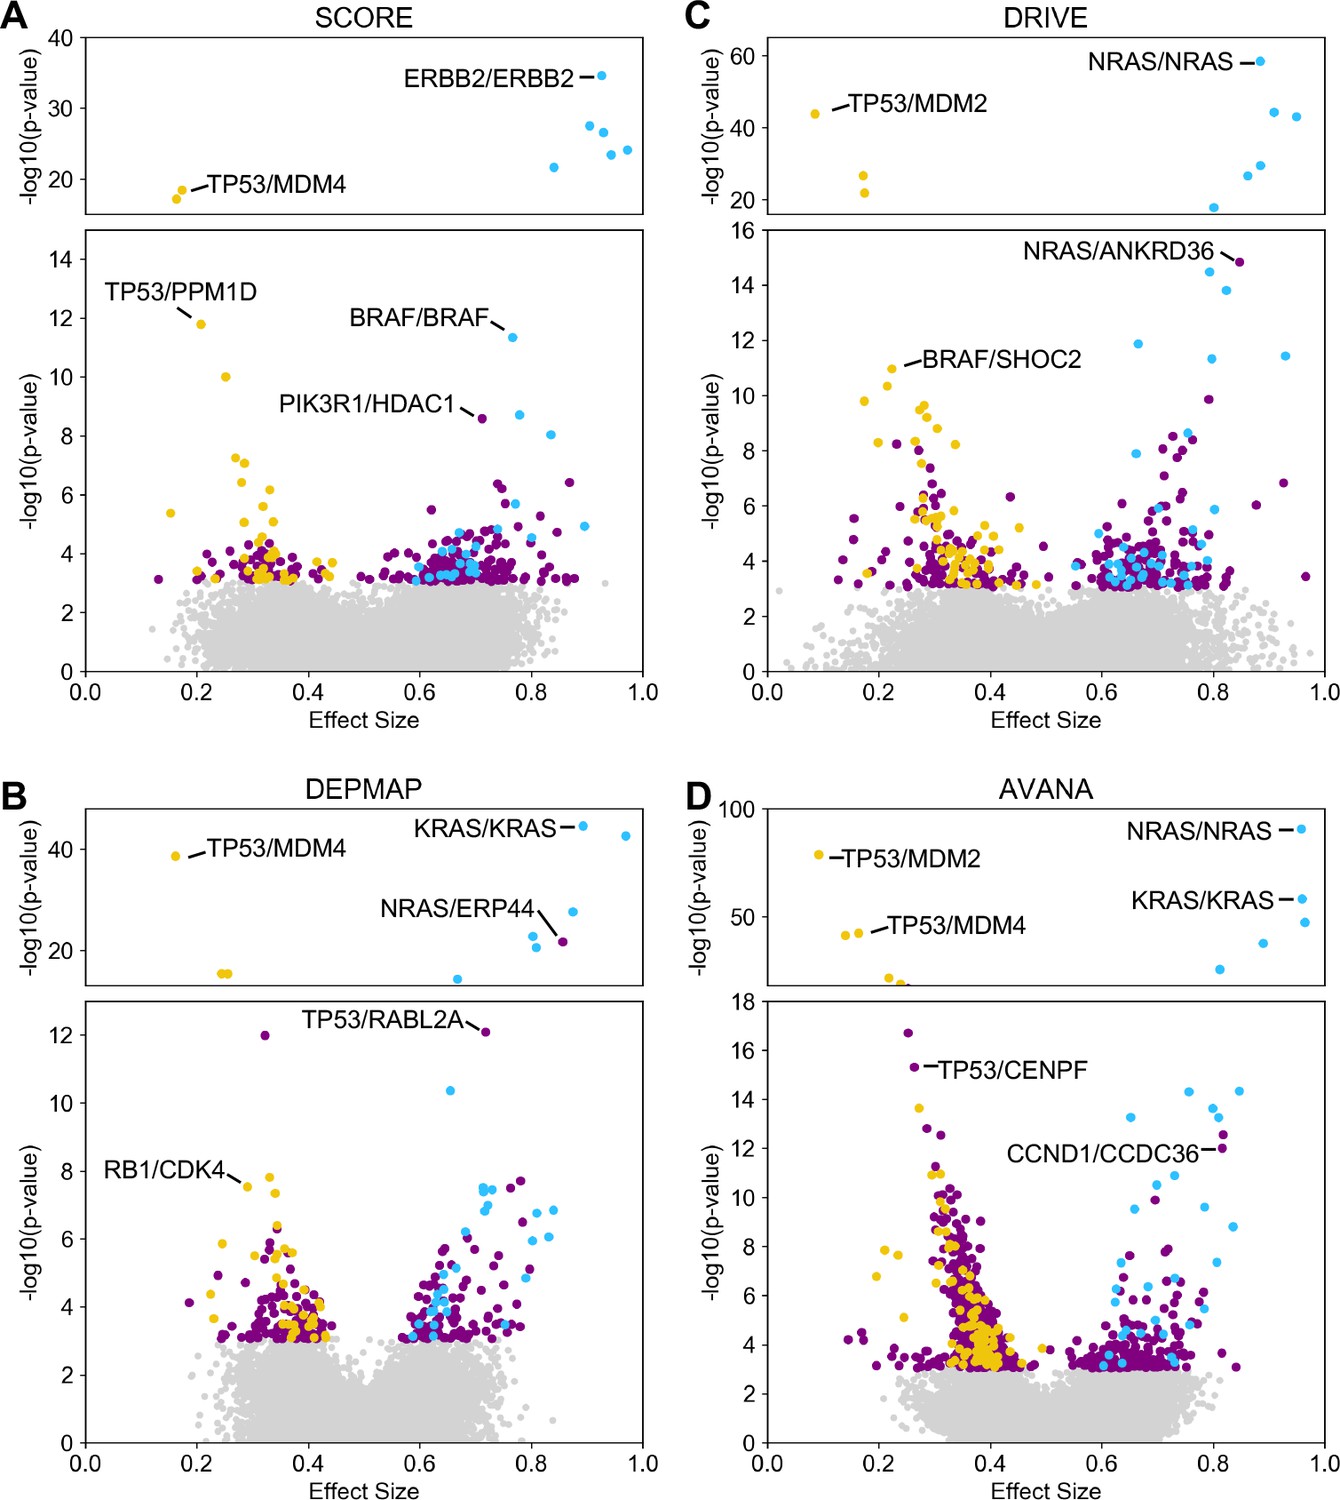
Discovered and validated genetic dependencies for individual datasets.
(A) Scatterplot showing the genetic dependencies identified in the SCORE dataset. Each individual point represents a gene pair, the x-axis shows the common language effect size, and the y-axis shows the -log10 p-value from the discovery dataset. (B) Scatterplot for the DEPMAP dataset. (C) Scatterplot for the DRIVE dataset. (D) Scatterplot for the AVANA dataset.
Figure 3 with 1 supplement
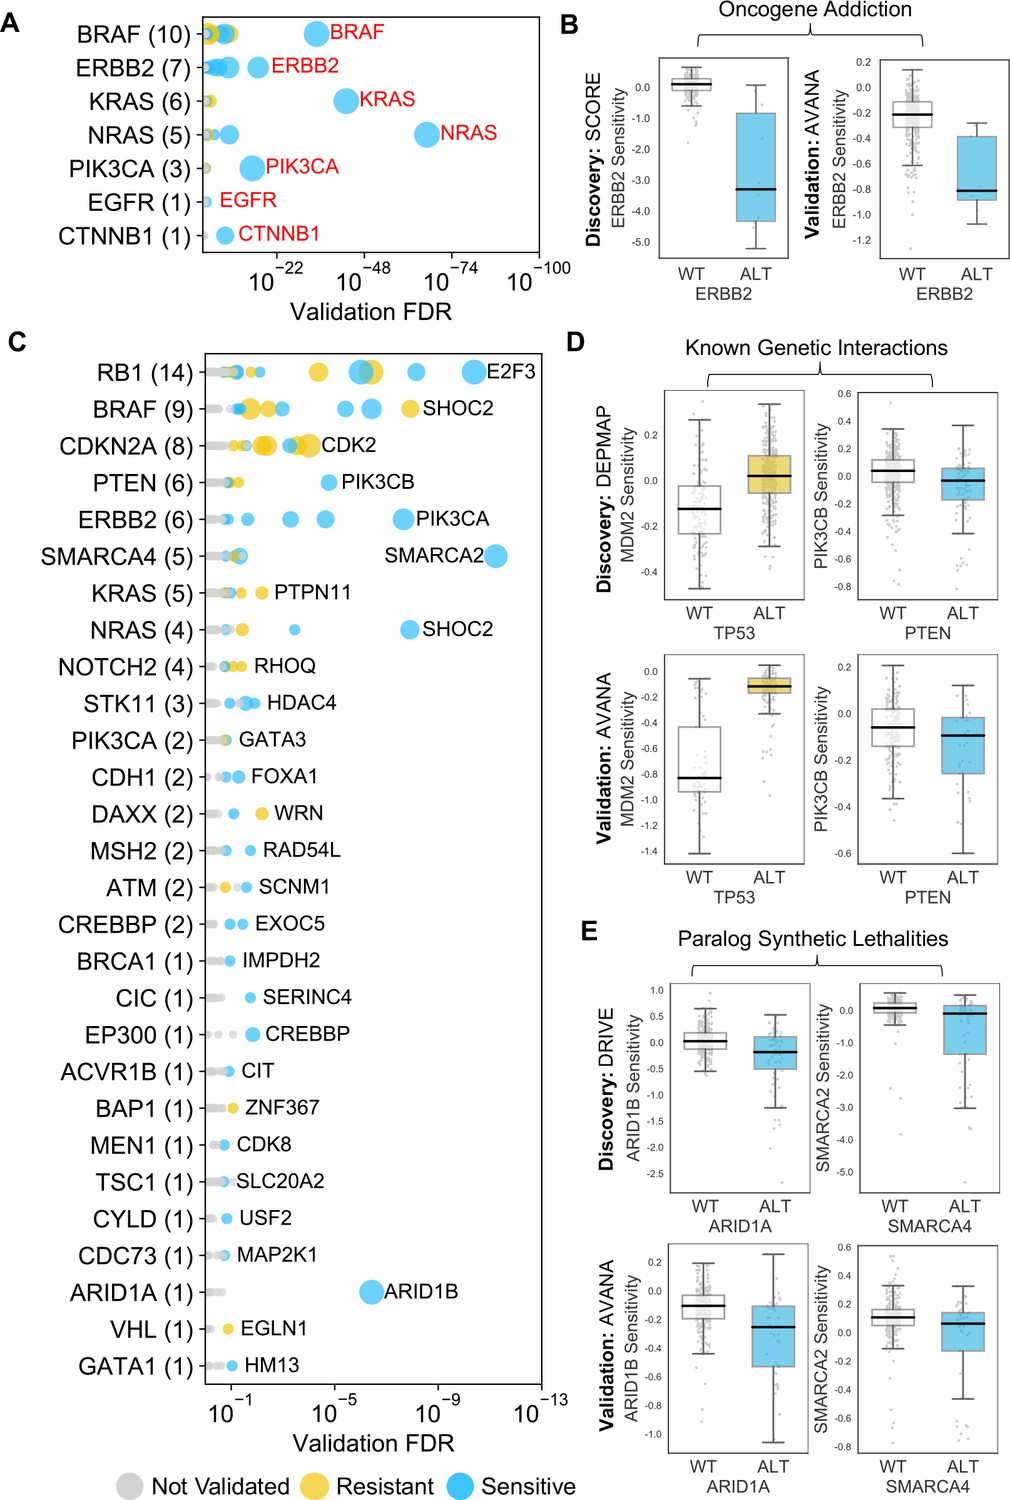
Identified robust genetic interactions.
(A) Dot plot showing the robust genetic dependencies identified for oncogenes. Each coloured circle indicates a robust genetic dependency, scaled according to the number of dataset pairs it was validated in. The most significant genetic dependency (lowest FDR in a validation set) for each driver gene is labelled. Oncogenes are sorted by the number of robust dependencies and the total number of robust genetic dependencies for each driver gene is shown in parentheses. (B) Example of a validated oncogene addiction – ERBB2 amplified cells are sensitive to ERBB2 inhibition. Left shows the discovery dataset (SCORE) and right shows the validation dataset (AVANA). (C) Dot plot showing the robust genetic interactions identified for all driver genes. Each coloured circle indicates a robust genetic interaction, scaled according to the number of dataset pairs it was validated in. The most significant genetic interaction (lowest FDR in a validation set) for each driver gene is labelled. Drivers are sorted by the number of robust interactions and the total number of robust genetic interactions for each driver gene is shown in parentheses. TP53 (132 robust genetic interactions) has been excluded for clarity, as have all self-self dependencies. (D) Examples of known genetic interactions identified from the integrated analysis, including an increased sensitivity of PTEN mutant tumour cell lines to PIK3CB inhibition and increased resistance of TP53 mutant tumour cell lines to MDM2 inhibition. Top row shows the data used to discover the interactions (DEPMAP dataset) while the bottom row shows the data used to validate the interactions (AVANA dataset with cell lines from DEPMAP excluded). (E) Synthetic lethal interactions involving paralog pairs. Top row shows the data used to discover the interactions (DRIVE dataset) while the bottom row shows the data used to validate the interactions (AVANA dataset with cell lines from DRIVE excluded).
Figure 3—figure supplement 1
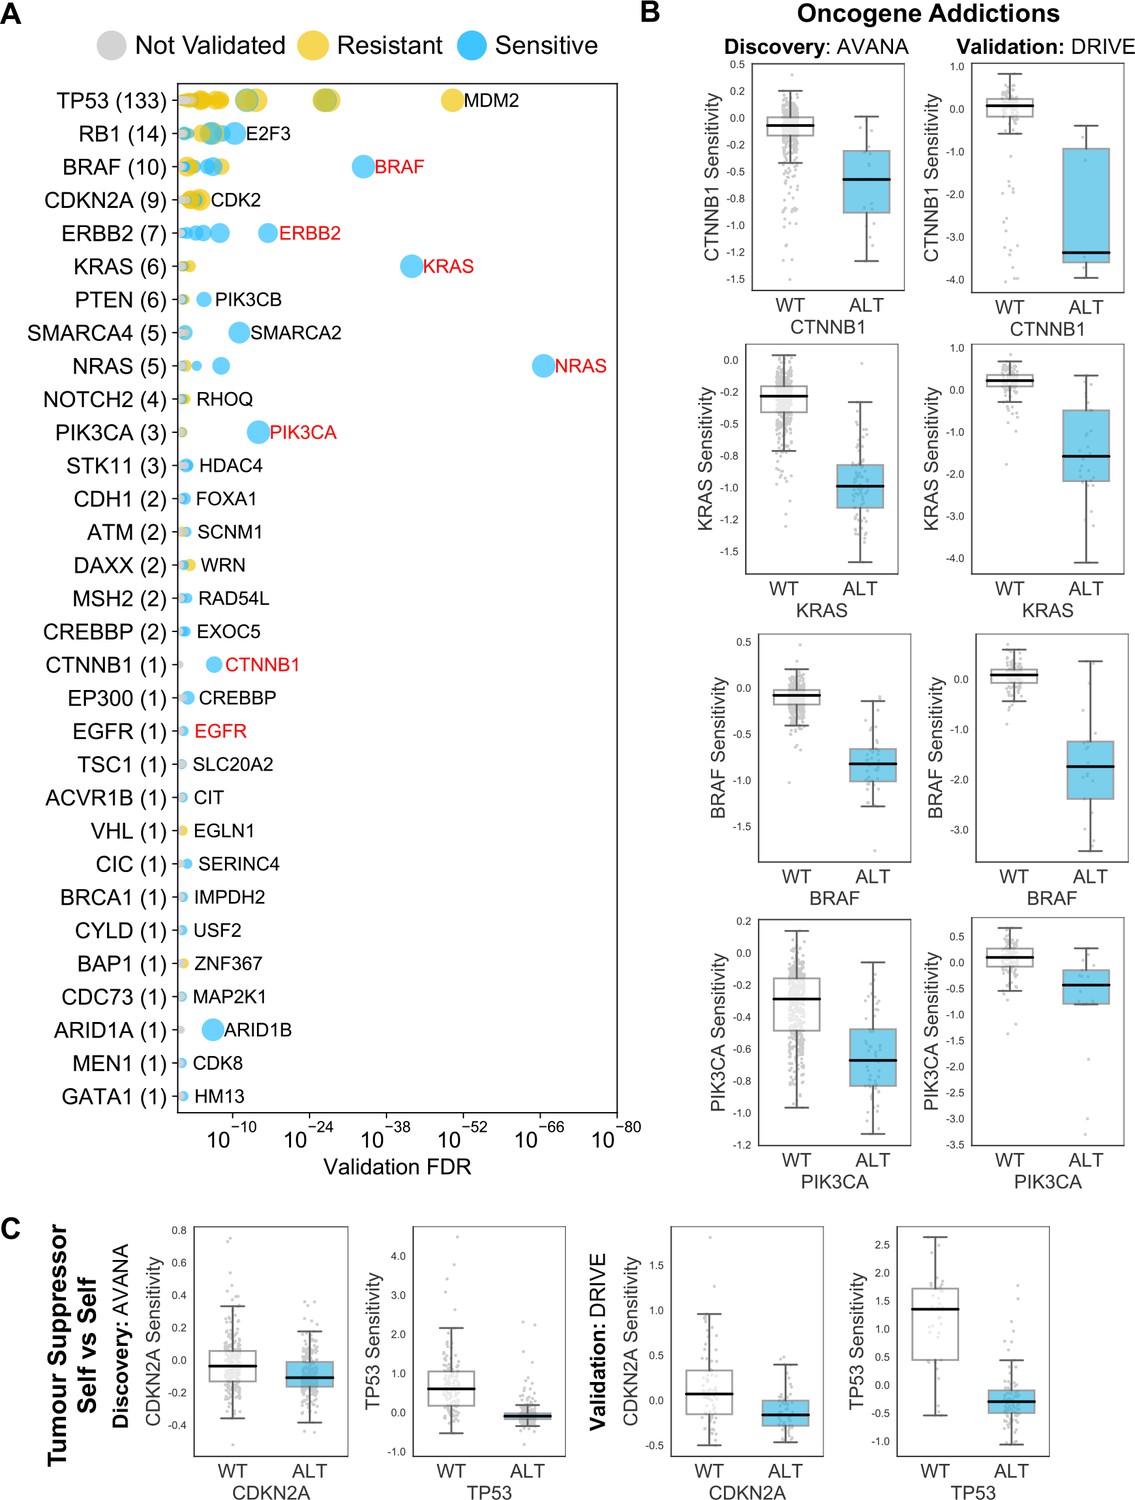
Reproducible genetic dependencies include oncogene addictions.
(A) Dot plot showing the reproducible genetic dependencies identified. Each coloured circle indicates a reproducible genetic dependency, scaled according to the number of dataset pairs it was validated in. The most significant genetic dependency (lowest FDR in a validation set) for each driver gene is labelled. Instances where the most significant dependency is a ‘self vs self’ dependency are highlighted in red. Drivers are sorted by the number of validated dependencies and the total number of reproduced genetic dependencies for each driver gene is shown in parentheses. (B) Boxplots showing oncogene addictions, where the alteration of an oncogene is associated with increased sensitivity to its inhibition. (C) Boxplots showing tumour suppressor genes whose inhibition provides a growth advantage to cells that have no genetic alteration of those genes.
Figure 4
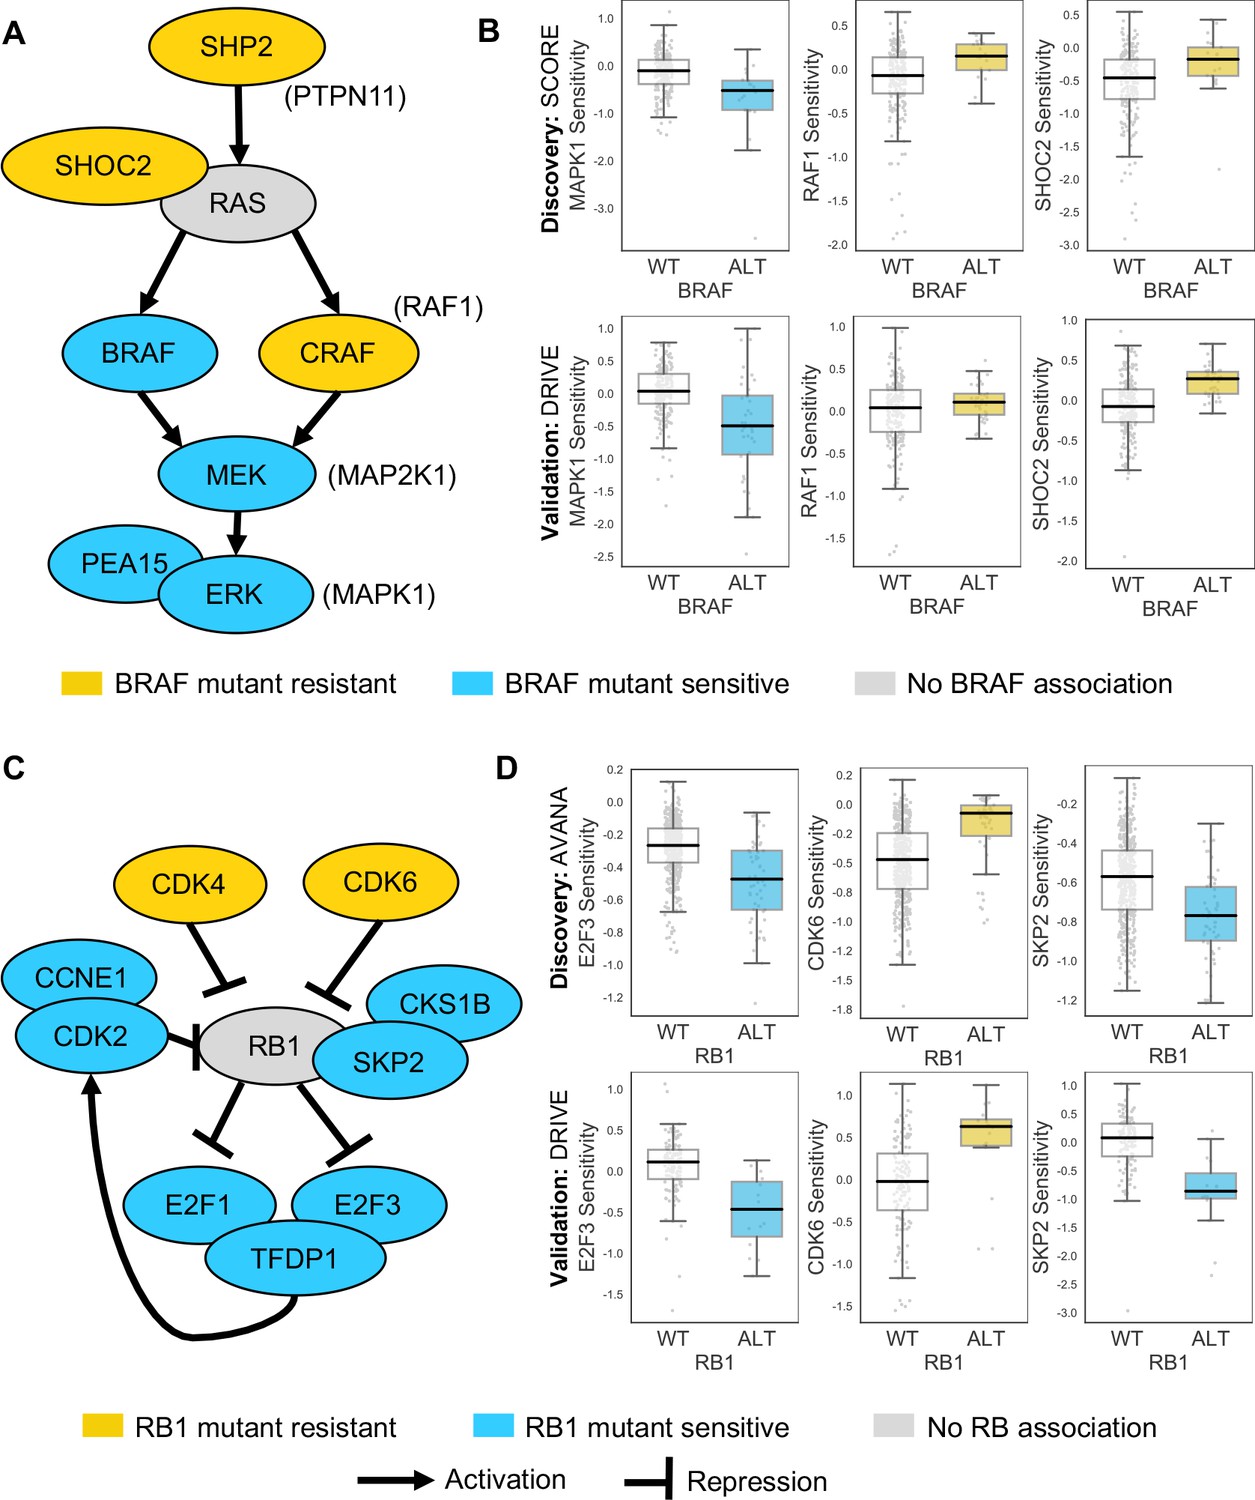
Robust genetic interactions involving RB1 and BRAF recapitulate pathway relationships.
(A) Simplified RAS/RAF/MEK/ERK pathway diagram. Protein names (e.g. MEK) are shown inside nodes, while associated gene names are shown adjacent (e.g. MAP2K1). Nodes are coloured according to their association with BRAF mutation - blue indicates increased sensitivity of BRAF mutant cell lines, yellow indicates increased resistance. (B) Boxplots showing selected genetic interactions associated with BRAF mutation. (C) Simplified Rb pathway diagram, highlighting robust genetic interactions involved in the Rb pathway. (D) Boxplots showing selected genetic interactions associated with RB1 alteration.
Figure 5 with 2 supplements
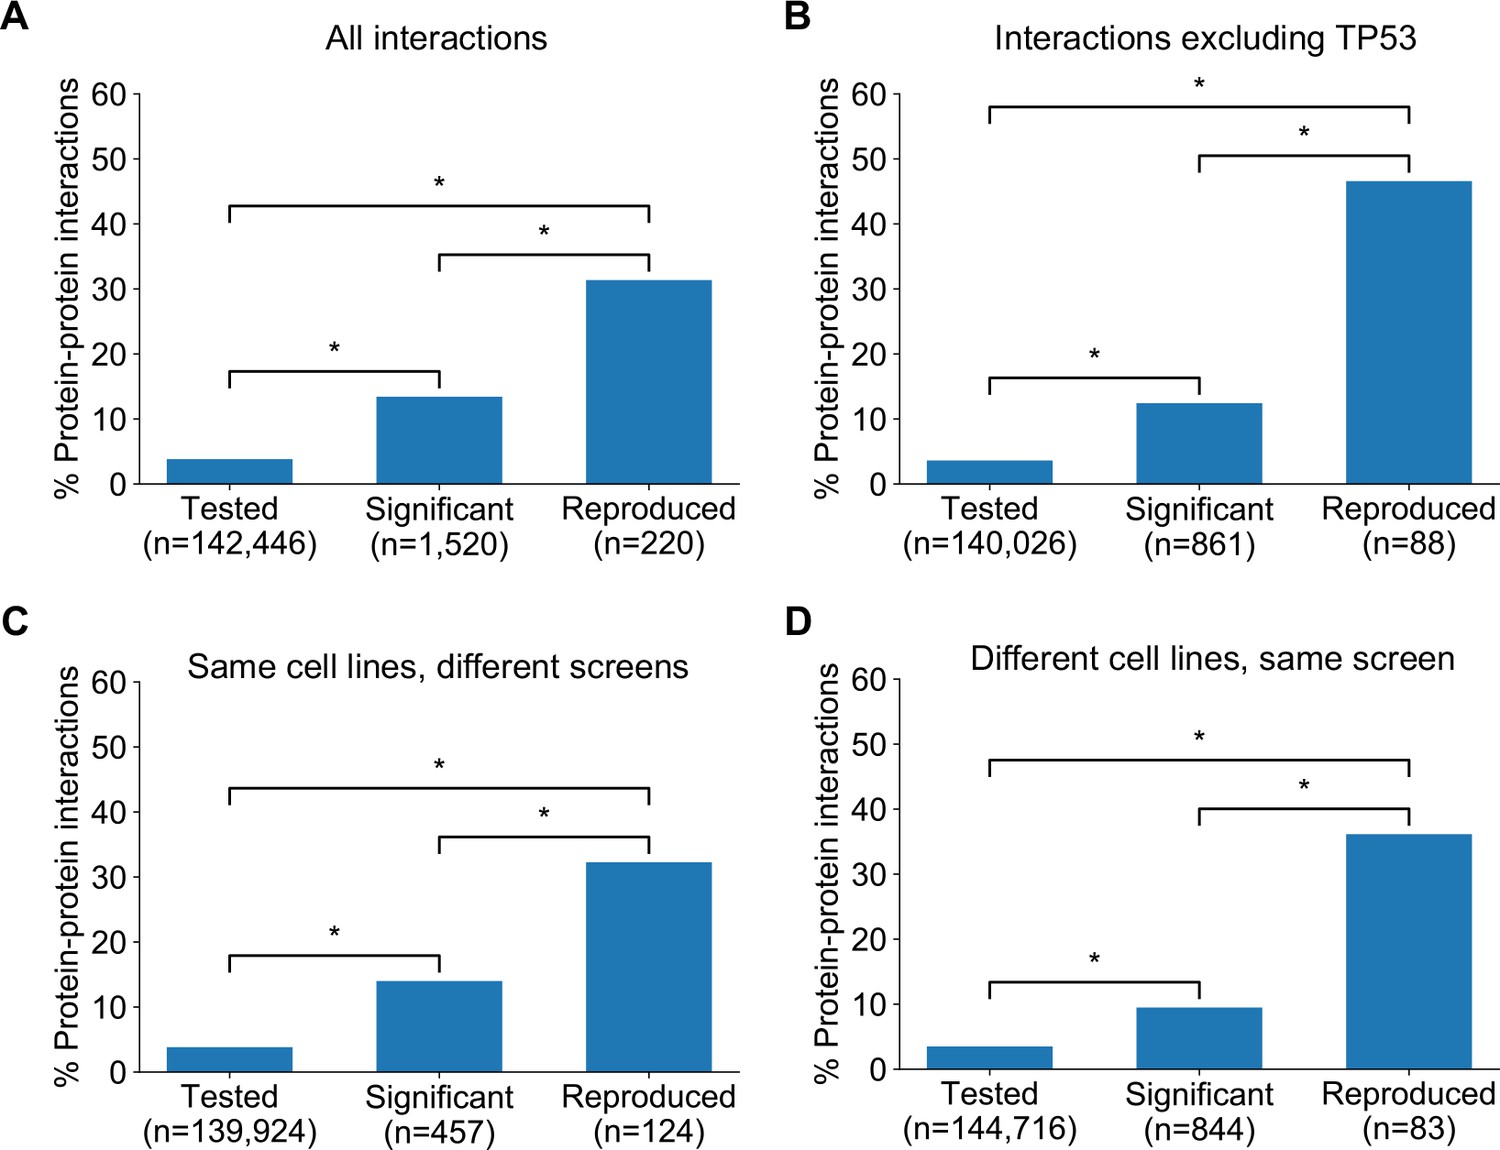
Robust genetic interactions are enriched in protein–protein interaction pairs.
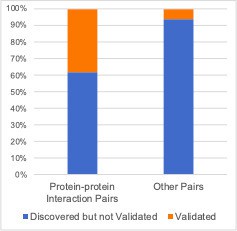
(A) Barchart showing the percentage of protein–protein interacting pairs observed among different groups of gene pairs. The groups represent all gene pairs tested, gene pairs found to be significantly interacting in at least one screen (FDR < 20%), and gene pairs found to reproducibly interact across multiple screens (i.e. a discovery and validation screen). Stars (*) indicate significant differences between groups, all significant at p<0.001 using Fisher’s Exact Test. Odds ratios and p-values are provided in Supplementary file 5. (B) As A but with interactions associated with TP53 removed. (C) As B but here the discovery and validation sets contain the same cell lines screened in different studies (e.g. ‘AVANA ∩ DEPMAP’ as discovery and ‘DEPMAP ∩ AVANA’ as validation). Consequently, reproducibility here means ‘technical reproducibility’ using different screening platforms. (D) Similar to B but here the discovery and validation sets contain single datasets partitioned into non-overlapping cell line sets (e.g. ‘AVANA \ DEPMAP’ as discovery and ‘AVANA ∩ DEPMAP’ as validation). Consequently, reproducibility here means ‘genetic robustness’ - the same association between gene pairs is observed across distinct genetic backgrounds.
Figure 5—figure supplement 1
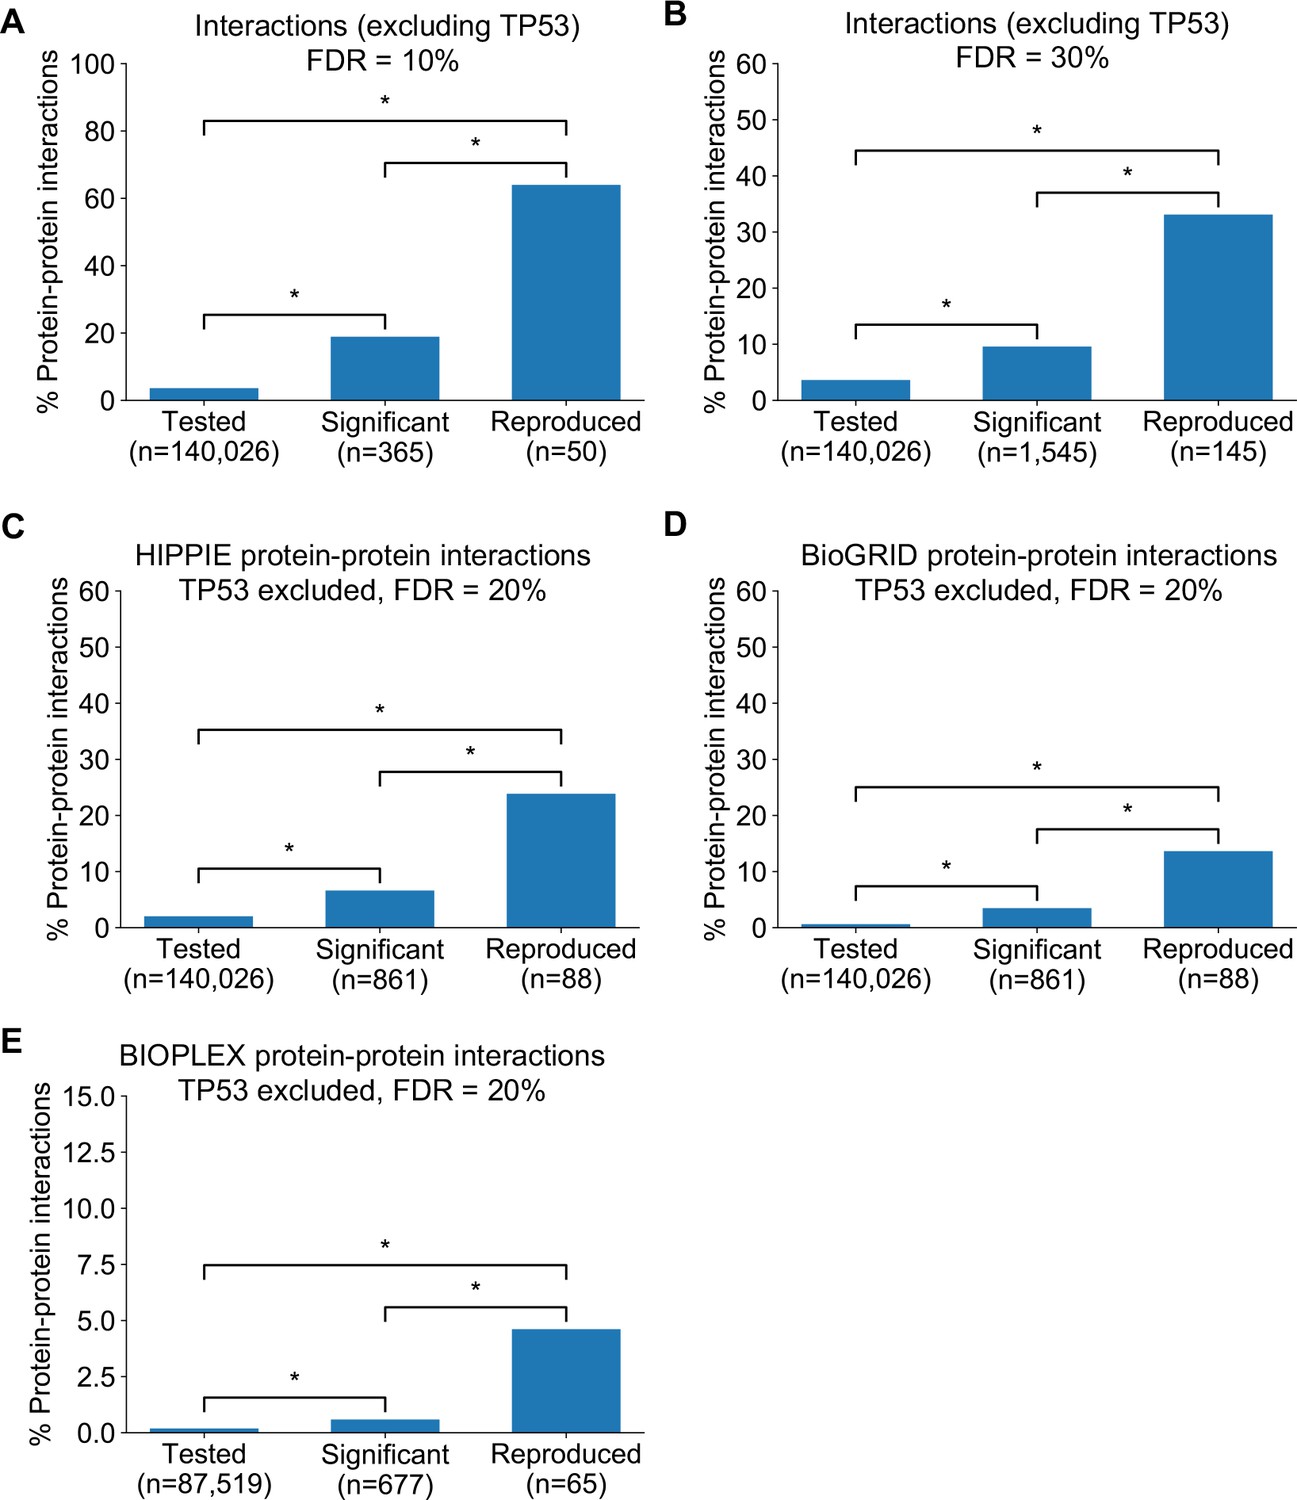
Robust genetic interactions are enriched in protein–protein interaction pairs at different thresholds and using different databases.
(A) Barchart showing the percentage of protein–protein interacting pairs observed among different groups of gene pairs. The groups represent all gene pairs tested, gene pairs found to be significantly interacting in at least one screen (FDR < 10%), and gene pairs found to reproducibly interact across multiple screens (i.e. a discovery and validation screen). Stars (*) indicate significant differences between groups, all significant at p<0.001 using Fisher’s Exact Test. Due to the high percentage of protein–protein interaction pairs among the reproducible hits at this FDR, the y-axis uses a different maximum value to all other charts. (B) Same as A but with interactions identified at an FDR of 30% (C) Similar to Figure 4B but here the protein–protein interaction pairs are obtained from the HIPPIE database (D) Similar to Figure 4B but here the protein–protein interaction pairs are obtained from the BioGRID database (E) Similar to Figure 4B but here the protein–protein interaction pairs are obtained from the systematically generated BioPlex 3.0 network (Huttlin et al., 2020). Only interactions from the HEK293T cell line are included and the genetic interactions analysed are restricted to those gene pairs that could conceivably be observed in the BioPlex dataset (i.e. between baits screened and preys detected in HEK293T).
Figure 5—figure supplement 2
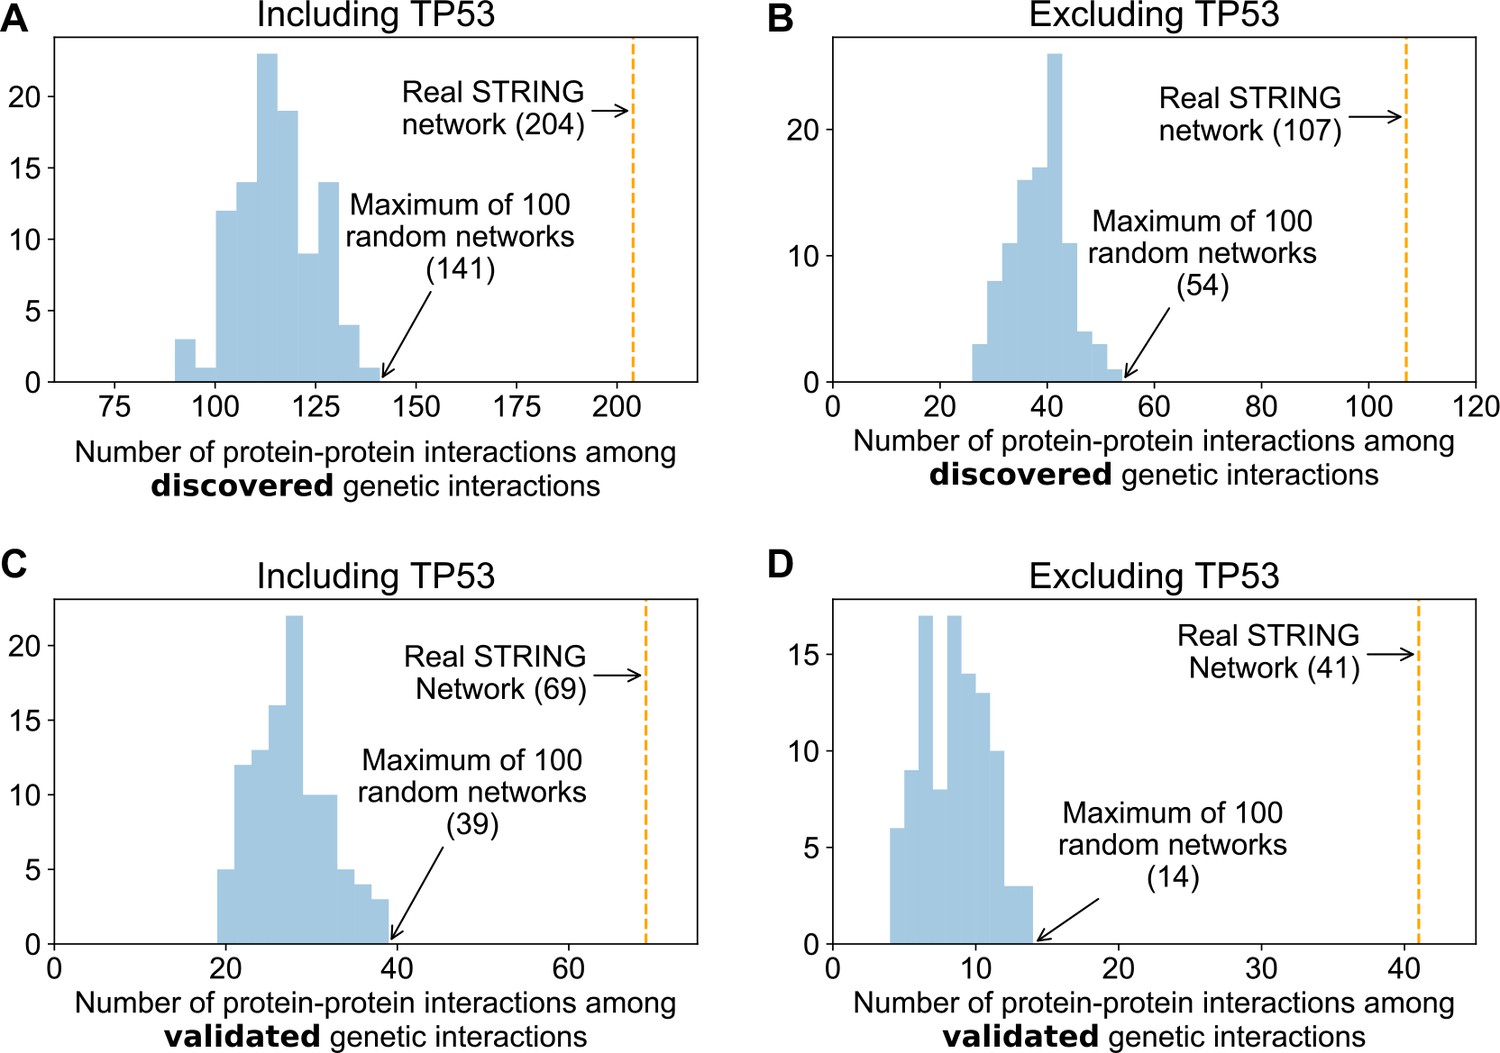
Genetic interactions are more enriched in real protein–protein interaction networks than randomised networks.
Histograms showing the overlap between 100 degree matched randomisations of the STRING medium confidence protein–protein interaction and discovered (A and B) and validated (C and D) genetic interactions. The observed overlap with the real STRING protein interaction are highlighted with the orange lines.
Figure 6
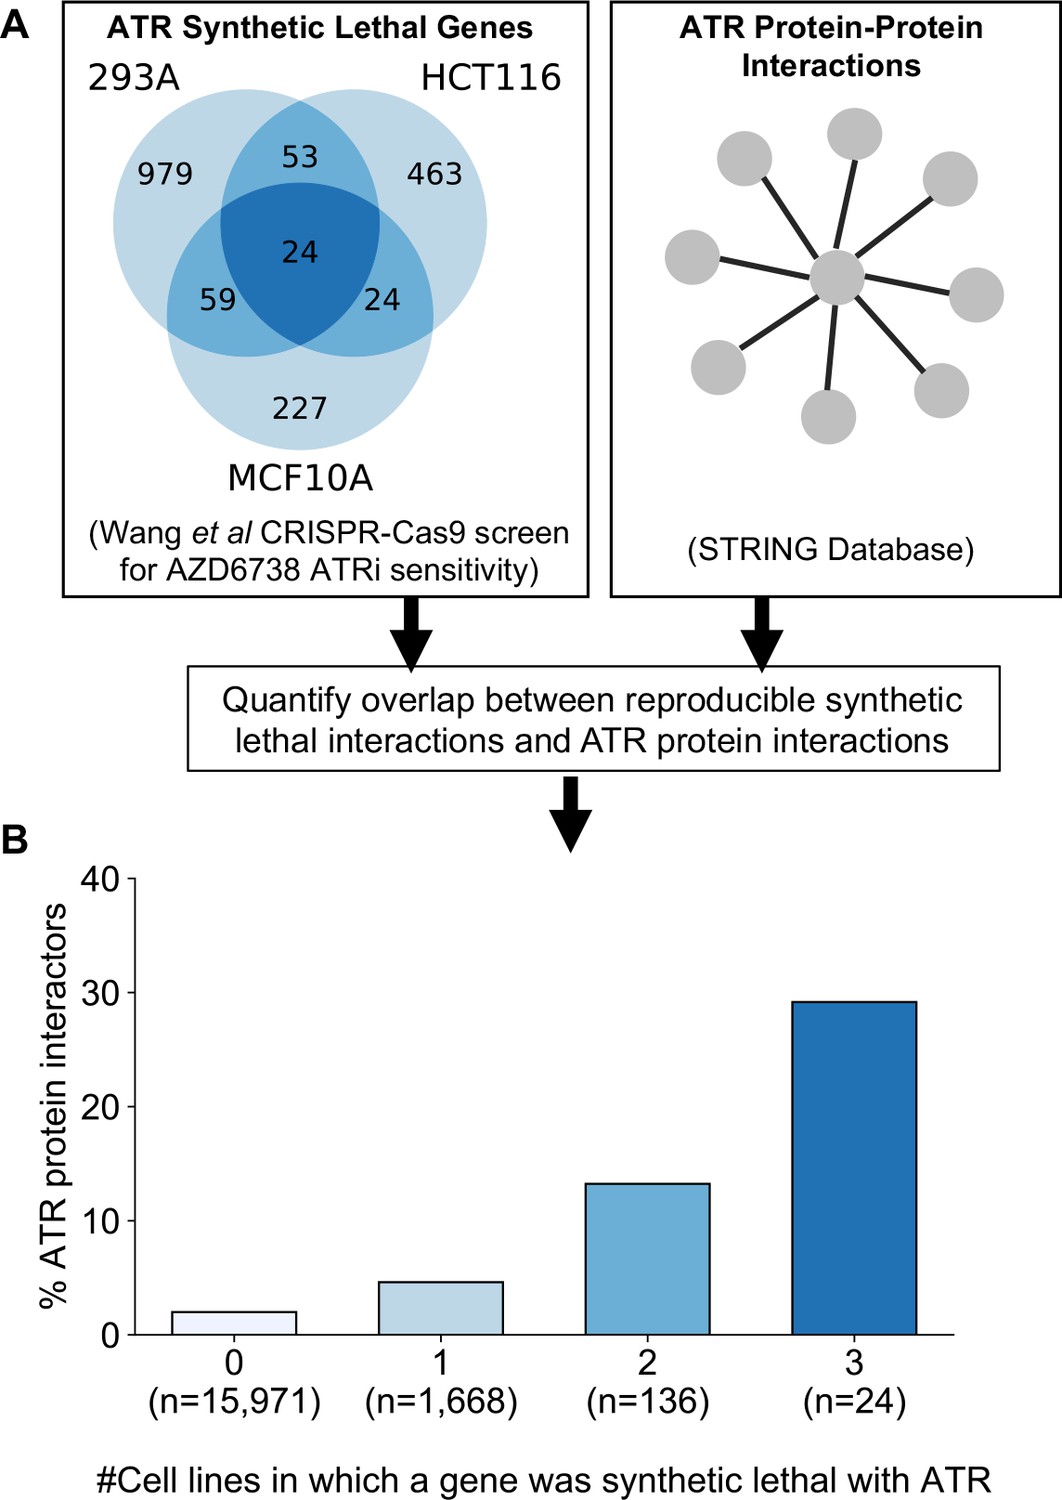
Reproducible ATR synthetic lethal interactions are enriched in ATR protein–protein interaction partners.
(A) Workflow - synthetic lethal interactions from CRISPR-Cas9 screens in three cell lines (Wang et al., 2019) were compared to identify reproducible synthetic lethal partners. These genes were then compared with known ATR protein–protein interaction partners from the STRING database. (B) Bar chart showing the percentage of ATR protein interaction partners observed in different groups of genes. Genes are grouped according to whether they were identified as an ATR synthetic lethal partner in 0, 1, 2, or 3 cell line screens. Comparisons between all pairs of groups are significant at p<0.001 (Fisher’s exact test) except for the comparison between genes that were hits in 2 and 3 cell lines (p=0.06).
Figure 7
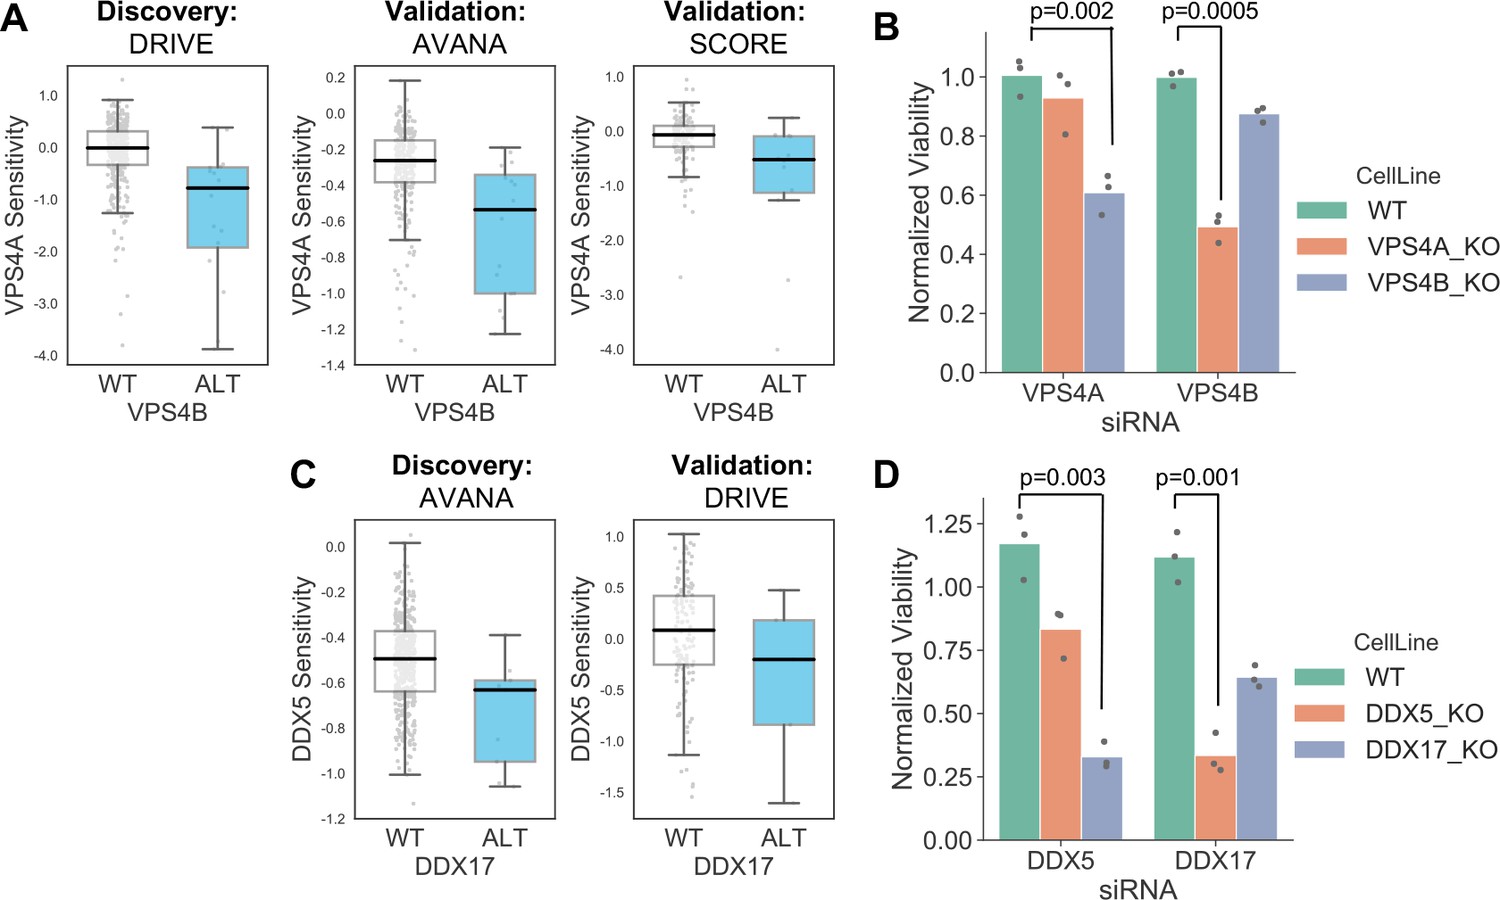
Robust synthetic lethalities associated with passenger gene loss.
(A) Boxplots showing the association between VPS4B loss and VPS4A sensitivity in the discovery dataset (DRIVE) and two validation datasets (AVANA and SCORE). (B) Mean viability of HAP1 cells treated with siRNA smartpools targeting VPS4A or VPS4B. Individual data points are shown as black dots. Data are normalized within each cell line such that the mean viability of cells treated with a negative control (non-targeting scrambled siRNA) is equal to one and the mean viability treated with a positive control (siRNA smartpool targeting the broadly essential PLK1 gene) is equal to 0. P-values from two-sided heteroscedastic T-tests. (C) Boxplots showing the association between DDX17 loss and DDX5 sensitivity in the discovery dataset (AVANA) and the validation dataset (DRIVE). (D) Mean viability of HAP1 cells treated with siRNA smartpools targeting DDX5 or DDX17, normalization and statistics as per B.
Author response image 1

Author response image 2
Additional files
-
Supplementary file 1
Driver gene alterations.
- https://cdn.elifesciences.org/articles/58925/elife-58925-supp1-v2.csv
-
Supplementary file 2
Selectively lethal genes.
- https://cdn.elifesciences.org/articles/58925/elife-58925-supp2-v2.txt
-
Supplementary file 3
Reproducible genetic dependencies.
- https://cdn.elifesciences.org/articles/58925/elife-58925-supp3-v2.xlsx
-
Supplementary file 4
Pathway enrichment of driver gene dependencies.
- https://cdn.elifesciences.org/articles/58925/elife-58925-supp4-v2.xlsx
-
Supplementary file 5
Protein–protein interaction enrichment.
- https://cdn.elifesciences.org/articles/58925/elife-58925-supp5-v2.xlsx
-
Supplementary file 6
Passenger gene loss alterations.
- https://cdn.elifesciences.org/articles/58925/elife-58925-supp6-v2.csv
-
Supplementary file 7
Passenger gene dependencies.
- https://cdn.elifesciences.org/articles/58925/elife-58925-supp7-v2.csv
-
Supplementary file 8
VPS4A_VPS4B and DDX5_DDX17 viability data.
- https://cdn.elifesciences.org/articles/58925/elife-58925-supp8-v2.xlsx
Download links
A two-part list of links to download the article, or parts of the article, in various formats.
Downloads (link to download the article as PDF)
Open citations (links to open the citations from this article in various online reference manager services)
Cite this article (links to download the citations from this article in formats compatible with various reference manager tools)
Integrative analysis of large-scale loss-of-function screens identifies robust cancer-associated genetic interactions
eLife 9:e58925.
https://doi.org/10.7554/eLife.58925


