Recurrent evolution of high virulence in isolated populations of a DNA virus
- The Department of Molecular Biosciences, University of Kansas, United States
Figures
Figure 1 with 3 supplements
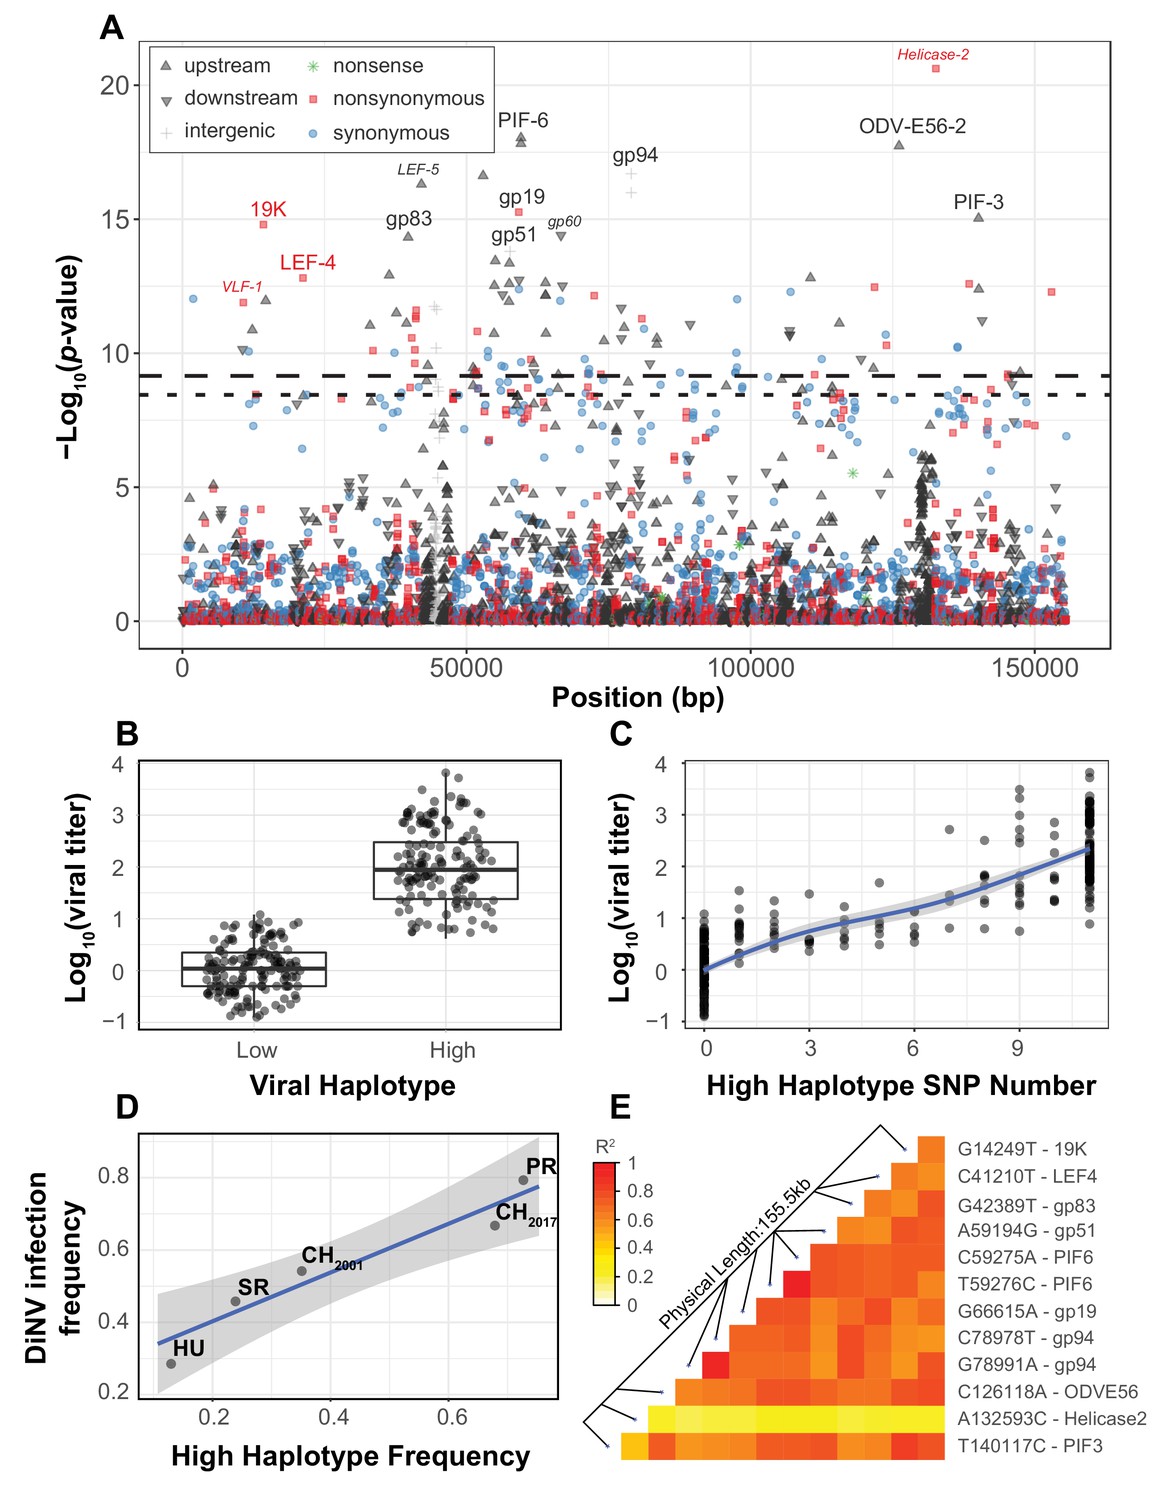
Viral genome-wide association study for DiNV titer in wild D. innubila.
(A) Manhattan plot for each DiNV SNP and the significance of its association with DiNV titer. SNP point, shape and color denotes if they are upstream (black upward arrow), downstream (black downward arrow), intergenic (gray cross), synonymous (blue circle), non-synonymous (red square) or nonsense (green asterisk) mutations. Named SNPs are either part of the significantly associated viral haplotype or, if a smaller size and italicized, are in or near other genes of interest (e.g. Helicase-2). The FDR-corrected p-value cutoff of 0.01 is shown as a dashed line (multiple testing correction for 1403 tests), while the permutation-based genome-wide significance threshold of p=0.01 is shown as a dotted line (based on 1000 permutations). (B) Viral titer for individual wild-caught flies infected with Low and High DiNV haplotypes (containing all 11 High type alleles). The middle bar represents median value, upper and lower bars represent 25th and 75th percentile and whiskers represent a 95% confidence interval. (C) Association between the number of High type SNP variants and the viral titer of a sample. (D) Across five populations, the frequency of the High type is correlated with the frequency of the virus infection. (E) Linkage disequilibrium heatmap between the eleven focal haplotype SNPs pairwise, and with the Helicase-2 SNP. Tiles are colored by the estimated linkage between SNPs, from red (highly linked, r2 = 1) to white (unlinked, r2 = 0).
Figure 1—figure supplement 1
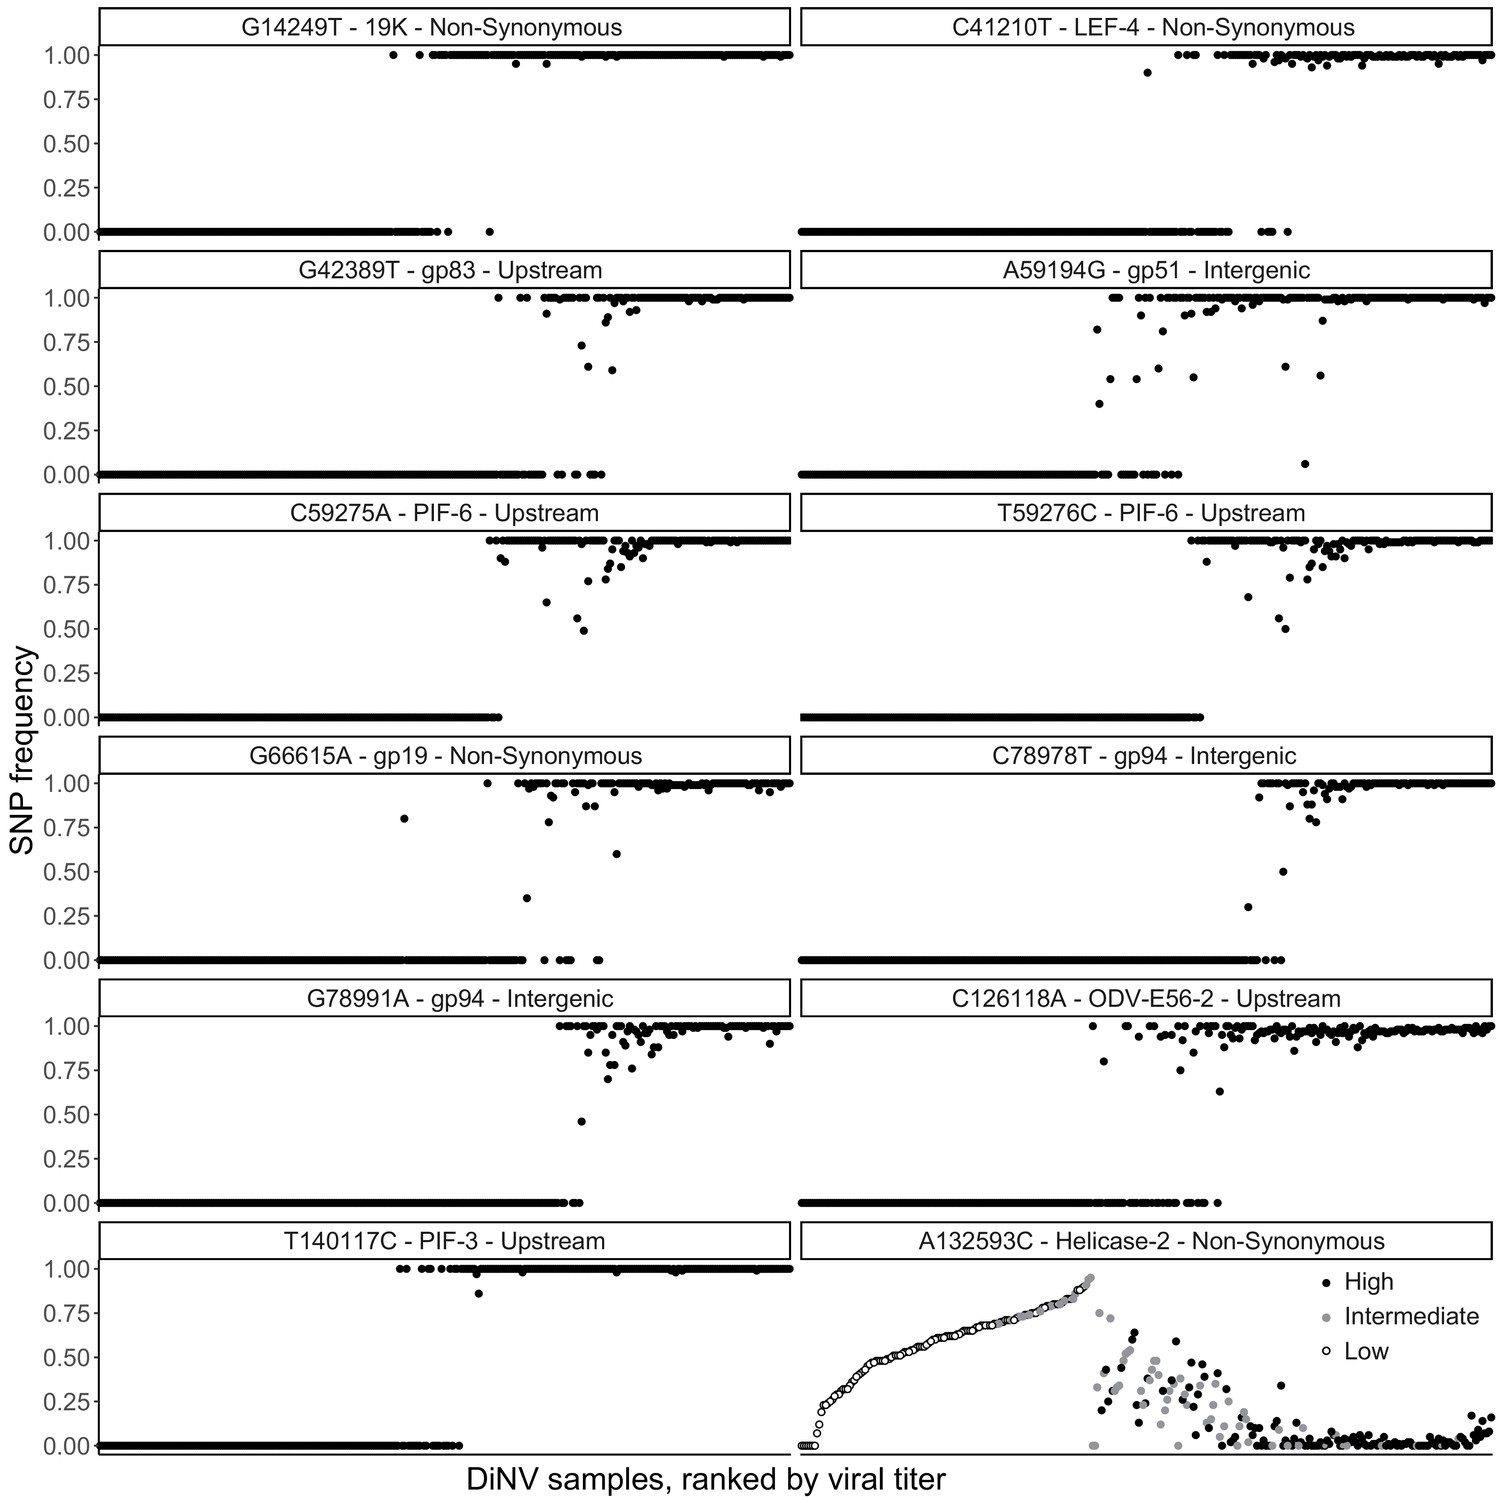
Frequency of each significantly associated SNP within each individual, with individuals ranked by viral titer (left = lowest, right = highest), to show the strong linkage of SNPs and little evidence of co-infection among the high and low haplotype SNPs.
Also shown is the bell-shaped relationship between viral titer rank and the significantly associated SNP in Helicase-2, samples here are colored by the assigned haplotype, if the strain is High type (black), intermediate (gray) or Low type (white).
Figure 1—figure supplement 2
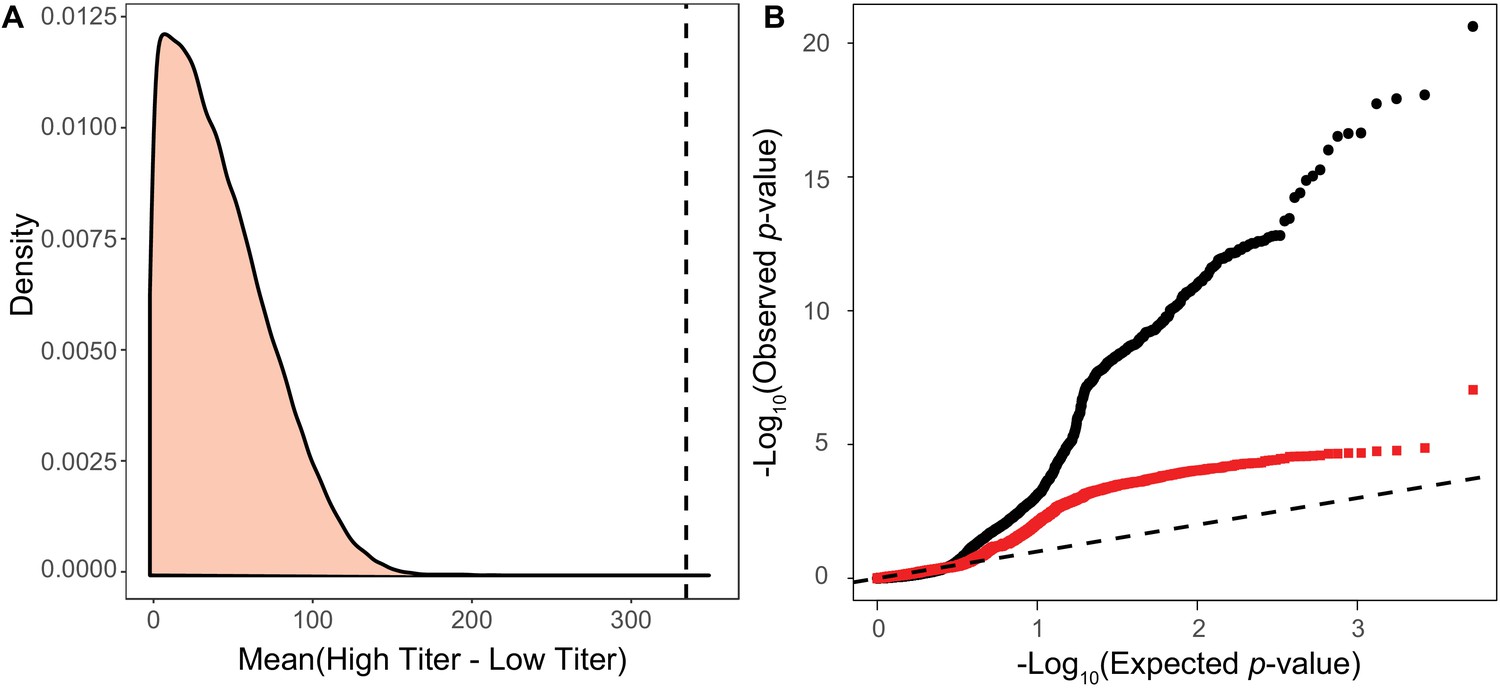
Permutation test for association test for viral virulence.
(A) Distribution of mean differences between artificial High type and Low type titers generated by permuting the titer across strains. We binned the Titer of strains by the allele of most significant SNP from the permuted associations and its 10 most strongly linked other sites. Whichever group has the higher titer during in each permutation is taken as the High type. The mean difference between the true High type and Low type is shown as a dashed line on the plot. (B) qqPlot of observed p-values versus the permuted p-values expected under the null expectation of no association. Black circles represent the p-value comparisons including focal haplotype SNPs. Red squares represent p-value comparisons with number of focal SNPs as a covariate, excluding these SNPs from the association study. A one to one correlation is shown as a dashed line.
Figure 1—figure supplement 3
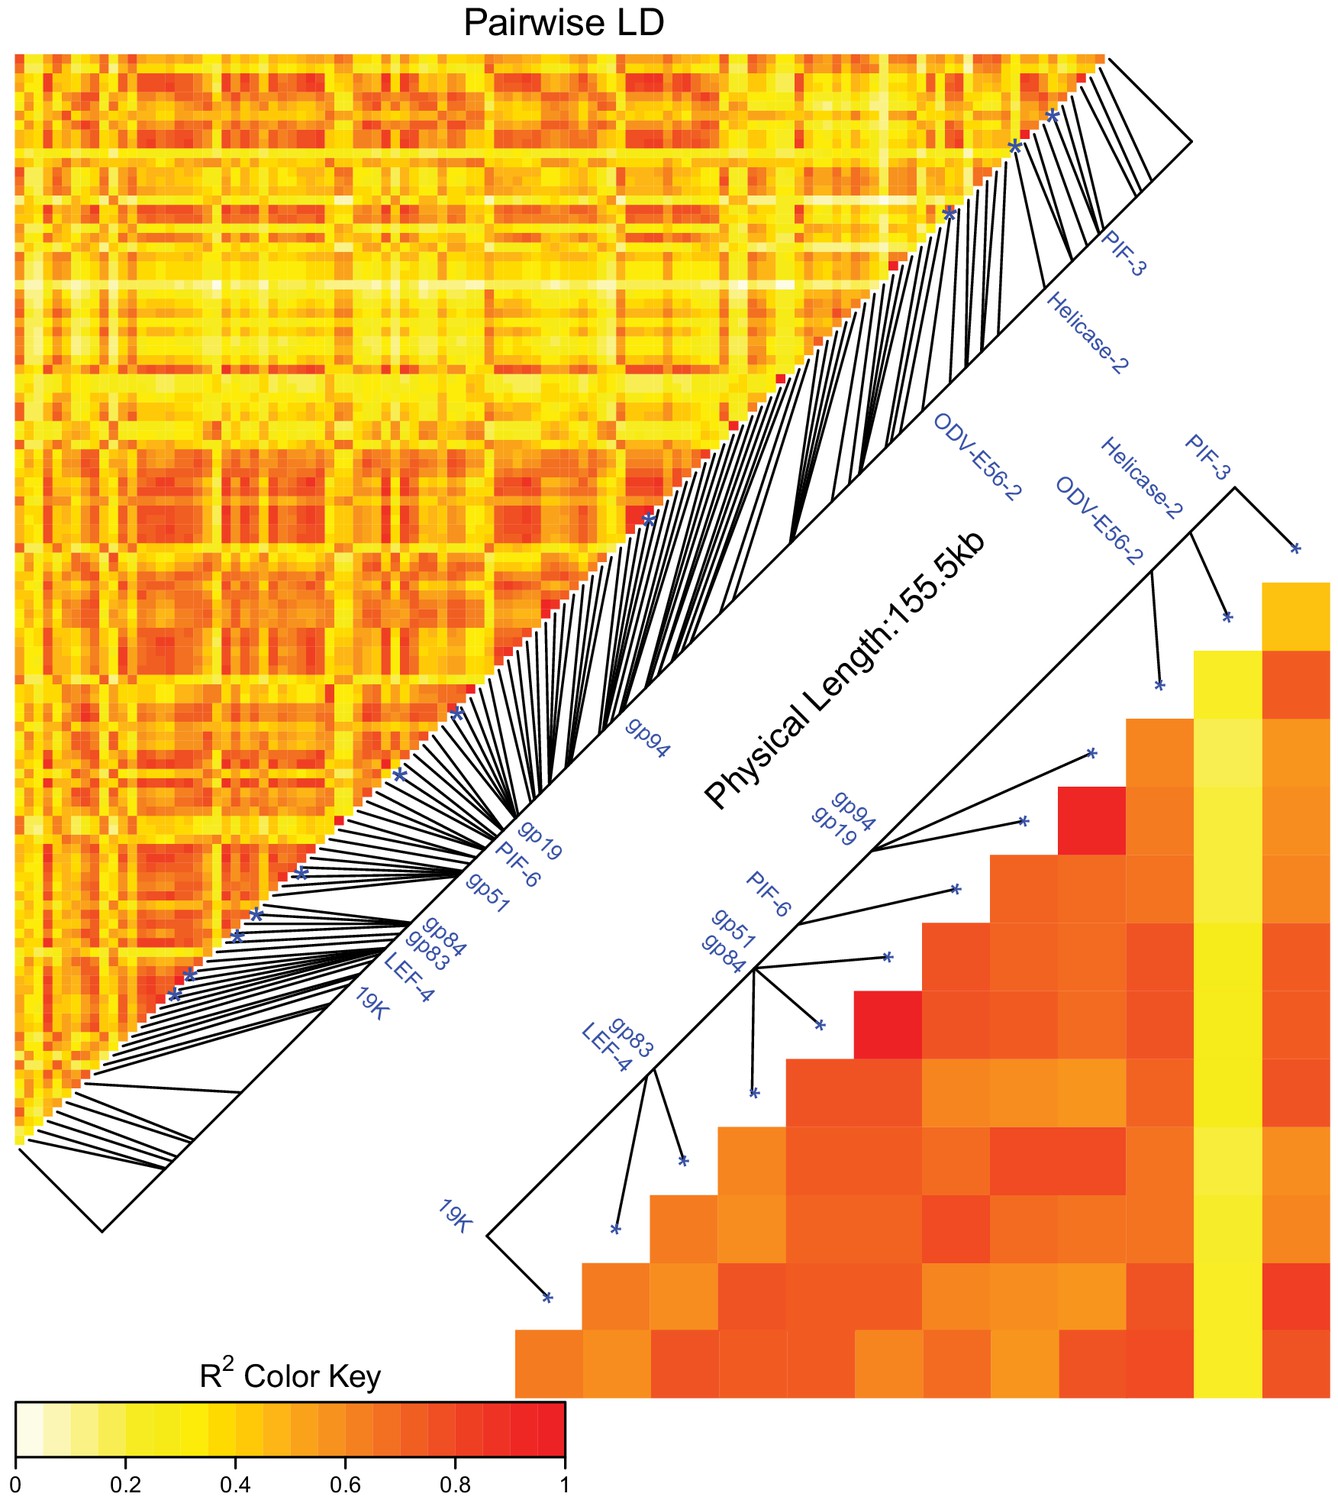
Linkage disequilibrium between SNPs in DiNV as a heatmap generated in LDheatplot.
The labelled SNPs (significantly associated SNPs found in the association study) are strongly linked, shown by the high r2 between these SNPs. Points are colored by the estimated linkage between SNPs, from red (highly linked, r2 = 1) to white (unlinked, r2 = 0). Linkage disequilibrium heatmap for just the significantly associated SNPs is also shown to show the high linkage between SNPs.
Figure 2 with 2 supplements
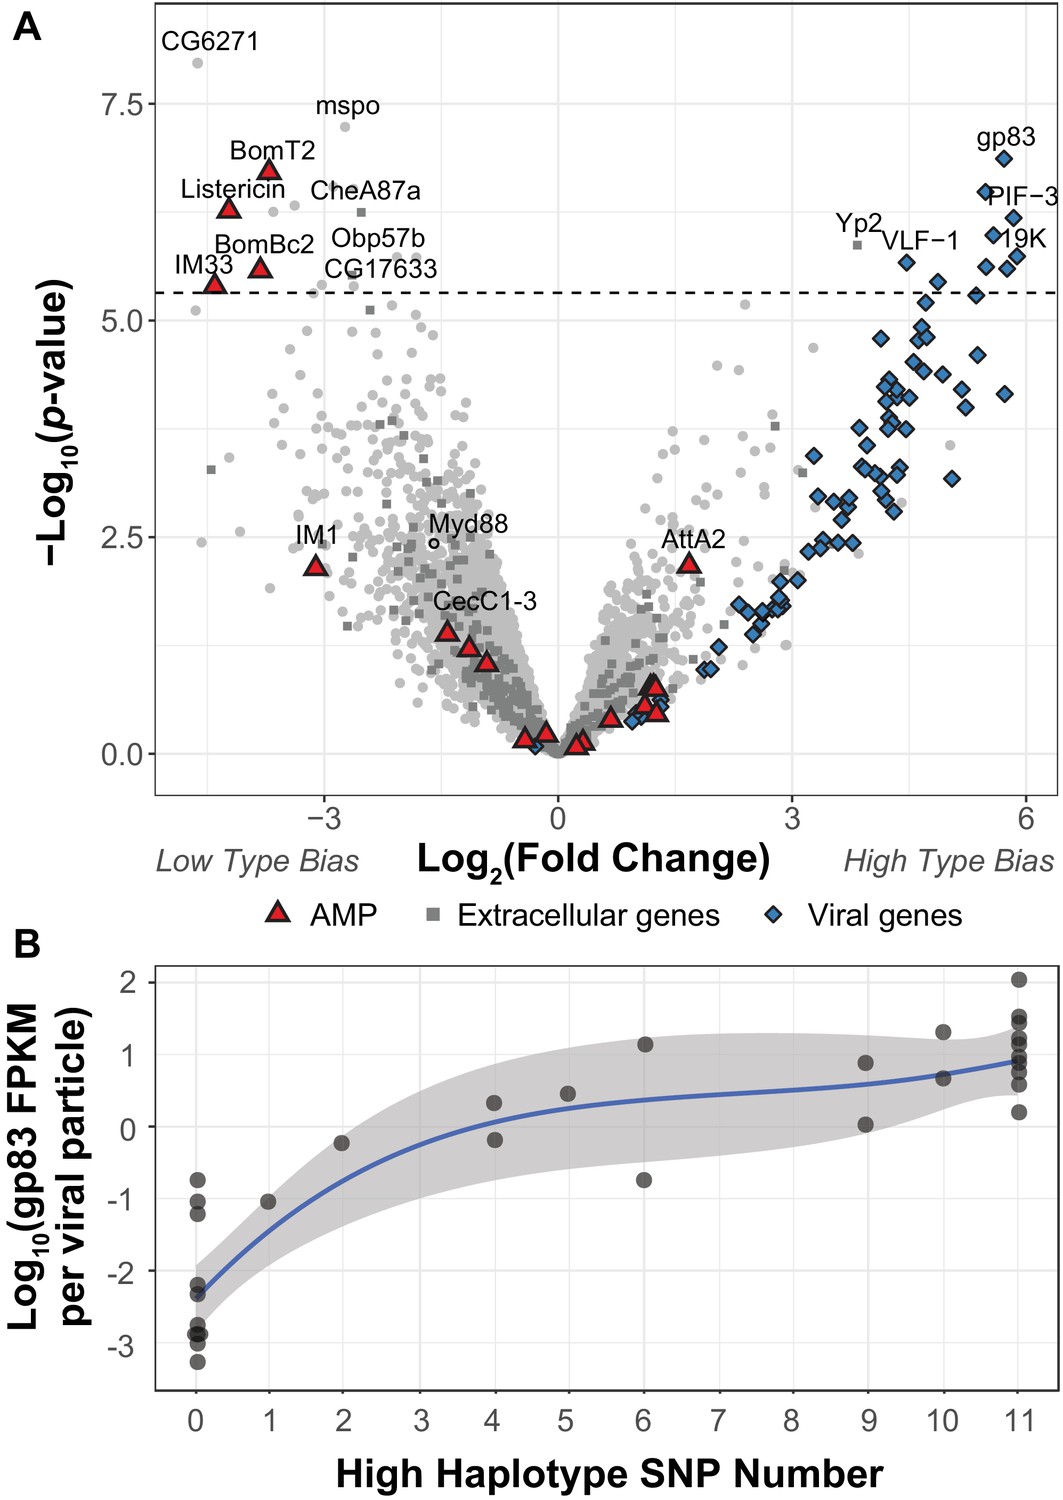
DIfferential expression between two viral haplotypes.
(A) Differential expression of D. innubila and DiNV genes between D. innubila infected with either the Low type or High type DiNV multilocus genotypes. For host genes, the log-fold change of mRNA fragments per million fragments is compared, while for viral genes the log-fold change of viral mRNA fragments per million fragments per viral particle is compared. Genes are colored/labelled by categories of interest, specifically antimicrobial peptides (AMPs), proteins involved in the extracellular matrix and viral proteins. Specific genes of interest, such as Myd88, are also named. The FDR-corrected significance cut-off of 0.01 (10,320 tests) is shown as a dashed line. (B) Expression (in FPKM per viral particle) of gp83 increases with the number of High type SNPs.
Figure 2—figure supplement 1

Volcano plot of changes in gene expression between D. innubila infected with DiNV and uninfected controls.
(A) Gene categories of interest, such as enriched categories, are highlighted in color. The FDR-correct significance cut-off of 0.01 (10,320 tests) is shown as a dashed line. (B) Comparison of gene expression changes upon infection for D. innubila and D. melanogaster. Significantly differentially expressed genes (p-value<0.01, FDR-corrected) are colored, genes differentially expressed in both species are colored blue, genes differentially expressed in just D. melanogaster are colored yellow and genes differentially expressed in just D. innubila are colored red.
Figure 2—figure supplement 2
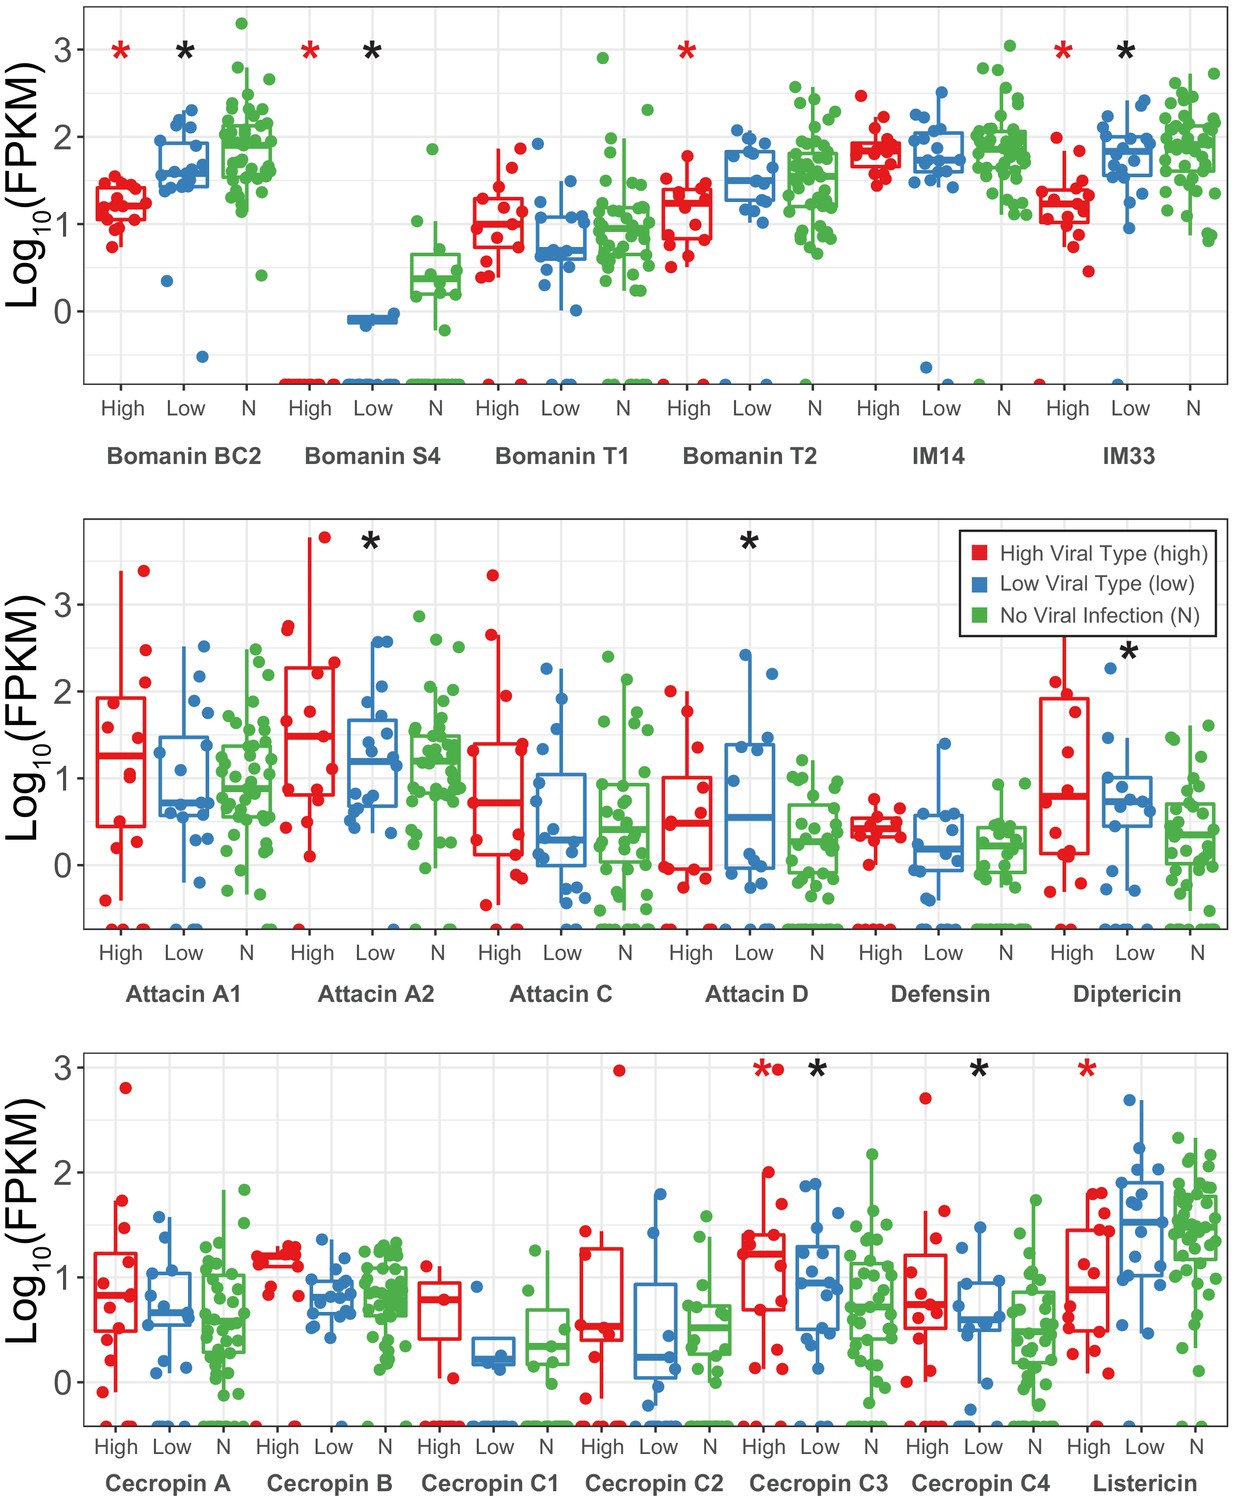
Expression changes (shown as transcript fragments per 1 million reads per 1kbp of exon) of antimicrobial peptides between strains infected with High type DiNV, Low type DiNV or not infected.
Black stars above low samples show significant differential expression between DiNV-infected strains and uninfected strains (multiple testing corrected p-value<0.05). Red stars above high samples show significant differential expression between Low type infected strains and high type infected strains (multiple testing corrected p-value<0.05).
Figure 3 with 2 supplements
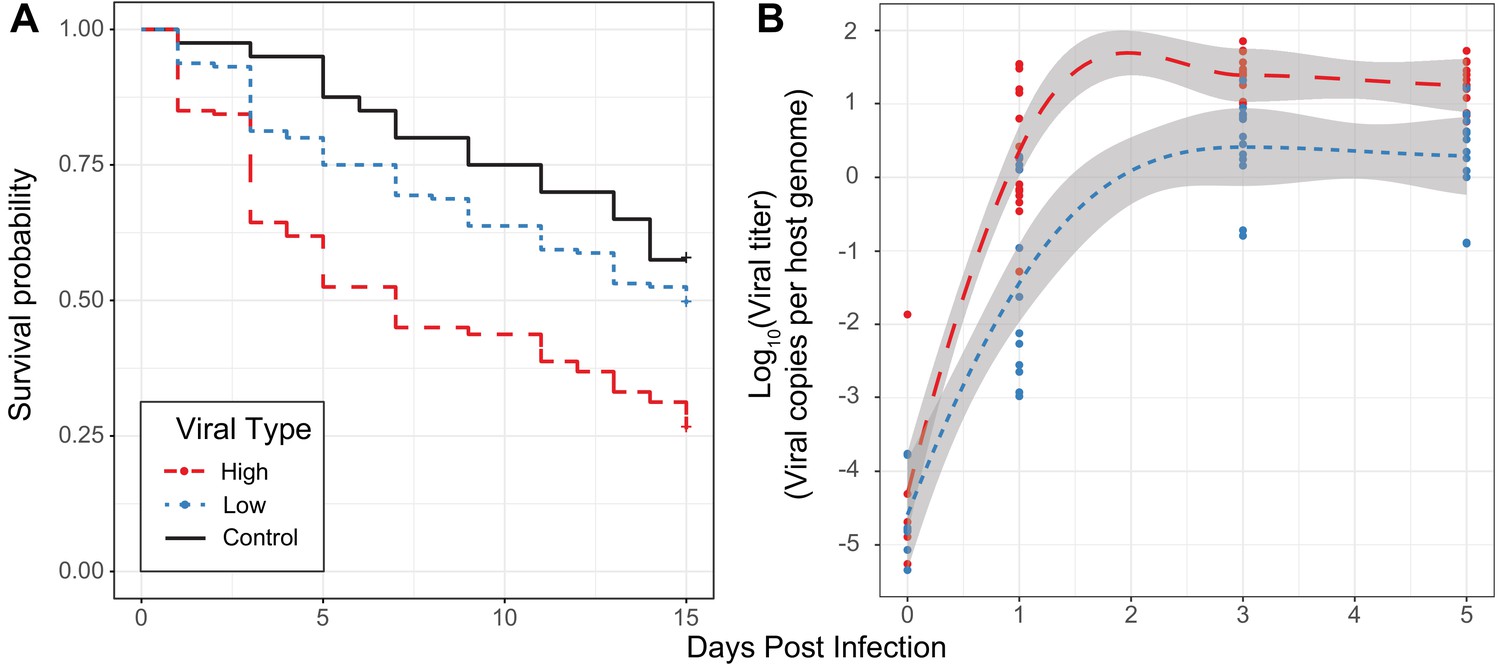
Effect of viral type in experimental infections.
(A) Survival curves of D. innubila infected with high and low viral types compared to control flies pricked with sterile media, for 15 days post-infection. Survival 5 days post-infection separated by strain is shown in Figure 3—figure supplement 2. (B) qPCR copy number of viral p47 relative to tpi in D. innubila infected with DiNV filtrate of high and low types.
Figure 3—figure supplement 1
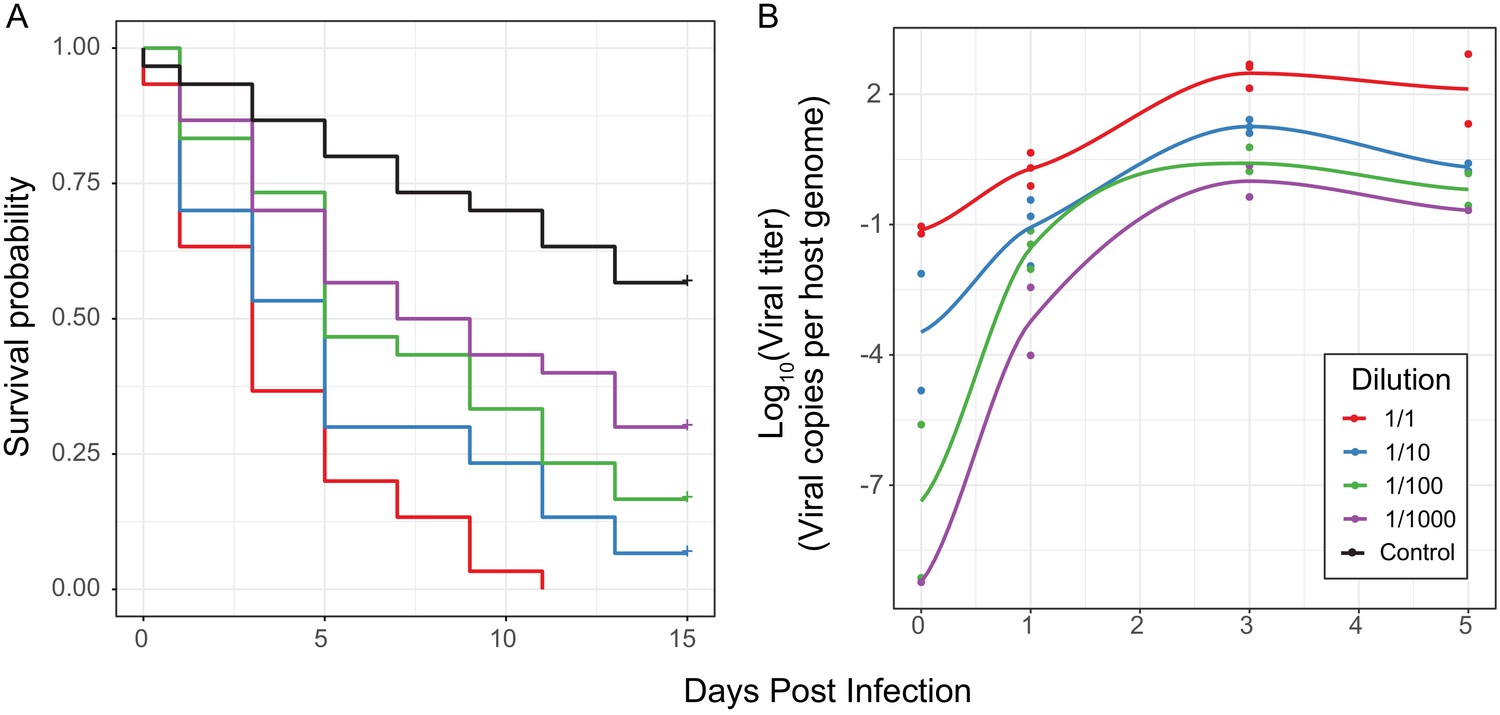
Effect of differences in viral type and titer in experimental infections.
(A) Survival curves of D. innubila infected with DiNV filtrate of different dilutions compared to control flies pricked with sterile media, for 15 days post infection. Each dilution was used to infect 30 flies in 3 replicates of 10. (B) qPCR copy number of viral p47 relative to tpi in samples of D. innubila infected with DiNV filtrate of different dilutions, between 1 and 1000 viral particles per host genome copy. 2 to 3 replicates of 5 flies were quantified at each timepoint, with later time points limited to two time points due to lack of surviving flies.
Figure 3—figure supplement 2
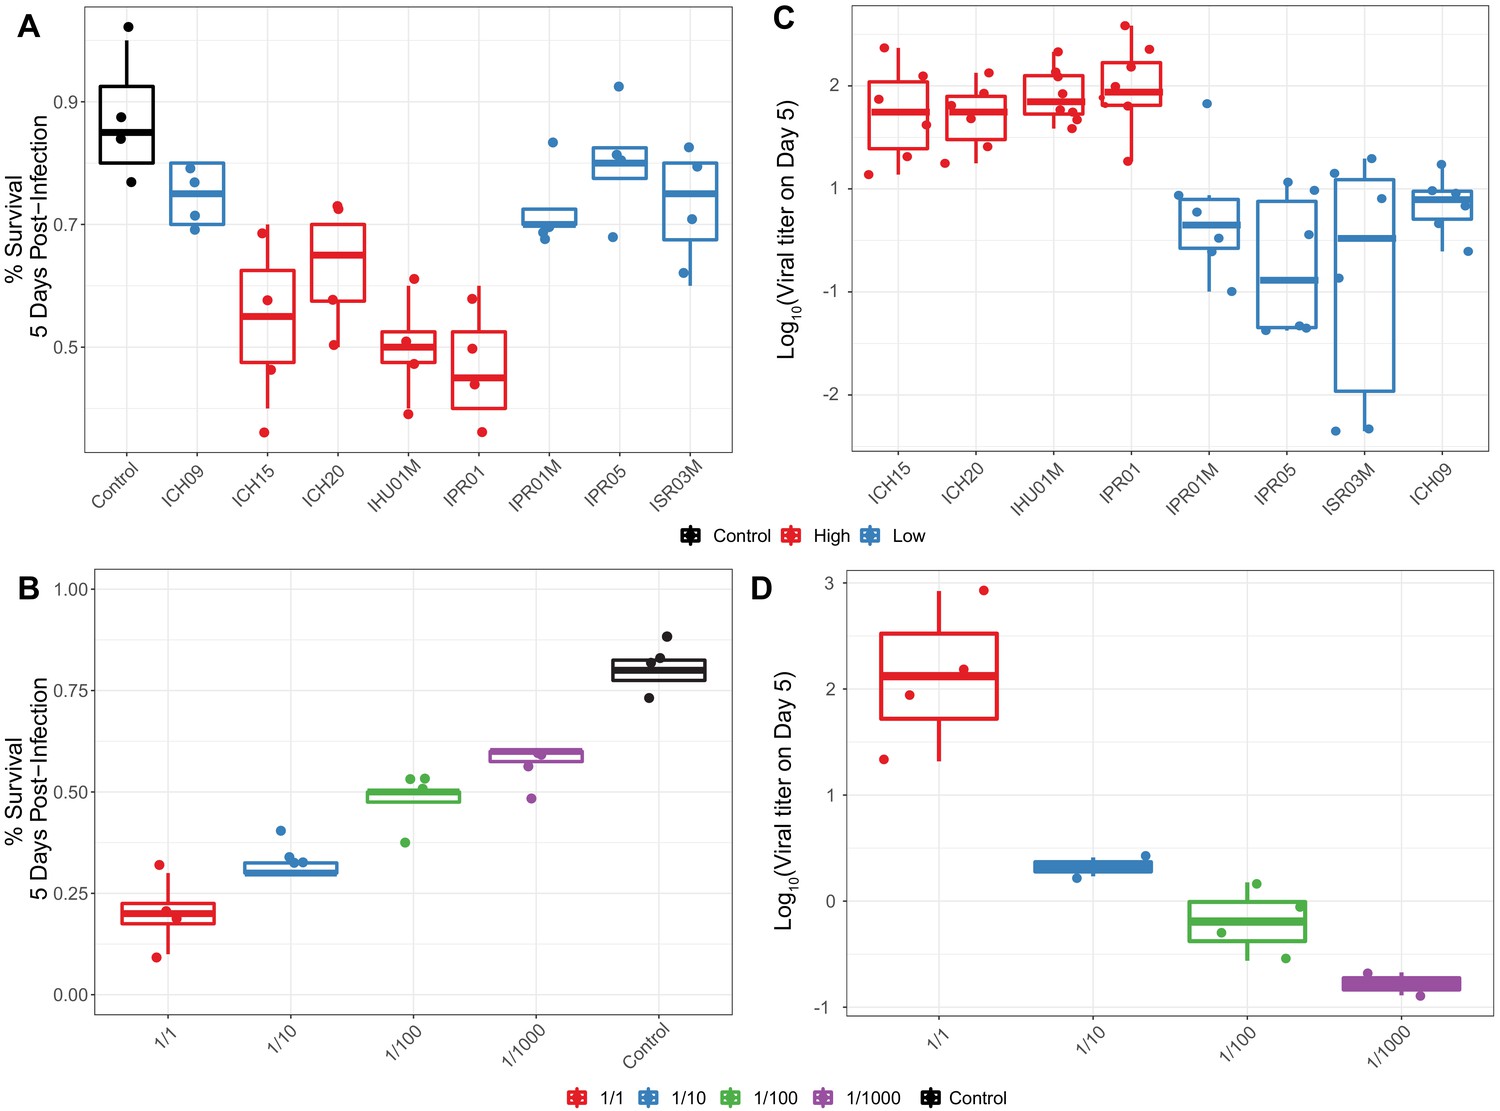
Survival of flies following infection with different titers and types of DiNV.
(A) Survival of D. innubila reference strain 5 days post infection, using filtrate from different samples versus uninfected control, colored by High type virus or Low type virus. (B) Survival of D. innubila reference strain 5 days post infection using serial dilutions of IPR01 filtrate versus control. Each viral sample/dilution was used to infect 40 flies in 4 replicates of 10. (C) Viral titer estimated per viral genotype at 5 days post-infection, colored by High type virus or Low type virus. (D) Viral titer of DiNV infecting D. innubila reference strain 5 days post infection using serial dilutions of IPR01 filtrate versus control. Each sample/dilution was used to infect 40 flies in 4 replicates of 10, we then quantified the viral titer of surviving flies in groups of 5 flies, varying from 4 to 6 replicates depending on the number of surviving flies.
Figure 4 with 3 supplements
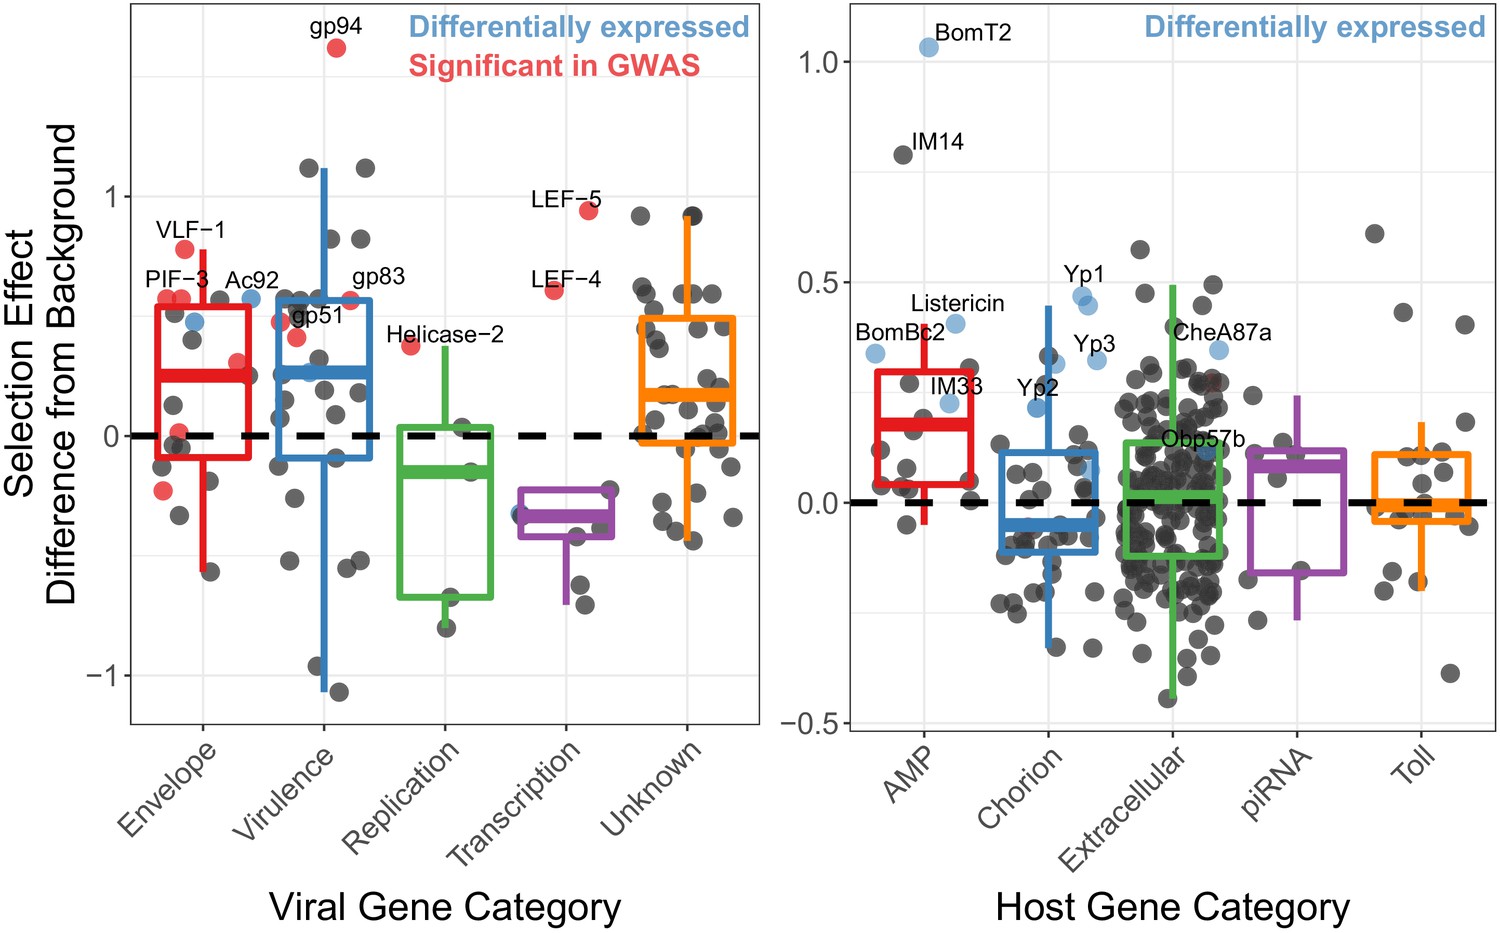
Genes implicated in host/virus interaction are rapidly evolving by positive selection in the Chiricahua population.
Difference in selection effect for viral and host gene categories of interest from nearby background genes (average shown as 0, the dashed line), as indicated by the proportion of substitutions fixed by adaptation, weighted by mutations in SnIPRE (Eilertson et al., 2012). Genes that have associated SNPs from the association study are highlighted in red, while genes which are differentially expressed upon infection, or between viral types are labelled in blue. All association study hits are also differentially expressed and labelled in red. Genes of interest are named.
Figure 4—figure supplement 1
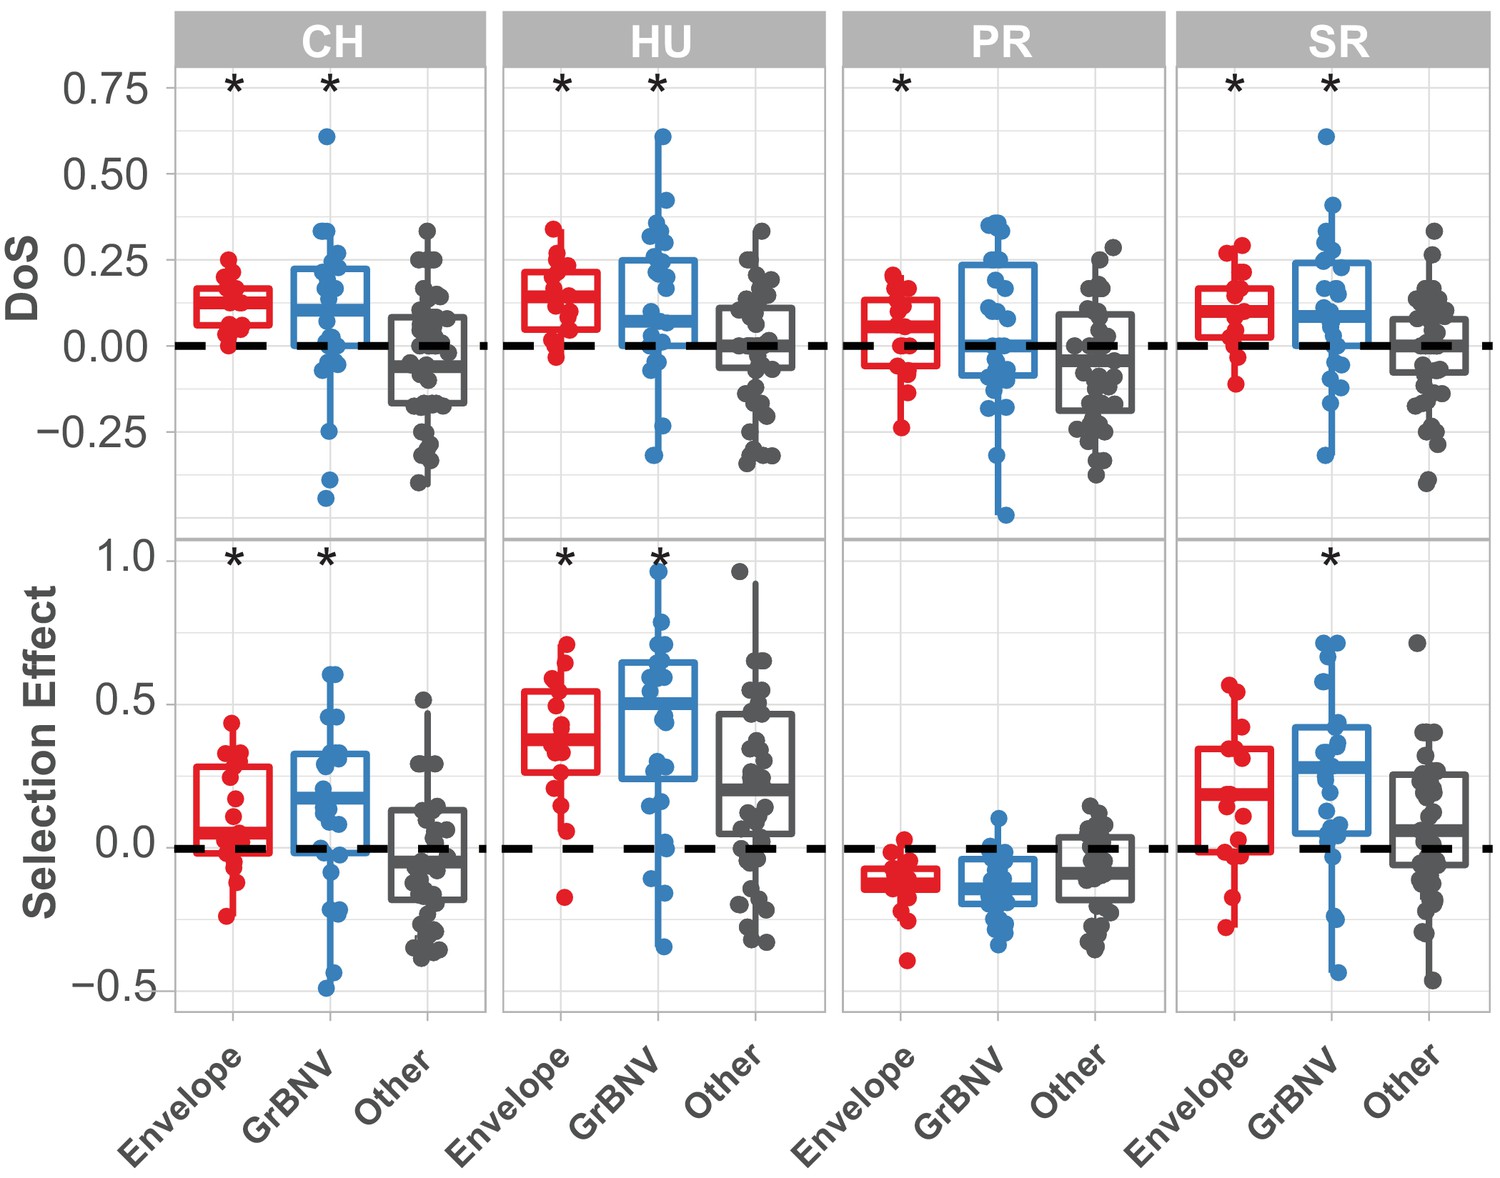
McDonald-Kreitman based statistics for each gene in population of Drosophila innubila Nudivirus, with viral envelope and GrBNV potential virulence factors shown separately.
DoS = direction of selection, Selection Effect = SnIPRE estimated weighted DoS. Boxplots marked with a * are significantly higher than background/other viral genes (GLM p-value<0.05). In both cases, values above 0 suggest some proportion of substitutions are fixed by adaptive evolution.
Figure 4—figure supplement 2
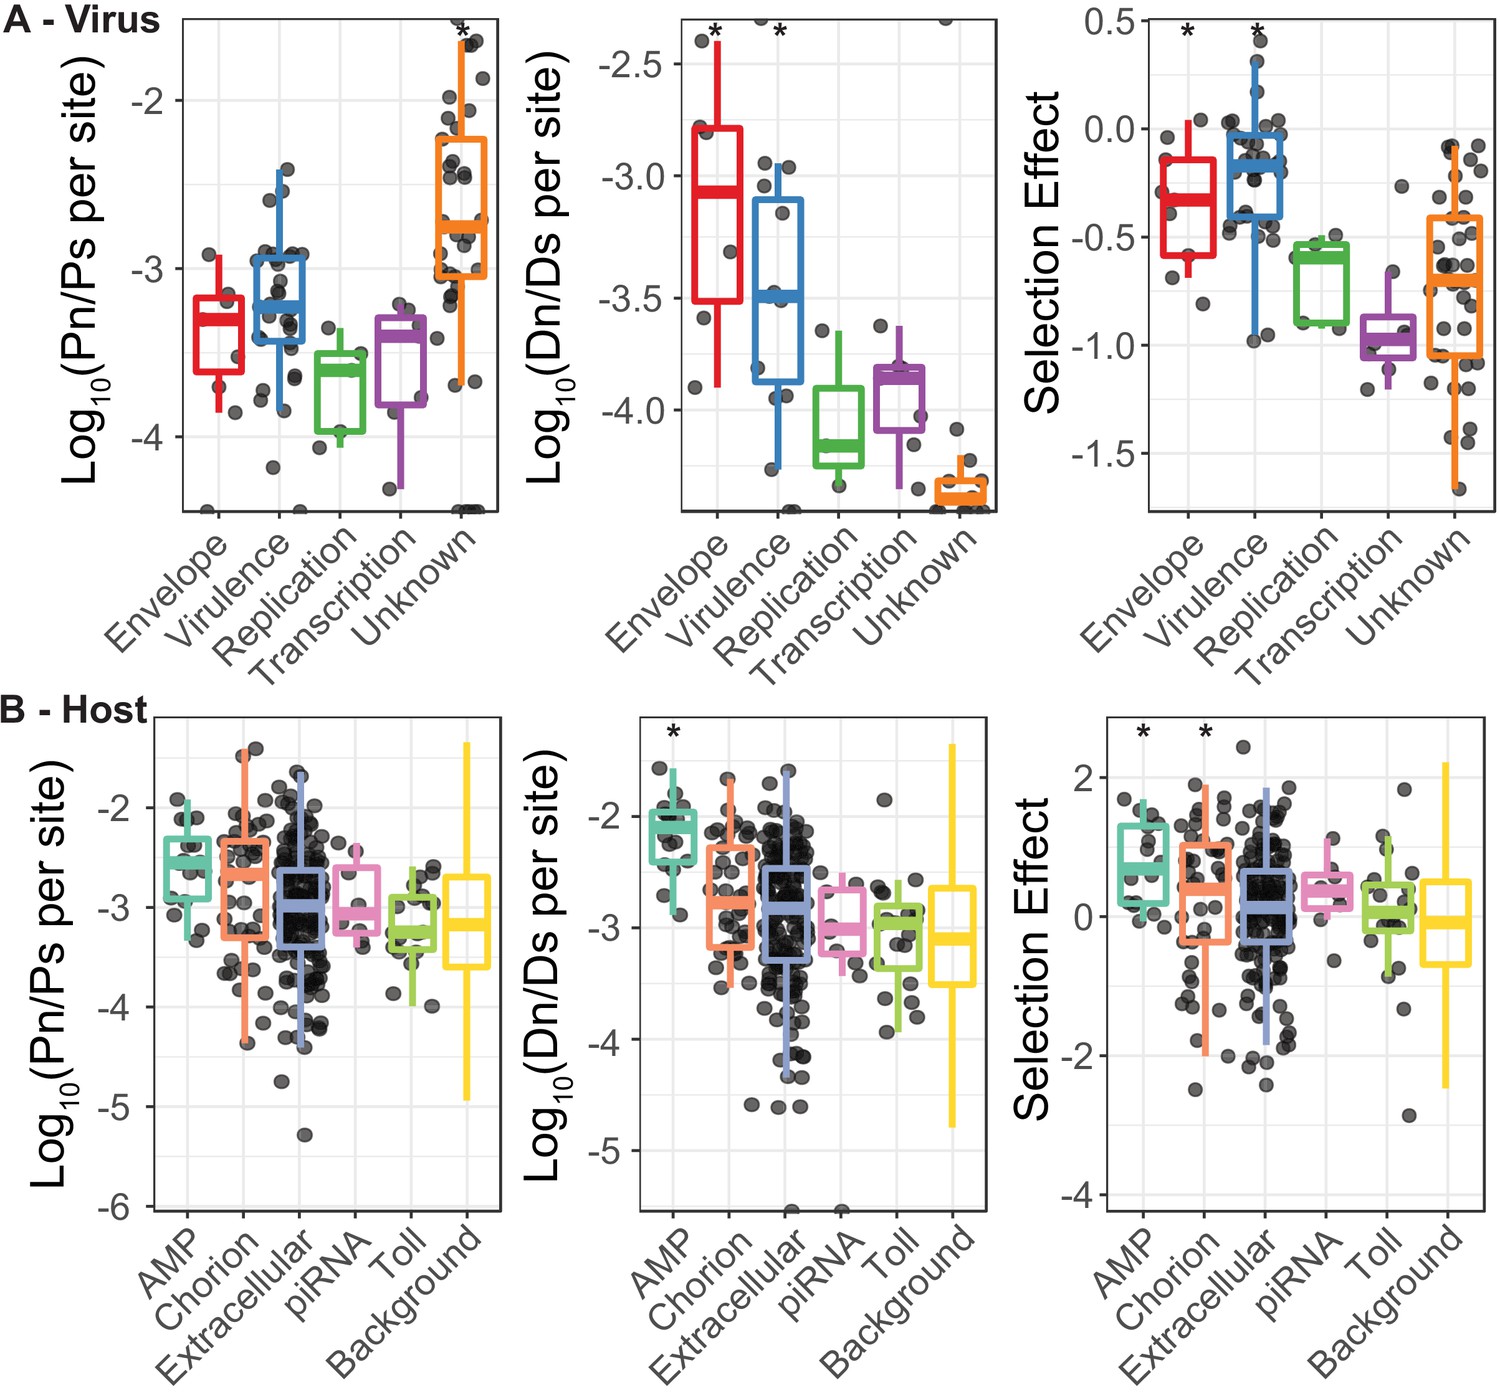
The ratio of nonsynonymous to synonymous polymorphisms and substitutions for both DiNV and D. innubila, used to generate Figure 4.
(A) The ratio of nonsynonymous polymorphism (Pn) to synonymous polymorphism (Ps) for DiNV functional categories, the ratio of nonsynonymous substitutions (Dn) to synonymous substitutions (Ds) for DiNV functional categories and the resulting estimate of Selection effect (estimated using SnIPRE) for DiNV functional categories. (B) The ratio of nonsynonymous polymorphism (Pn) to synonymous polymorphism (Ps), the ratio of nonsynonymous substitutions (Dn) to synonymous substitutions (Ds) and the estimated Selection effect, all for the host D. innubila, separated by functional categories of interest highlighted in the differential expression analysis or the association study. We have included a point for each gene in all categories apart from the background, due to the sheer number of points in the background category. When 0 polymorphisms or substitutions are found in a gene, that gene is not shown in the Pn/Ps or Dn/Ds plots.
Figure 4—figure supplement 3
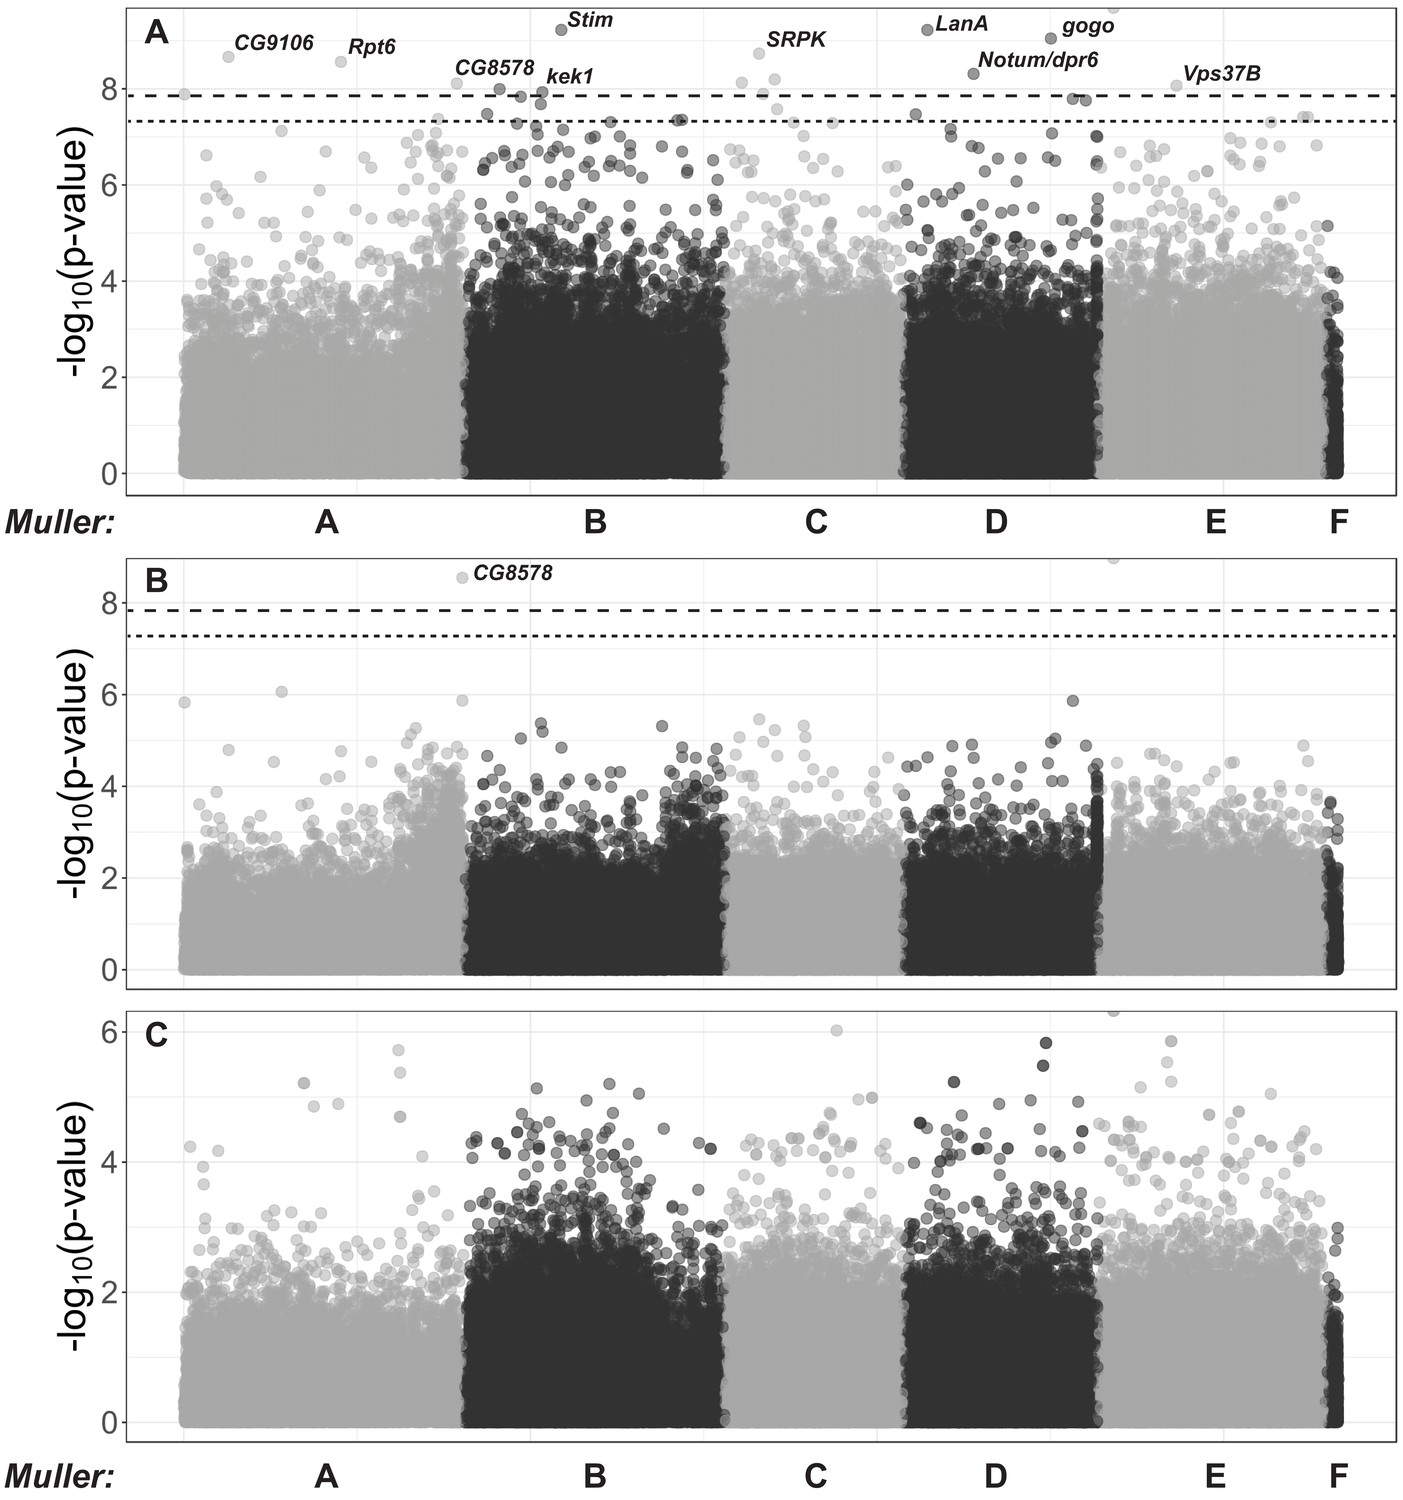
Host genome-wide association study for DiNV titer in wild D.innubila.
(A) Manhattan plot of significance of SNP on viral titer after factoring in interaction with the viral haplotype. The significance cut offs are labelled (p-value<0.05 after multiple testing correction dotted, p-value<0.05 after permutations dashed). (B) Manhattan plot of SNP x viral haplotype interaction for viral titer association study in D. innubila, calculated using PLINK. The significance cut offs are labelled (p-value<0.05 after multiple testing correction dashed, p-value<0.05 after permutations dotted). (C) Manhattan plot of SNP * sex interaction for viral titer association study in D. innubila, calculated using PLINK.
Figure 5 with 4 supplements
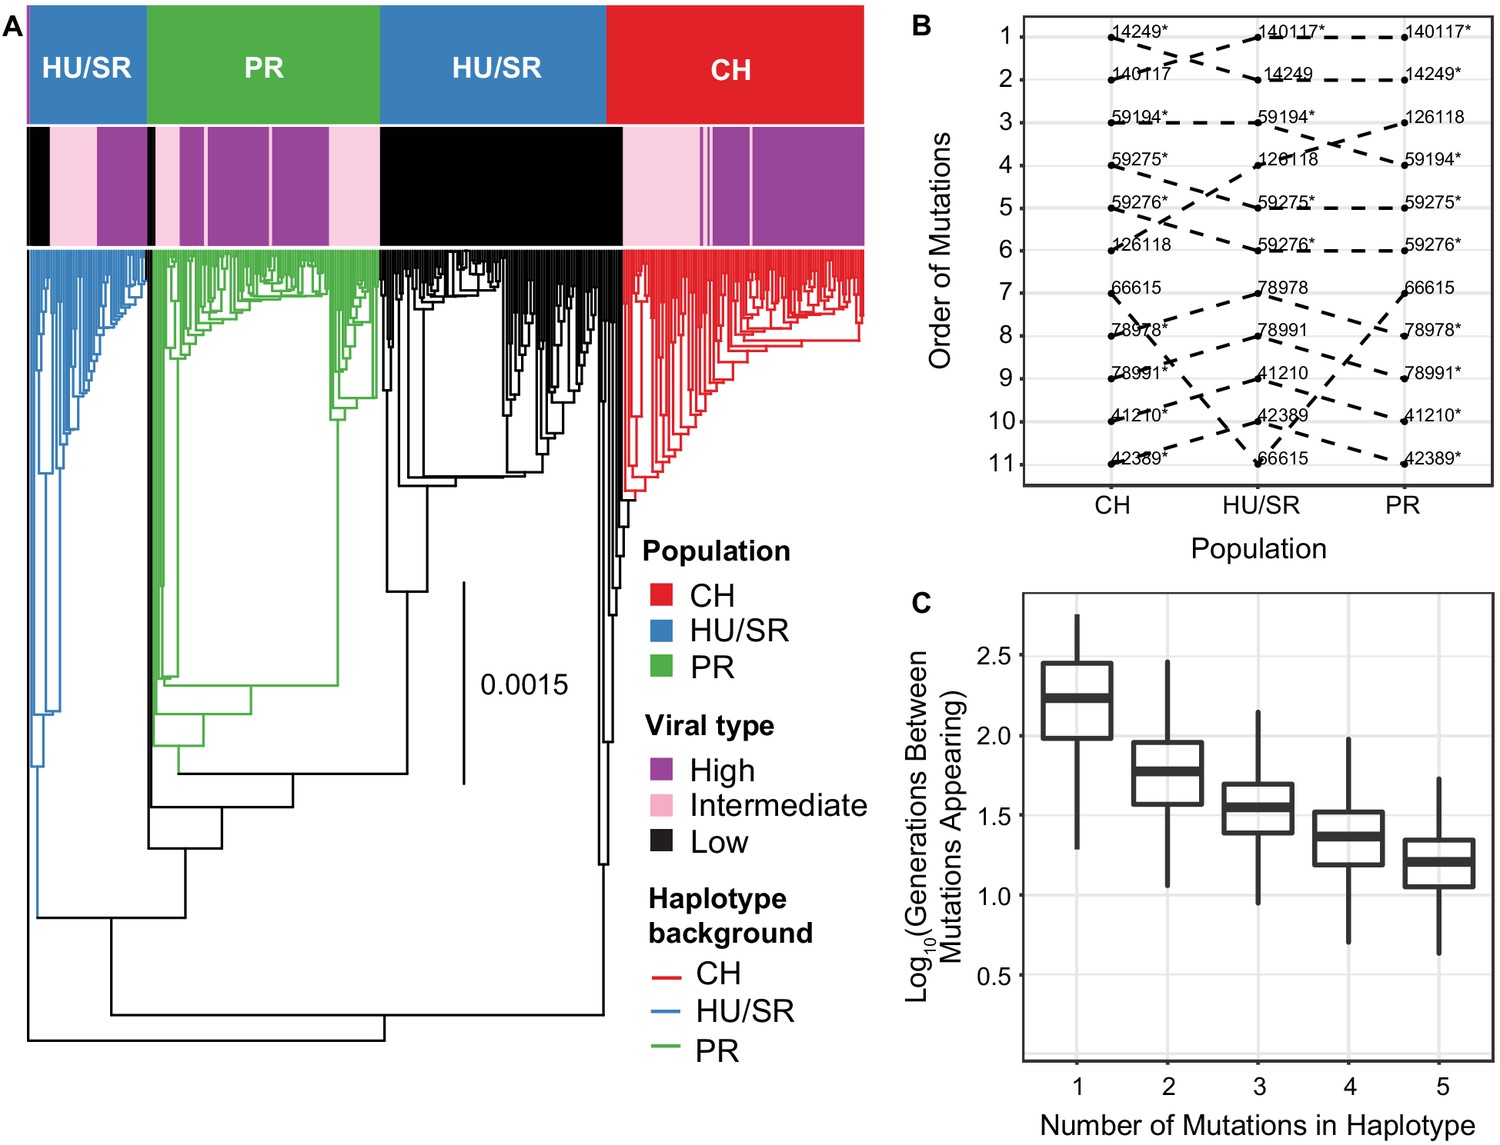
The evolution and maintenance of two viral types.
(A) Phylogeographic reconstruction of the spread of DiNV through D. innubila, rooted on the Kallithea virus reference sequence, including a reconstruction of the High type evolution (with strains containing all 11 High type variants shown in purple, strains with an intermediate number of high type variants are shown in pink, and strains with no high type variants are shown in black). Branches are colored when the SNPs found in the background for each High haplotype are present in the population, showing that the background differs per population. Black branches show states where branch tips do not contain all the shared High/Low population specific background SNPs. (B) Order of mutations in the viral haplotype appearing in each population. Apart from three mutations the order is consistent between locations. SNP order has been bootstrapped across multiple sample phylogenies, SNPs with bootstrap support of >95% are labelled with a *. (C) The number of generations needed for ‘High titer’ mutations to evolve in simulated populations, given that each mutation increases the mutation rate. The number of generations between each mutation appearing decreases as titer increases.
Figure 5—figure supplement 1

SNP association in the viral haplotype and principle component analysis of viral samples.
(A) Frequency of samples with different numbers of SNPs in the viral haplotype, there are very few intermediate types. (B) Frequency of each SNP in samples infected with the virus, showing there is little evidence of co-infections. (C) Principal component analysis of DiNV strains using variation of strains. Strains are colored by the viral type, showing its recurrent evolution. Point shape denotes species in which DiNV was found (D. azteca, D. falleni or D. innubila). Strains cluster by collection location. (D) Linkage between SNPs in the viral haplotype (r2) and other SNPs in the haplotype, to other SNPs in the viral genome.
Figure 5—figure supplement 2
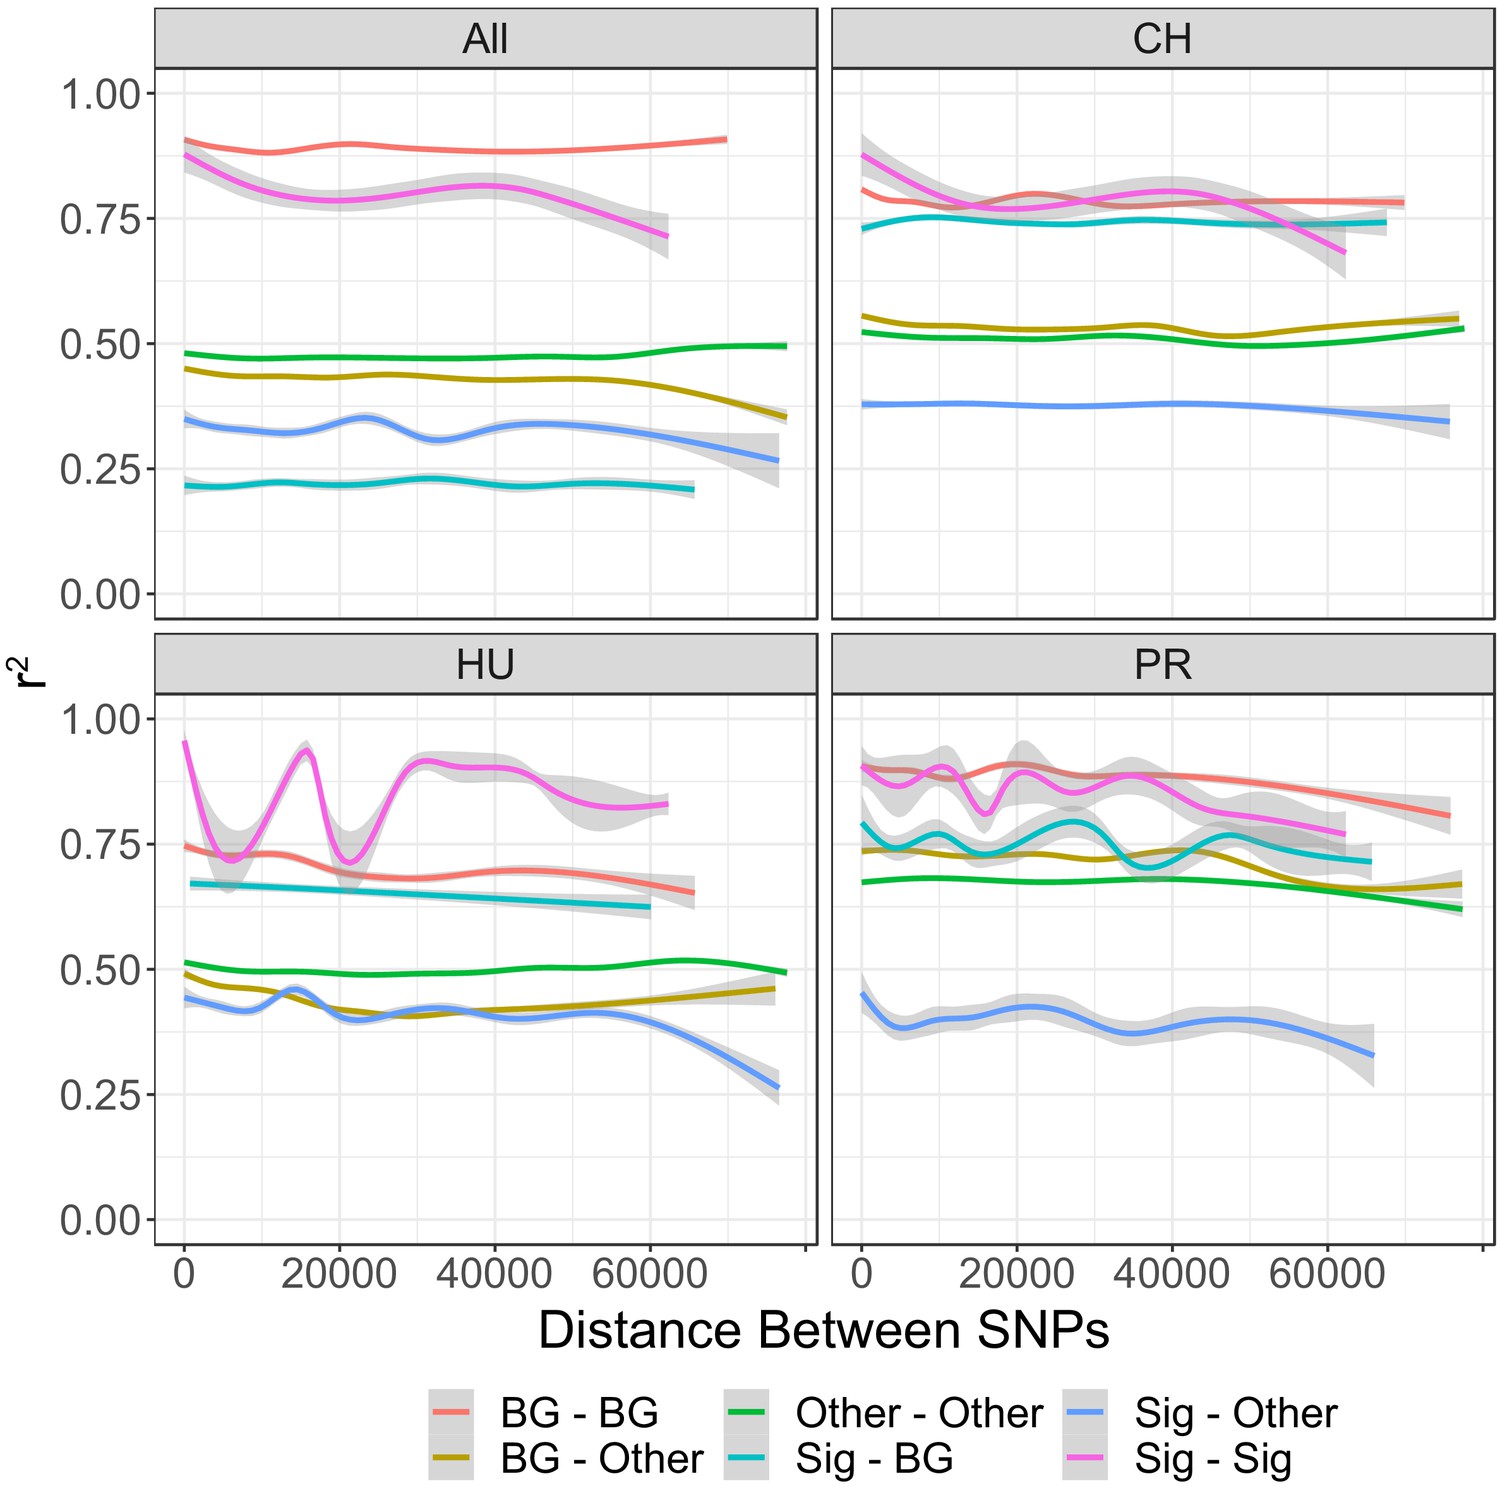
Linkage (r2) between different types of SNPs in each population of DiNV, and across all samples.
Other = SNPs which are not significantly associated with DiNV titer and do not form the viral haplotype. Sig = SNPs which are significantly associated with DiNV titer and do not form the viral haplotype. Background = SNPs which are in the same background that the high viral type evolved on in each population. The Other–Other relationship line strongly overlaps with the relationship line seen for all SNPs, due to this we have not included all SNPs together in this plot.
Figure 5—figure supplement 3

Associations of significantly associated SNPs and their neighboring SNPs, to attempt to determine if gene conversion is the cause of the recurrent evolution of the viral haplotype.
The significantly associated SNPs are shown at position 0, with the 5 SNPs upstream (−5 to −1) and downstream (1 to 5) plotted around them for each strain. Derived allele strains are shown in black, while ancestral allele strains for each position are shown in gray. For the helicase-2 allele (132593), windows are plotted as derived if the allele frequency is greater than 0.5.
Figure 5—figure supplement 4

Effective population size backwards for each population of DiNV going backwards in time, estimated using StairwayPlot.
Dotted lines indicate the error windows for Ne at a given time point. Lines are colored by population.
Figure 6
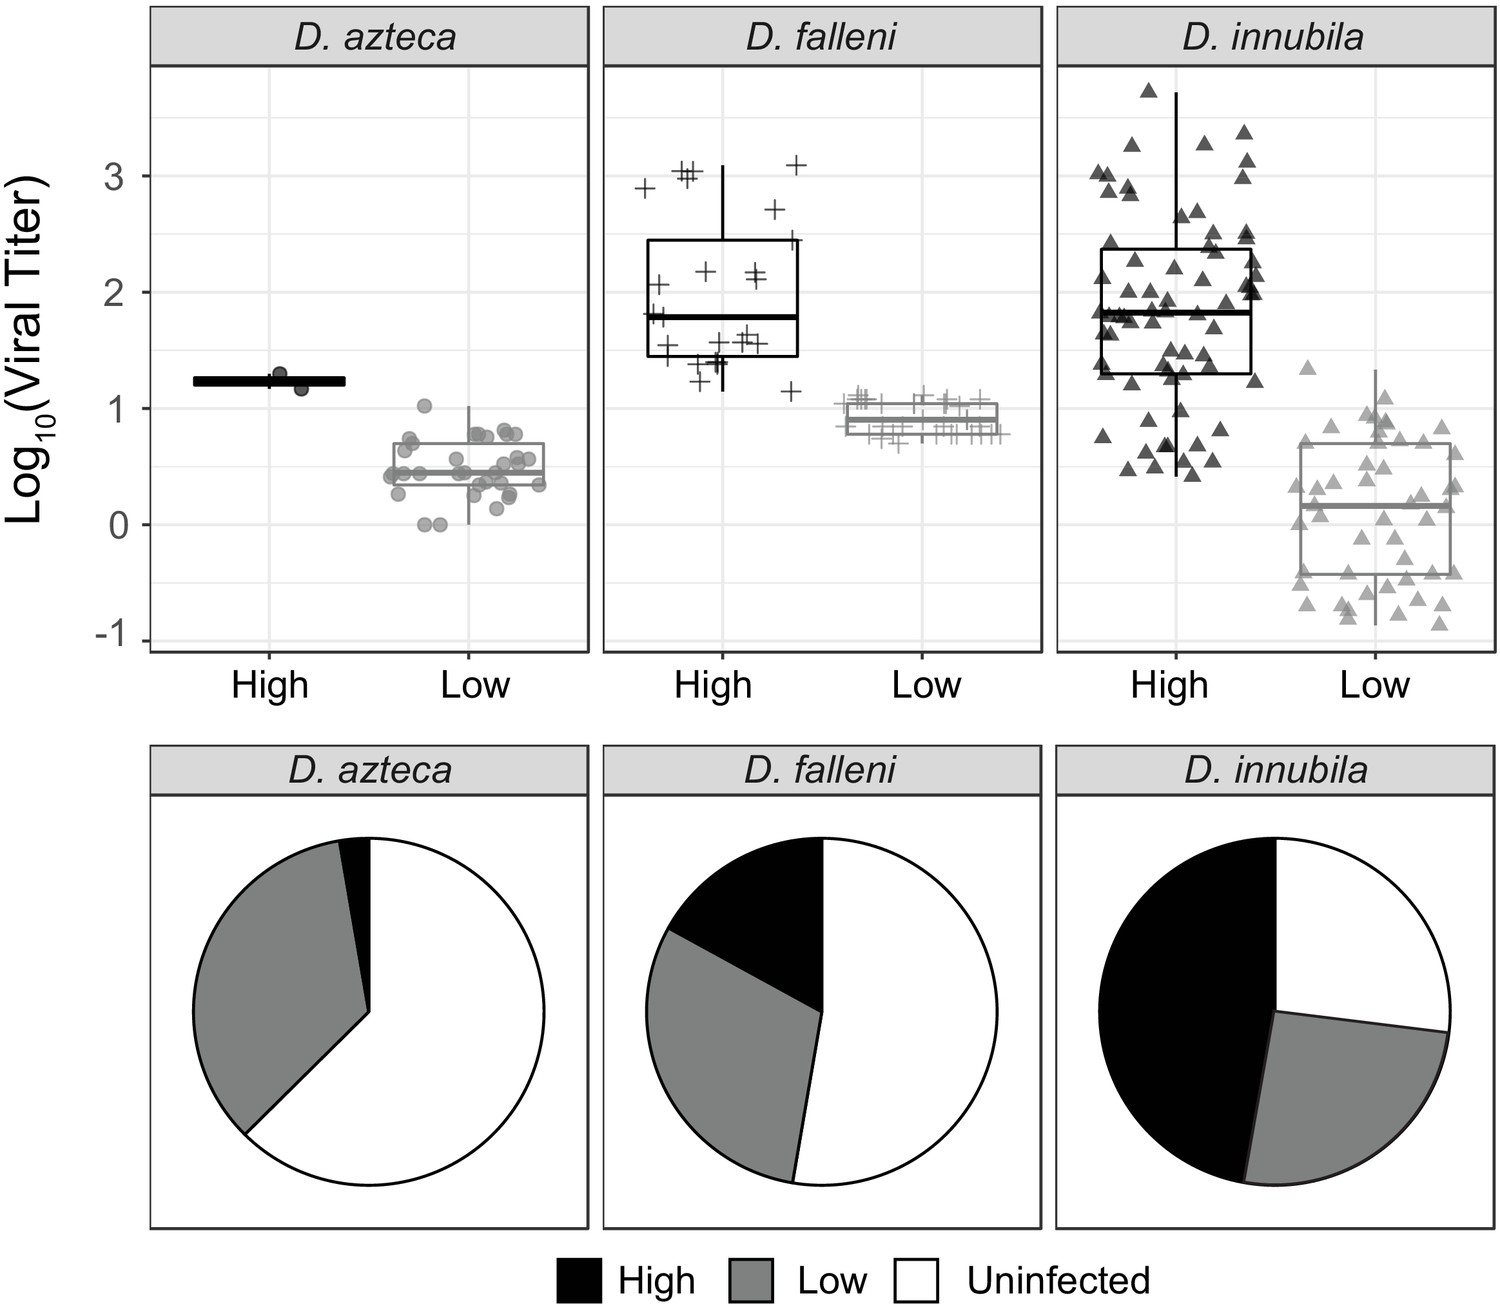
Titer and frequency of different DiNV types infecting different species.
(A) Viral titer for CH samples of D. azteca, D. falleni and D. innubila infected with High and Low type DiNV. The D.innubila data presented here is a reconstruction of Figure 1B. (B) Proportion of D. azteca 2017, D. falleni and D. innubila 2017 CH population infected with High and Low type DiNV.
Tables
Table 1
Candidate viral SNPs associated with viral titer with associated genes and the functional category of that gene.
| SNP locus | Nearest gene | SNP functional annotation | Nearest gene functional annotation | p-value (FDR-corrected) |
|---|---|---|---|---|
| G14249T | 19K/PIF-4 | Non-synonymous | Per OS Infectivity factor envelope protein, required for oral infection | 3.49e-15 (4.89e-12) |
| C41210T | LEF-4 | Non-synonymous | RNA polymerase subunit for RNA modification | 7.99e-12 (1.12e-09) |
| G42389T | gp83 | Upstream | Suspected virulence factor which suppresses Toll activity | 6.73–14 (9.44e-11) |
| A59194G | gp51 | Intergenic | Suspected virulence factor | 2.96e-12 (4.15e-09) |
| C59275A | PIF-6 | Upstream | Per OS Infectivity factor envelope protein, required for oral infection | 1.65e-18 (2.31e-15) |
| T59276C | PIF-6 | Upstream | Per OS Infectivity factor envelope protein, required for oral infection | 1.65e-18 (2.31e-15) |
| G66615A | gp19 | Non-synonymous | Suspected virulence factor | 3.49e-15 (4.89e-12) |
| C78978T | gp94 | Intergenic | Suspected virulence factor | 5.93e-17 (8.32e-14) |
| G78991A | gp94 | Intergenic | Suspected virulence factor | 1.12e-16 (1.57e-13) |
| C126118A | ODV-E56-2 | Upstream | Occlusion-derived virus envelope protein required for particle formation | 1.43e-18 (2.01e-15) |
| A132593C | Helicase-2 | Non-synonymous | Unwinds DNA and is critical for DNA replication | 1.11e-09 (1.56e-06) |
| T140117C | PIF-3 | Upstream | Per OS Infectivity factor envelope protein, required for oral infection | 2.96e-15 (4.15e-12) |
Additional files
-
Supplementary file 1
Next-generation sequencing information of Drosophila infected with DiNV used in this survey.
Table 1: Summary of Drosophila innubila and D. azteca fly samples collected and sequenced for this study, table includes summary of coverage for X chromosome,, Muller B, other autosomes, virus and Wolbachia. Also contains SRA accessions for each strain. Table 2: Summary of Drosophila innubila fly RNA and DNA collected and sequenced for this study, including if infected with DiNV.
- https://cdn.elifesciences.org/articles/58931/elife-58931-supp1-v2.xlsx
-
Transparent reporting form
- https://cdn.elifesciences.org/articles/58931/elife-58931-transrepform-v2.docx
Download links
A two-part list of links to download the article, or parts of the article, in various formats.
Downloads (link to download the article as PDF)
Open citations (links to open the citations from this article in various online reference manager services)
Cite this article (links to download the citations from this article in formats compatible with various reference manager tools)
Recurrent evolution of high virulence in isolated populations of a DNA virus
eLife 9:e58931.
https://doi.org/10.7554/eLife.58931


