Size-dependent patterns of cell proliferation and migration in freely-expanding epithelia
- Department of Mechanical and Aerospace Engineering, Princeton University, United States
- Lewis-Sigler Institute for Integrative Genomics, Princeton University, United States
- Princeton Center for Theoretical Science, Princeton University, United States
- Princeton Institute for the Science and Technology of Materials (PRISM), Princeton University, United States
Figures
Figure 1 with 5 supplements
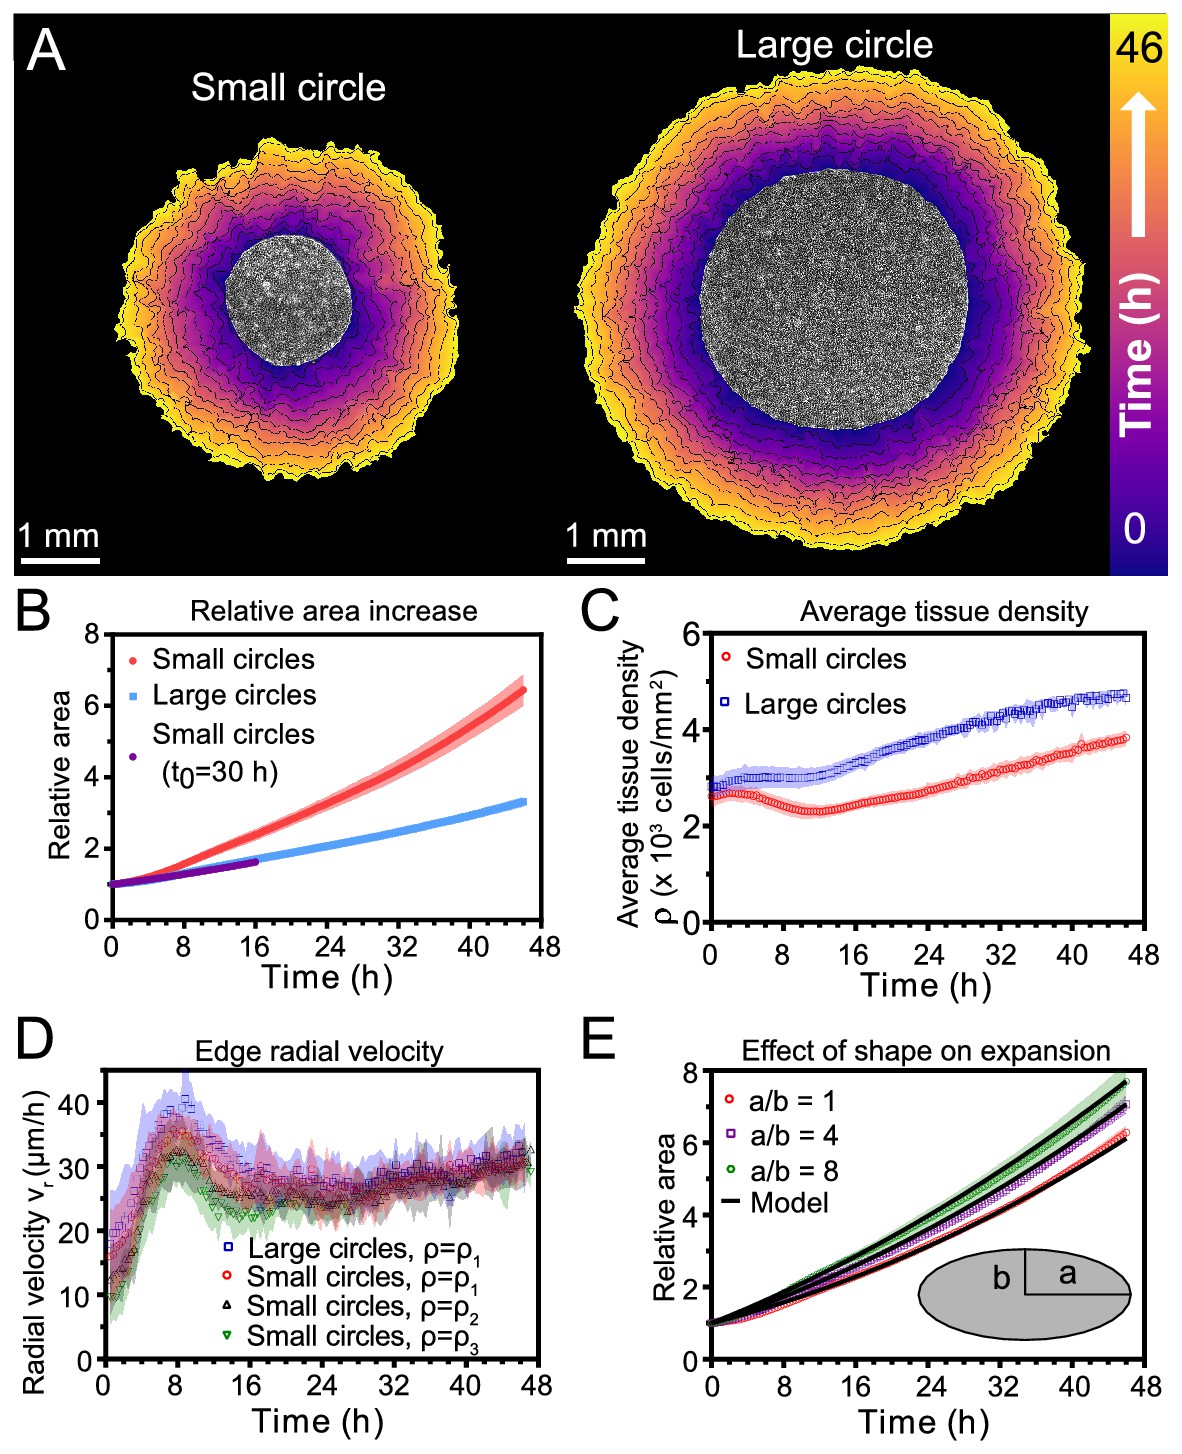
Expansion dynamics of millimeter-size cell monolayers.
(A) Footprint throughout 46 hr growth period of representative small (left) and large (right) circular tissues, with the tissue outlines drawn at 4 h increments. Initial diameters were 1.7 mm and 3.4 mm. (B) Small circles exhibit faster relative area, , increase than large circles, where A0 and are the areas of tissues at the beginning of the experiment and at time t, respectively. Purple points show the relative area increase, , of small tissues from the time h when they reached the size of the large circles. (C) Average tissue density has non-monotonic evolution in small tissues but monotonically increases in large tissues, where is the number of cells in a tissue at time t. (D) Edge radial velocity vr is largely independent of initial tissue size and cell density. We grouped initial cell densities as cells/mm2, cells/mm2, and cells/mm2. (E) Experimental data on tissue shape and model fits. Assuming a constant migration speed vn in direction normal to the edge, we can predict the area expansion dynamics of elliptical tissues with different aspect ratios. The model fits our data for all tissues with µm/hr, yielding normalized values of 0.79, 0.13, and 0.06 for aspect ratios of 8, 4, and 1 respectively (< 1 indicates a good fit; see Materials and methods). In B, data are from n = 16 tissues across five independent experiments (small and large circles). In C, n = 11 across four experiments for small circles, and n = 9 across three experiments for large circles. In D, n = 16 across five independent experiments for small and large circles, ; n = 13 across three experiments for small circles, ; and n = 11 across three experiments for small circles, . In E, n = 4 across two experiments for a/b = 1 and a/b = 4, and n = 5 across two experiments for a/b = 8. Shaded regions correspond to standard deviations.
Figure 1—figure supplement 1
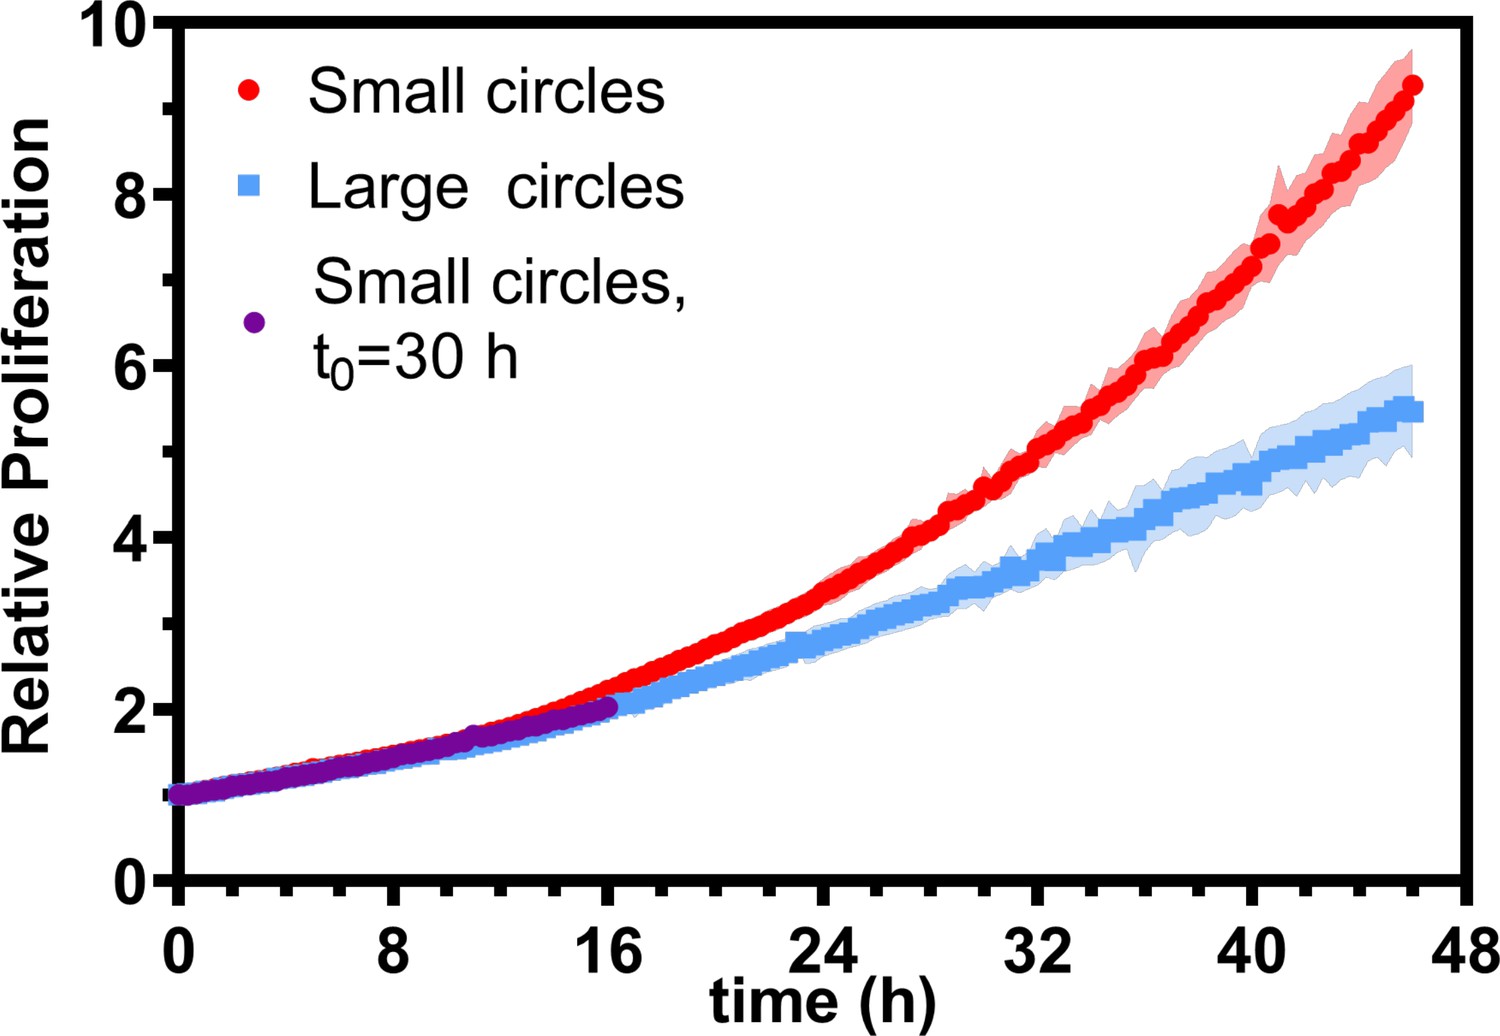
Relative proliferation in small and large tissues.
Relative proliferation for small and large tissues. Purple points show the relative proliferation, , of small tissues from the time t0 when they reached the starting size of the large circles. Error bars for purple points are smaller than marker size. Data are from 16 tissues across five independent experiments for small and large tissues. .
Figure 1—figure supplement 2
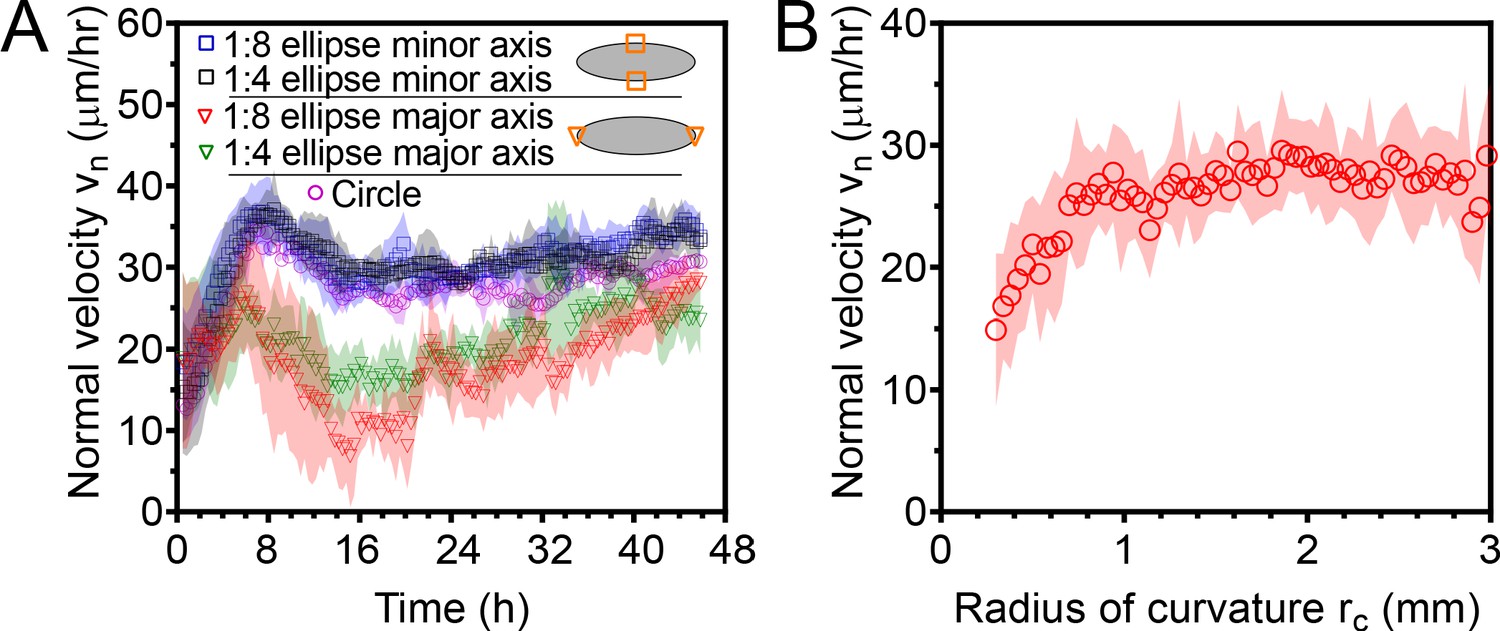
Normal edge velocity vn of elliptical tissues at the major and minor axes.
(A) Elliptical tissues spread with different normal velocities along their major and minor axes. Data are from elliptical tissues with the same initial area than small circular tissues. (B) Normal expansion velocity is roughly independent of the local radius of curvature rc of the tissue edge for large radii of curvature. For radii of curvature smaller than ∼1 mm, the normal velocity decreases with decreasing rc. This plot includes data both from circular tissues and from the major and minor axes of elliptical tissues, excluding the first 16 hr of expansion to eliminate any affects from initial front acceleration. See Materials and methods for calculation of rc. .
Figure 1—video 1
Movie of expansion of representative small and large tissues in phase-contrast.
Figure 1—video 2
Finger-like protrusions emerge in the first 20 hr of tissue expansion.
Figure 1—video 3
Expansion of sample elliptical cell monolayers with varying aspect ratios.
Figure 2 with 1 supplement
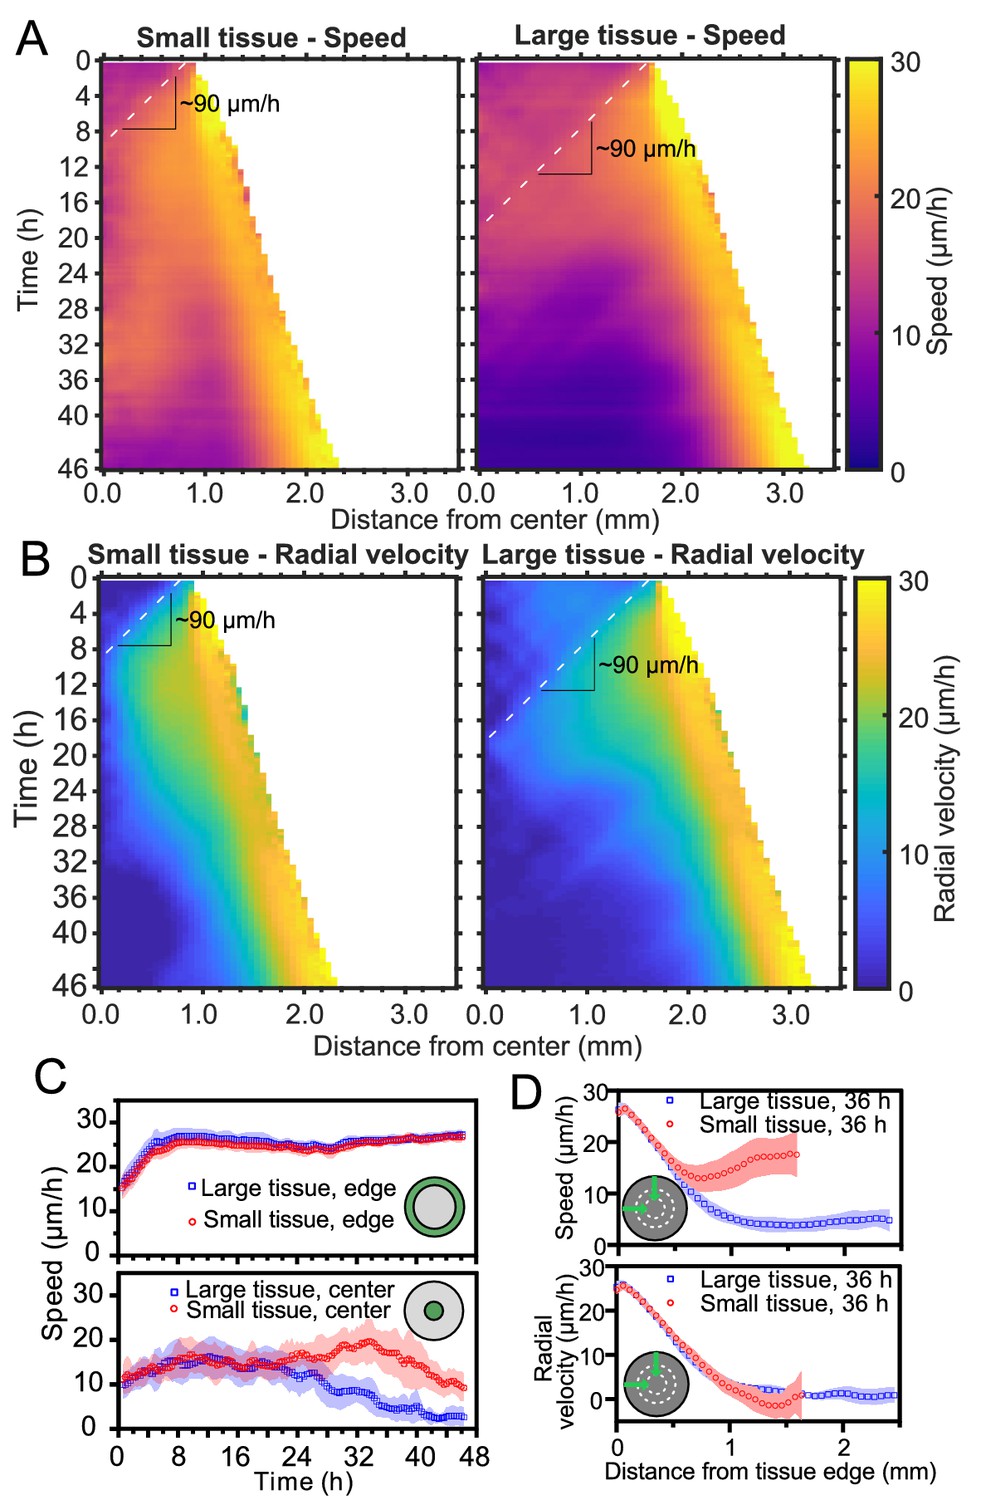
Speed and radial velocity in inner and outer tissue zones.
(A,B) Average kymographs of (A) speed and (B) radial velocity vr throughout expansion for small (left) and large (right) tissues. (C) Evolution of the average speed of boundary (top) and center (bottom) zones, defined as regions extending ∼200 μm from the tissue center and tissue edge, respectively. This width of the zones corresponds approximately to the velocity-velocity correlation length for MDCK cells (Petitjean et al., 2010). While the speed in the edge zone remains high in both small and large tissues, the speed in the center zone begins to decrease ∼24 hr sooner in large tissues than in small tissues, as the central zone of the small tissues has particularly high speed from 18 to 36 hr. (D) Profiles of speed (top) and radial velocity (bottom) at 36 hr, from the edge of the tissue inwards. Arrows indicate that the tissues are indexed from the edge of the tissue inwards. All data are from n = 16 tissues across five independent experiments (small and large circles). Speed and radial velocity profiles of large and small tissues match closely for the first 500 μm from the tissue edge. The average difference between the profiles in this zone is 0.39 μm/h (speed) and 0.27 μm/h (radial velocity), respectively, while the smallest standard deviation for any point in either profile is 0.56 μm/h.
Figure 2—figure supplement 1
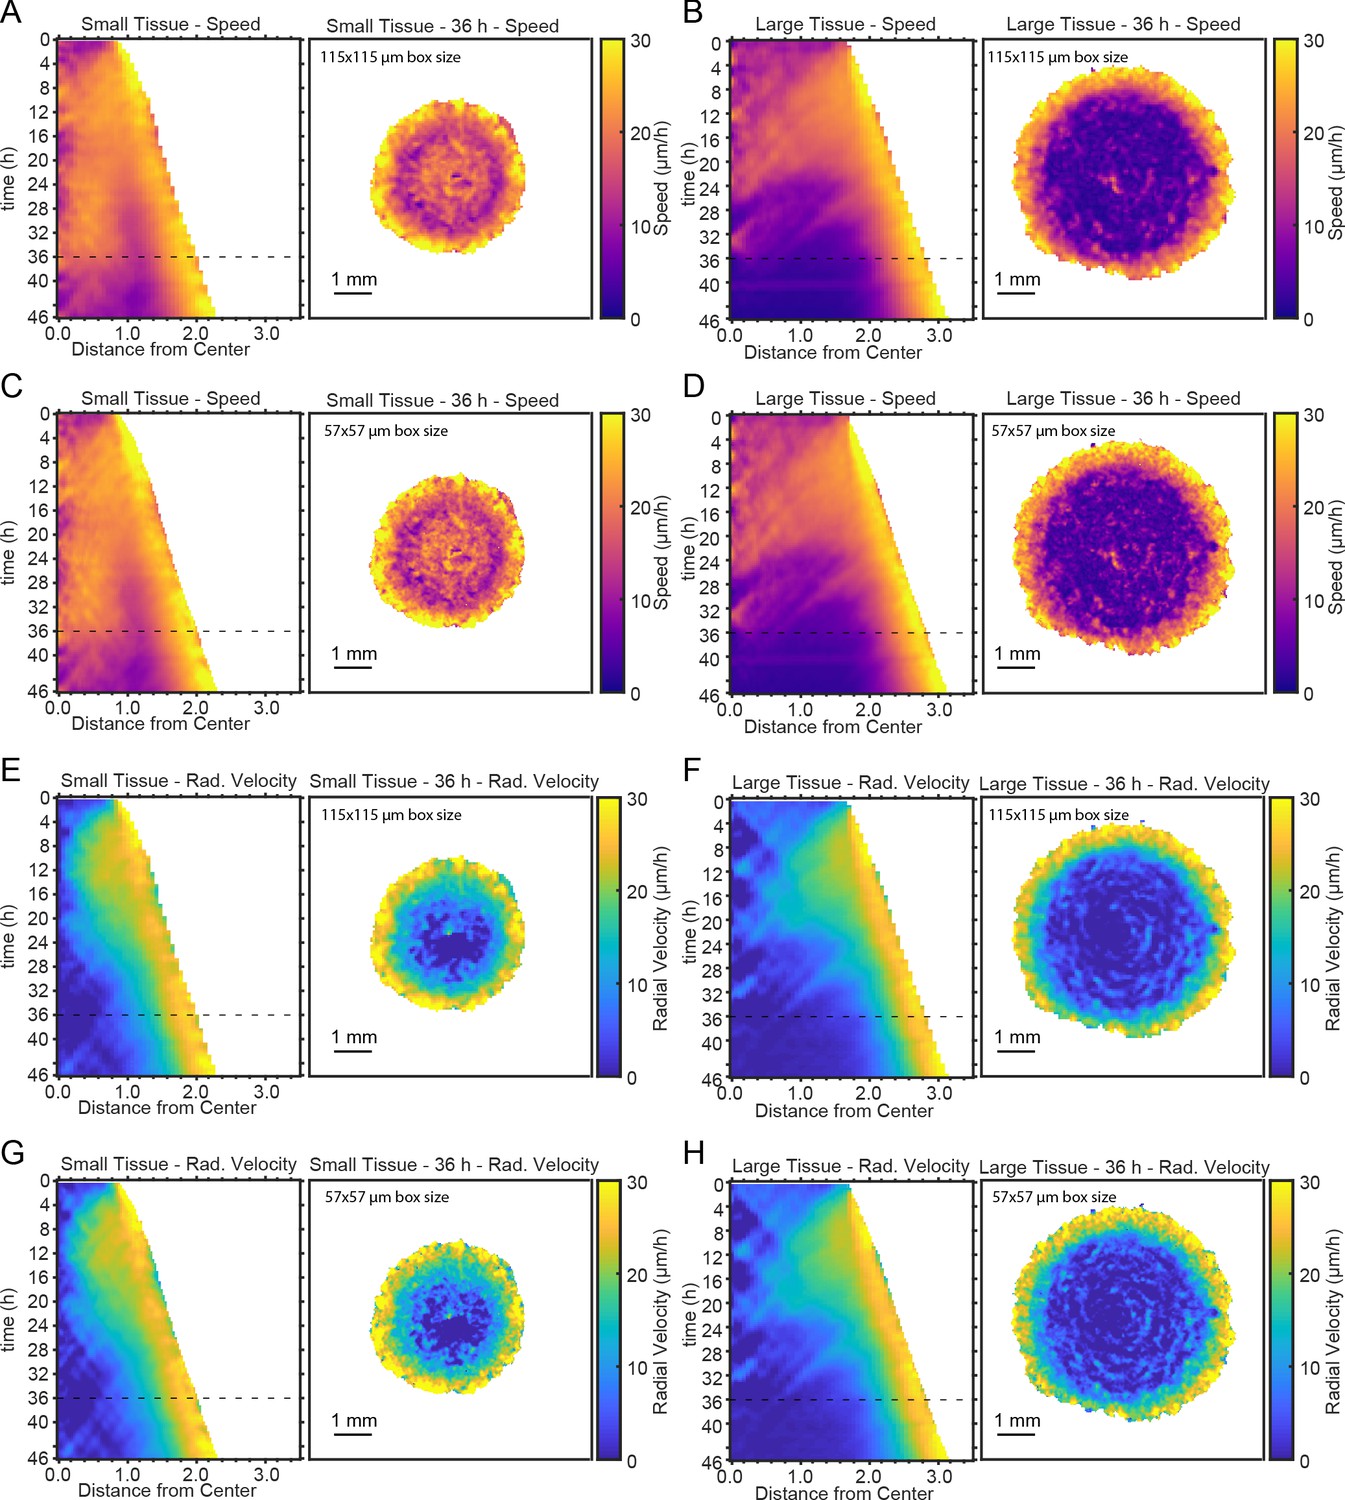
Representative kymographs and heatmaps for speed and radial velocity.
Representative kymographs and heatmaps for speed (A–D) and radial velocity (E–H) for different choices of PIV window size (see Materials and methods). Panels A,B,E,F were obtained using a PIV window of 115—115 μm, as in Figure 2. Panels C,D,G,H were obtained using a PIV window of 57—57 μm, which contains four times fewer pixels than the larger window of panels A,B,E,F. Dashed lines indicate timepoint of 36 hr to which heatmaps correspond. Kymographs and heatmaps in each column are from the same representative tissue.
Figure 3 with 5 supplements

Vortex formation in expanding tissues.
(A) Vortical flows seen from 10 hr traces of cell trajectories in small (left) and large (right) tissues. We color each trajectory according to its local orientation. (B) Growth rate of perturbations of wave vector modulus q around the unpolarized state of the tissue bulk, Equation 3. Perturbations with wavelength longer than grow (), leading to large-scale spontaneous flows in the tissue bulk. We show curves for the following values of the polarity-velocity coupling parameter: mm−1. For the remaining parameters, we took Pa/μm, Pa⋅s/μm2, MPa⋅s, kPa⋅s, Pa, nN, as estimated in Pérez-González et al., 2019. (C) Average kymographs of vorticity show that the vortex in small tissues appears in the center and expands to >1 mm (n = 16), while vorticity in large tissues is present only during the early stages of tissue expansion (n = 16). The black bars indicate a characteristic vortex size. (D) Characteristic vortex size (marker size), time (horizontal axis), and intensity (vertical axis) of each tissue’s maximal vortex intensity. Small tissue vortices are generally more intense, with . (E) For small tissues, the time of maximal vortex intensity decreases with the initial cell density.
Figure 3—figure supplement 1
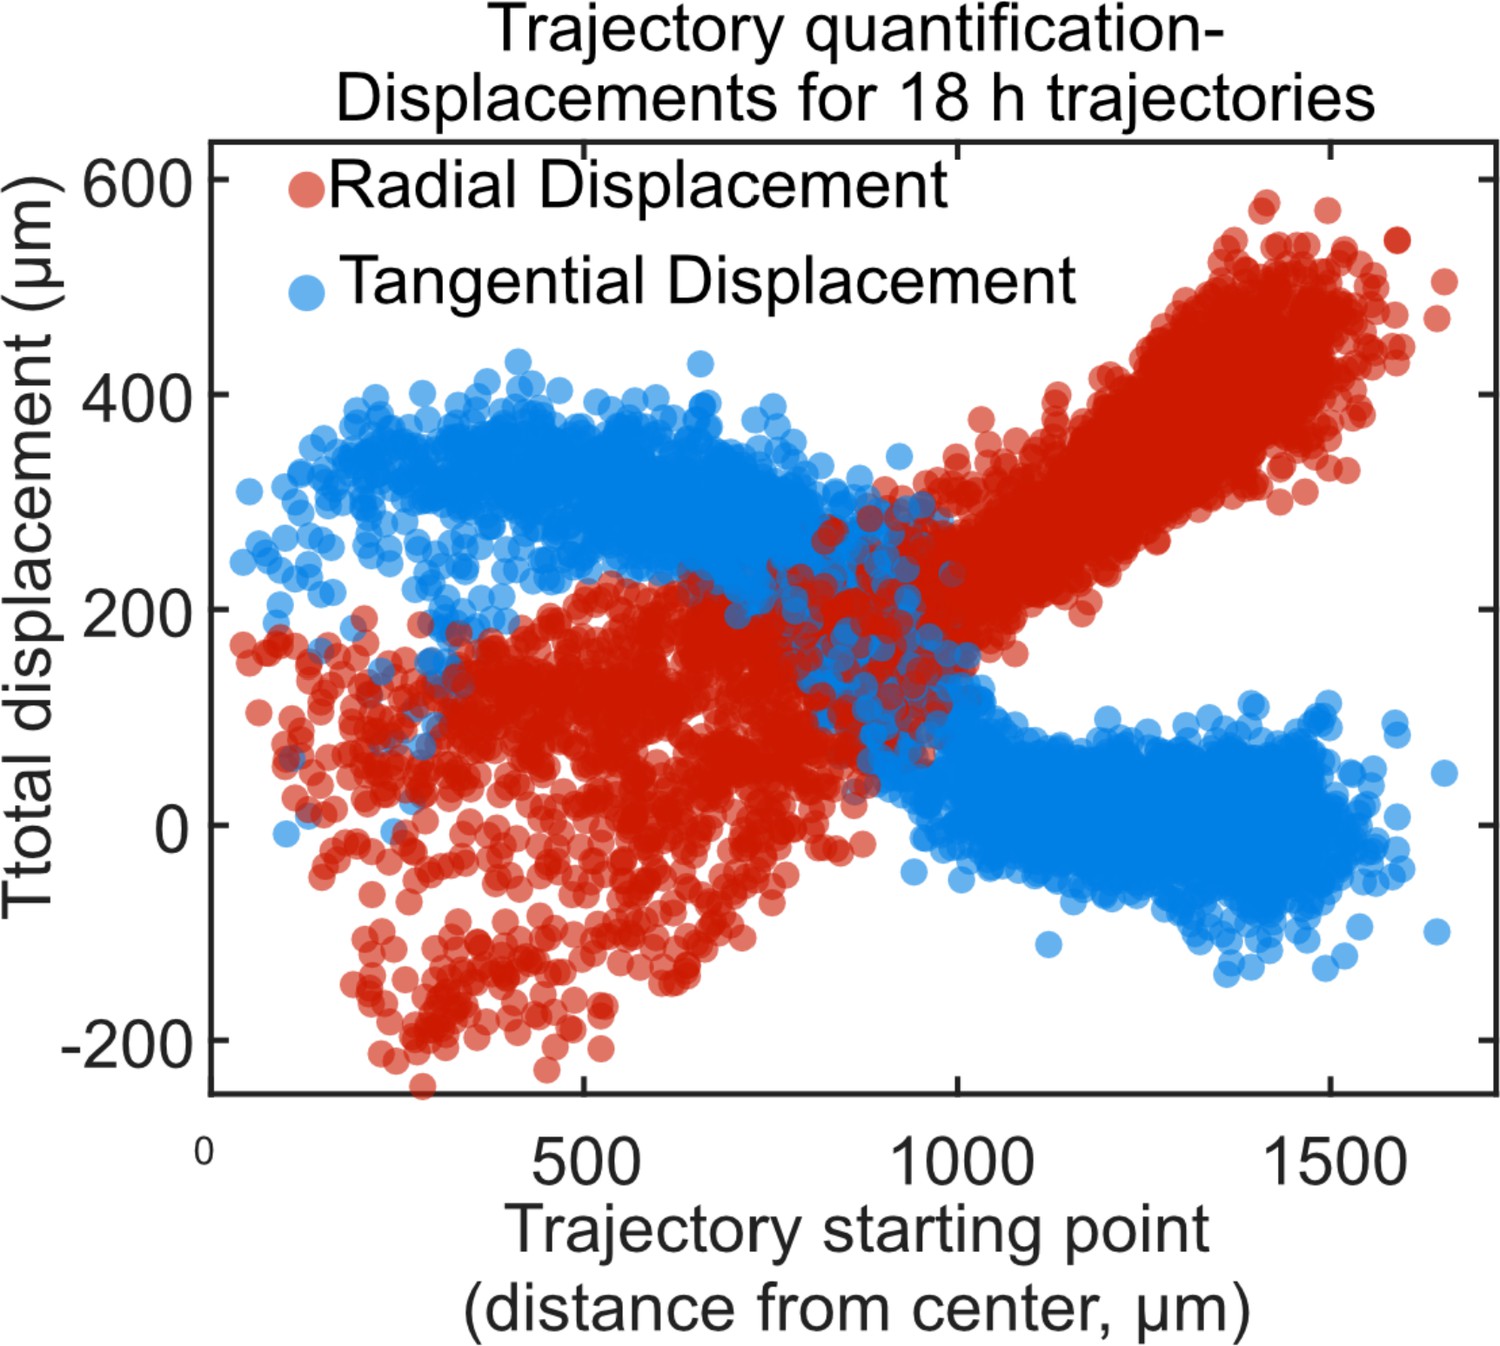
Trajectory displacement quantification of vortex.
Radial and tangential displacements of 18 h cell trajectories for a representative small tissue as a function of the initial radial position of each cell trajectory. Trajectories were selected from the vortex-dominated period of 24–42 hr. The tangential displacement (blue markers) most clearly reveals the presence of the vortex, with 350 μm tangential displacement throughout the central 750 μm of the tissue. At the outer zone, tangential displacements drop to 0 μm. In contrast, radial displacement (red markers) increases roughly linearly from the center to the outer edge of the tissue, with no sharp change when moving from the central to the outer region. The fact that radial displacements are largely insensitive to the vortical flows explains why the presence of a vortex has no noticeable impact on the overall expansion of the tissue. Together, the radial and tangential displacements of the tissue reveal a spiraling vortical flow that combines tangential shear with radial expansion.
Figure 3—figure supplement 2
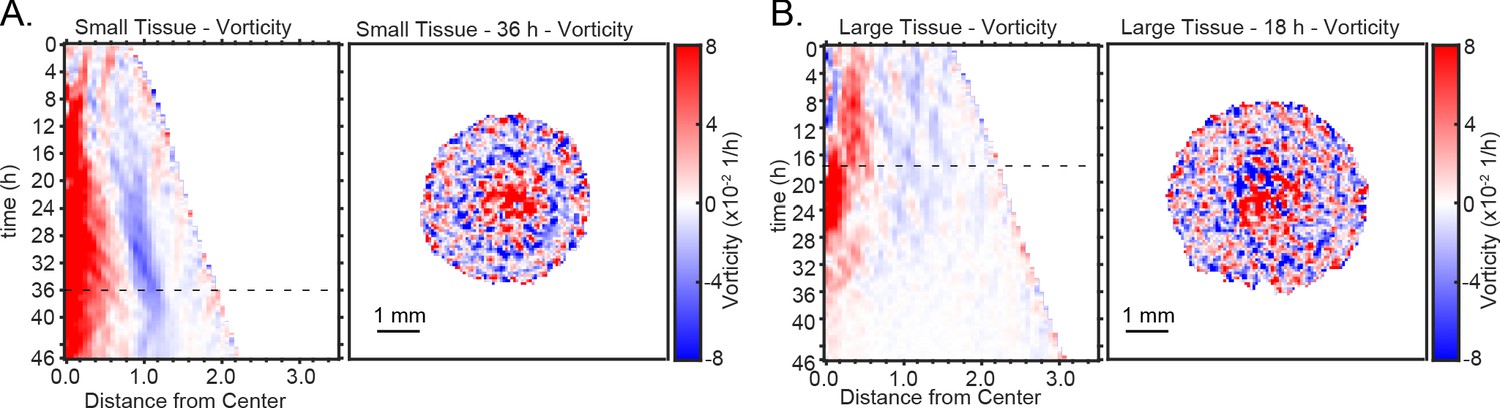
Representative kymographs and heatmaps of vorticity.
Representative kymograph and heatmap of vorticity for (A) small and (B) large tissues.
Figure 3—figure supplement 3
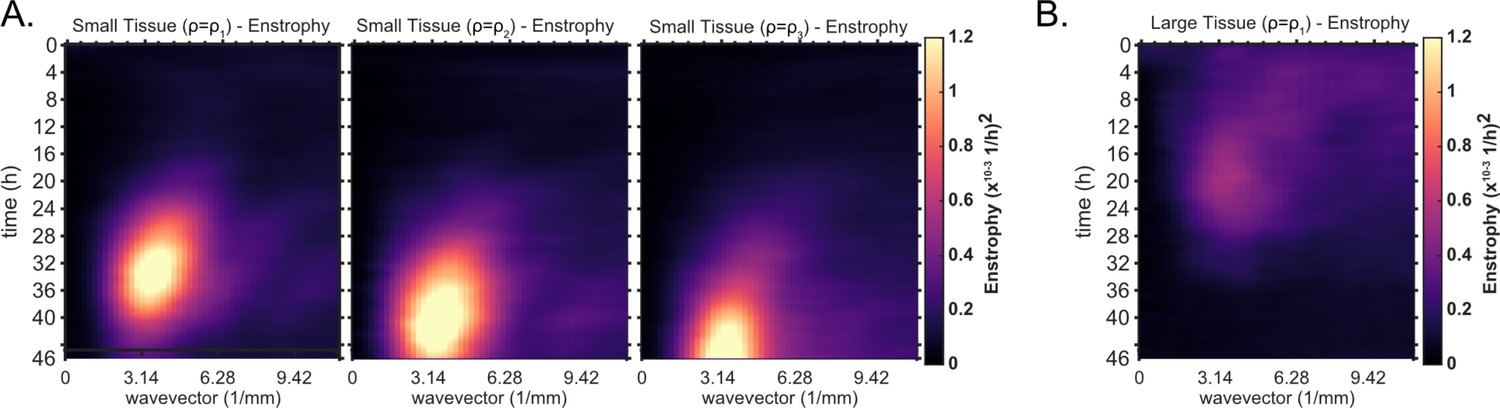
Kymographs of enstrophy for small tissues of varying density and large tissues.
Averaged kymographs of enstrophy, which partition the vorticity power in modes of different wavelengths for each timepoint. (A) From left to right, enstrophy kymographs of small tissues for decreasing starting density. Initial densities were grouped as in Figure 1D. Decreasing starting density clearly delays the onset of high power, long wavelength (small wavevector) vorticity. Small tissue enstrophy peaks at a wavevector of , which corresponds to a wavelength of 2 mm. Data from n = 16 tissues for (left); n = 13 tissues for (middle); and n = 11 tissues for (right). (B) Average kymograph of enstrophy for large tissues (, n = 16). The peak at large wavelength is not evident since the vortex is not as prevalent in large tissues. The initial cell density ranges , , and are the same as in Figure 1D.
Figure 3—video 1
Vortex formation in a sample small expanding tissue from t = 22 hr to 40 hr of expansion.
Left panel shows phase-contrast microscopy of an expanding monolayer. Right panel draws the trajectories of individual cells as they evolve through time.
Figure 3—video 2
Vortex formation in a sample large expanding tissue from t = 12 hr to 30 hr of expansion.
Left panel shows phase-contrast microscopy of an expanding monolayer. Right panel draws the trajectories of individual cells as they evolve through time.
Figure 4 with 1 supplement
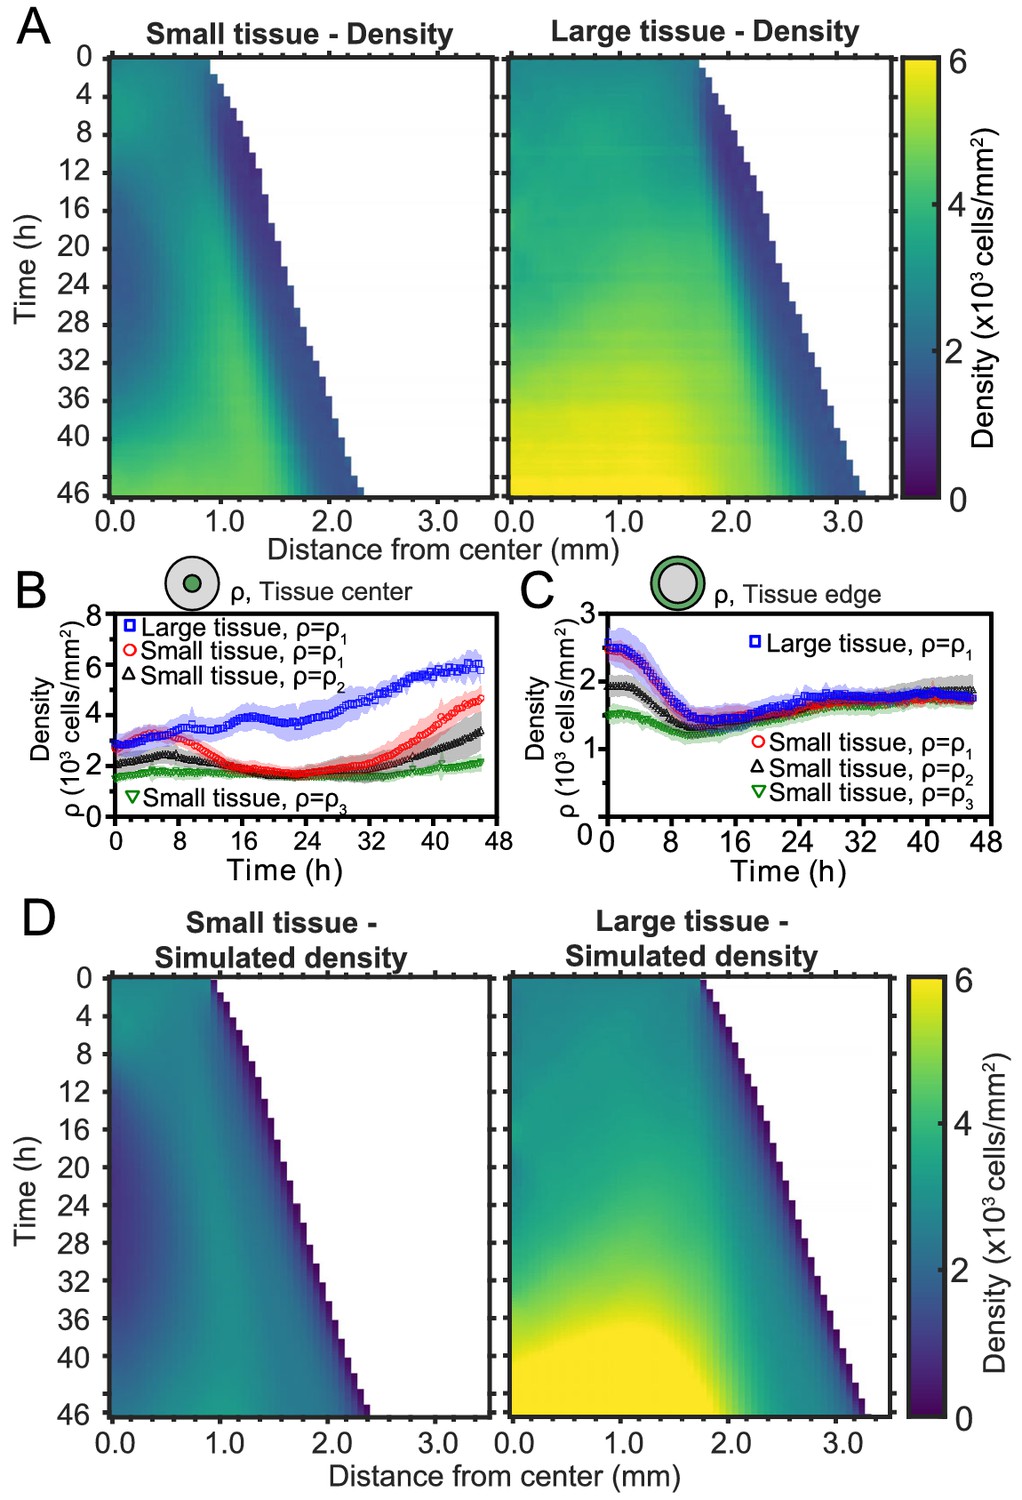
Spatiotemporal dynamics of cell density during epithelial expansion.
(A) Averaged kymographs of cell density for small (left, n = 11) and large (right, n = 9) tissues. Small tissues develop a central low-density region that persist more than 20 hr. (B) Cell density, ρ, at the center of large tissues increases gradually, while cell density at the center of small tissues has non-monotonic evolution. (C) For different initial tissue sizes and densities, the evolution of the cell density, ρ, at the boundary zone converges to similar values at about 12 hr, which coincides with the end of the overshoot of edge radial velocity in Figure 1D. Center and boundary zones are defined as in Figure 2B. (D) Simulated evolution of cell densities obtained from the numerical solution of the continuity equation using the average radial velocity measurements (Figure 2B) and a uniform and constant cell proliferation rate corresponding to a 16 h cell doubling time. In (B,C) the initial cell density ranges and number of replicates , , and are the same as in Figure 1D.
Figure 4—figure supplement 1
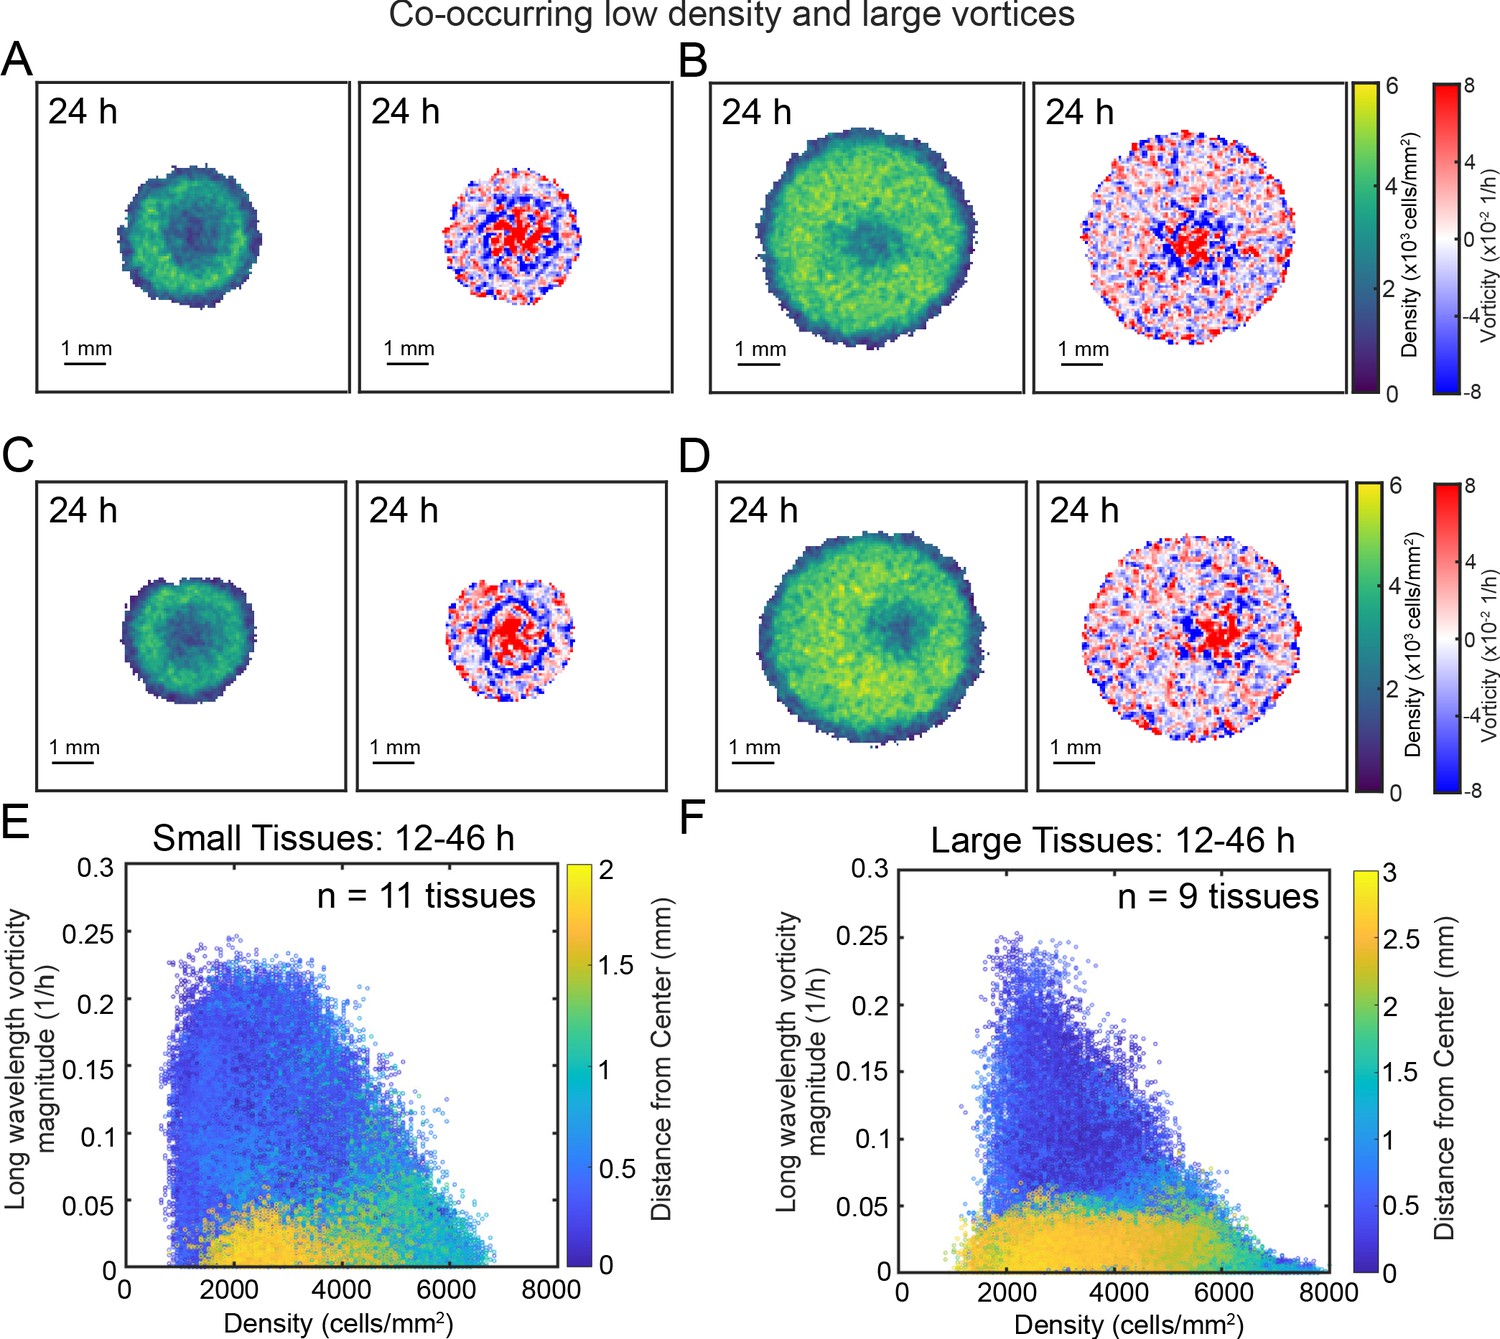
Large vortices co-occur with regions of low cell density.
A region of low cell density co-occurs with the vortex in representative small and large tissues, centered and off-centered. Representative tissues include small tissues with vortex/low density region in the center-right (A) and center (B) as well large tissues with vortex/low density region the center (C) and right-of-center (D). In both small (E) and large (F) tissues, high-vorticity large-scale flows (high values on the vertical axis) tend to occur close to the center of the tissue, and in regions of low cell density. In panels (E) and (F), marker color indicates the distance of each point relative to the center of the tissue. For data analysis details, see Methods.
Figure 5 with 2 supplements
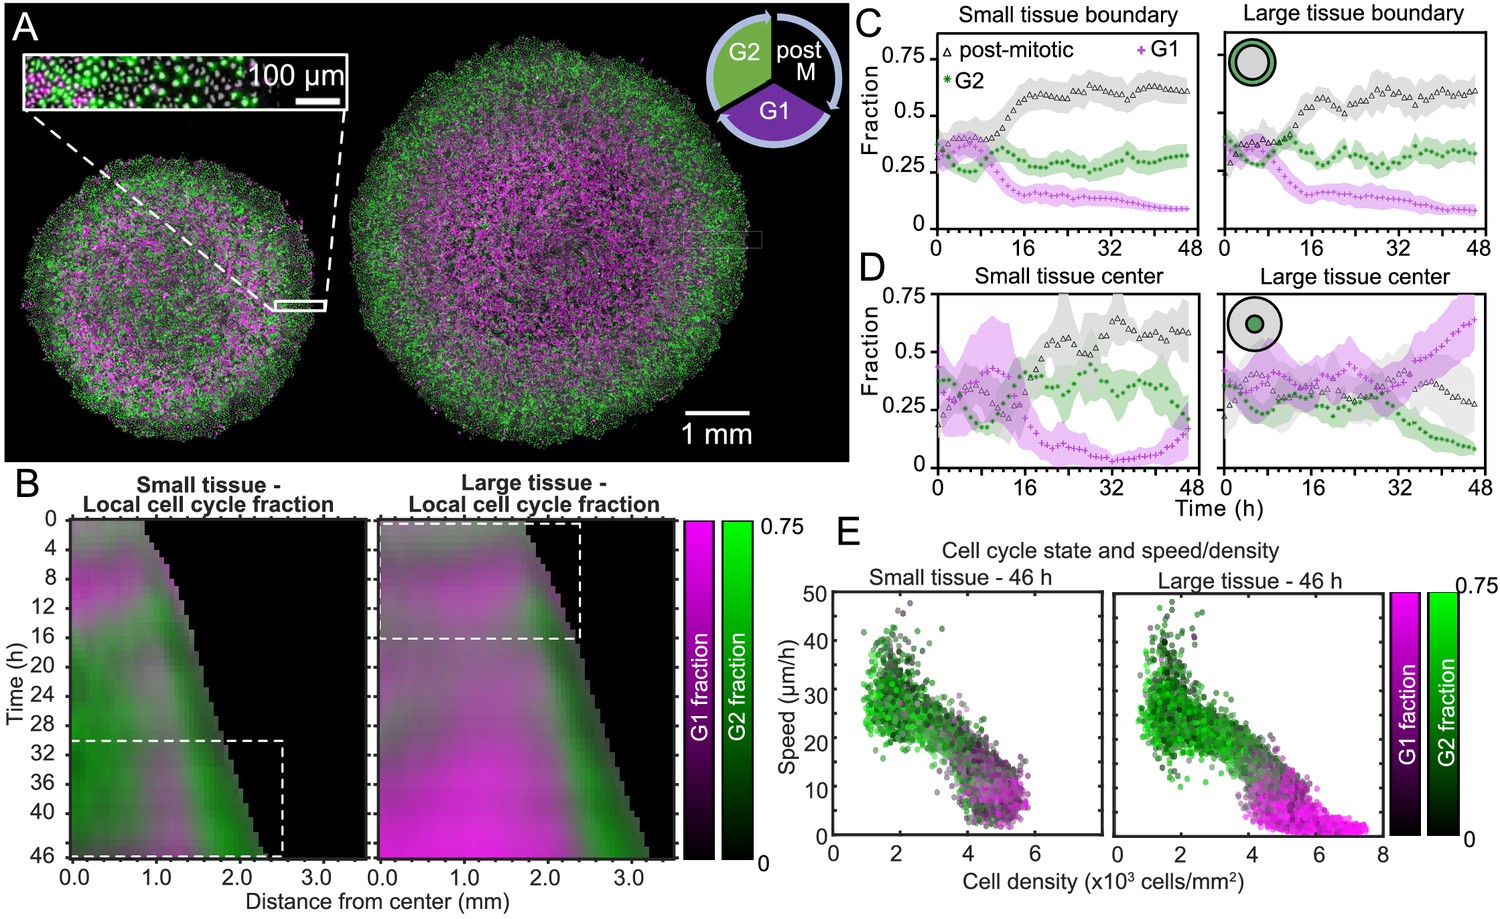
Coordinated spatiotemporal cell-cycle dynamics.
Transition from the G1 (magenta) to the G2 (green) phase of the cell cycle corresponds to DNA replication (during S phase). Subsequently, a cell proceeds to mitosis (M phase, dark), and eventually back to the G1 phase upon cell division. (A) Fluorescence images of the Fucci marker of cell-cycle state at the end of the experiment (46 hr) of representative small and large tissues overlaid with nuclei positions (gray). The boundary zone of both tissues has more cells in the G2 than in the G1 phase, along with a substantial proportion of dark cells (inset). Scale bars 1 mm. (B) Average kymographs (small, n = 5; large, n = 11) of cell-cycle-state fraction. In small tissues, a G1-dominated transition zone, which appears as a vertical magenta streak from 16 hr onward, is interposed between G2-dominated center and edge zones. While the size of small tissues from 30 to 46 hr matches that of large tissues from 0 to 16 hr (dashed boxes), cell-cycle states between these times are clearly distinct. (C) Fraction of cell-cycle states in the boundary zone. (D) Fraction of cell-cycle states in the center zone. Center and boundary zones are defined as in Figure 2. For C and D, n = 5 for small tissues and n = 11 for large tissues. (E) Scatter plot of density and speed, with color indicating the fraction of cells at G1 and G2, corresponding to each PIV pixel of the final timepoint of a representative small (left) and large (right) tissue.
Figure 5—figure supplement 1
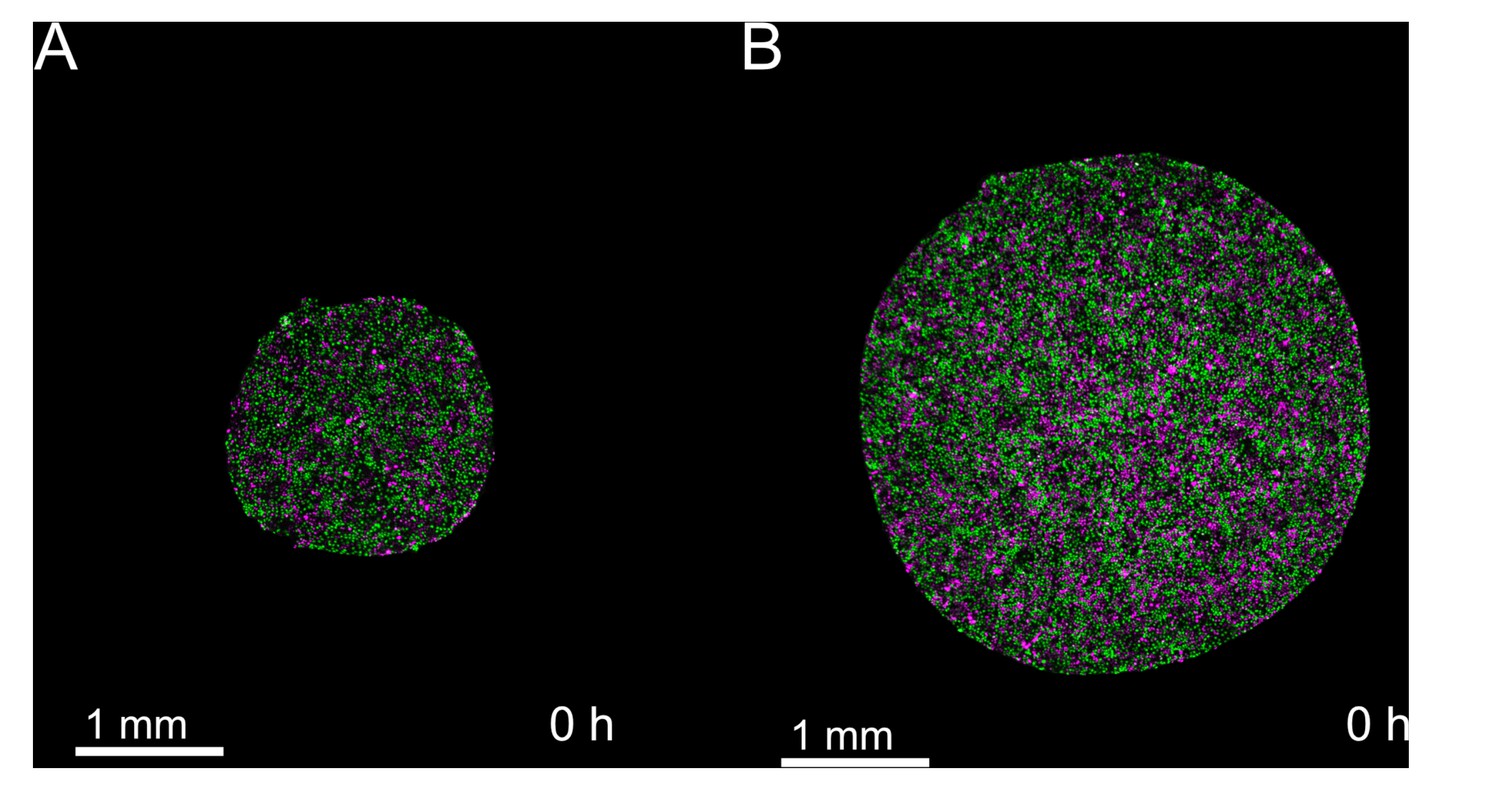
Snapshots of cell cycle at t = 0 hr show tissue cell cycle is well-mixed at the time of stencil removal.
Cells within both small and large tissues are actively cycling at the time of stencil removal. (A) Initial timepoint of representative small tissue. (B) Initial timepoint of representative large tissue. .
Figure 5—video 1
Coordinated spatiotemporal cell-cycle dynamics in expanding monolayers.
Time-lapse fluorescence microscopy of the FUCCI marker for cell-cycle state as the monolayers expand for a small (left) and large (right) tissue over a 48 hr period. Cells in G1 phase are magenta and cells in G2 phase are green.
Figure 6
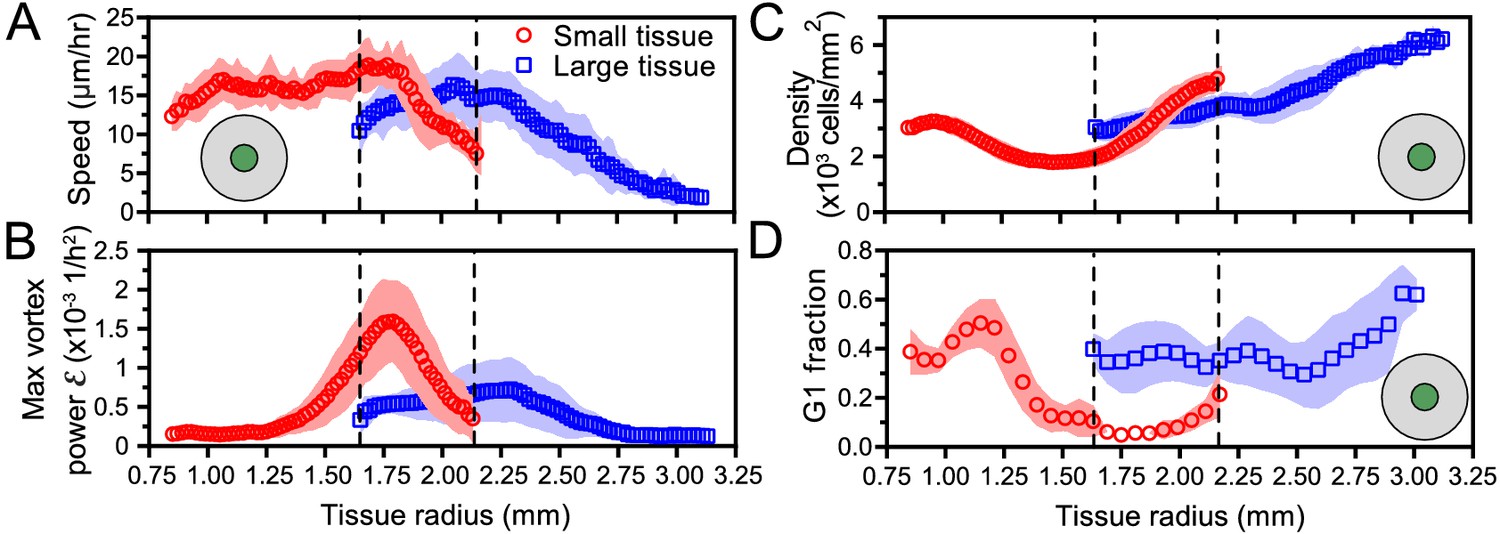
Initial tissue size, rather than current tissue size, determines the internal dynamics of expanding epithelia.
Here, we quantify the internal state of the tissue in terms of the cell speed in tissue center (A), maximal vortex power (B), cell density in tissue center (C), and fraction of cells in the G1 phase of the cell cycle in tissue center (D). At late times, initially-small tissues reach radii that initially-large tissues had at early times. When they have the same current size (overlap region in between dashed lines), initially-small and initially-large tissues have distinct internal dynamics of cell migration and cell proliferation. The tissue center zone in A, C, and D was defined as in Figure 2.
Tables
Key resources table
| Reagent type (species) or resource | Designation | Source or reference | Identifiers | Additional information |
|---|---|---|---|---|
| Cell line (canine) | MDCK-FUCCI | Streichan et al., 2014. Wildtype: ECACC-00062107 | N/A | RFP signal is G1, GFP is G2. |
| Other | DMEM - low glucose | Sigma-Aldrich, Inc | Cat.D5523 | |
| Other | fetal bovine serum | Atlanta Biologicals | Cat.S11550 | |
| Other | Silicone stencil material, 250 µm thick. | Stockwell Elastomerics | Cat.HT6240-40D | Tissue patterning material |
| Software, algorithm | FIJI | NIH ImageJ Project | ||
| Software, algorithm | MATLAB | Mathworks, Inc | 2019A | All code compatible back to at least 2015B |
| Software, algorithm | Machine Learning Tools | Laboratory code LaChance and Cohen, 2020 | —see References | Full code on GitHub |
Additional files
Download links
A two-part list of links to download the article, or parts of the article, in various formats.
Downloads (link to download the article as PDF)
Open citations (links to open the citations from this article in various online reference manager services)
Cite this article (links to download the citations from this article in formats compatible with various reference manager tools)
Size-dependent patterns of cell proliferation and migration in freely-expanding epithelia
eLife 9:e58945.
https://doi.org/10.7554/eLife.58945


