Genetic and environmental determinants of variation in the plasma lipidome of older Australian twins
- Centre for Healthy Brain Ageing, School of Psychiatry, Faculty of Medicine, University of New South Wales, Australia
- Neuroscience Research Australia, Australia
- The University of Adelaide, Adelaide Medical School, Discipline of Psychiatry, Australia
- Department of Psychiatry, University of Münster, Germany
- Department of Psychiatry, Melbourne Medical School, The University of Melbourne, Australia
- The Florey Institute of Neuroscience and Mental Health, The University of Melbourne, Australia
- Mathematics and Statistics, Murdoch University, Australia
- Brain and Mind Centre, The University of Sydney, Australia
- School of Medical Sciences, University of New South Wales, Australia
- Queensland Brain Institute, University of Queensland, Australia
- Centre for Advanced Imaging, University of Queensland, Australia
- University of Melbourne Academic Unit for Psychiatry of Old Age, Australia
- National Ageing Research Institute, Australia
- Bioanalytical Mass Spectrometry Facility, University of New South Wales, Australia
- Neuropsychiatric Institute, Euroa Centre, Prince of Wales Hospital, Australia
Figures
Figure 1 with 1 supplement
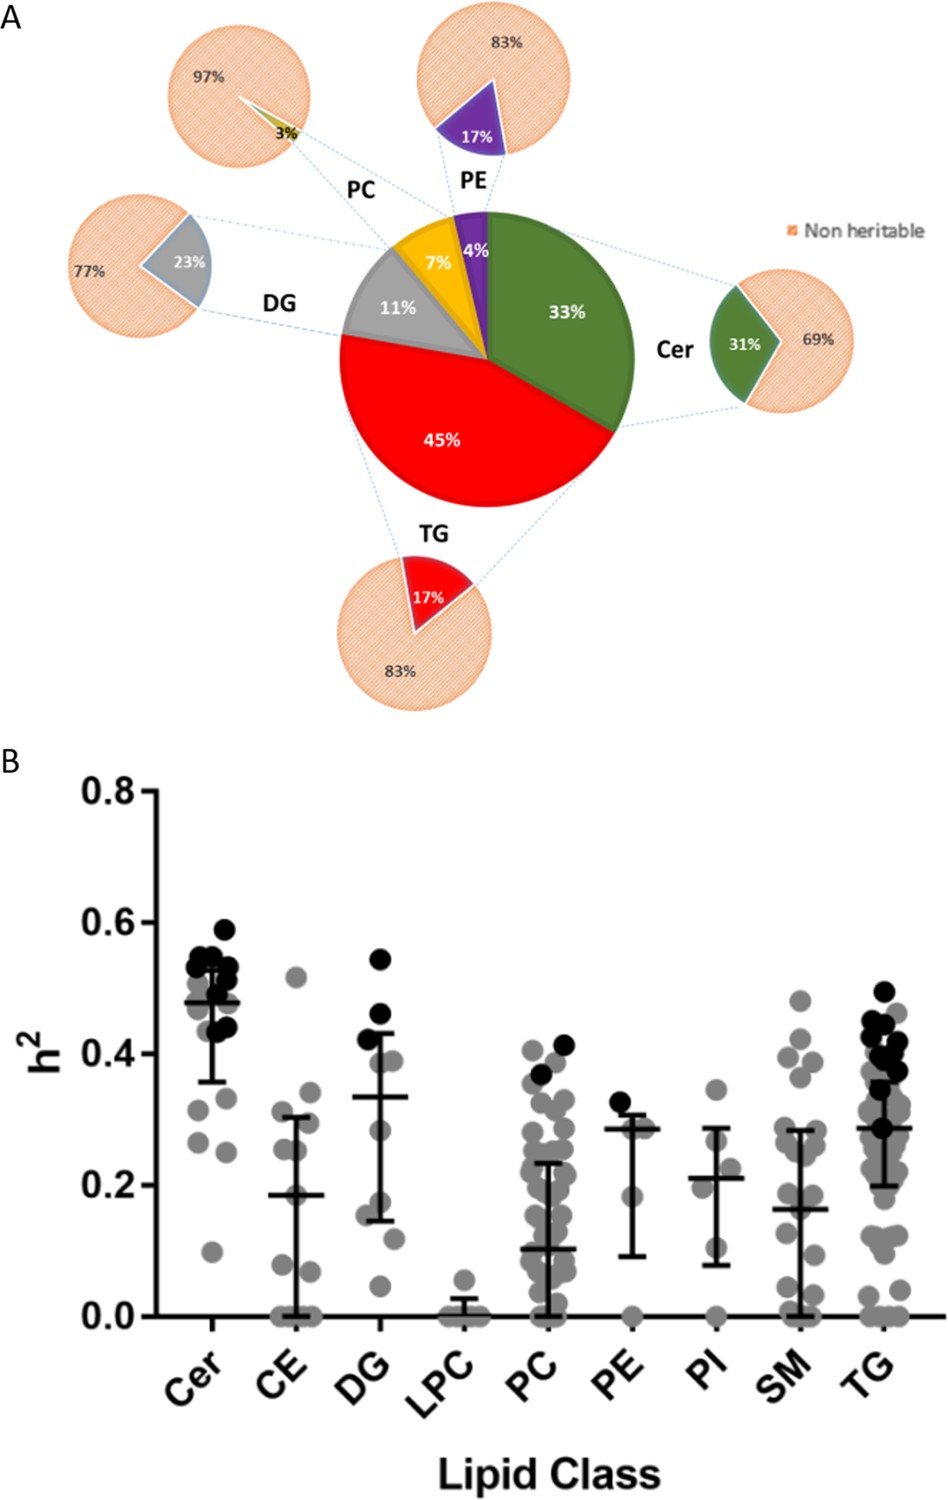
Heritability of lipids.
(A) Percentage distribution of heritable lipids. The central wheel represents significantly heritable lipids and their percentage distribution by lipid class. Smaller wheels emanating from each sector represent proportions of these heritable lipids compared to total measured lipids of that class, such that the sum of these smaller wheels equals the total pool of 207 individual lipids measured. For example, 45% of significantly heritable lipids belonged to the TG lipid class, and these heritable lipids represented 17% of total measured plasma TG. Orange sectors represent non-heritable percentage of each lipid class. (B) The distribution of heritability (h2), estimated from the ACE model, for each individual lipid species grouped according to class. Boxplots show median with interquartile range for each class. Dark circles represent heritable lipids, as opposed to grey circles, which represent lipids that were not significantly heritable. Minimum (significant) heritability is h2 >0.287.
Figure 1—figure supplement 1
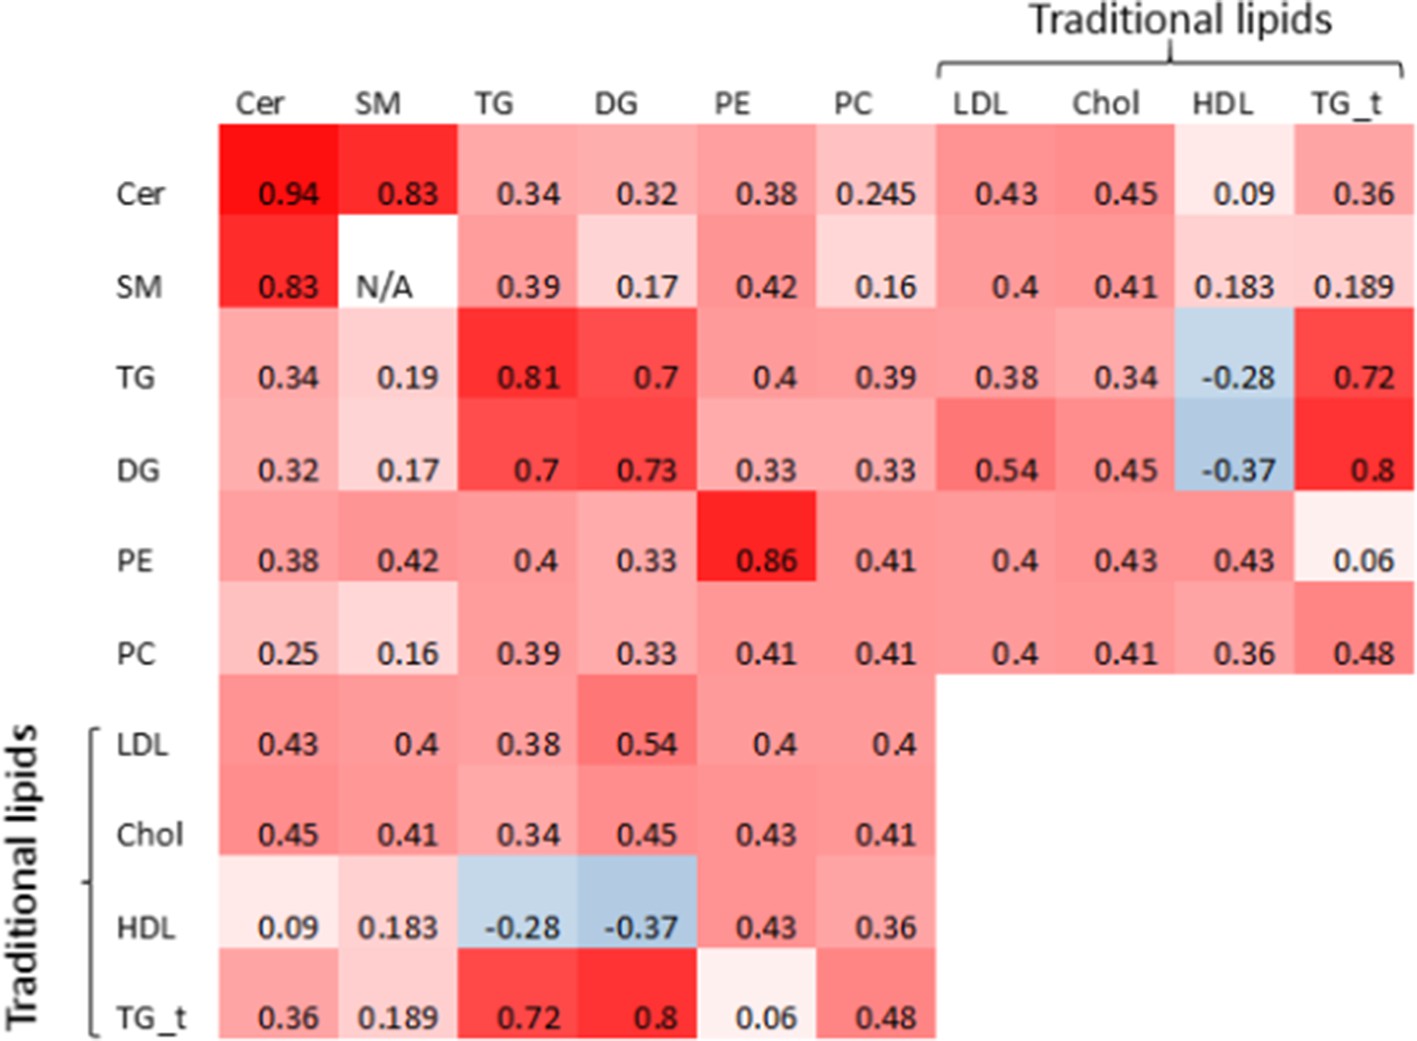
Genetic correlation heatmap.
Genetic correlation matrix heatmap. Values represent the median of genetic correlations taken between combinations of heritable lipid species of one lipid class with lipid species of another class (or the same class). Note SM represents the sum of SM with a single double bond, thus no correlation could be computed for SM with itself. TG_t represents triglycerides referred to as a traditional lipid measure (as opposed to individual species measured by mass spectrometry).
Figure 2 with 1 supplement
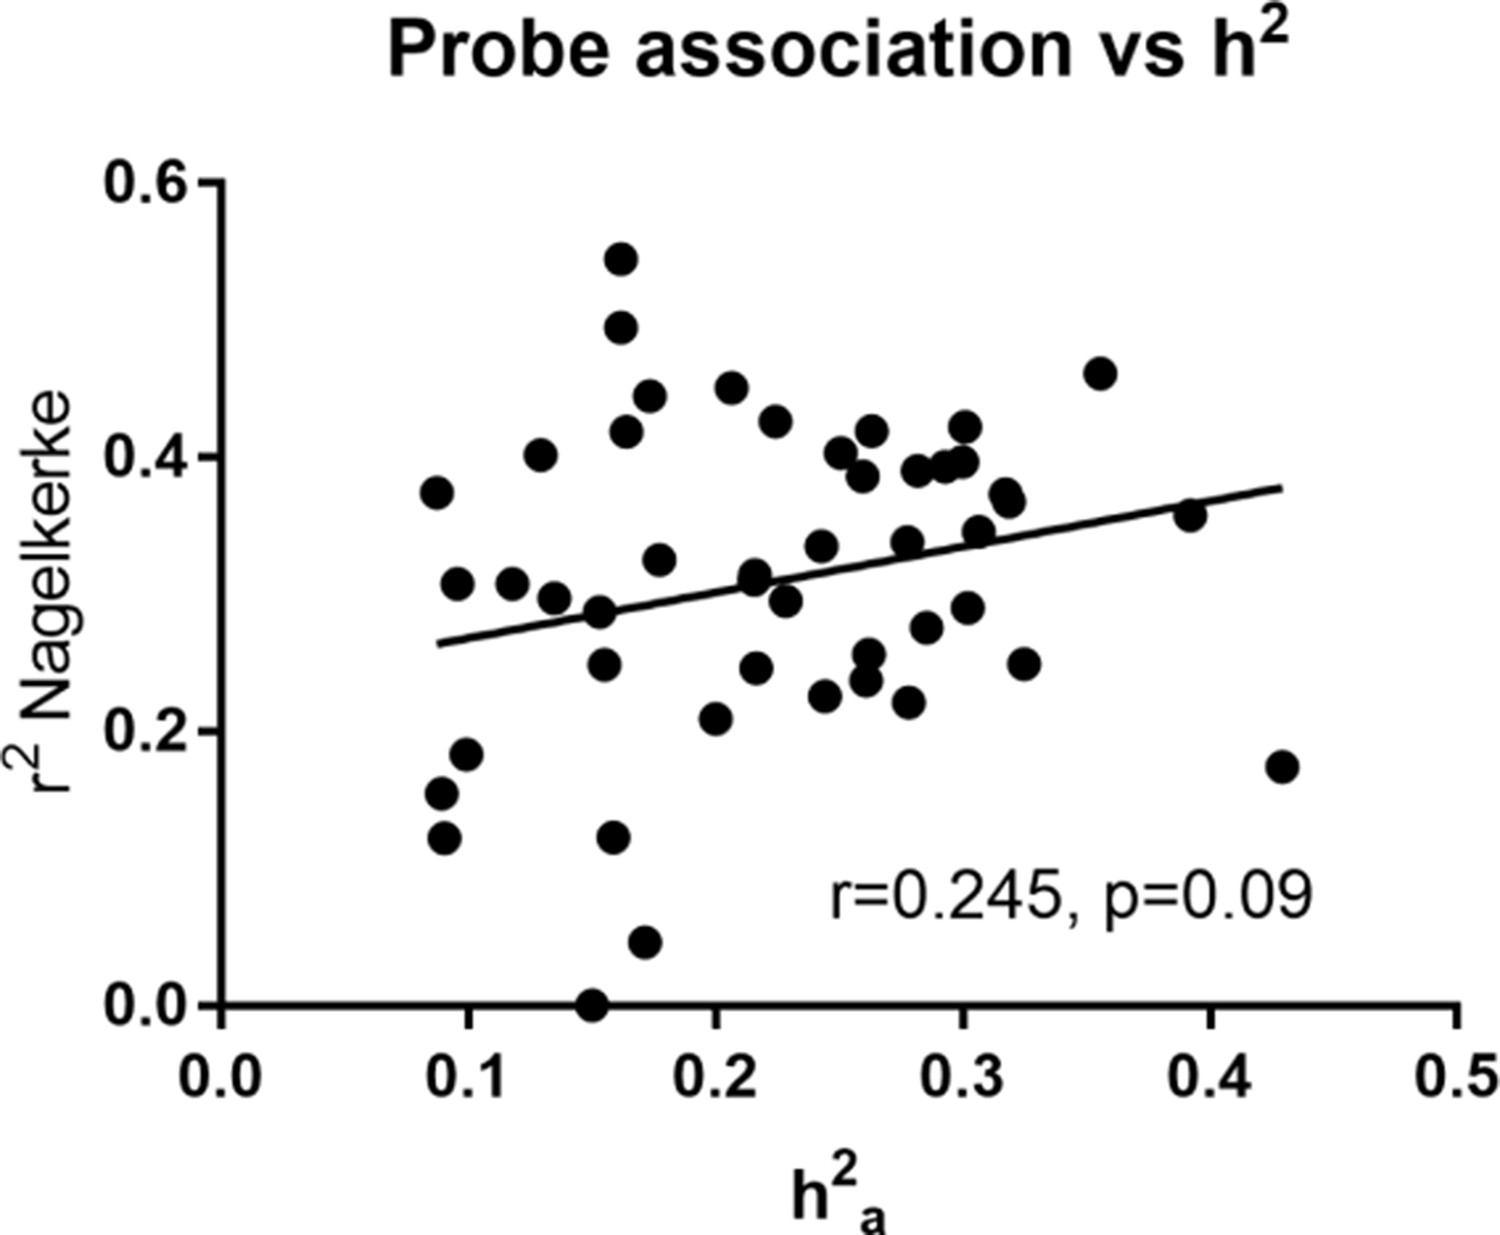
Heritability estimate (h2a) vs total variance explained (Nagelkerke r2) by gene expression probe transcripts for heritable lipids.
Pearson correlation was calculated.
Figure 2—figure supplement 1
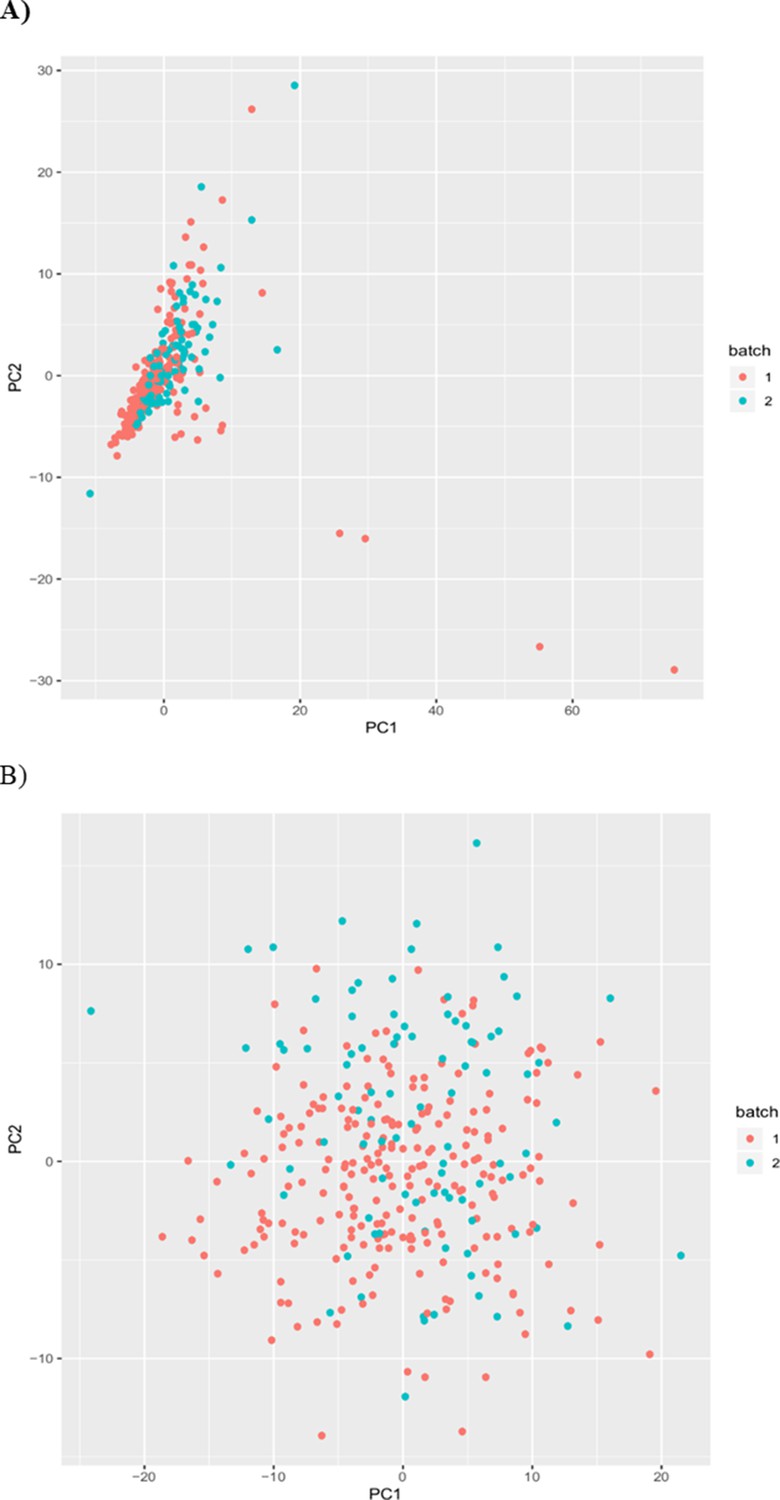
Batch correction using inverse rank normal transform of residuals.
PCA plots showing good overlap of experimental batch lipids after (A) residuals were taken and (B) after inverse rank normal transformation was applied to these residuals.
Figure 3
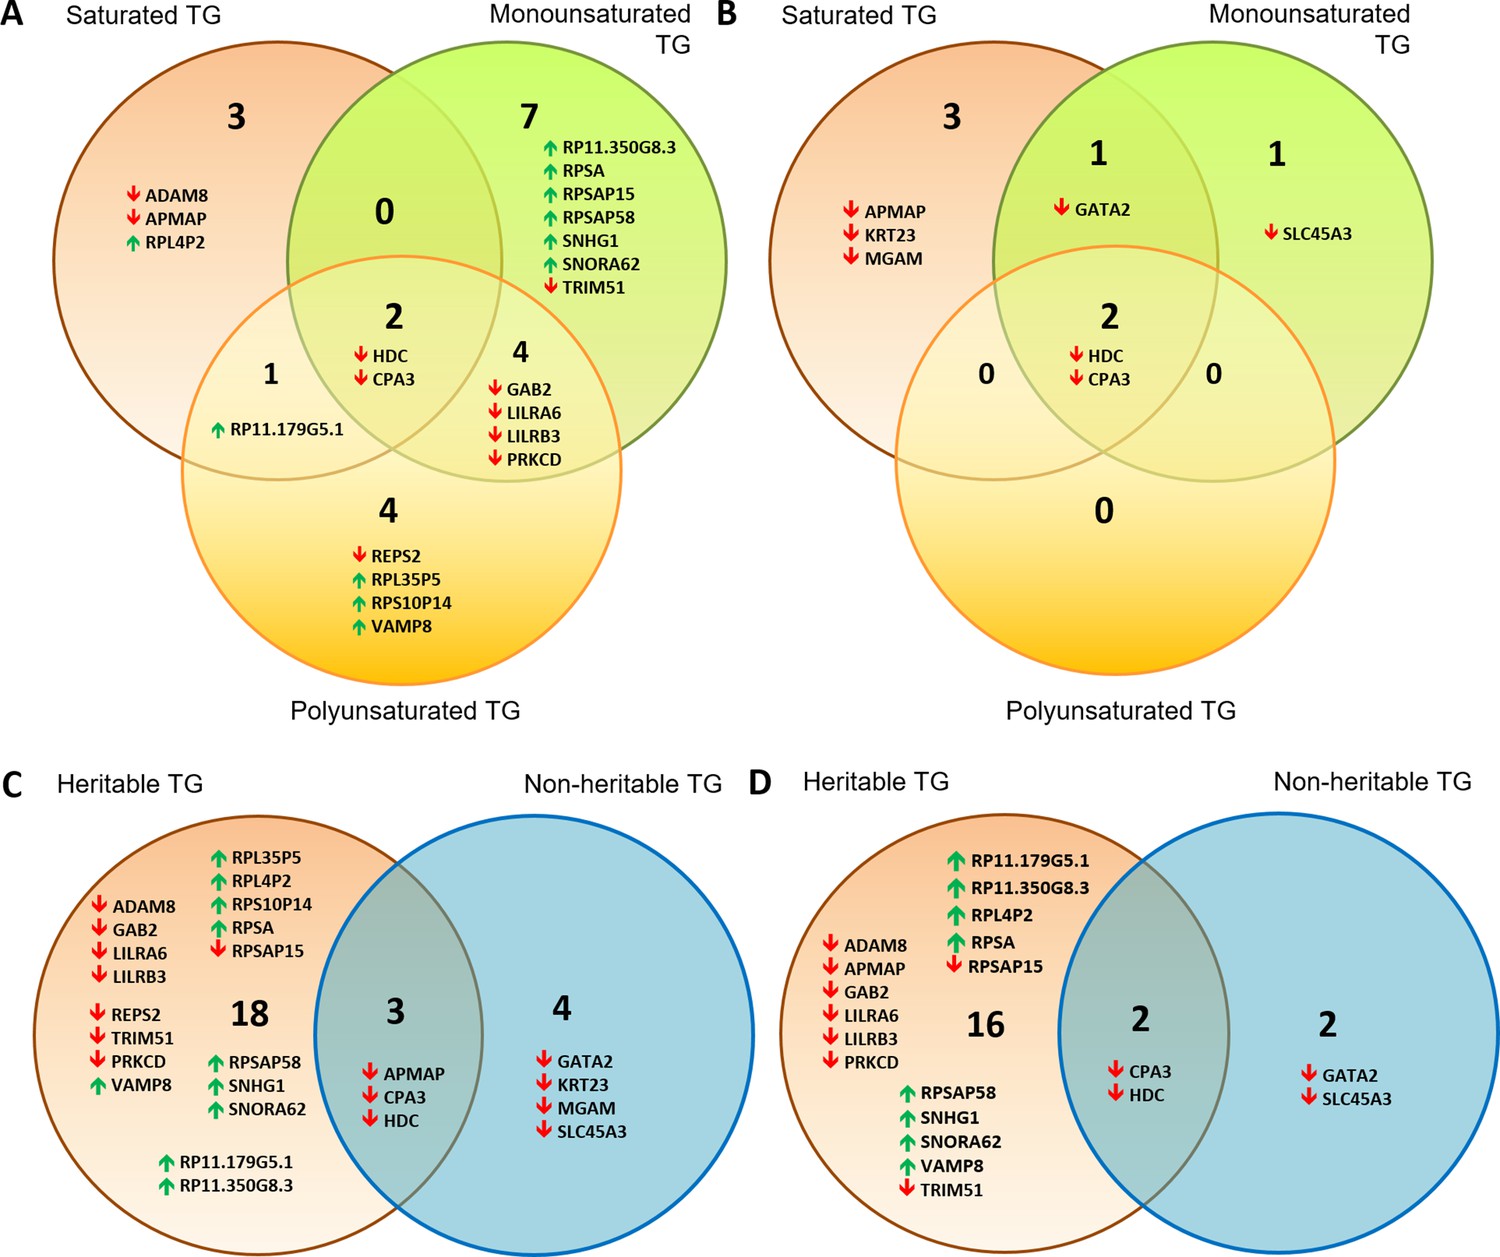
Venn diagrams showing distribution of gene transcripts associated with a majority of TG lipids.
These were subdivided into those associated with saturated vs monounsaturated vs polyunsaturated lipids for (A) significantly heritable TGs and (B) non-heritable TGs. Also shown are heritable vs non-heritable set of significant gene expression associations of TG lipids that were first subdivided based on (C) double bond group/saturation (Supplementary file 2G) and (D) total number of carbons (<49 carbons, 49–55 carbons and 56+ carbons, Supplementary file 2H). Gene transcripts included in these Venn diagrams were those significantly associated with the highest and second highest number of lipids of a particular saturation class (A and B), or among heritable and non-heritable lipids (C and D). Upwards and downwards arrows indicate positive and inverse gene expression associations with lipid levels respectively.
Figure 4
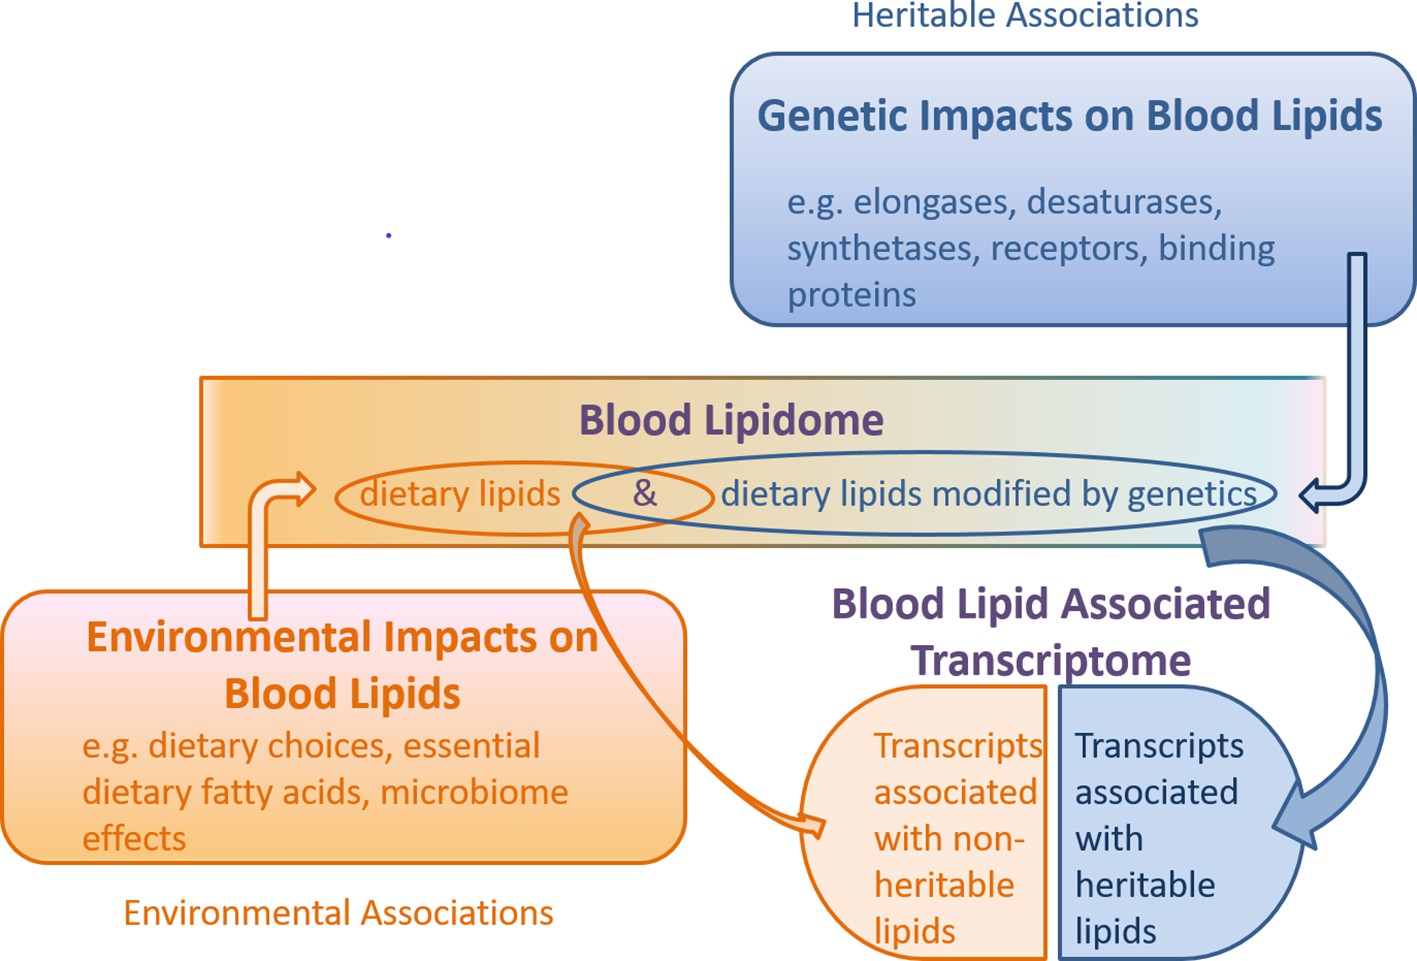
Schematic of the combined genetic and environmental influences on the blood lipidome, and the association of this lipidome with the blood transcriptome.
Under this model, non-heritable lipids could affect gene transcription, while heritable lipids could also affect gene transcription (collectively ‘blood lipid associated transcriptome’), but are possibly modified upstream by genetic machinery such as elongases, desaturases, synthetases, receptors and binding proteins. Gene transcripts encoding these enzymes and proteins may be independent of the ‘blood lipid associated transcriptome’ noted in this study.
Tables
Table 1
Participant characteristics for heritability analyses.
| MZ (n = 150) | DZ (n = 110) | Statistic | p-value | |
|---|---|---|---|---|
| Age | 75.7 (5.47) | 76.07 (5.31) | −0.548 | 0.584 |
| Females | 100 (67%) | 79 (72%) | 0.785 | 0.376 |
| Education (yrs) | 10.99 (3.18) | 11.2 (3.18) | −0.475 | 0.635 |
| BMI (kg/m2) | 27.934 (4.74) | 27.5 (4.92) | 0.776 | 0.438 |
| WHR | 0.89 (0.09) | 0.89 (0.08) | 0.164 | 0.87 |
| MMSE | 28.9 (1.37) | 28.95 (1.76) | −0.062 | 0.95 |
| LDL-C (mmol/L) | 2.77 (0.97) | 2.78 (0.97) | −0.078 | 0.938 |
| HDL-C (mmol/L) | 1.73 (0.46) | 1.60 (0.44) | 2.341 | 0.02 |
| Cholesterol (mmol/L) | 5.08 (1.01) | 4.98 (1.12) | 0.822 | 0.412 |
| Triglyceride (mmol/L) | 1.30 (0.54) | 1.32 (0.56) | −0.298 | 0.766 |
| APOE ε4 carrier* | 35 (26%) | 27 (28%) | 0.118 | 0.731 |
-
Means (SD) are presented for continuous variables, while n (%) is presented for categorical variables. Comparisons of MZ and DZ pairs used t tests for continuous variables and χ (Quehenberger et al., 2010) tests for categorical variables.
Abbreviations: MZ = monozygotic, DZ = dizygotic. body mass index (BMI), mini-mental state exam (MMSE), waist-hip ratio (WHR), low density lipoprotein cholesterol (LDL-C), high density lipoprotein cholesterol (HDL-C).
-
*excludes participants with missing data (n = 231 participants with APOE genotype data).
Table 2
Gene expression associations among TG lipids.
| TG class | Number of associated lipids | Number of transcript associations |
|---|---|---|
| Saturated TG | 1–2 | 282 |
| 3–8 | 6 | |
| Monounsaturated TG | 1–2 | 59 |
| 3–8 | 7 | |
| Polyunsaturated TG | 1–2 | 243 |
| 3–8 | 119 | |
| >8 | 9 |
-
Note. Table lists number of gene expression associations common to a maximum of 1–2, 3–8 and >8 lipids in each TG saturation class (saturated, monounsaturated, and polyunsaturated TG).
Table 3
Functions of genes with significant lipid-gene transcriptome associations.
| Biological Pathways | Gene Transcripts* | Relevance to the CNS |
|---|---|---|
| Inflammation | ||
| Innate immunity | ↓LILRB3, ↓MGAM | |
| Adaptive immune response | ↓LILRA6 | |
| Host Defense | ↓FPR1, ↓TRIM51 | FPR1 found in neural glial cells, astrocytes and neuroblastoma (Cussell et al., 2019). |
| Allergic Response | ↓ADAM8, ↓HDC, ↓CPA3 | ADAM8 may regulate cell adhesion during neurodegeneration (Schlomann et al., 2000). HDC as a histidine decarboxylase, produces histamine, which in the CNS is a neurotransmitter (Yoshikawa et al., 2014). |
| Class I MHC antigen binding | ↓LILRA6, ↓LILRB3 | |
| B-Cell response/receptor signalling | ↓GAB2, ↓LILRB3, ↓PRKCD | GAB2 is associated with Alzheimer's disease. By activating PI3K, increases amyloid production and microglia-mediated inflammation. Several GAB2 SNPs are associated with late-onset Alzheimer’s disease (Chen et al., 2018). |
| Mast Cell Degranulation | ↓CPA3, ↓HDC, | |
| Vasoactive Actions | ||
| Regulation of vasoactive peptides (e.g., endothelin, angiotensin 1, snake toxins, etc) | ↓GATA2, ↓CPA3, | |
| Epithelial Cell Integrity | ↓KRT23, ↓PRKCD | |
| Cell Adhesion | ↓APMAP | APMAP supresses brain Aβ production (Mosser et al., 2015). |
| DNA Regulation | ↑ RPSA, ↑ SNORA62, ↑ SNHG1 | |
| Vesicle/Endosome Regulation/Transport | ↑ VAMP8, ↓REPS2, ↓SLC45A3 | SLC45A3 regulates oligodendrocyte differentiation (Shin et al., 2012). |
| Pseudogenes/non-protein coding | ↓S100A11P1, ↓RPSAP15, ↑ RP11-179G5.1, ↑ RP11-350G8.3, ↑ RPL35P5, ↑ RPL4P2, ↑ RPS10P14, ↑ RPSAP15, ↑ RPSAP58, ↑ SNHG1, ↑ SNORA62 | Regulatory roles. Gene silencing, affects mRNA stability. |
Table 4
Regression of lipid residuals significantly associated with genome wide average DNA methylation levels.
| Lipid | Beta | SE | t | p-value | h2 | p-value for h2 |
|---|---|---|---|---|---|---|
| CE(20:3) | 0.21 | 0.09 | 2.34 | 2.31E-02 | 0.31 | 0.30 |
| LPC(15:0) | −0.22 | 0.09 | −2.54 | 1.39E-02 | 6.51E-16 | 1 |
| LPC(16:0) | −0.27 | 0.09 | −3.12 | 2.90E-03 | 3.82E-14 | 1 |
| LPC(17:0) | −0.21 | 0.09 | −2.34 | 2.30E-02 | 2.82E-14 | 1 |
| LPC(18:1e) | −0.21 | 0.09 | −2.44 | 1.81E-02 | 3.52E-17 | 1 |
| LPC(26:0) | −0.27 | 0.09 | −3.10 | 3.07E-03 | 0.056 | 0.87 |
| PC(39:3) | 0.18 | 0.09 | 2.12 | 3.84E-02 | 0.39 | 0.14 |
| TG(18:1_17:1_22:6) | −0.18 | 0.09 | −2.05 | 4.51E-02 | 0.31 | 0.05 |
| TG(18:1_18:1_22:5) | −0.23 | 0.09 | −2.69 | 9.58E-03 | 3.42E-15 | 1 |
| TG(18:1_20:4_22:6) | −0.21 | 0.09 | −2.41 | 1.96E-02 | 2.98E-15 | 1 |
| TG(19:0_18:1_18:1) | −0.18 | 0.09 | −2.14 | 3.73E-02 | 0.312 | 0.29 |
| GroupLPC | −0.24 | 0.09 | −2.74 | 8.32E-03 | 1.88E-15 | 1 |
-
Notes. Associations of GWAM with lipid residuals (adjusted for age, sex, education, BMI, lipid lowering medication, smoking status, experimental batch and APOE ε4 carrier status).
Table 5
Comparison of heritability estimates for traditional lipids and specific lipid classes/species summarising the current work and other published studies.
| Study and cohort details | Findings | Reference |
|---|---|---|
| Traditional lipids | ||
| Present study 75 MZ pairs, 55 DZ pairs 69–93 years | Range h2: 0.404–0.427 HDL-C had substantial C-component 0.27 | |
| Qingdao Twin Registry 382 MZ pairs and 139 DZ pairs, mean age 51 ± 7 | Total Cholesterol and LDL-C 0.614, 0.655 HDL-C h2 = 0.26, C-component = 0.478 | Liu et al., 2018 |
| National Heart Lung and Blood Institute Veteran Twin Study; 235 MZ, 260 DZ pairs 48–63 years | Longitudinal increases in heritability across three time pts Total Cholesterol (from 0.46 to 0.57), LDL-C (from 0.49 to 0.64), and HDL-C (from 0.50 to 0.62) TG: h2 = 0.40 | Goode et al., 2007 |
| San Antonio Family Heart Study N = 569, mean age 39.4 years | h2HDL-C = 0.55, h2TG = 0.53 | Goode et al., 2007; Mahaney et al., 1995 |
| Lipid Species/Classes | ||
| Present study | Range h2: 0–0.59 Range heritable lipids: 0.287–0.59, median: 0.433 Heritable lipids: some Cer, TG, DG. Fewer PE, PC Non-heritable lipids: LPC, SM, PI, CE | |
| Wisconsin Registry for Alzheimer’s Prevention n = 1212, mean age 60.8 | Range 0.2–84.9%, median h2 = 0.354 Median h2ceramides = 0.48 Median h2DG = 0.38 | Darst et al., 2019 |
| San Antonio Family Heart study, n = 1212 mean age 39.52 | h2range = 0.09–0.60 Median = 0.37 Heritable: almost all lipids, including Cer, TG, DG Least heritable: LPC, alkyl-PE | Bellis et al., 2014 |
| NUGAT Twin Study 34 MZ, 12 DZ twin pairs 18–70 years, median age 25 | Range h2: 0–0.62 (19/152 lipids had h2 > 0.40) Heritable lipids: LPC, PE, SM Non-heritable: Cer | Frahnow et al., 2017; Tabassum et al., 2019 |
| FINRISK n = 2181 25–74 years SNP based heritability | SNP based range h2: 0.10–0.54 Heritable lipids: Cer, LPC, SM, TG Non-heritable: PI | Tabassum et al., 2019 |
| n = 203 plasma samples from 31 families | Cer heritability range: 0.10–0.63 | McGurk et al., 2017 |
| n = 999, 196 British families, mean age 45 | SNP-based Cer heritability range: 0.18–0.87 | McGurk et al., 2019 |
Key resources table
| Reagent type (species) or resource | Designation | Source or reference | Identifiers | Additional information |
|---|---|---|---|---|
| Biological sample (Homo sapiens) | Fasting human EDTA plasma OATS Wave 3 | Sachdev, P.S., et al (2011). Cognitive functioning in older twins: the Older Australian Twins Study. Australasian journal on ageing 30 Suppl 2, 17–23. | Subject Cohort used: Wave three from the Older Australian Twins Study (OATS) Age range: 69–93 years | Plasma used for lipidomics analysis. Cohort also has genetics (SNPs) data and gene methylation data |
| Chemical compound, drug | SPLASH Lipidomix Mass Spec Standard | Avanti (Alabaster, Alabama, United States) | SKU 330707-1EA | Stable isotope labelled internal lipid standards |
| Other | QExactive Plus mass spectrometer and associated software: Xcalibur (3.1.66.10) and MS Tune (2.8 SP1 Build 2806)) | Thermo Fischer Scientific (Waltham MA United States) | MSMS | Mass spectrometer and controller software |
| Other | DIONEX UltiMate 3000 LC System and associated Chromeleon software | Thermo Fischer Scientific (Waltham MA United States) | LC and controller software | The LC system is comprised of an RS pump, RS column compartment and RS autosampler |
| Software, algorithm | Lipidsearch software v4.2.2 | Thermo Fischer Scientific (Waltham MA United States) | ThermoFisher Scientific software | Lipid identification and peak area integration |
| Chemical compound, drug | Acteonitrile UN 1648 | Honeywell Burdick and Jackson | HPLC grade solvent CAS 75-05-08 | Solvent used for preparing LC-MS Buffers Country of manufacture: Korea |
| Chemical compound, drug | Ammonium formate | Honeywell Fluka | HPLC grade reagent CAS 540-69-2 | Reagent used for preparing LC-MS Buffers UNIVAR analytical reagent Country of manufacture: Germany |
| Chemical compound, drug | Formic Acid (99%) UN 1779 | AJAX Finechem (Nuplex Industries, Australia) | AR Grade CAS 64-18-6 | Solvent used for preparing LC-MS Buffers |
| Chemical compound, drug | Milli-Q IQ 7000 purified Water | Merck Millipore | Purity monitored to a minimum of 18 MΩ resistivity | Purified water for preparing buffers and general laboratory use |
| Chemical compound, drug | Isopropanol | Honeywell Burdick and Jackson Material No. 10626668 Manufactured: USA | LC-MS grade CAS 67-63-0 | Solvent used for preparing LC-MS It is important to use LC-MS grade isopropanol in buffer B, to maintain low background signal for LCMSMS |
| Other | Acquity LC column LC-MS reverse phase column | Waters Corporation | Acquity UPLC CSHC18, 1.7 mm, 2.1 × 100 mm column SKU 186005297 | Includes Vanguard pre-column attachment. |
| Chemical compound, drug | Butanol for lipid extraction | Asia Pacific Specialty Chemicals, Thermo Fisher Scientific | CAS 71-36-3 | Extraction described: https://doi.org/www.frontiersin.org/articles/10.3389/fneur.2019.00879/full https://www.mdpi.com/2218-1989/5/2/389 |
| Chemical compound, drug | Methanol HPLC grade solvent for lipid extraction | AJAX Finechem (Nuplex Industries, Australia) | CAS 67-56-1 | |
| Commercial assay or kit | PAXgene blood RNA system | PreAnalytix, Qiagen | CAS 762165 CAS 762164 | RNA blood tube and extraction kit. Used as per manufacturer’s protocol |
| Commercial assay or kit | Agilent Technologies 2100 Bioanalyzer | Agilent | G2939BA | RNA integrity number (RIN) assessment |
| Commercial assay or kit | Illumina Whole-Genome Gene Expression direct Hybridization Assay System HumanHT-12 v4 | Illumina, San Diego, CA | BD-103–0604 | Used as per manufacturer’s protocol BD-901–1002 |
| Commercial assay or kit | Illumina Infinium HumanMethylation 450 BeadChip | Illumina, San Diego, CA | WG-314–1002 | Used as per manufacturer’s protocol |
| Other | Beckman LX20 Analyser (clinical chemistry analysis of LDL-C, HDL-C, triglyerides) | Beckman Coulter, Australia | Done at Prince of Wales hospital, Sydney. Timed endpoint method used for calculation of LDL-C. | |
| Commercial assay or kit | APOE genotyping: Taqman genotyping assays Assays: C__3084793_20 (rs429358) & C_904973_10 (rs7412) | Poljak, A., et al. The Relationship Between Plasma Abeta Levels, Cognitive Function and Brain Volumetrics: Sydney Memory and Ageing Study. Curr Alzheimer Res 2016;13:243–55 | Applied Biosystems Inc, Foster city, CA | |
| Software, algorithm | ROpenMx 2.12.2 | Neale, M.C., et al. (2016). OpenMx 2.0: Extended Structural Equation and Statistical Modeling. Psychometrika 81, 535–549. | SEM heritability analysis R package | |
| Software, algorithm | Other R packages: Minfi, RNOmni, nlme, rcompanion, caret | Aryee MJ, et al. Minfi: a flexible and comprehensive bioconductor package for the analysis of Infinium DNA methylation microarrays. Bioinformatics 30(10), 1363–1369 (2014). McCaw, 2019. RNOmni: Rank Normal Transformation Omnibus Test. In. (R package Pinheiro et al., 2019. nlme: Linear and Nonlinear Mixed Effects Models. In. (R package Mangiafico, 2019. rcompanion: Functions to Support Extension Education Program Evaluation. In. (R package Kuhn, M., et al. (2018). caret: Classification and Regression Training. In. (R package |
Additional files
-
Source code 1
R script for analyses.
- https://cdn.elifesciences.org/articles/58954/elife-58954-code1-v2.zip
-
Supplementary file 1
(A) Heritable lipid species. Standardized additive genetic (h2 = heritability), shared environment (h2c) and unique environment (h2E) variance components (95% CI) of lipids were obtained using the ACE model. The columns p-AE, p-CE, and p-E, respectively, denote the p-values from the likelihood ratio test comparing ACE model vs AE, CE, and E models. p-CE is also the p value for heritability because testing the component A = 0 is equivalent to testing that the heritability is zero. C.I. indicates confidence interval; DZ, dizygotic; ICC, intraclass correlation coefficient; MZ, monozygotic. (B) Heritability of summed lipid groups. Standardized additive genetic (A = heritability), shared environment (C) and unique environment (E) variance components (95% CI) of lipids were obtained using the ACE model. The columns p-AE, p-CE, and p-E, respectively, denote the p-values from the likelihood ratio test comparing ACE model vs AE, CE, and E models. p-CE is also the p value for heritability because testing the component A = 0 is equivalent to testing that the heritability is zero. C.I. indicates confidence interval; DZ, dizygotic; ICC, intraclass correlation coefficient; MZ, monozygotic. CL_TG49 and CL_TG62 represent sum of triglycerides with 44–49 total carbons, and 56–62 total carbons respectively while Cer(d18:1/X) represents sum of all ceramides with an 18:1 acyl chain in the sn-1 position.
- https://cdn.elifesciences.org/articles/58954/elife-58954-supp1-v2.docx
-
Supplementary file 2
(A) Full heritability list for all lipids. HA - Heritabiltiy; HC - Shared envrionmental component; HE - Unique environmental component; MZICC - Intraclass correlation in MZ twins; DZICC - Intraclass correlation in DZ twin; LT and UT denote lower and upper confidence limits; SignificantlyHeritable = 1 if declared heritable and 0 if not significantly heritable; SigProbAssoc = 1 if at least one gene expression probe is associated with the lipid; 0 if none is associated. (B) Sex heterogeneity test. Only significantly heritable lipids from (B) included. HA - Heritabiltiy; HC - Shared envrionmental component; HE - Unique environmental component; MZICC - Intraclass correlation in MZ twins; DZICC - Intraclass correlation in DZ twins; LT and UT denote lower and upper confidence limits; f denotes females, m denotes males; Hom_Pval is the p-value for the sex heterogenity test (p<0.05 indicates significant sex differences in heritability for that lipid); ICCmf - Intraclass correlation coefficient between opposite sex pairs. (C) ACE Age-related changes. Listed are heritability estimates for lipids at various ages (65 to 95). (D) Significant probe associations. Nprobes = Number of significantly associated gene expression probes with the lipid. NusedInModel = number of probes used for the calculation of variance explained after fitting the penalised regression model. (E) Significant transcript association with lipids. (F) Lipid-gene table. Entry one in the table indicates a significantly associated gene probe in the column with the lipid in the row and 0 indicates no association. (G) Lipid-gene by saturation index. RowSum is the sum of lipids significantly associated with a probe in each saturation level. RowSum_sigherit is the sum of heritable lipids significantly associated with a probe. Rowsum_nonsig is the sum of non-heritable lipids significantly associated with a probe. (H) Lipid-gene by total carbons. (I) Lipid expression associations with DNA methylation at CpG sites close to gene transcripts significantly associated with lipids. (J) Gene expression associations with DNA methylation at CpG sites close to gene transcripts significantly associated with lipids.
- https://cdn.elifesciences.org/articles/58954/elife-58954-supp2-v2.xlsx
-
Supplementary file 3
Lipid (triglyceride)-gene expression associations listed by heritability and degree of saturation.
- https://cdn.elifesciences.org/articles/58954/elife-58954-supp3-v2.docx
-
Transparent reporting form
- https://cdn.elifesciences.org/articles/58954/elife-58954-transrepform-v2.docx
Download links
A two-part list of links to download the article, or parts of the article, in various formats.
Downloads (link to download the article as PDF)
Open citations (links to open the citations from this article in various online reference manager services)
Cite this article (links to download the citations from this article in formats compatible with various reference manager tools)
Genetic and environmental determinants of variation in the plasma lipidome of older Australian twins
eLife 9:e58954.
https://doi.org/10.7554/eLife.58954


