Pancreatic progenitor epigenome maps prioritize type 2 diabetes risk genes with roles in development
- Department of Pediatrics, Pediatric Diabetes Research Center, University of California, San Diego, United States
- Department of Cellular & Molecular Medicine, University of California, San Diego, United States
- Sanford Consortium for Regenerative Medicine, United States
- Biomedical Graduate Studies Program, University of California, San Diego, United States
- Human Genetics Program, Sanford Burnham Prebys Medical Discovery Institute, United States
- Graduate School of Biomedical Sciences, Sanford Burnham Prebys Medical Discovery Institute, United States
- Ludwig Institute for Cancer Research, United States
Figures
Figure 1 with 1 supplement

T2D-associated risk variants are enriched in stretch enhancers of pancreatic progenitors independent of islet stretch enhancers.
(A) Schematic illustrating the stepwise differentiation of human embryonic stem cells (hES) into pancreatic progenitors (solid arrows) and lineage relationship to islets (dotted arrow). Developmental intermediates include definitive endoderm (DE), gut tube (GT), early pancreatic progenitor (PP1), and late pancreatic progenitor (PP2) cells. (B) Box plots depicting length of typical enhancers (TE) and stretch enhancers (SE) at each developmental stage and in primary human islets. Plots are centered on median, with box encompassing 25–75th percentile and whiskers extending up to 1.5 interquartile range. Total numbers of enhancers are shown above each box plot. (C) Examples of stretch enhancers (denoted with red boxes) near the genes encoding the pancreatic lineage-determining transcription factors NKX6.1 and PDX1, respectively. Chromatin states are based on ChromHMM classifications: TssA, active promoter; TssFlnk, flanking transcription start site; TssBiv, bivalent promoter; Repr, repressed; EnhA, active enhancer; EnhP, poised enhancer. (D) Percentage of TE and SE overlapping with at least one ATAC-seq peak at PP2 or in islets. Enrichment analysis comparing observed and expected overlap based on random genomic regions of the same size and located on the same chromosome averaged over 10,000 iterations (***p<1 × 10⁻⁴; permutation test). ATAC-seq peaks were merged from two independent differentiations for PP2 stage cells and four donors for primary islets. (E) Genome-wide enrichment of T2D-associated variants (minor allele frequency >0.0025) in stretch enhancers, ATAC-seq peaks, and ATAC-seq peaks within stretch enhancers for all developmental stages when modeling each annotation separately. Points and lines represent log-scaled enrichment estimates and 95% confidence intervals from functional genome wide association analysis (fgwas), respectively. ATAC-seq peaks were merged from two independent differentiations for ES, DE, GT, PP1, and PP2 stage cells and from four donors for primary islets. (F) Genome-wide enrichment of T2D-associated variants (minor allele frequency >0.0025) in ATAC-seq peaks within stretch enhancers for all developmental stages and coding exons when considering all annotations in a joint model. Points and lines represent log-scaled enrichment estimates and 95% confidence intervals from fgwas, respectively. ATAC-seq peaks were merged from two independent differentiations for ES, DE, GT, PP1, and PP2 stage cells and from four donors for primary islets. See also Figure 1—figure supplement 1.
Figure 1—figure supplement 1
Characterization of typical and stretch enhancers in pancreatic developmental intermediates and islets.
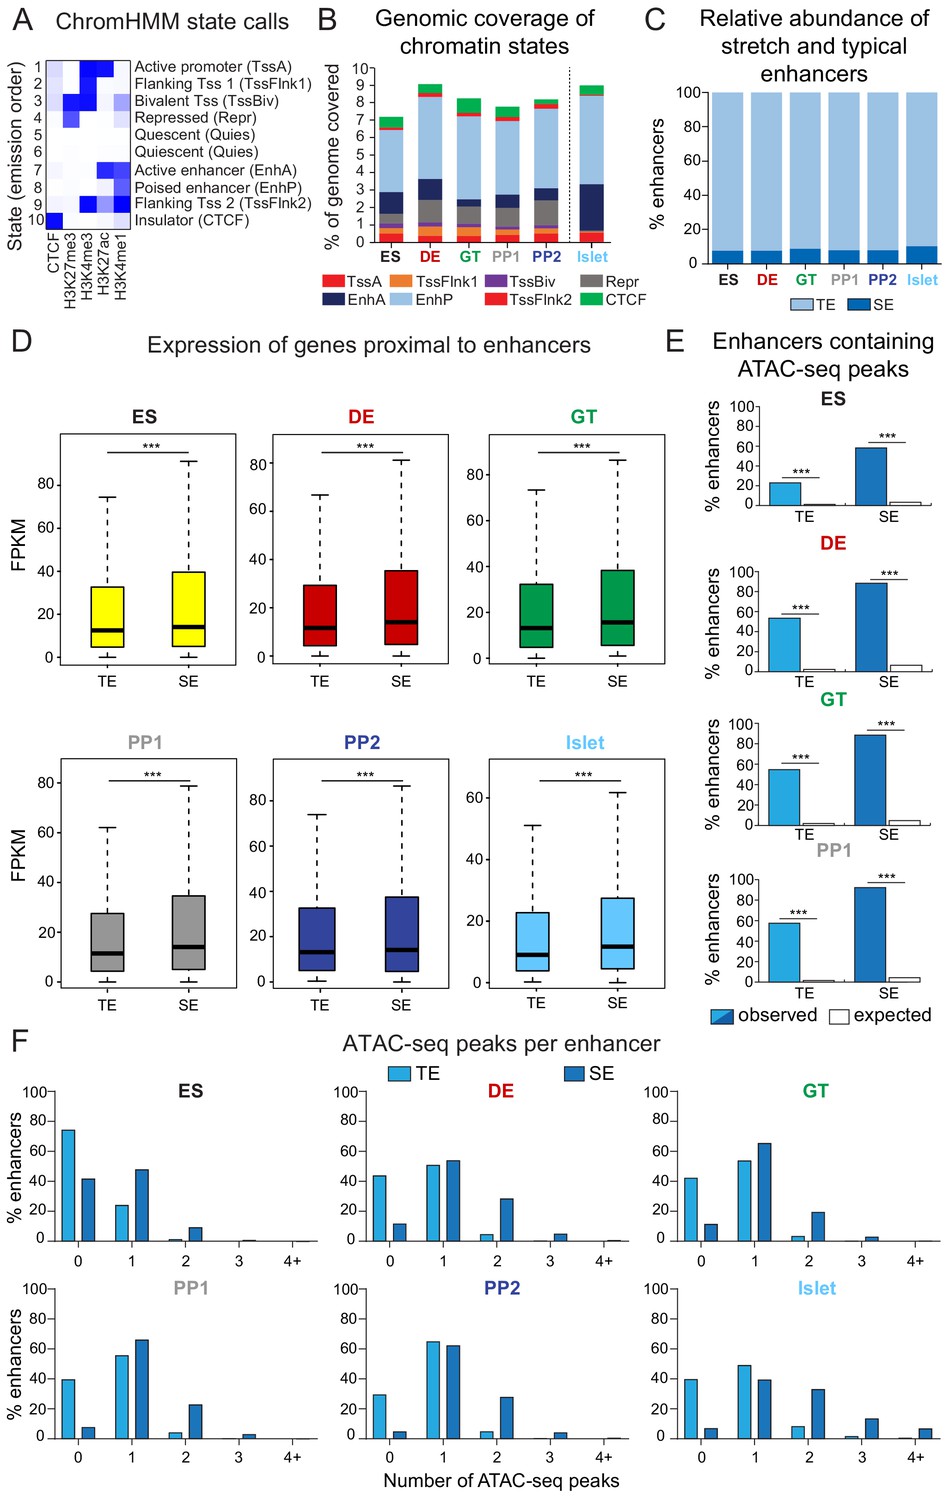
(A) Diagram illustrating incorporation of histone modification and CTCF ChIP-seq data to generate chromatin state calls via ChromHMM. (B) Percentage of the genome covered by defined chromatin states at each developmental stage and in primary human islets. Chromatin states are based on ChromHMM classifications: TssA, active promoter; TssFlnk, flanking transcription start site; TssBiv, bivalent promoter; Repr, repressed; EnhA, active enhancer; EnhP, poised enhancer. (C) Percentage of typical (TE) and stretch enhancers (SE) relative to all enhancers at each developmental stage and in islets. (D) Box plots showing mRNA levels based on RNA-seq of nearest expressed genes (fragments per kilobase per million fragments mapped (FPKM) ≥1) for TE and SE at each developmental stage and in islets (***p=4.68 × 10⁻⁷, 4.64 × 10⁻¹¹, 1.31 × 10⁻⁵, 8.85 × 10⁻⁹, 5.34 × 10⁻⁶, and <2.2 × 10⁻¹⁶ for TE vs SE comparisons in ES, DE, GT, PP1, PP2, and islets, respectively; Wilcoxon rank sum test, two sided). Plots are centered on median, with box encompassing 25-75th percentile and whiskers extending up to 1.5 interquartile range. n = 3 replicates from independent differentiations at ES, DE, GT, PP1, and PP2, respectively; n = 3 islet replicates. (E) Percentage of TE and SE overlapping with at least one ATAC-seq peak in ES, DE, GT, or PP1. Enrichment analysis comparing observed and expected overlap based on random genomic regions of the same size and located on the same chromosome averaged over 10,000 iterations (***p<1 × 10⁻⁴; permutation test). ATAC-seq peaks were merged from two independent differentiations. (F) Percentage of TE and SE overlapping 0, 1, 2, 3, or 4+ ATAC-seq peaks at each developmental stage and in islets. ATAC-seq peaks were merged from two independent differentiations for ES, DE, GT, PP1, and PP2 stage cells and from four donors for primary islets.
Figure 2 with 1 supplement

Candidate target genes of pancreatic progenitor-specific stretch enhancers regulate developmental processes.
(A) Schematic illustrating identification of pancreatic progenitor-specific stretch enhancers (PSSE). (B) Heatmap showing density of H3K27ac ChIP-seq and ATAC-seq reads at PSSE, centered on overlapping H3K27ac and ATAC-seq peaks, respectively, and spanning 5 kb in ES, DE, GT, PP1, PP2, and islets. PSSE coordinates in Figure 2—source data 1. (C) Percentage of PSSE exhibiting indicated chromatin states at defined developmental stages and in islets. (D) Percentage of PSSE overlapping with at least one ChIP-seq peak at PP2 for the indicated transcription factors. Enrichment analysis comparing observed and expected overlap based on random genomic regions of the same size and located on the same chromosome averaged over 10,000 iterations (***p<1×10⁻⁴; permutation test). (E) Gene ontology analysis for nearest expressed genes (fragments per kilobase per million fragments mapped (FPKM) ≥1 at PP2) to the 492 PSSE. See also Figure 2—source data 2. (F) Enrichment (LD score regression coefficient z-scores) of T2D, developmental, and metabolic GWAS trait-associated variants at accessible chromatin sites in PSSE as compared with PP2 and islet stretch enhancers. Significant enrichment was identified within accessible chromatin at PP2 stretch enhancers for lean type 2 diabetes (Z = 2.06, *p=3.94 × 10⁻²), at PP2 stretch enhancers for type 2 diabetes (Z = 3.57, ***p=3.52 × 10⁻⁴), at islet stretch enhancers for type 2 diabetes (Z = 2.78, **p=5.46 × 10⁻³), at islet stretch enhancers for fasting proinsulin levels (Z = 2.83, **p=4.61 × 10⁻³), at islet stretch enhancers for HOMA-B (Z = 2.58, **p=9.85 × 10⁻³), at PP2 stretch enhancers for disposition index (Z = 2.18, *p=2.94 × 10⁻²), at islet stretch enhancers for acute insulin response (Z = 2.24, *p=2.51 × 10⁻²), at islet stretch enhancers for HbA1c (Z = 1.98, *p=4.72 × 10⁻²), and at islet stretch enhancers for fasting glucose levels (Z = 2.64, **p=8.31 × 10⁻³). See also Figure 2—source data 3 and Figure 2—figure supplement 1.
-
Figure 2—source data 1
Chromosomal coordinates of pancreatic progenitor-specific stretch enhancers (PSSE).
- https://cdn.elifesciences.org/articles/59067/elife-59067-fig2-data1-v1.xlsx
-
Figure 2—source data 2
Enriched gene ontology terms for PSSE-associated genes.
- https://cdn.elifesciences.org/articles/59067/elife-59067-fig2-data2-v1.xlsx
-
Figure 2—source data 3
Proportion of variants nominally associated with beta cell functional traits.
- https://cdn.elifesciences.org/articles/59067/elife-59067-fig2-data3-v1.xlsx
-
Figure 2—source data 4
Tissue identity of downloaded data from ROADMAP consortium.
- https://cdn.elifesciences.org/articles/59067/elife-59067-fig2-data4-v1.xlsx
Figure 2—figure supplement 1
Characterization of pancreatic progenitor-specific stretch enhancers.
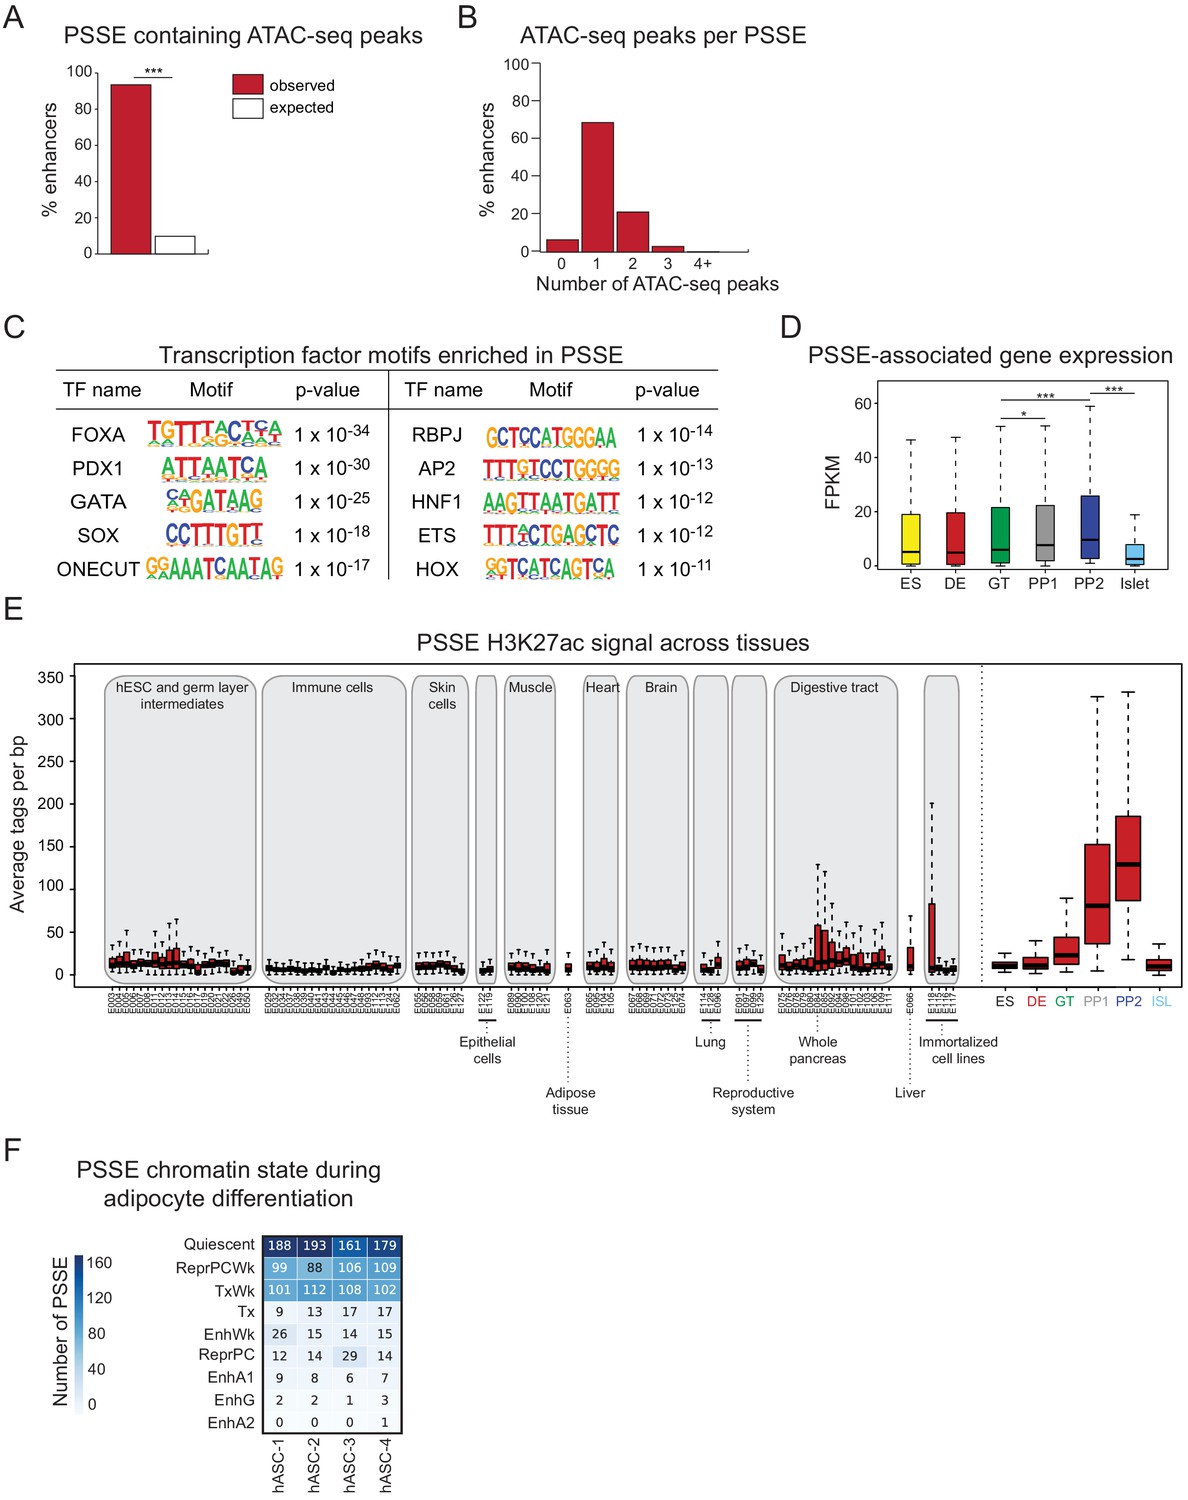
(A) Percentage of PSSE overlapping with at least one ATAC-seq peak at PP2. Enrichment analysis comparing observed and expected overlap based on random genomic regions of the same size and located on the same chromosome averaged over 10,000 iterations (***p<1 × 10⁻⁴; permutation test). (B) Percentage of PSSE overlapping 0, 1, 2, 3, or 4+ ATAC-seq peaks at PP2. (C) Enriched transcription factor (TF) binding motifs with associated p-values at ATAC-seq peaks at PP2 intersecting PSSE. Fisher’s exact test, two sided, corrected for multiple comparisons. (D) Box plots showing mRNA levels based on RNA-seq of nearest expressed genes (fragments per kilobase per million fragments mapped (FPKM) ≥1 at PP2) for PSSE at each developmental stage and in islets (*p=1.10 × 10⁻² for GT vs PP1; ***p=1.80 × 10⁻⁸ for GT vs PP2, p<2.2 × 10⁻¹⁶ for PP2 vs islet; Wilcoxon rank sum test, two sided). Plots are centered on median, with box encompassing 25-75th percentile and whiskers extending up to 1.5 interquartile range. n = 3 replicates from independent differentiations at ES, DE, GT, PP1, and PP2, respectively; n = 3 islet replicates. (E) Box plots showing H3K27ac signal at PSSE in tissues and cell lines from the ENCODE and Epigenome Roadmap projects as well as in developmental intermediates and islets (ISL). Plots are centered on median, with box encompassing 25-75th percentile and whiskers extending up to 1.5 interquartile range. See also Figure 2—source data 4. (F) Number of PSSE overlapping defined chromatin states in human adipose stromal cells from preadipose (hASC1) to mature adipose state (hASC4) (from Varshney et al., 2017). ChromHMM classifications: Quiescent; ReprPCWk, Weak Repressed PolyComb; TxWk, Weak Transcription; Tx, Strong Transcription; EnhWk, Weak Enhancer; ReprPC, Repressed Polycomb; EnhA1, Active Enhancer 1; EnhG, Genic Enhancer; EnhA2, Active Enhancer 2.
Figure 3 with 1 supplement

Identification of T2D risk variants associated with pancreatic progenitor-specific stretch enhancers.
(A) Manhattan plot showing T2D association p-values (from Mahajan et al., 2018) for 10,738 variants mapping within PSSE. The dotted line shows the threshold for Bonferroni correction (p=4.66 × 10⁻⁶). Novel loci identified with this threshold and mapping at least 500 kb away from a known locus are highlighted in blue. Chromosomal coordinates of T2D-associated PSSE are indicated. (B) mRNA levels (measured in fragments per kilobase per million fragments mapped [FPKM]) at PP2 (blue) and in human embryonic pancreas (54 and 58 days gestation, gold) of nearest expressed (FPMK ≥1) gene at PP2 for PSSE harboring T2D variants identified in A. (C) PP2 specificity of H3K27ac signal at PSSE harboring T2D variants identified in A. Z-score comparing H3K27ac signal at PP2 to H3K27ac signal in tissues and cell lines from the ENCODE and Epigenome Roadmap projects. See also Figure 3—figure supplement 1.
Figure 3—figure supplement 1
Activity of T2D risk-associated pancreatic progenitor-specific stretch enhancers across human tissues.
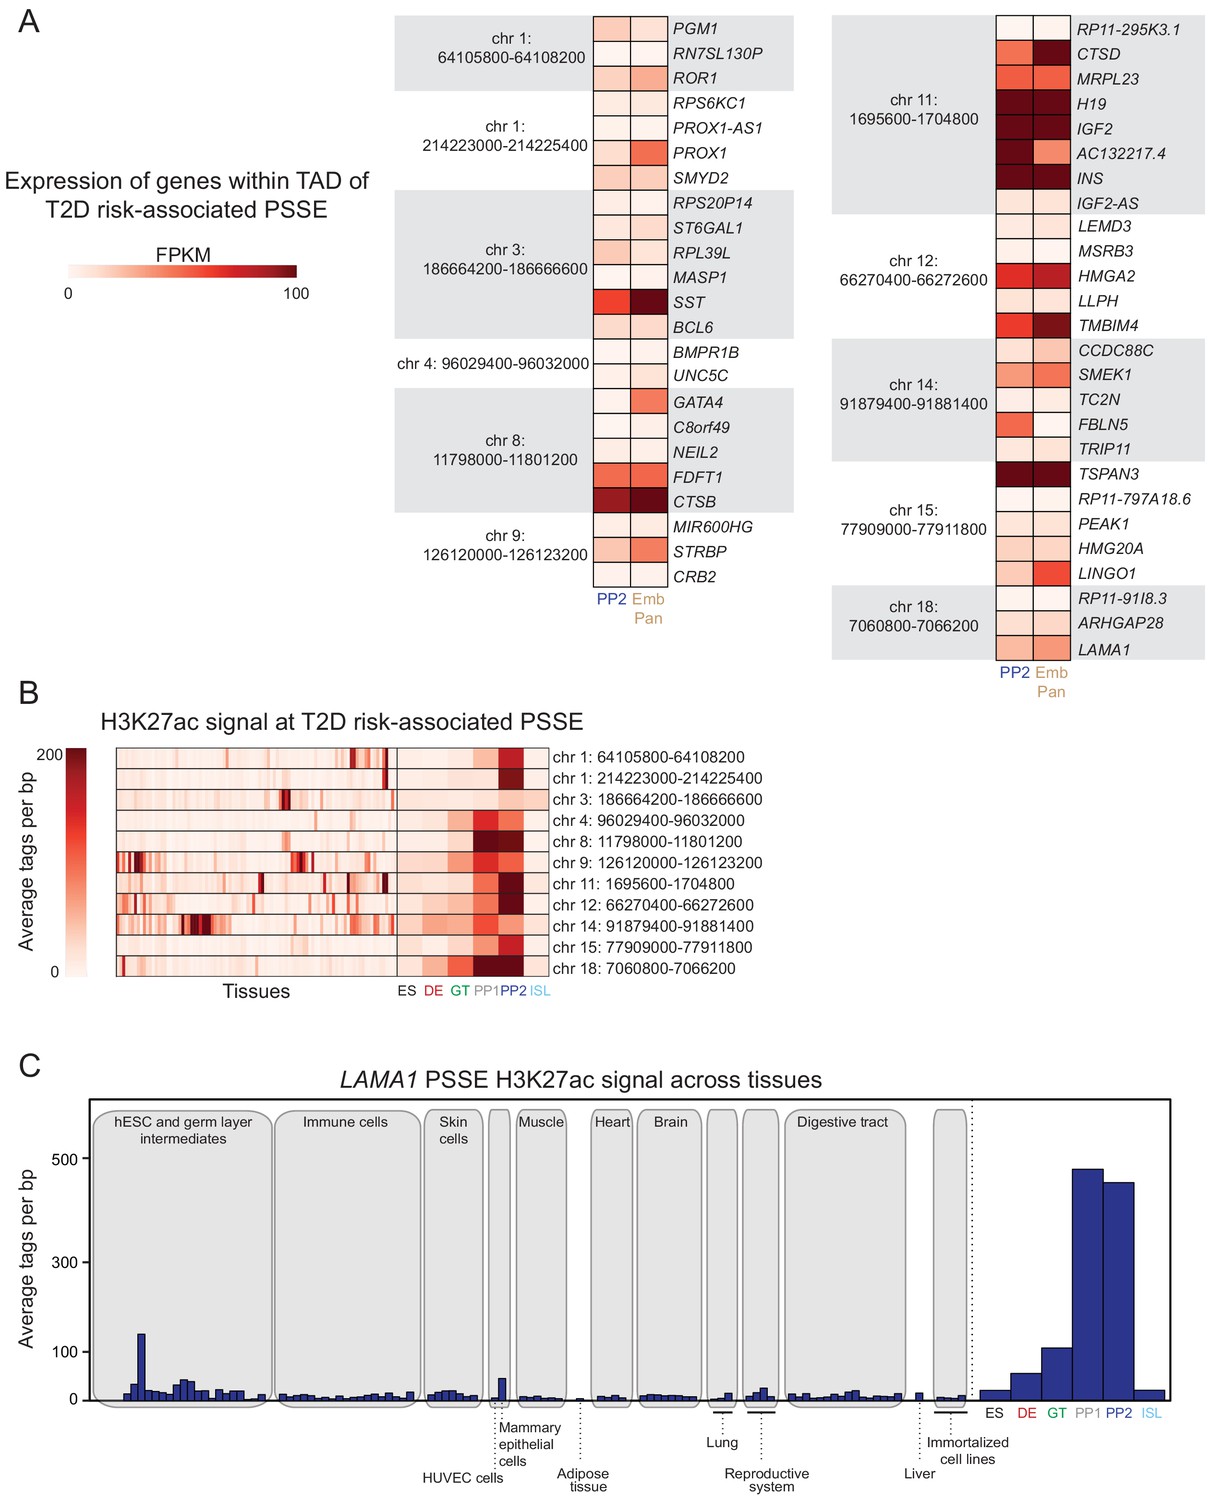
(A) mRNA levels (measured in fragments per kilobase per million fragments mapped [FPKM]) at PP2 and in human embryonic pancreas (54 and 58 days gestation, Emb Pan) of all genes expressed (FPKM ≥1) at PP2 and located within topologically associated domains (TADs) containing indicated PSSE harboring T2D variants identified in Figure 3A. (B) Heatmap showing H3K27ac signal at PSSE harboring T2D variants identified in Figure 3A. Quantification in tissues and cell lines from the ENCODE and Epigenome Roadmap projects (tissues) as well as in developmental intermediates and islets (ISL) is shown. (C) H3K27ac signal at LAMA1-associated PSSE in tissues and cell lines from the ENCODE and Epigenome Roadmap projects as well as in developmental intermediates and islets.
Figure 4 with 2 supplements
A T2D risk-associated LAMA1 pancreatic progenitor-specific stretch enhancer regulates LAMA1 expression specifically in pancreatic progenitors.
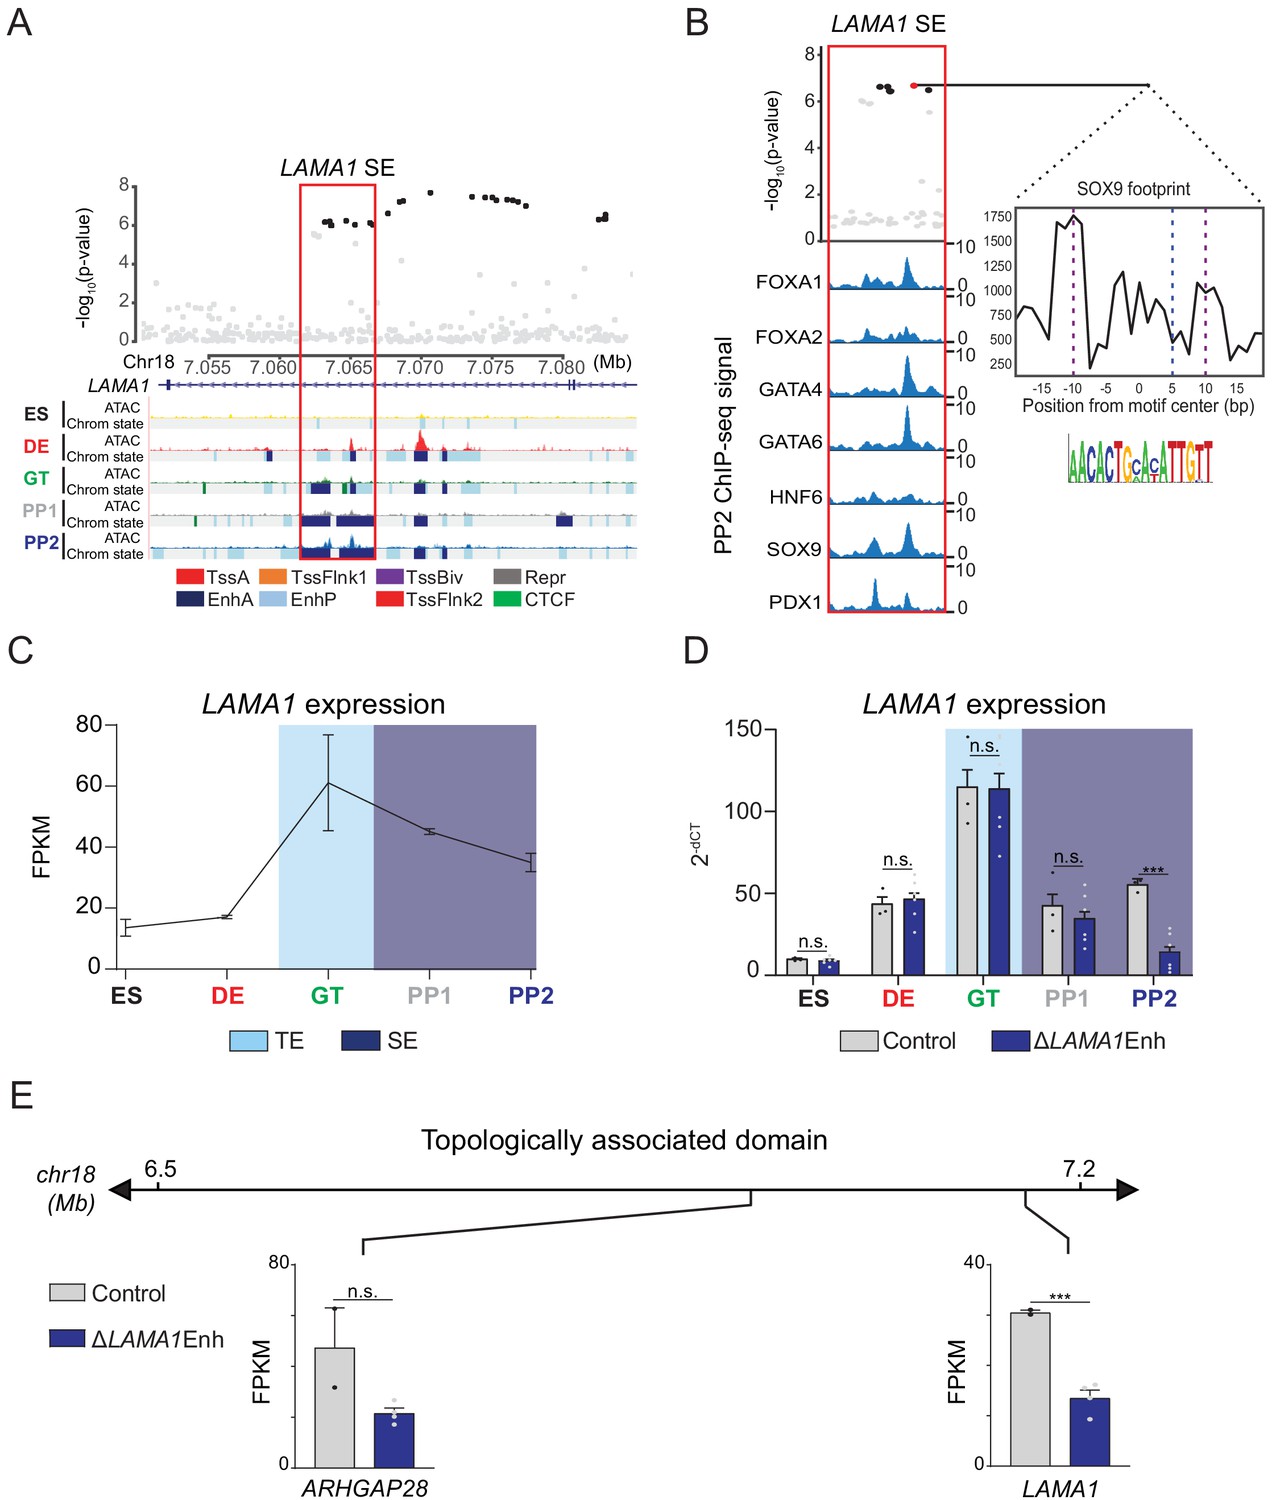
(A) (Top) Locus plots showing T2D association p-values for variants in a 35 kb window (hg19 chr18:7,050,000–7,085,000) at the LAMA1 locus and LAMA1 PSSE (red box). Fine mapped variants within the 99% credible set for the LAMA1 locus are colored black. All other variants are colored light gray. (Bottom) Chromatin states and ATAC-seq signal in ES, DE, GT, PP1, and PP2. TssA, active promoter; TssFlnk, flanking transcription start site; TssBiv, bivalent promoter; Repr, repressed; EnhA, active enhancer; EnhP, poised enhancer. (B) FOXA1, FOXA2, GATA4, GATA6, HNF6, SOX9, and PDX1 ChIP-seq profiles at the LAMA1 PSSE in PP2. The variant rs10502347 (red) overlaps transcription factor binding sites and a predicted ATAC-seq footprint for the SOX9 sequence motif. Purple dotted lines indicate the core binding profile of the average SOX9 footprint genome-wide and the blue dotted line indicates the position of rs10502347 within the SOX9 motif. (C) LAMA1 mRNA expression at each developmental stage determined by RNA-seq, measured in fragments per kilobase per million fragments mapped (FPKM). Data shown as mean ± S.E.M. (n = 3 replicates from independent differentiations). Light blue and purple indicate classification of the LAMA1 PSSE as typical enhancer (TE) and stretch enhancer (SE), respectively. (D) LAMA1 mRNA expression at each developmental stage determined by qPCR in control and ∆LAMA1Enh cells. Data are shown as mean ± S.E.M. (n = 3 replicates from independent differentiations for control cells. ∆LAMA1Enh cells represent combined data from two clonal lines with three replicates for each line from independent differentiations. n = 3 technical replicates for each sample; p=0.319, 0.594, 0.945, 0.290, and <1 × 10⁻⁶ for comparisons in ES, DE, GT, PP1, and PP2, respectively; student’s t-test, two sided; ***p<0.001, n.s., not significant). Light blue and purple indicate classification of the LAMA1 PSSE as TE and SE, respectively. Each plotted point represents the average of technical replicates for each differentiation. (E) mRNA expression determined by RNA-seq at PP2 of genes expressed in either control or ∆LAMA1Enh cells (FPKM ≥ 1 at PP2) and located within the same topologically associated domain as LAMA1. Data are shown as mean FPKM ± S.E.M. (n = 2 replicates from independent differentiations for control cells. ∆LAMA1Enh cells represent combined data from two clonal lines with two replicates for each line from independent differentiations. p adj. = 0.389 and 8.11 × 10⁻³ for ARHGAP28 and LAMA1, respectively; DESeq2). See also Figure 4—figure supplements 1 and 2.
-
Figure 4—source data 1
Genes downregulated in ∆LAMA1Enh PP2 stage cells compared to control cells (p adj. <0.05).
- https://cdn.elifesciences.org/articles/59067/elife-59067-fig4-data1-v1.xlsx
-
Figure 4—source data 2
Genes upregulated in ∆LAMA1Enh PP2 stage cells compared to control cells (p adj. <0.05).
- https://cdn.elifesciences.org/articles/59067/elife-59067-fig4-data2-v1.xlsx
Figure 4—figure supplement 1
Deletion of the LAMA1-associated pancreatic progenitor-specific enhancer does not affect pancreatic lineage specification.
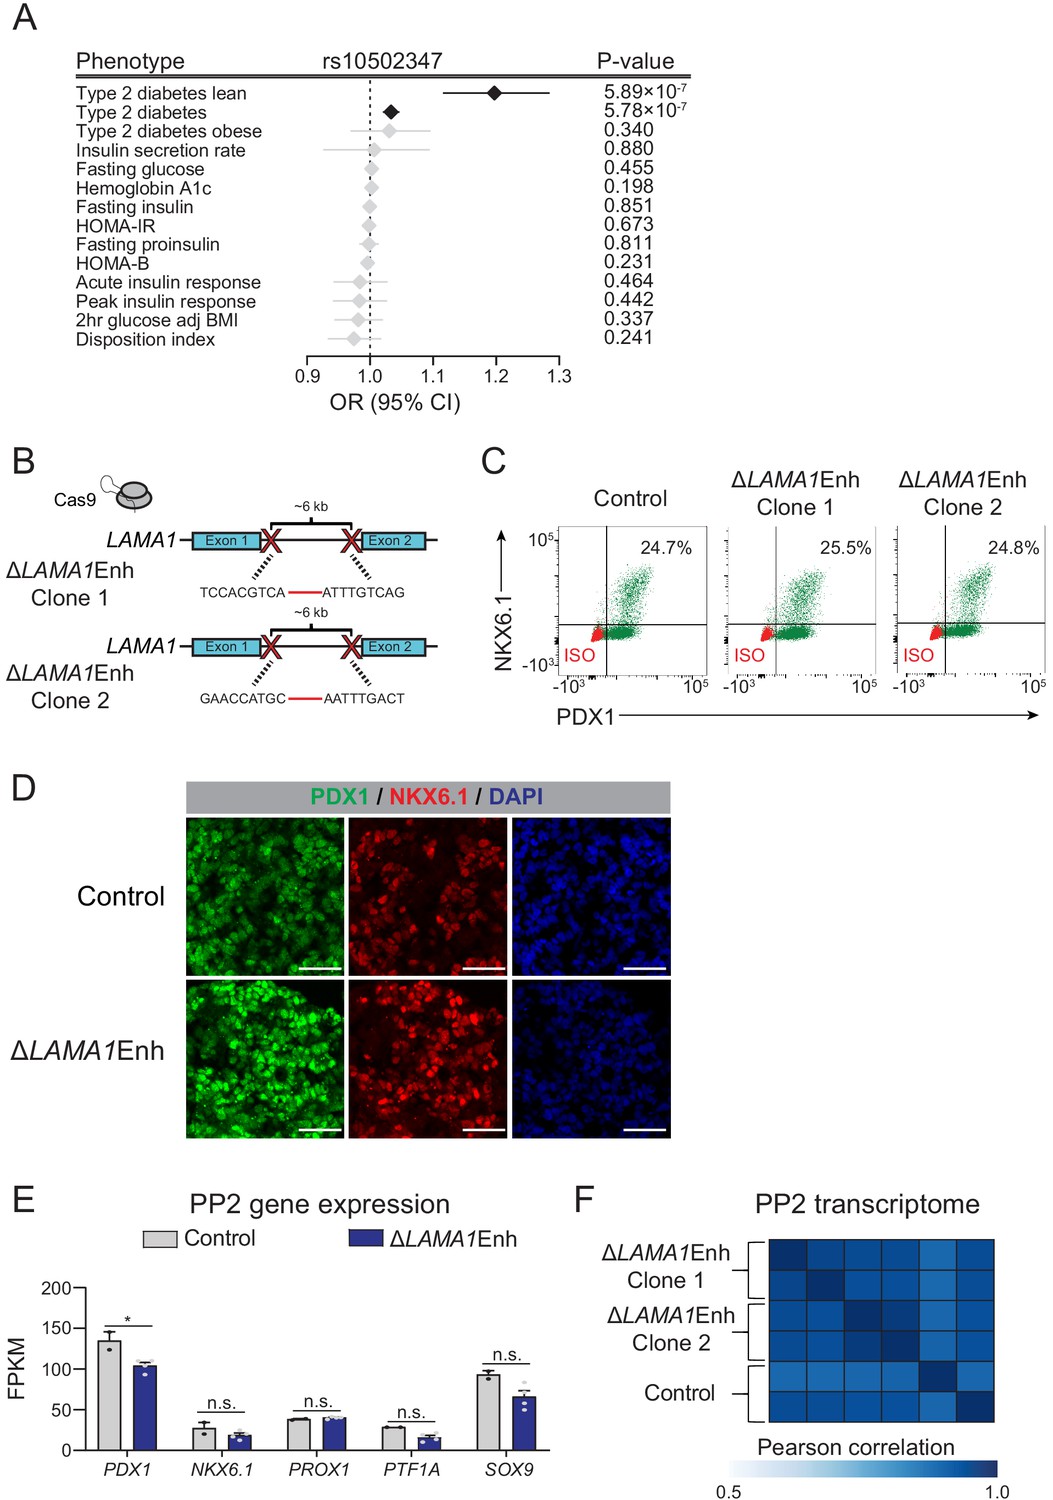
(A) Odds ratio estimates (points) and 95% CIs (lines) for rs10502347 association with T2D and metabolic GWAS traits. Significant associations are colored black, non-significant are colored light grey. (B) Schematic illustrating CRISPR-Cas9-mediated deletion strategy of LAMA1-associated PSSE to generate independent ∆LAMA1Enh hESC clones with different DNA cleavage products. (C) Flow cytometry analysis for NKX6.1 and PDX1 comparing control and ∆LAMA1Enh PP2 cells. Isotype control (ISO) for each antibody is shown in red and target protein staining in green. Percentage of cells expressing each protein is indicated (representative experiment, n = 3 independent differentiations). (D) Immunofluorescent staining for NKX6.1 and PDX1 in control and ∆LAMA1Enh PP2 cells (representative images, n = 2 slides). Scale bar, 50 μm. (E) mRNA expression of pancreatic transcription factors determined by RNA-seq in control and ∆LAMA1Enh PP2 cells. Data are shown as mean of fragments per kilobase per million fragments mapped (FPKM) ± S.E.M. (n = 2 replicates from independent differentiations for control cells. ∆LAMA1Enh cells represent combined data from two clonal lines with two replicates for each line from independent differentiations. p adj. = 3.56 × 10⁻², 0.224, 0.829, 8.14 × 10⁻², and 0.142, for comparisons of PDX1, NKX6.1, PROX1, PTF1A, and SOX9, respectively; DESeq2; * p adj. <0.05, n.s., not significant). (F) Similarity matrix showing Pearson correlations for normalized transcriptomes (log transformed expression for genes with FPKM ≥1 in ≥1 replicates) in control and ∆LAMA1Enh PP2 cells (n = 2 independent differentiations for control cells and for each ∆LAMA1Enh clone). See also Figure 4—source datas 1 and 2.
Figure 4—figure supplement 2
Deletion of LAMA1 does not affect pancreatic lineage specification.
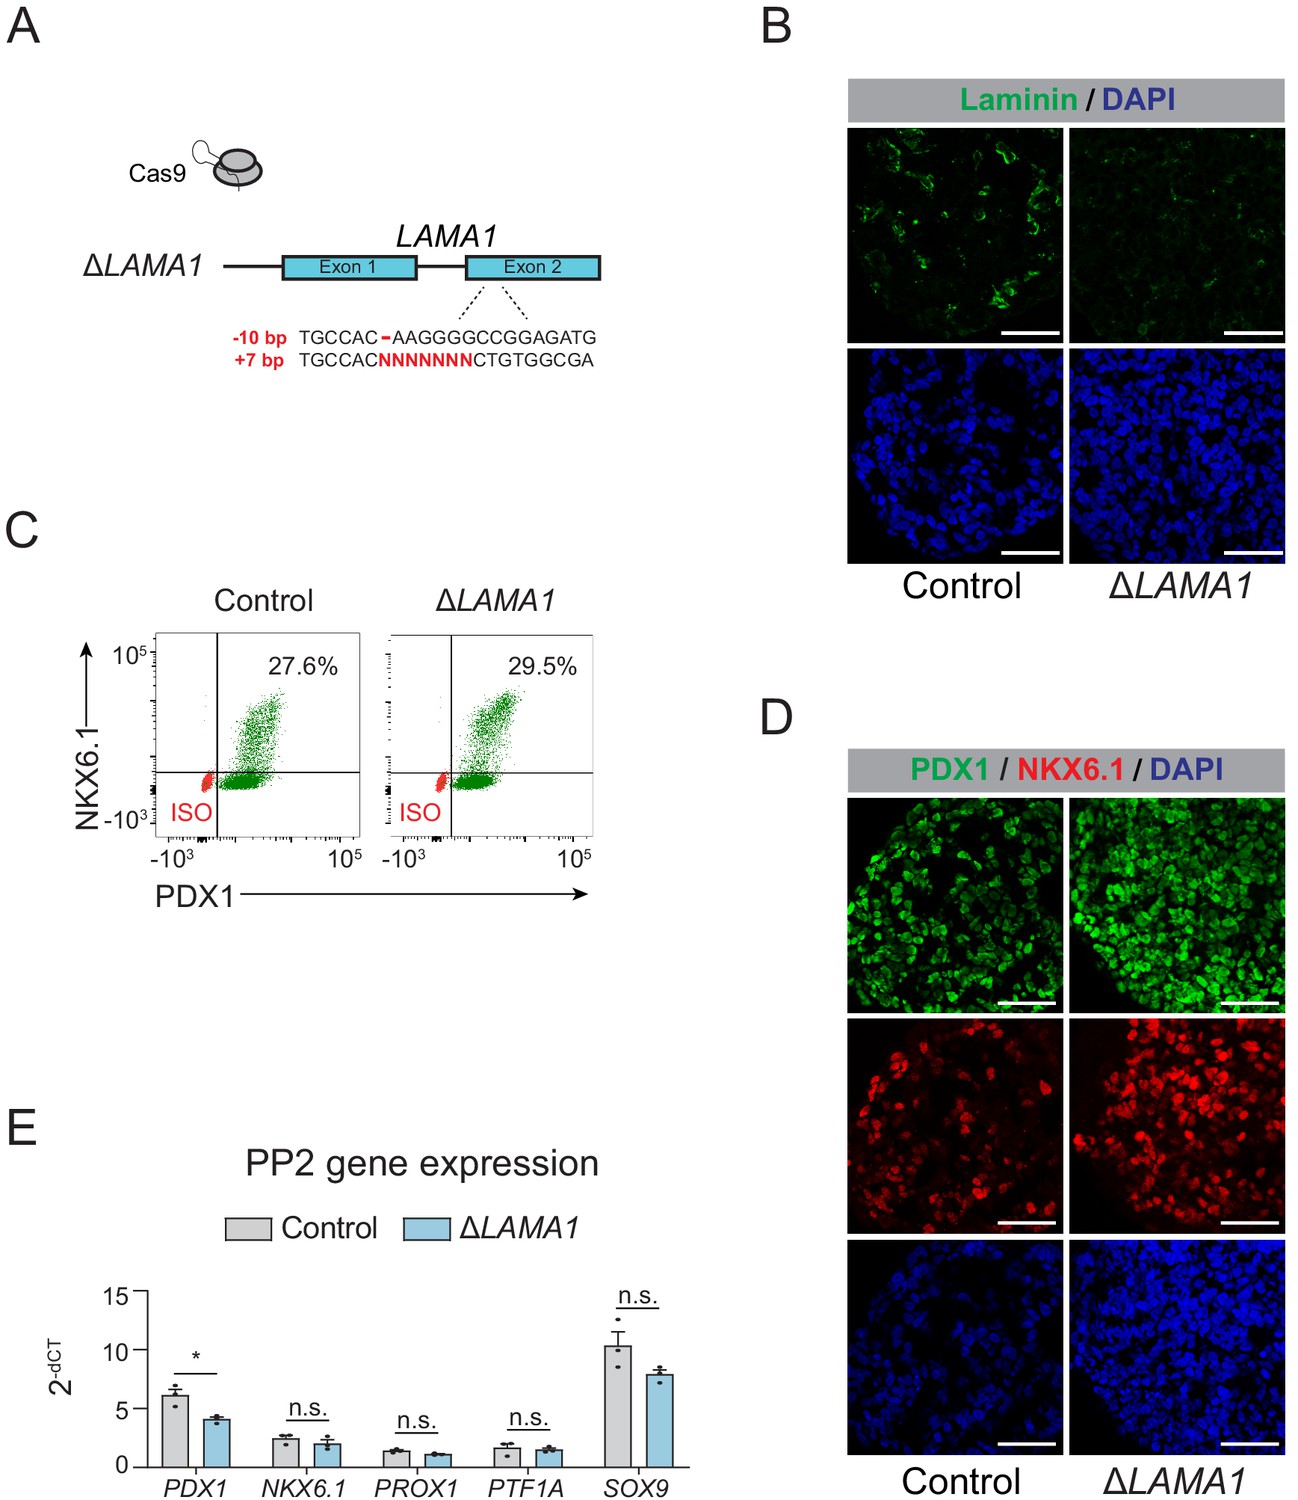
(A) Schematic illustrating CRISPR-Cas9-mediated deletion strategy of LAMA1 to generate ∆LAMA1 hESC clonal line. (B) Immunofluorescent staining for Laminin in control and ∆LAMA1 PP2 cells (representative images, n = 2 independent slides). Scale bar, 50 μm. (C) Flow cytometry analysis for NKX6.1 and PDX1 comparing control and ∆LAMA1 PP2 cells. Isotype control (ISO) for each antibody is shown in red and target protein staining in green. Percentage of cells expressing each protein is indicated. (D) Immunofluorescent staining for NKX6.1 and PDX1 in control and ∆LAMA1 PP2 cells (representative images, n = 2 independent slides). Scale bar, 50 μm. (E) mRNA expression of pancreatic transcription factors determined by qPCR in control and ∆LAMA1 PP2 cells. Data are shown as mean ± S.E.M. (n = 3 replicates from independent differentiations. n = 3 technical replicates for each sample; p=2.19 × 10⁻², 0.360, 6.25 × 10⁻², 0.710, and 0.122 for comparisons of PDX1, NKX6.1, PROX1, PTF1A, and SOX9 expression in control compared to ∆LAMA1 PP2 cells, respectively; student’s t-test, two sided; n.s., not significant, *p<0.01). Each plotted point represents the average of technical replicates for each differentiation.
Figure 5 with 3 supplements

A T2D risk-associated CRB2 pancreatic progenitor-specific stretch enhancer regulates CRB2 expression specifically in pancreatic progenitors.
(A) (Top) Locus plots showing T2D association p-values for variants in a 35 kb window (hg19 chr9:126,112,000–126,147,000) at the CRB2 locus and CRB2 PSSE (red box). Fine mapped variants within the 99% credible set for the novel CRB2 locus are colored black. All other variants are colored light gray. (Bottom) Chromatin states and ATAC-seq signal in ES, DE, GT, PP1, and PP2. TssA, active promoter; TssFlnk, flanking transcription start site; TssBiv, bivalent promoter; Repr, repressed; EnhA, active enhancer; EnhP, poised enhancer. (B) FOXA1, FOXA2, GATA4, GATA6, HNF6, SOX9, and PDX1 ChIP-seq profiles at the CRB2 PSSE in PP2. The variant rs2491353 (black) overlaps with transcription factor binding sites. (C) CRB2 mRNA expression at each developmental stage determined by RNA-seq, measured in fragments per kilobase per million fragments mapped (FPKM). Data shown as mean ± S.E.M. (n = 3 replicates from independent differentiations). Light blue and purple indicate classification of the CRB2 PSSE as typical enhancer (TE) and stretch enhancer (SE), respectively. Plotted points represent average of technical replicates for each differentiation. (D) CRB2 mRNA expression at each developmental stage determined by qPCR in control and ∆CRB2Enh cells. Data are shown as mean ± S.E.M. (n = 3 replicates from independent differentiations for control cells. ∆CRB2Enh cells represent combined data from two clonal lines with three replicates for each line from independent differentiations. n = 3 technical replicates for each sample; p=7.03 × 10⁻⁴,<1 × 10⁻⁶,<1 × 10⁻⁶, 1.46 × 10⁻², and <1 × 10⁻⁶ for comparisons in ES, DE, GT, PP1, and PP2, respectively; student’s t-test, two sided; ***p<0.001 **p<0.01). Light blue and purple indicate classification of the CRB2 PSSE as TE and SE, respectively. Each plotted point represents the average of technical replicates for each differentiation. (E) mRNA expression determined by RNA-seq at PP2 of genes expressed in either control or ∆CRB2Enh cells (FPKM ≥ 1 at PP2) and located within the same topologically associated domain as CRB2. Data are shown as mean FPKM ± S.E.M. (n = 2 replicates from independent differentiations for control cells. ∆CRB2Enh cells represent combined data from two clonal lines with two replicates for each line from independent differentiations. p adj. = 0.158, 1.00, and 3.51 × 10⁻³, for MIR600HG, STRBP, and CRB2, respectively; DESeq2; **p<0.01, n.s., not significant). See also Figure 5—figure supplements 1–3.
-
Figure 5—source data 1
Genes downregulated in ∆CRB2Enh PP2 stage cells compared to control cells (p adj. <0.05).
- https://cdn.elifesciences.org/articles/59067/elife-59067-fig5-data1-v1.xlsx
Figure 5—figure supplement 1
Activity of CRB2- and PGM1-associated pancreatic progenitor-specific stretch enhancers across human tissues.
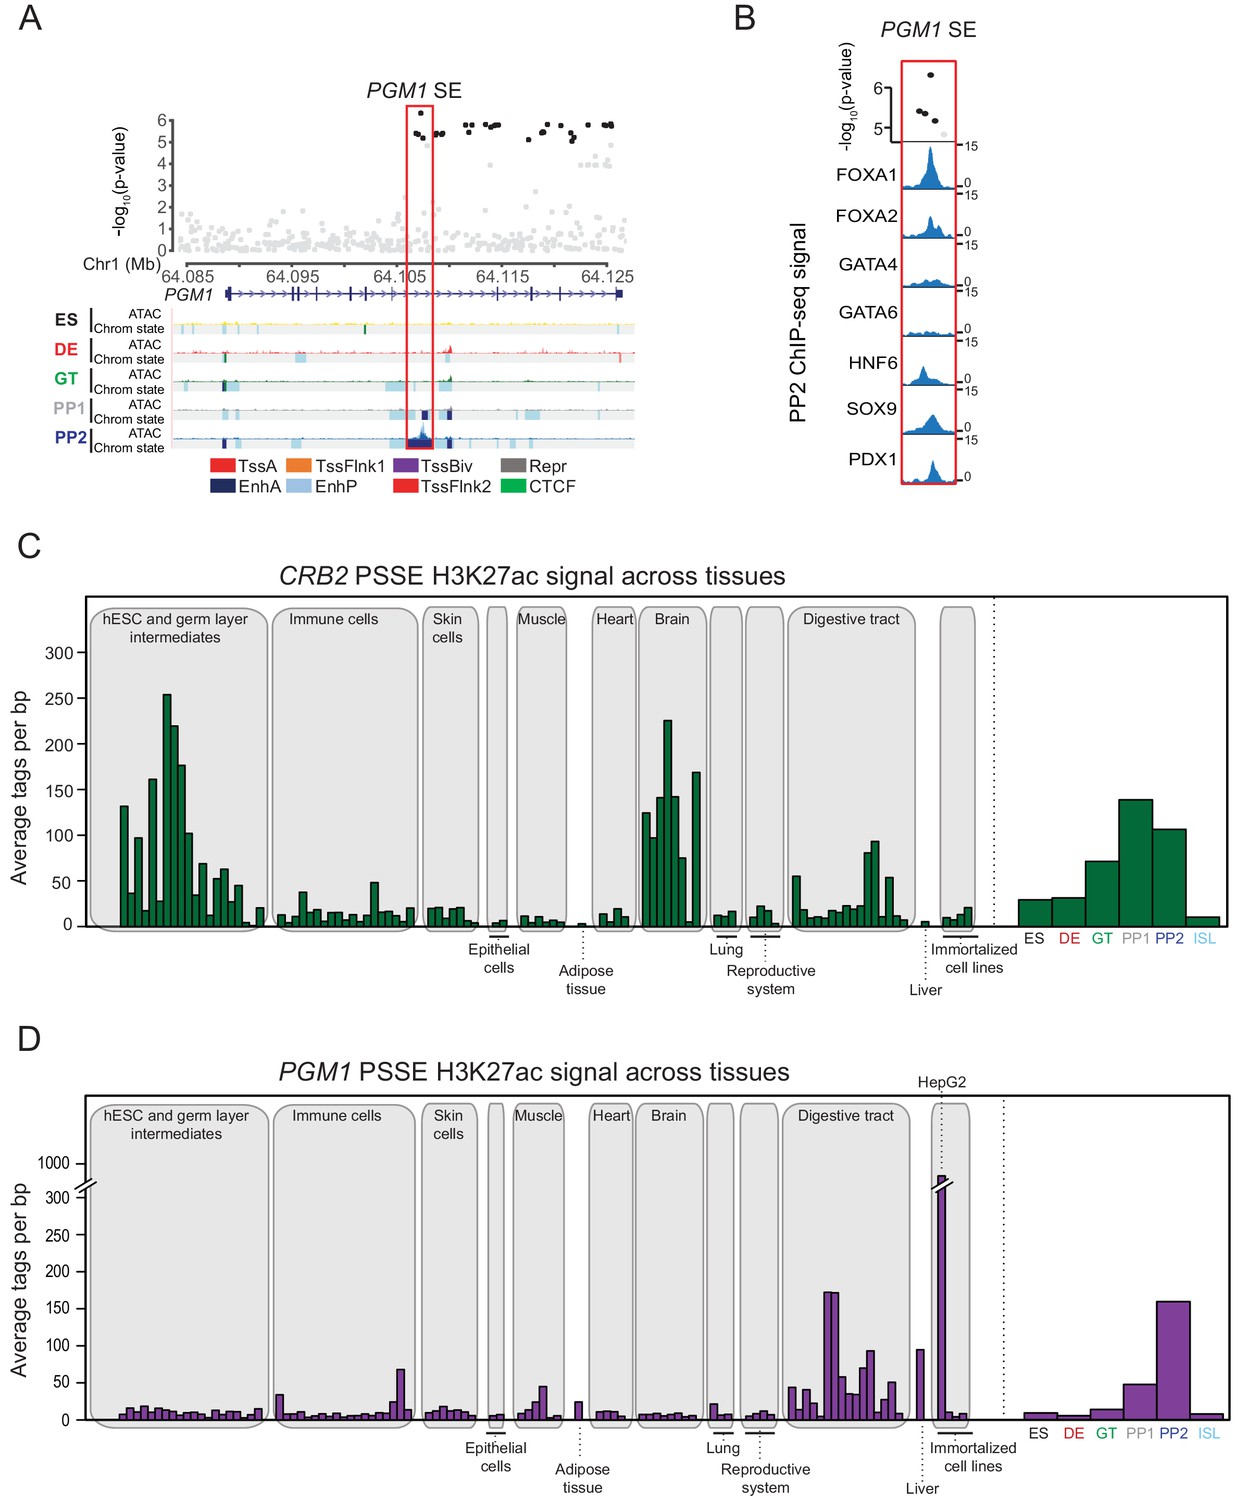
(A) (Top) Locus plots showing T2D association p-values for variants in a 43 kb window (hg19 chr1:64,084,000–64,127,000) at the PGM1 locus and PGM1 PSSE (red box). Fine mapped variants within the 99% credible set for the novel PGM1 locus are colored black. All other variants are colored light gray. (Bottom) Chromatin states and ATAC-seq signal in ES, DE, GT, PP1, and PP2. TssA, active promoter; TssFlnk, flanking transcription start site; TssBiv, bivalent promoter; Repr, repressed; EnhA, active enhancer; EnhP, poised enhancer. (B) FOXA1, FOXA2, GATA4, GATA6, HNF6, SOX9, and PDX1 ChIP-seq profiles at the PGM1 PSSE in PP2 cells. The variants rs2269247, rs2301055, rs2301054, and rs2269246 (black) overlap with transcription factor binding sites. (C) H3K27ac signal at CRB2-associated PSSE in tissues and cell lines from the ENCODE and Epigenome Roadmap projects as well as in developmental intermediates and islets (ISL). (D) H3K27ac signal at PGM1-associated PSSE in tissues and cell lines from the ENCODE and Epigenome Roadmap projects as well as in developmental intermediates and islets.
Figure 5—figure supplement 2
Deletion of the CRB2-associated pancreatic progenitor-specific enhancer does not affect pancreatic lineage specification.
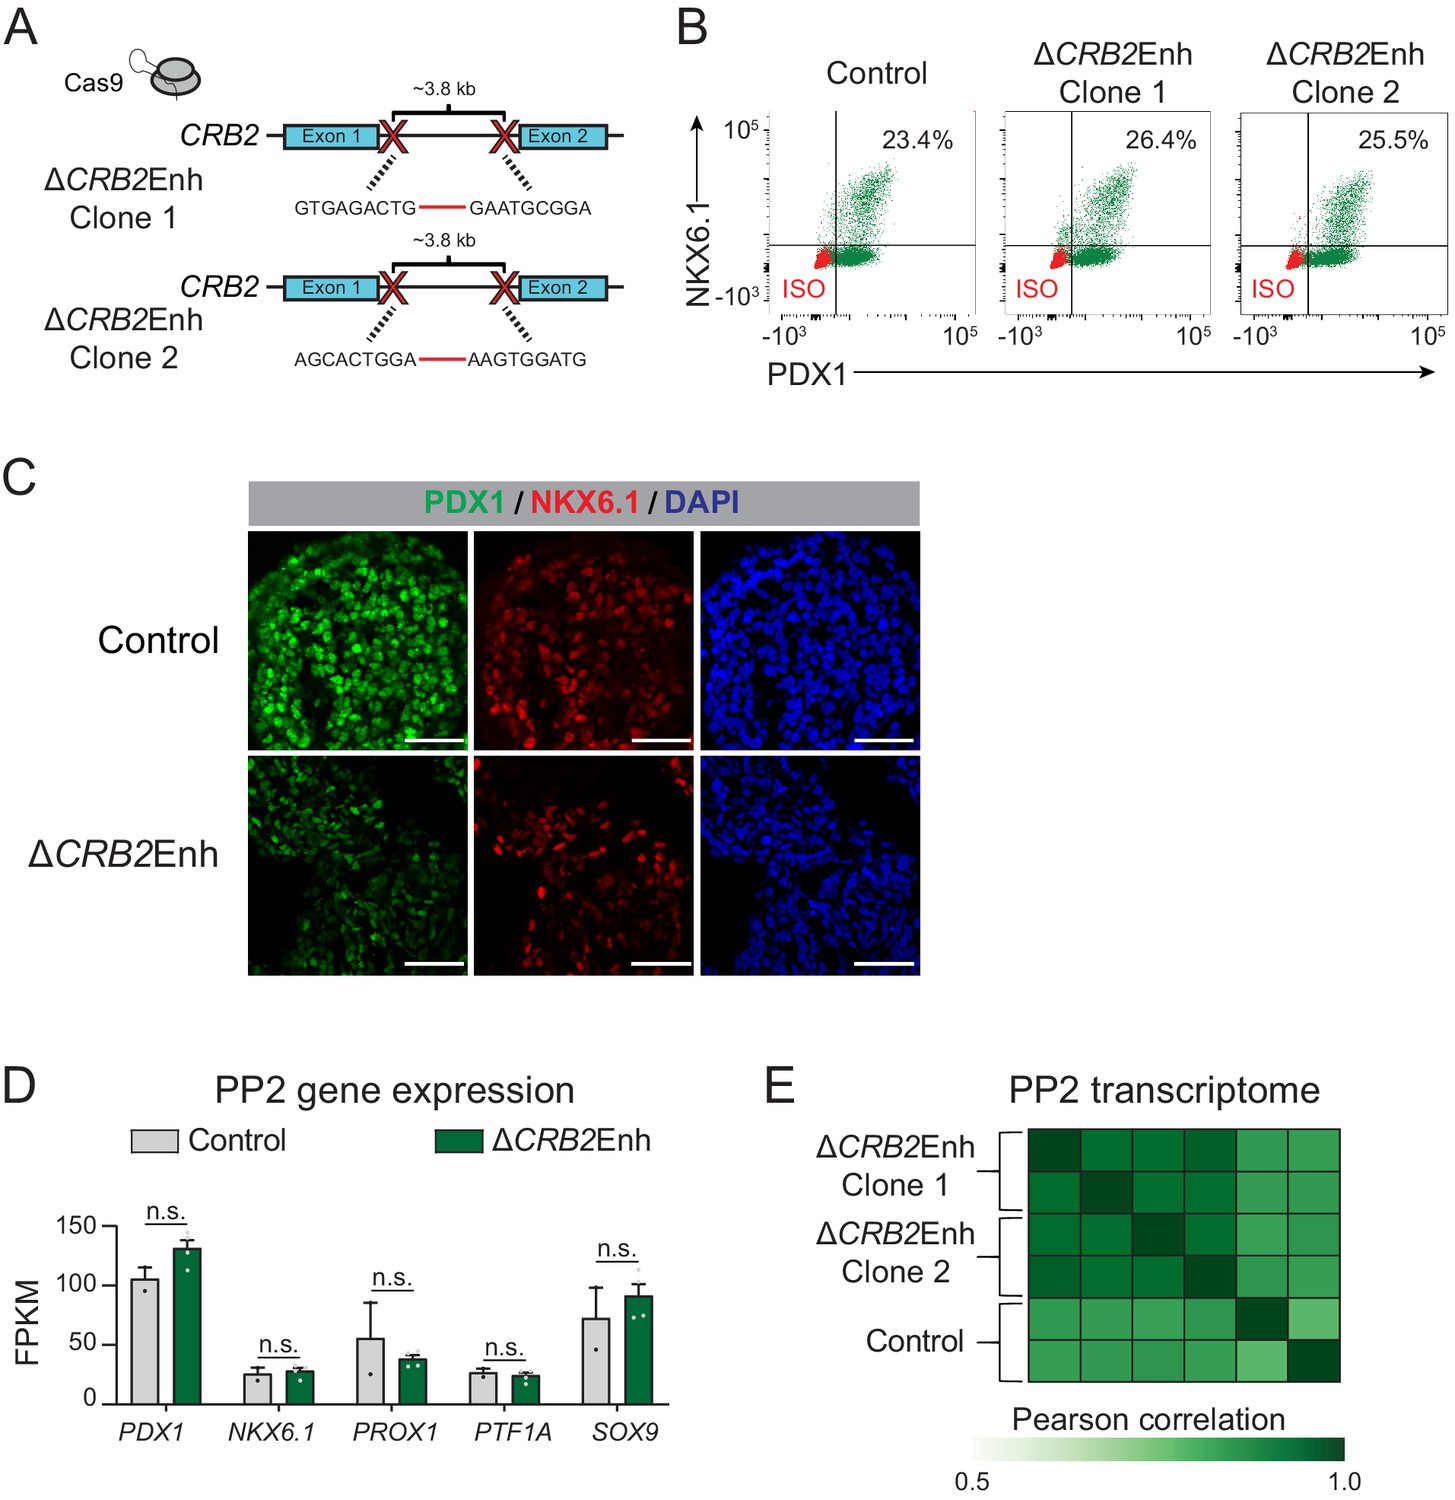
(A) Schematic illustrating CRISPR-Cas9-mediated deletion strategy of CRB2-associated PSSE to generate independent ∆CRB2Enh hESC clones with different DNA cleavage products. (B) Flow cytometry analysis for NKX6.1 and PDX1 comparing control and ∆CRB2Enh PP2 cells. Isotype control (ISO) for each antibody is shown in red and target protein staining in green. Percentage of cells expressing each protein is indicated (representative experiment, n = 3 independent differentiations). (C) Immunofluorescent staining for NKX6.1 and PDX1 in control and ∆CRB2Enh PP2 cells (representative images, n = 2 independent slides). Scale bar, 50 μm. (D) mRNA expression of pancreatic transcription factors determined by RNA-seq in control and ∆CRB2Enh PP2 cells. Data are shown as mean of fragments per kilobase per million fragments mapped (FPKM) ± S.E.M. (n = 2 replicates from independent differentiations for control cells ∆CRB2Enh cells represent combined data from two clonal lines with two replicates for each line from independent differentiations. p adj. = 1.00, 1.00, 1.00, 1.00, and 1.00, for comparisons of PDX1, NKX6.1, PROX1, PTF1A, and SOX9, respectively; DESeq2; n.s., not significant). (E) Similarity matrix showing Pearson correlations for normalized transcriptomes (log transformed expression for genes with FPKM ≥1 in ≥1 replicates) in control and ∆CRB2Enh PP2 cells (n = 2 independent differentiations for control cells and for each ∆CRB2Enh clone). See also Figure 5—source data 1.
Figure 5—figure supplement 3
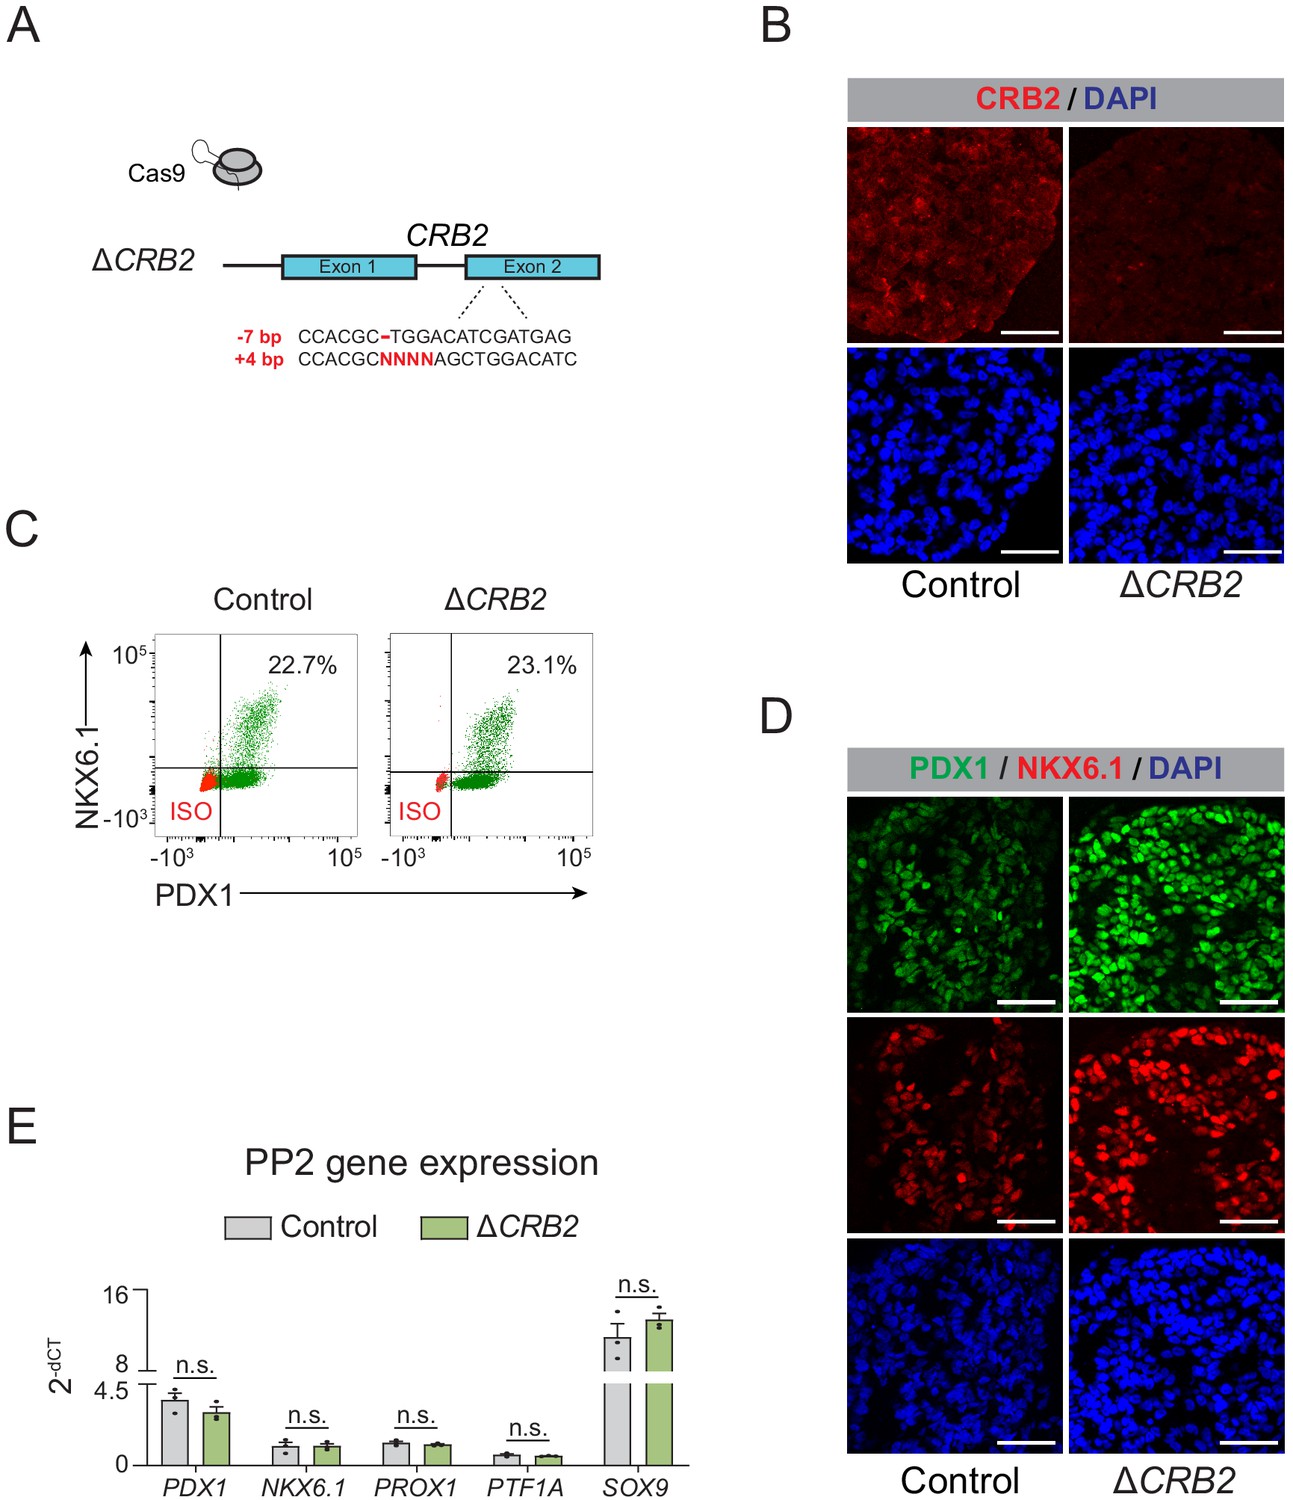
Deletion of CRB2 does not affect pancreatic lineage specification.
(A) Schematic illustrating CRISPR-Cas9-mediated deletion strategy of CRB2 to generate ∆CRB2 hESC clonal line. (B) Immunofluorescent staining for CRB2 in control and ∆CRB2 PP2 cells (representative images, n = 2 independent slides). Scale bar, 50 μm. (C) Flow cytometry analysis for NKX6.1 and PDX1 comparing control and ∆CRB2 PP2 cells. Isotype control (ISO) for each antibody is shown in red and target protein staining in green. Percentage of cells expressing each protein is indicated. (D) Immunofluorescent staining for NKX6.1 and PDX1 in control and ∆CRB2 PP2 cells (representative images, n = 2 independent slides). Scale bar, 50 μm. (E) mRNA expression of pancreatic transcription factors determined by qPCR in control and ∆CRB2 PP2 cells. Data are shown as mean ± S.E.M. (n = 3 replicates from independent differentiations. n = 3 technical replicates for each sample; p=0.241, 0.971, 0.397, 0.374, and 0.311 for comparisons of PDX1, NKX6.1, PROX1, PTF1A, and SOX9 expression in control compared to ∆CRB2 PP2 cells, respectively; student’s t-test, two sided; n.s., not significant). Each plotted point represents the average of technical replicates for each differentiation.
Figure 6 with 4 supplements
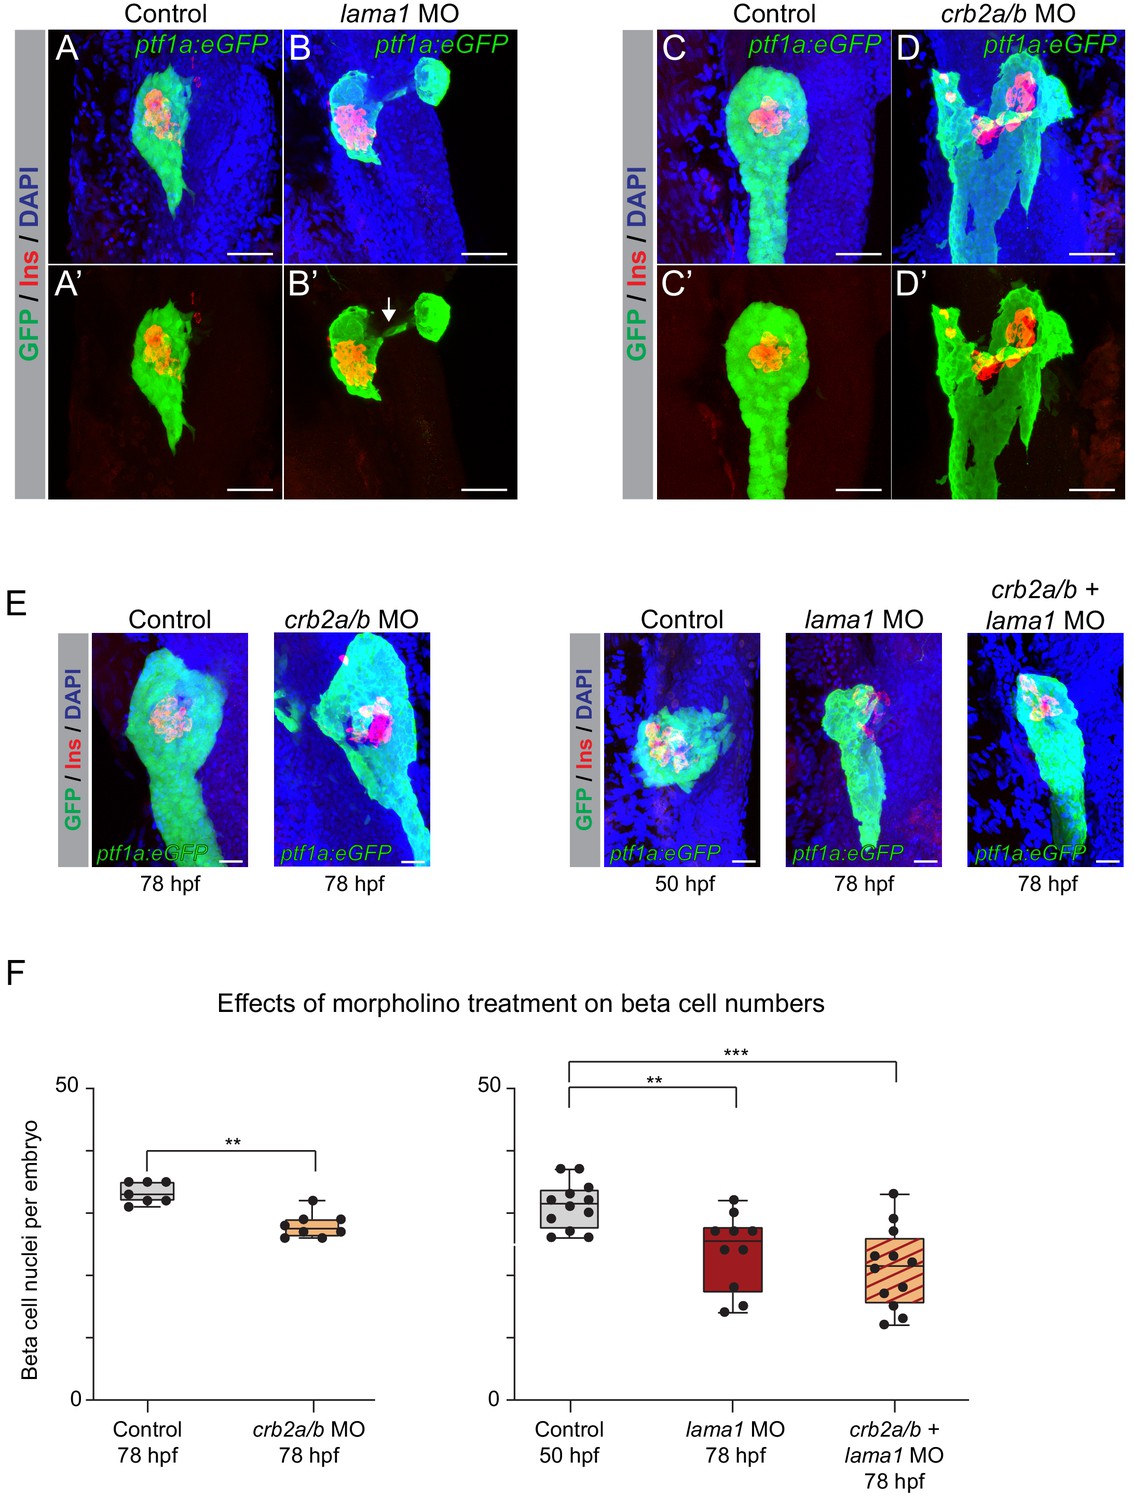
lama1 and crb2 regulate pancreas morphogenesis and beta cell differentiation.
(A,B) Representative 3D renderings of Tg(ptf1a:eGFP)jh1 control zebrafish embryos (A,A’) and lama1 morphants (B,B’) stained with DAPI (nuclei, blue) and antibody against insulin (red); n ≥ 15 embryos per condition. To account for reduced acinar pancreas size in lama1 morphants, control embryos were imaged at 50 hr post fertilization (hpf) and lama1 morphants at 78 hpf. 15 out of 34 lama1 morphants displayed an annular pancreas with two acinar pancreas domains (green) connected behind the presumptive intestine (B’, white arrow). Scale bar, 40 µM. (C,D) Representative 3D renderings of 78 hpf Tg(ptf1a:eGFP)jh1 control zebrafish embryos (C,C’) and crb2a/b morphants (D,D’) stained with DAPI (nuclei, blue) and antibodies against insulin (red); n ≥ 15 embryos per condition. Twenty-seven out of 69 crb2a/b morphants displayed an annular pancreas with the acinar pancreas (green) completely surrounding the presumptive intestine. Scale bar, 40 µM. (E) Representative 3D renderings of Tg(ptf1a:eGFP)jh1 control zebrafish embryos and crb2a/b, lama1, or crb2a/b + lama1 morphants stained with DAPI (nuclei, blue) and antibody against insulin (red). All embryos were imaged at 78 hpf except for controls to lama1 and crb2a/b + lama1 morphants, which were imaged at 50 hpf to account for reduced acinar pancreas size of lama1 morphants. Scale bar, 20 µM. (F) Quantification of beta (insulin+) cell nuclei per embryo from experiment in (E). p adj. = 4.0 × 10⁻³, 8.0 × 10⁻³, and 2.0 × 10⁻⁴ for comparison of hfp 78 control (n = 7 embryos) to hfp 78 crb2a/b (n = 8), hpf 50 control (n = 12) to hpf 78 lama1 (n = 10), or crb2a/b + lama1 (n = 12) morphants, respectively; ANOVA-Dunnett’s multiple comparison test; ***p<0.001 **p<0.01. 5 out of 8 crb2a/b, 3 out of 10 lama1, and 9 out of 12 crb2a/b + lama1 morphants displayed an annular pancreas. MO, morpholino; Control, standard control morpholino. See also Figure 6—figure supplements 1–4.
Figure 6—figure supplement 1
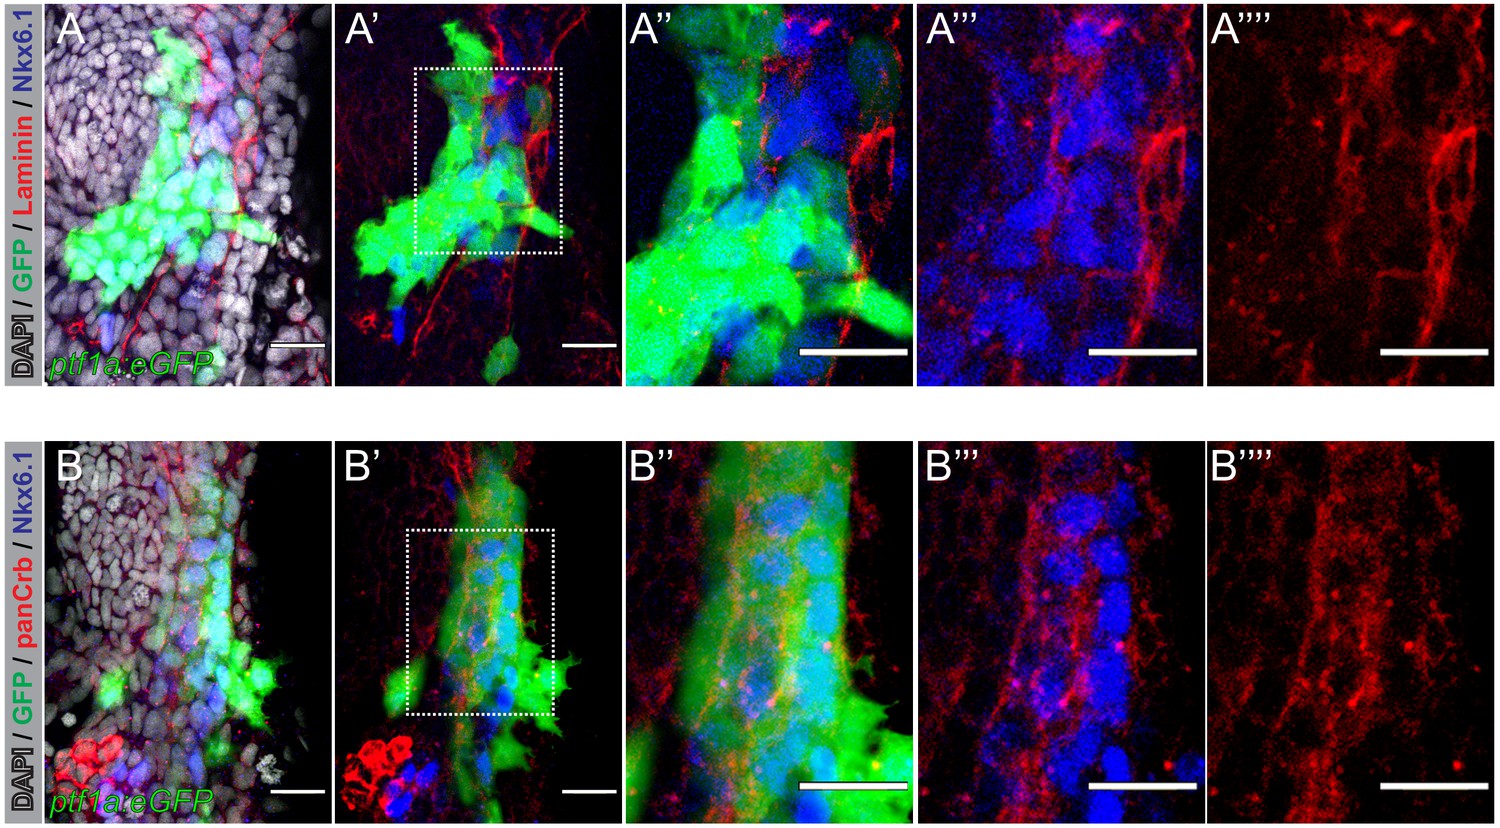
Laminin and Crb are expressed in zebrafish pancreas progenitors.
(A,B) Confocal images of 36 hr post fertilization (hpf) Tg(ptf1a:eGFP)jh1 zebrafish foregut endoderm labeled with DAPI (nuclei, grey) and antibodies against Nkx6.1 (blue; pancreatic progenitors) and Laminin (A, red) or panCrb (B, red); n = 10 embryos stained. (A–A”’’) Z-focal plane image showing pancreatic progenitor cells marked by Nkx6.1 (blue) and low level ptf1a:eGFP, labeled with anti-Laminin antibodies (red). (B–B”’’) Pancreatic progenitors labeled with anti-panCrb antibodies (red). Scale bar, 20 µM.
Figure 6—figure supplement 2
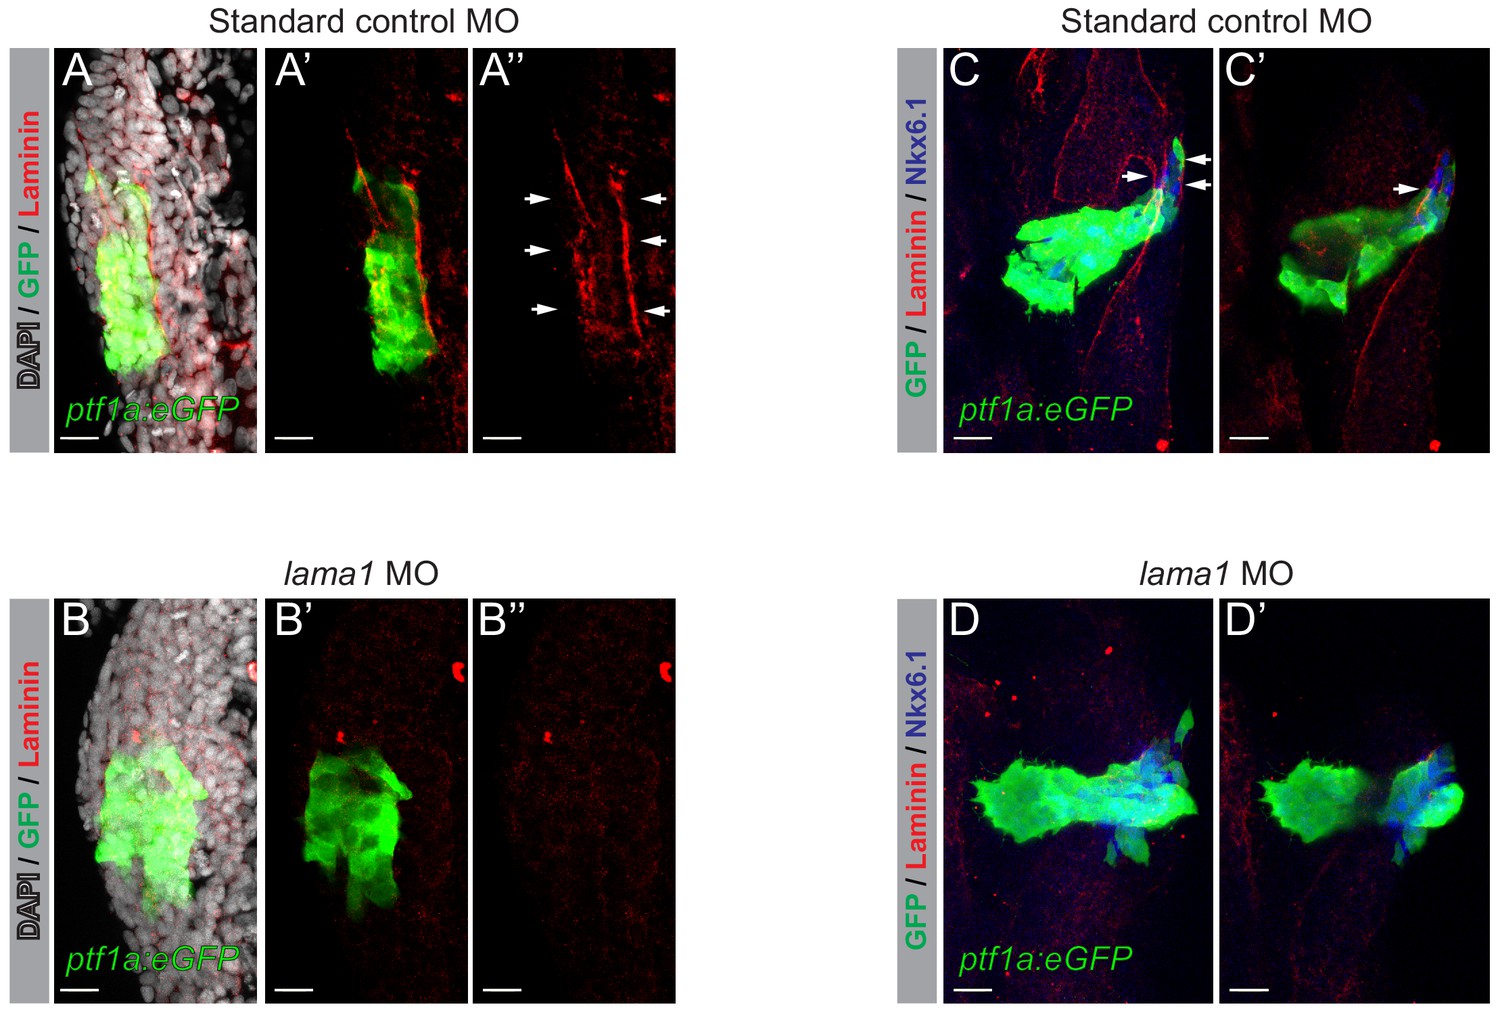
Validation of morpholinos targeting lama1.
Confocal images (3D rendered) of 32–34 hpf Tg(ptf1a:eGFP)jh1 zebrafish foregut endoderm labeled with DAPI (nuclei, grey) and anti-Laminin antibodies (red). (A–A’’) Z-focal plane image of pancreatic progenitors marked by ptf1a:eGFP (green) and labeled with anti-Laminin antibodies (red) from embryos injected with non-targeting standard control morpholinos (n = 6). (B–B’’) Z-focal plane image showing loss of Laminin staining (red) in pancreatic progenitors marked by ptf1a:eGFP (green) from embryos injected with morpholinos targeting lama1 (n = 5/6). (C,D) 3D renderings of 45 hpf Tg(ptf1a:eGFP)jh1 zebrafish foregut endoderm labeled with antibodies against Nkx6.1 (blue) and Laminin (red). (C–C’’) Z-focal plane image of pancreatic progenitors marked by ptf1a:eGFP (green) and labeled with anti-Nkx6.1 (blue) and anti-Laminin (red) antibodies from embryos injected with standard control morpholinos (n = 4/4). (D–D’’) Z-focal plane image showing loss of Laminin staining (red) in pancreatic progenitors marked by ptf1:eGFP and labeled with anti-Nkx6.1 antibodies (blue) from embryos injected with morpholinos targeting lama1 (n = 3/4). Scale bar, 20 µM. Arrows highlight pancreatic progenitors marked by Laminin (red), Nkx6.1 (blue) and ptf1a:eGFP. MO, morpholino.
Figure 6—figure supplement 3
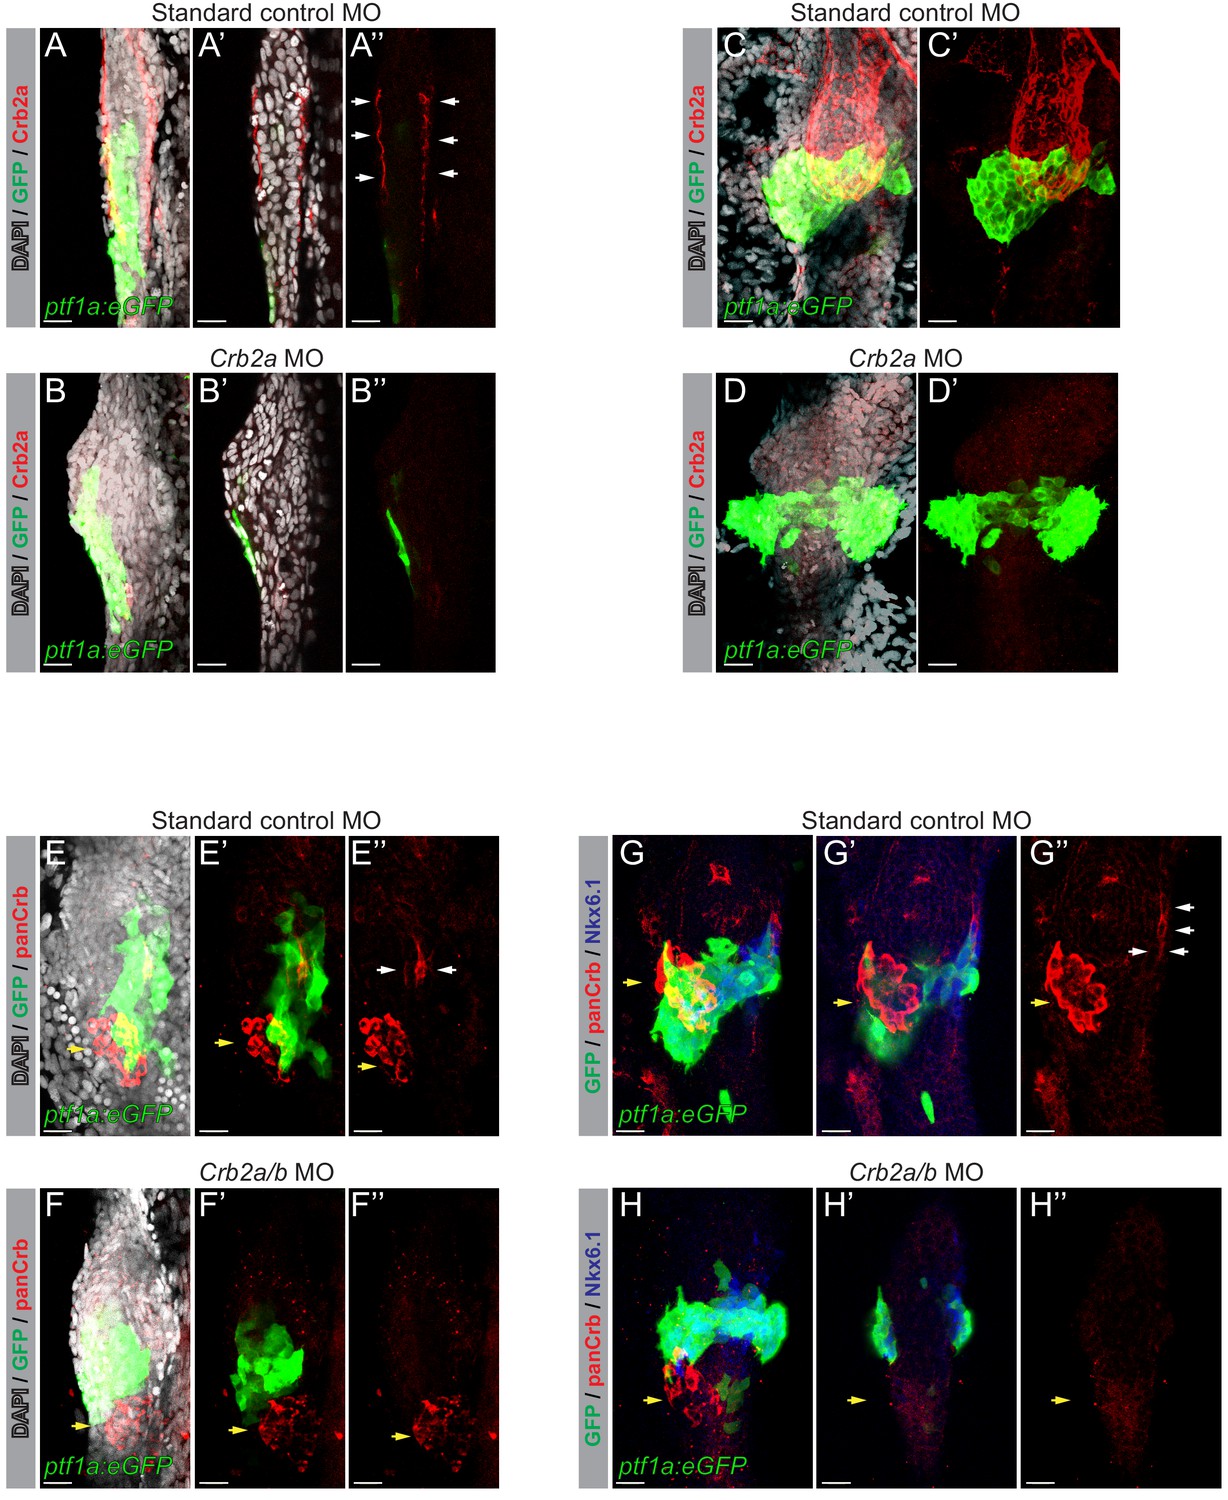
Validation of morpholinos targeting crb2a and crb2b.
(A,B) 3D renderings of 32–34 hpf Tg(ptf1a:eGFP)jh1 zebrafish foregut endoderm labeled with DAPI (nuclei, grey) and anti-Crb2a antibodies (red). (A–A’’) Z-focal plane image showing Crb2a labeled (red) foregut endoderm from embryos injected with standard control morpholinos (n = 6). (B–B’’) Z-focal plane image showing loss of Crb2a staining (red) in the foregut endoderm from embryos injected with morpholinos targeting crb2a (n = 6/6). (C,D) 3D renderings of 45 hpf Tg(ptf1a:eGFP)jh1 zebrafish foregut endoderm labeled with DAPI (nuclei, grey) and anti-Crb2a antibodies (red). (C–C’) Z-focal plane image showing Crb2a-labeled (red) embryos injected with standard control morpholinos (n = 3). (D–D’) Z-focal plane image showing loss of Crb2a staining (red) in embryos injected with morpholinos targeting crb2a (n = 3/3).(E,F) 3D renderings of 32–34 hpf Tg(ptf1a:eGFP)jh1 zebrafish foregut endoderm labeled with DAPI (nuclei, grey) and anti-panCrb antibodies (red). (E–E’’) Z-focal plane image showing pancreatic progenitors marked by ptf1a:eGFP (green) and labeled with anti-panCrb antibodies (red; white arrows) from embryos injected with standard control morpholinos (n = 8). (F–F’’) Z-focal plane image showing reduced panCrb (red) staining in pancreatic progenitors marked by ptf1a:eGFP (green) from embryos injected with morpholinos targeting both crb2a and crb2b (n = 4/5). (G,H) 3D renderings of 45 hpf Tg(ptf1a:eGFP)jh1 zebrafish foregut endoderm labeled with anti-Nkx6.1 (blue) and anti-panCrb (red) antibodies. (G–G’’) Z-focal plane image showing pancreatic progenitors marked by ptf1a:eGFP (green) and labeled with anti-Nkx6.1 (blue) and anti-panCrb (red; white arrows) antibodies from embryos injected with standard control morpholinos (n = 4). (H–H’’) Z-focal plane image showing reduced panCrb (red) staining in pancreatic progenitors marked by ptf1a:eGFP and labeled with anti-Nkx6.1 antibodies (blue) from embryos injected with morpholinos targeting both crb2a and crb2b (n = 3/4). Yellow arrows denote dorsal pancreas where panCrb labeling remains in control injected embryos, possibly due to expression of alternate Crb proteins present within the dorsal pancreas. Scale bar, 20 µM. MO, morpholino.
Figure 6—figure supplement 4
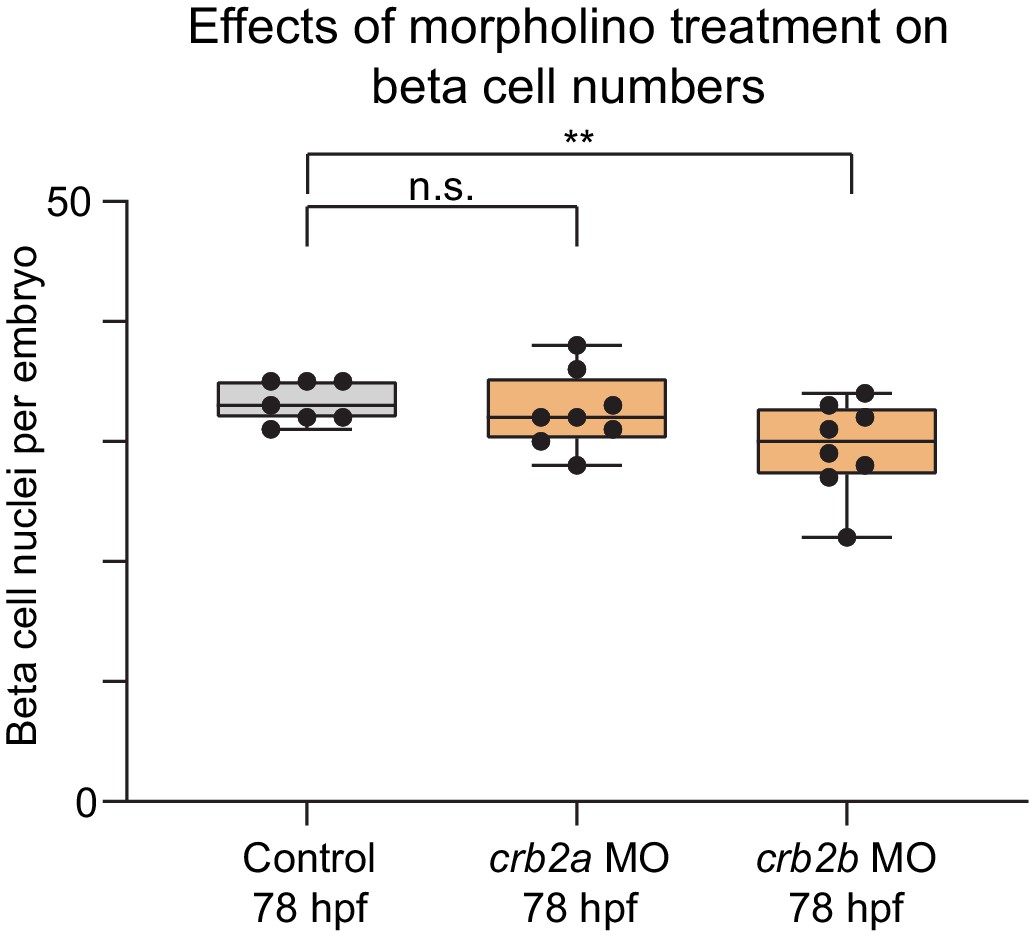
crb2b but not crb2a regulates pancreatic beta cell differentiation.
Quantification of beta (insulin+) cell nuclei per embryo in Tg(ptf1a:eGFP)jh1 control zebrafish embryos and crb2a or crb2b morphants at 78 hr post fertilization (hpf). p adj. = 0.91 and 4.4 × 10⁻² for comparison of control (n = 7 embryos) to crb2a (n = 8) or crb2b (n = 8) morphants, respectively; ANOVA-Dunnett’s multiple comparison test; **p<0.01, n.s., not significant. 0 out of 8 crb2a, 0 out of 8 crb2b morphants displayed an annular pancreas. MO, morpholino; Control, standard control morpholino.
Tables
Key resources table
| Reagent type (species) or resource | Designation | Source or reference | Identifiers | Additional information |
|---|---|---|---|---|
| Antibody | APC Mouse monoclonal IgG1, κ Isotype Control | BD Pharmingen | Cat# 555751, RRID:AB_398613 | Flow cytometry (1:100) |
| Antibody | Chicken polyclonal anti-GFP | Aves Labs | Cat# GFP-1020, RRID:AB_10000240 | Immunohistochemistry (1:200) |
| Antibody | Cy3-conjugated donkey polyclonal anti-mouse | Jackson ImmunoResearch Labs | Cat# 715-165-150, RRID:AB_2340813 | Immunofluorescence (1:1000) |
| Antibody | DyLight 488-conjugated donkey polyconal anti-goat | Jackson ImmunoResearch Labs | Cat# 705-545-003, RRID:AB_2340428 | Immunofluorescence (1:500) |
| Antibody | Goat polyclonal anti-CTCF | Santa Cruz Biotechnology | Cat# SC-15914X, RRID:AB_2086899 | ChIP-seq (4 ug) |
| Antibody | Goat polyclonal anti-FOXA1 | Abcam | Cat# ab5089, RRID:AB_304744 | ChIP-seq (4 ug) |
| Antibody | Goat polyclonal anti-FOXA2 | Santa Cruz Biotechnology | Cat# sc-6554, RRID:AB_2262810 | ChIP-seq (4 ug) |
| Antibody | Goat polyclonal anti-GATA4 | Santa Cruz Biotechnology | Cat# sc-1237, RRID:AB_2108747 | ChIP-seq (4 ug) |
| Antibody | Goat polyclonal anti-PDX1 | Abcam | Cat# ab47383, RRID:AB_2162359 | Immunofluorescence (1:500) |
| Antibody | Guinea pig polyclonal anti-Insulin | Biomeda | Cat# v2024 | Immunohistochemistry (1:200) |
| Antibody | Mouse monoclonal anti-Crb2a | ZIRC | Cat# Zs-4 | Immunohistochemistry (1:100) |
| Antibody | Mouse polyclonal anti-GATA6 | Santa Cruz Biotechnology | Cat# sc-9055, RRID:AB_2108768 | ChIP-seq (4 ug) |
| Antibody | Mouse monoclonal anti-NKX6.1 | Developmental Studies Hybridoma Bank | Cat# F64A6B4, RRID:AB_532380 | Immunofluorescence (1:300) |
| Antibody | Mouse monoclonal anti-NKX6.1-Alexa Fluor 647 | BD Biosciences | Cat# 563338, RRID:AB_2738144 | Flow cytometry (1:5) |
| Antibody | Mouse monoclonal anti-NKX6.1 | Developmental Studies Hybridoma Bank | Cat# F55A10, RRID:AB_532378 | Immunohistochemistry (1:10) |
| Antibody | Mouse monoclonal anti-PDX1-PE | BD Biosciences | Cat# 562161, RRID:AB_10893589 | Flow cytometry (1:10) |
| Antibody | PE Mouse monoclonal IgG1, κ Isotype Control | BD Pharmingen | Cat# 555749, RRID:AB_396091 | Flow cytometry (1:100) |
| Antibody | Rabbit polyclonal anti-CRB2 | Sigma | Cat # SAB1301340 | Immunofluorescence (1:500) |
| Antibody | Rabbit polyclonal anti-H3K27ac | Active Motif | Cat# 39133, RRID:AB_2561016 | ChIP-seq (4 ug) |
| Antibody | Rabbit polyclonal anti-H3K4me1 | Abcam | Cat# ab8895, RRID:AB_306847 | ChIP-seq (4 ug) |
| Antibody | Rabbit polyclonal anti-HNF6 | Santa Cruz Biotechnology | Cat# sc-13050, RRID:AB_2251852 | ChIP-seq (4 ug) |
| Antibody | Rabbit polyclonal anti-laminin | Sigma | Cat# L9393, RRID:AB_477163 | Immunohistochemistry (1:100) Immunofluorescence (1:30) |
| Antibody | Rabbit monoclonal anti-panCrb | Jensen Laboratory, University of Massachusetts, Amherst | N/A | Immunohistochemistry (1:100) |
| Antibody | Rabbit polyclonal anti-PDX1 | Beta Cell Biology Consortium | AB1068 | ChIP-seq (4 ug) |
| Antibody | Rabbit polyclonal anti-SOX9 | Chemicon | Cat# 5535, RRID:AB_2239761 | ChIP-seq (4 ug) |
| Cell line (Homo-sapiens) | CyT49 | ViaCyte, Inc | NIHhESC-10–0041, RRID:CVCL_B850 | Male |
| Cell line (Homo-sapiens) | H1 | WiCell Research Institute | NIHhESC-10–0043, RRID:CVCL_9771 | Male |
| Chemical compound, drug | 2-Mercaptoethanol | Thermo Fisher Scientific | Cat# 21985023 | |
| Chemical compound, drug | Accutase | Thermo Fisher Scientific | Cat# 00-4555-56 | |
| Chemical compound, drug | B-27 supplement | Thermo Fisher Scientific | Cat# 17504044 | |
| Chemical compound, drug | Bovine Albumin Fraction V | Life Technologies | Cat# 15260037 | |
| Chemical compound, drug | D-(+)-Glucose Solution, 45% | Sigma-Aldrich | Cat# G8769 | |
| Chemical compound, drug | DAPI | Invitrogen | Cat# D1306 | Immunohistochemistry (1:200) |
| Chemical compound, drug | DMEM High Glucose | VWR | Cat# 16750–082 | |
| Chemical compound, drug | DMEM/F12 [-] L-glutamine | VWR | Cat# 15–090-CV | |
| Chemical compound, drug | DMEM/F12 with L-Glutamine, HEPES | Corning | Cat# 45000–350 | |
| Chemical compound, drug | DMF | EMD Millipore | Cat# DX1730 | |
| Chemical compound, drug | DPBS | Thermo Fisher Scientific | Cat# 21–031-CV | |
| Chemical compound, drug | DTT | Sigma | Cat# D9779 | |
| Chemical compound, drug | Fetal Bovine Serum | Thermo Fisher Scientific | Cat# MT35011CV | |
| Chemical compound, drug | Glutamax | Thermo Fisher Scientific | Cat# 35050–079 | |
| Chemical compound, drug | GlutaMAX | Thermo Fisher Scientific | Cat# 35050061 | |
| Chemical compound, drug | Hoechst 33342 | Thermo Fisher Scientific | Cat# H3570 | |
| Chemical compound, drug | HyClone Dulbecco’s Modified Eagles Medium | Thermo Fisher Scientific | Cat# SH30081.FS | |
| Chemical compound, drug | IGEPAL-CA630 | Sigma | Cat# I8896 | |
| Chemical compound, drug | Illumina tagmentation enzyme | Illumina | Cat# FC-121–1030 | |
| Chemical compound, drug | Insulin-Transferrin-Selenium (ITS) | Thermo Fisher Scientific | Cat# 41400045 | |
| Chemical compound, drug | Insulin-Transferrin-Selenium-Ethanolamine (ITS-X) | Thermo Fisher Scientific | Cat# 51500–056 | |
| Chemical compound, drug | KAAD-Cyclopamine | Toronto Research Chemicals | Cat# K171000 | |
| Chemical compound, drug | K-acetate | Sigma | Cat# P5708 | |
| Chemical compound, drug | KnockOut SR XenoFree | Thermo Fisher Scientific | Cat# A1099202 | |
| Chemical compound, drug | LDN-193189 | Stemgent | Cat# 04–0074 | |
| Chemical compound, drug | Matrigel | Corning | Cat# 356231 | |
| Chemical compound, drug | MCDB 131 | Thermo Fisher Scientific | Cat# 10372–019 | |
| Chemical compound, drug | Mg-acetate | Sigma | Cat# M2545 | |
| Chemical compound, drug | mTeSR1 Complete Kit - GMP | STEMCELL Technologies | Cat# 85850 | |
| Chemical compound, drug | NEBNext High-Fidelity 2X PCR Master Mix | NEB | Cat# M0541 | |
| Chemical compound, drug | Non-Essential Amino Acids | Thermo Fisher Scientific | Cat# 11140050 | |
| Chemical compound, drug | O.C.T. Compound | Sakura Finetek USA | Cat# 25608–930 | |
| Chemical compound, drug | Penicillin-Streptomycin | Thermo Fisher Scientific | Cat# 15140122 | |
| Chemical compound, drug | Polyethylenimine (PEI) | Polysciences | Cat# 23966–1 | |
| Chemical compound, drug | Protease inhibitor | Roche | Cat# 05056489001 | |
| Chemical compound, drug | Retinoic acid | Sigma-Aldrich | Cat# R2625 | |
| Chemical compound, drug | RNA ScreenTape Sample Buffer | Agilent Technologies | Cat# 5067–5577 | |
| Chemical compound, drug | ROCK Inhibitor Y-27632 | STEMCELL Technologies | Cat# 72305 | |
| Chemical compound, drug | RPMI 1640 [-] L-glutamine | VWR | Cat# 15–040-CV | |
| Chemical compound, drug | SANT-1 | Sigma-Aldrich | Cat# S4572 | |
| Chemical compound, drug | Sodium Bicarbonate | Sigma-Aldrich | Cat# NC0564699 | |
| Chemical compound, drug | Tamoxifen | Sigma | Cat# T5648 | |
| Chemical compound, drug | TGF-β RI Kinase Inhibitor IV | Calbiochem | Cat# 616454 | |
| Chemical compound, drug | TPB | Calbiochem | Cat# 565740 | |
| Chemical compound, drug | Tranylcypromine | Cayman Chemical | Cat# 10010494 | |
| Chemical compound, drug | Tris-acetate | Thermo Fisher Scientific | Cat# BP-152 | |
| Chemical compound, drug | TTNPB | Enzo Life Sciences | Cat# BML-GR105 | |
| Chemical compound, drug | Vectashield Antifade Mounting Medium | Vector Laboratories | Cat# H-1000 | |
| Chemical compound, drug | XtremeGene 9 | Roche | Cat# 6365787001 | |
| Commercial assay | High Sensitivity D1000 ScreenTape | Agilent Technologies | Cat# 5067–5584 | |
| Commercial assay, kit | RNA ScreenTape | Agilent Technologies | Cat# 5067–5576 | |
| Commercial assay, kit | RNA ScreenTape Ladder | Agilent Technologies | Cat# 5067–5578 | |
| Commercial assay, kit | BD Cytofix/Cytoperm Plus Fixation/Permeabilization Solution Kit | BD Biosciences | Cat# 554715 | |
| Commercial assay, kit | ChIP-IT High Sensitivity Kit | Active Motif | Cat# 53040 | |
| Commercial assay, kit | iQ SYBR Green Supermix | Bio-Rad | Cat# 1708884 | |
| Commercial assay, kit | iScript cDNA Synthesis Kit | Bio-Rad | Cat# 1708891 | |
| Commercial assay, kit | KAPA Library Preparation Kit (Illumina) | Kapa Biosystems | Cat# KK8234 | |
| Commercial assay, kit | KAPA Stranded mRNA-Seq Kits | Kapa Biosystems | Cat# KK8401 | |
| Commercial assay, kit | MinElute PCR purification kit | QIAGEN | Cat# 28004 | |
| Commercial assay, kit | Qubit ssDNA assay kit | Thermo Fisher Scientific | Cat# Q10212 | |
| Commercial assay, kit | RNeasy Micro Kit | QIAGEN | Cat# 74004 | |
| Genetic reagent (D. rerio) | Tg(ptf1a:eGFP)jh1 | PMID:16258076 | N/A | |
| Other | SPRIselect bead | Beckman Coulter | Cat# B23317 | |
| Recombinant protein | Activin A | R and D Systems | Cat# 338-AC/CF | |
| Recombinant protein | Human AB Serum | Valley Biomedical | Cat# HP1022 | |
| Recombinant protein | Recombinant EGF | R and D Systems | Cat# 236-EG | |
| Recombinant protein | Recombinant Heregulinβ−1 | Peprotech | Cat# 100–03 | |
| Recombinant protein | Recombinant KGF/FGF7 | R and D Systems | Cat# 251 KG | |
| Recombinant protein | Recombinant Mouse Wnt3A | R and D Systems | Cat# 1324-WN/CF | |
| Recombinant protein | Recombinant Noggin | R and D Systems | Cat# 3344 NG | |
| Sequence-based reagent | Px333 Plasmid | http://www.addgene.org/64073/ | RRID:Addgene_64073 | |
| Sequence-based reagent | LAMA1 Forward | This paper | qPCR primers | GTG ATG GCA ACA GCG CAA A |
| Sequence-based reagent | LAMA1 Reverse | This paper | qPCR primers | GAC CCA GTG ATA TTC TCT CCC A |
| Sequence-based reagent | CRB2 Forward | This paper | qPCR primers | ACC ACT GTG CTT GTC CTG AG |
| Sequence-based reagent | CRB2 Reverse | This paper | qPCR primers | TCC AGG GTC GCT AGA TGG AG |
| Sequence-based reagent | TBP Forward | This paper | qPCR primers | TGT GCA CAG GAG CCA AGA GT |
| Sequence-based reagent | TBP Reverse | This paper | qPCR primers | ATT TTC TTG CTG CCA GTC TGG |
| Sequence-based reagent | LAMA1Enh Upstream Guide | This paper | CRISPR sgRNA | GTC AAA TTG CTA TAA CAC GG |
| Sequence-based reagent | LAMA1Enh Downstream Guide | This paper | CRISPR sgRNA | CCA CTT TAA GTA TCT CAG CA |
| Sequence-based reagent | CRB2Enh Upstream Guide | This paper | CRISPR sgRNA | ATA CAA AGC ACG TGA GA |
| Sequence-based reagent | CRB2Enh Downstream Guide | This paper | CRISPR sgRNA | GAA TGC GGA TGA CGC CTG AG |
| Sequence-based reagent | lama1-ATG | PMID:16321372 | Morpholino | TCA TCC TCA TCT CCA TCA TCG CTC A Obtained from GeneTools, LLC |
| Sequence-based reagent | crb2a-SP | PMID:16713951 | Morpholino | ACG TTG CCA GTA CCT GTG TAT CCT G Obtained from GeneTools, LLC |
| Sequence-based reagent | crb2b-SP | PMID:16713951 | Morpholino | TAA AGA TGT CCT ACC CAG CTT GAA C Obtained from GeneTools, LLC |
| Sequence-based reagent | standard control MO | N/A | Morpholino | CCT CTT ACC TCA GTT ACA ATT TAT A Obtained from GeneTools, LLC |
| Software, algorithm | Adobe Illustrator v 5.1 | http://www.adobe.com/products/illustrator.html | RRID:SCR_014198 | |
| Software, algorithm | Adobe Photoshop v 5.1 | http://www.adobe.com/products/photoshop.html | RRID:SCR_014199 | |
| Software, algorithm | BEDtools v 2.26.0 | https://github.com/arq5x/bedtools2 | RRID:SCR_006646 | |
| Software, algorithm | Bioconductor | https://www.bioconductor.org/ | RRID: SCR_006442 | |
| Software, algorithm | Burrows-Wheeler Aligner v 0.7.13 | http://bio-bwa.sourceforge.net/ | RRID:SCR_010910 | |
| Software, algorithm | CENTIPEDE v 1.2 | http://centipede.uchicago.edu/ | N/A | |
| Software, algorithm | Cufflinks v 2.2.1 | http://cole-trapnell-lab.github.io/cufflinks/ | RRID:SCR_014597 | |
| Software, algorithm | deepTools2 v 3.1.3 | https://deeptools.readthedocs.io/en/develop/content/installation.html | N/A | |
| Software, algorithm | DESeq2 v 3.10 | https://bioconductor.org/packages/release/bioc/html/DESeq2.html | RRID:SCR_015687 | |
| Software, algorithm | FlowJo v10 software | https://www.flowjo.com/solutions/flowjo | RRID: SCR_008520 | |
| Software, algorithm | GraphPad Prism v 8.1.2 | https://www.graphpad.com/scientific-software/prism/ | RRID: SCR_002798 | |
| Software, algorithm | HOMER v 4.10.4 | http://homer.ucsd.edu/homer/ | RRID: SCR_010881 | |
| Software, algorithm | Juicebox Tools v 1.4 | https://github.com/aidenlab/Juicebox/wiki/Juicebox-Assembly-Tools | N/A | |
| Software, algorithm | MACS2 v 2.1.4 | http://liulab.dfci.harvard.edu/MACS/ | RRID:SCR_013291 | |
| Software, algorithm | MEME suite v 5.1.1 | http://meme-suite.org/ | RRID:SCR_001783 | |
| Software, algorithm | Metascape | http://metscape.ncibi.org | RRID:SCR_014687 | |
| Software, algorithm | Picard Tools v 1.131 | http://broadinstitute.github.io/picard/ | RRID:SCR_006525 | |
| Software, algorithm | R Project for Statistical Computing v 3.6.1 | http://www.r-project.org/ | RRID:SCR_001905 | |
| Software, algorithm | SAMtools v 1.5 | http://samtools.sourceforge.net | RRID:SCR_002105 | |
| Software, algorithm | STAR v 2.4 | https://github.com/alexdobin/STAR | N/A | |
| Software, algorithm | UCSC Genome Browser | http://genome.ucsc.edu/ | RRID:SCR_005780 | |
| Software, algorithm | vcf2diploid v 0.2.6a | https://github.com/abyzovlab/vcf2diploid | N/A | |
| Software, algorithm | ZEISS ZEN Digital Imaging for Light Microscopy | http://www.zeiss.com/microscopy/en_us/products/microscope-software/zen.html#introduction | RRID:SCR_013672 |
Additional files
Download links
A two-part list of links to download the article, or parts of the article, in various formats.
Downloads (link to download the article as PDF)
Open citations (links to open the citations from this article in various online reference manager services)
Cite this article (links to download the citations from this article in formats compatible with various reference manager tools)
Pancreatic progenitor epigenome maps prioritize type 2 diabetes risk genes with roles in development
eLife 10:e59067.
https://doi.org/10.7554/eLife.59067


